

econstorMake Your Publications Visible.
A Service of
zbwLeibniz-InformationszentrumWirtschaftLeibniz Information Centrefor Economics
Findley, T. Scott
Working Paper
Hyperbolic Memory Discounting and the PoliticalBusiness Cycle
CESifo Working Paper, No. 5556
Provided in Cooperation with:Ifo Institute – Leibniz Institute for Economic Research at the University of Munich
Suggested Citation: Findley, T. Scott (2015) : Hyperbolic Memory Discounting and the PoliticalBusiness Cycle, CESifo Working Paper, No. 5556, Center for Economic Studies and ifo Institute(CESifo), Munich
This Version is available at:http://hdl.handle.net/10419/123213
Standard-Nutzungsbedingungen:
Die Dokumente auf EconStor dürfen zu eigenen wissenschaftlichenZwecken und zum Privatgebrauch gespeichert und kopiert werden.
Sie dürfen die Dokumente nicht für öffentliche oder kommerzielleZwecke vervielfältigen, öffentlich ausstellen, öffentlich zugänglichmachen, vertreiben oder anderweitig nutzen.
Sofern die Verfasser die Dokumente unter Open-Content-Lizenzen(insbesondere CC-Lizenzen) zur Verfügung gestellt haben sollten,gelten abweichend von diesen Nutzungsbedingungen die in der dortgenannten Lizenz gewährten Nutzungsrechte.
Terms of use:
Documents in EconStor may be saved and copied for yourpersonal and scholarly purposes.
You are not to copy documents for public or commercialpurposes, to exhibit the documents publicly, to make thempublicly available on the internet, or to distribute or otherwiseuse the documents in public.
If the documents have been made available under an OpenContent Licence (especially Creative Commons Licences), youmay exercise further usage rights as specified in the indicatedlicence.
www.econstor.eu
Hyperbolic Memory Discounting and the Political Business Cycle
T. Scott Findley
CESIFO WORKING PAPER NO. 5556 CATEGORY 2: PUBLIC CHOICE
OCTOBER 2015
An electronic version of the paper may be downloaded • from the SSRN website: www.SSRN.com • from the RePEc website: www.RePEc.org
• from the CESifo website: Twww.CESifo-group.org/wp T
ISSN 2364-1428
CESifo Working Paper No. 5556
Hyperbolic Memory Discounting and the Political Business Cycle
Abstract The vintage political business cycle framework of Nordhaus (1975) represents the idea that the macroeconomic business cycle is manipulated opportunistically by an incumbent government to achieve re-election. A key assumption in this prototypical framework is that voters discount their memories about unemployment and inflation at a constant rate. Yet starting with Ebbinghaus (1885) and Jost (1897), a large body of research in psychology documents an empirical regularity that has come to be known as Jost’s Second Law of Forgetting - individuals discount recent memories at a higher rate compared to the rate at which they discount older memories. I find that incorporating this insight from psychology (i.e., hyperbolic memory discounting) into the benchmark framework moderates the amplitude of the predicted political business cycle.
JEL-Code: D030, D720.
Keywords: hyperbolic memory discounting, Jost’s Second Law of Forgetting, political business cycle, inflation, unemployment.
T. Scott Findley Department of Economics and Finance Jon. M. Huntsman School of Business
Utah State University 3565 Old Main Hill
USA – Logan, UT 84322-3565 [email protected]
June 10, 2015

Given two associations [memories] of the same strength, but of di¤erent ages, the older fallso¤ less rapidly in a given length of time.
Jost�s Second Law of Forgetting
Adolf Jost (1897)Zeitschrift fuer Psychologie und Physiologie der Sinnesorgane
As translated and reported in Hovland (1951, p.649).
1 Introduction
Economists and political scientists have long been interested in studying and characterizing the
interdependence of political and macroeconomic outcomes. Indeed, the idea that recessions and
economic expansions might be politically induced was suggested by Kalecki (1943). However,
it was the study of Nordhaus (1975) that was the �rst to model and mathematically depict
an incumbent government that in�uences macroeconomic outcomes so that re-election can
be achieved. The main prediction of this vintage framework is that recessions and economic
expansions cycle around elections. More speci�cally, an incumbent government pursues policies
to keep in�ation low at the sacri�ce of high unemployment during the early part of an electoral
term. As time progresses during the term in o¢ ce, in�ationary policies are implemented so that
the unemployment rate falls to acceptable levels before the pending date of re-election. This
process repeats itself when the newly re-elected incumbent implements contractionary policies
to keep in�ation in check, resulting in high unemployment rates once again.1 The reason why
these outcomes are pursued is because the incumbent government faces retrospective voters who
discount their memories about past macroeconomic outcomes, such that high unemployment
and low in�ation are viewed by voters at election date as being much more costly if they were
experienced in the recent past relative to the distant past.2
Due to the provocative prediction that opportunistic governments might be responsible for
instigating economic �uctuations, the study of Nordhaus (1975) triggered a large ongoing e¤ort
to examine the assumptions of and/or to test the predictions of this prototypical framework.3
1This framework is agnostic about the channel through which the business cycle is manipulated, meaningthat the incumbent could just as well be using �scal/budget policy as monetary policy to induce the businesscycle. Indeed, the control and state variables in the model are the unemployment and in�ation rates respectively,without any background assumption regarding the source of policy. The incumbent is constrained by a short-runtradeo¤ between in�ation and unemployment, and it is well-known that expansions or contractions in eithermonetary or �scal/budget policy can lead to movements along a short-run Phillips Curve as long as expectationsdo not adjust immediately.
2Fiorina (1981) provides an in-depth discussion of the underlying mechanisms of retrospective voting.3See Snowdon (1997) for a survey.
2
Several of the assumptions in the model have been considered questionable at some point in
time or another since it was published, yet subsequent research appears to be �nding empirical
support for many of these assumptions.4 Nevertheless, one feature that has not been examined
very thoroughly in this sizable literature is the role of memory discounting. A key assumption
in the vintage framework is that voters discount their memories exponentially about the pain
from unemployment and in�ation. Now at �rst glance it might appear obvious and trivial
that an opportunistic incumbent will have more reason to manipulate the business cycle if
voters remember less and less about the past. However, the assumption of exponential memory
discounting is tenuous regardless of the speci�c magnitude of memory discounting, given that a
long-standing body of research in psychology concludes that individuals discount their memories
in a hyperbolic fashion, meaning that individuals discount recent memories at a higher rate
compared to the rate at which they discount older memories. Indeed, beginning with the
�ndings of Ebbinghaus (1885) that were extended by Jost (1897) and many others since, the
behavioral phenomenon of hyperbolic memory discounting has been widely documented and
has come to be recognized as Jost�s Second Law of Forgetting in the �eld of psychology (e.g.,
Wixted and Ebbesen 1991; Rubin and Wenzel 1996; Alin 1997; Wixted 2004; Yi, Gatchalian,
and Bickel 2006; Rachlin 2006; Brown, Neath, and Chater 2007; Yi, Landes, and Bickel 2009;
Averell and Heathcote 2011).5
This paper has a very targeted focus� to demonstrate how the �ndings in psychology on
hyperbolic memory discounting can a¤ect the predictions of the vintage political business cy-
cle model.6 Now one might conjecture a priori that an opportunistic incumbent will have a
4For example, the idea that people could be backward-looking when voting was deemed unpalatable fromthe perspective of the �rational expectations� paradigm. However, much of the latest research in politicalscience and psychology suggests that retrospective voting behavior is much more empirically plausible thanpreviously supposed (e.g., Francis, Kenny, Morton, and Schmidt 1994; Lanoue 1994; Williams 1994; Kiewiet andUdell 1998; Anderson 2000; Nadeau and Lewis-Beck 2001; Söderlund 2008; Campbell, Dettrey, and Yin 2010).Mueller (2003) reports that retrospective voting over economic outcomes is a robust empirical phenomenon. SeeMurakami (2008) for a survey of the evidence on the pervasiveness of retrospective voting in US presidentialelections, US congressional elections, US gubernatorial elections, and elections in other countries.
5Although the speci�c functional form often di¤ers from one psychology study to the next (e.g., �power-law�,�exponential-power�, �hyperbolic-log�, �hyperbolic-power�), what I am characterizing as �hyperbolic discounting�is the entire class of memory discount functions that exhibit a declining discount rate in the retrospective delay.More precisely, given a memory discount function in general form M(x) for a delay of x, the discount rate isthe proportional rate of decline in the function, m(x) � �d ln[M(x)]=dx, and I am labeling any function as�hyperbolic�if it exhibits the property of dm(x)=dx < 0, which re�ects Jost�s Second Law of Forgetting.
6It would also be of interest to examine the impact of hyperbolic discounting on partisan political businesscycles, rational political business cycles, and political budget cycles. Yet, in this paper I focus on the vintagepolitical business cycle framework of Nordhaus (1975) because its setup, motivating assumptions, and baselinepredictions are generally well-known. And in the set of possible political business cycle models that couldbe re-visited, it is very natural to start with the �rst one, which is still being re-examined and tested (e.g.,García-Sanchez, Mordán, and Cuadrado-Ballesteros 2014; Vásquez-Ruíz, Rivas, and Díaz 2014; Basak, Ghosh,and Mukherjee 2015).
3
stronger incentive to manipulate the business cycle if voters forget the recent past relatively
more quickly, as is the case with hyperbolic discounting compared to exponential discounting.
However, hyperbolic memory discounting also implies that voters forget the distant past at a
relatively lower rate compared to exponential discounting. I �nd that the way in which voters
discount the past is of �rst-order importance to the predictions of the model. More speci�cally,
I �nd both analytically and numerically that the amplitude of the predicted business cycle
is moderated in both the in�ation and the unemployment dimensions, relative to the case of
exponential discounting. For example, in basic numerical exercises the predicted amplitude
of the unemployment rate ranges between 2.7 and 2.9 percentage points for the entire range
of discounting magnitudes (low, moderate, high) under the best-�tting hyperbolic functional
form. This stands in sharp contrast to the predicted peak-to-trough amplitudes of the unem-
ployment rate for the same range of discounting magnitudes under exponential discounting: the
amplitude is around 7 percentage points (cycles between 11 percent and 4 percent every four
years) at low discounting magnitudes, 26 percentage points (cycles between 30 percent and 4
percent) at moderate magnitudes, and 91 percentage points (cycles between 95 percent and 4
percent) at high magnitudes.7 Conditional on the form of the penalty-vote function used in
the benchmark framework, these predicted outcomes result from the fact that it is not nearly
as easy for an incumbent government to exploit retrospective voters whose recent memories
decay quickly but whose older memories decay slowly. Alternatively stated, an opportunistic
incumbent cannot get away with nearly as much manipulation during the early part of an elec-
toral term if voters remember relatively more about economic outcomes in that early part of
the term under hyperbolic memory discounting.8
In the context of the existing literature on opportunistic political business cycles, these
�ndings could be interpreted in some di¤erent ways. Although one could justi�ably view the
numerical predictions of the vintage framework with a heavy dose of skepticism given its stylized
assumptions, one interpretation is that this framework might have more to o¤er in providing
some basic insight into macroeconomic �uctuations than has been supposed previously. This is
7Nordhaus (1975) assumed that the exponential memory discount rate was 3 percent per annum in theoriginal study. Yet, some subsequent empirical research �nds that the exponential discount rates of voters rangebetween 50 and 144 percent per annum (e.g., Hibbs and Vasilatos 1981, 1982; Hibbs, Rivers, and Vasilatos 1982;Chappell 1983; Hibbs 1987).
8Beginning with �ndings by Herrnstein (1961), Rachlin and Green (1972), Ainslie (1975) and many others,a parallel body of research independently �nds evidence of hyperbolic discounting over future delays. Suchforward-looking hyperbolic discounting has been used to represent various phenomena such as impulsivity, self-control failure, and procrastination, since it generates time-inconsistent decision making (Strotz 1956; Laibson1997, 1998). Now it is certainly the case that voters are time-inconsistent in their valuation of past in�ationand unemployment in the current model with hyperbolic memory discounting. Yet, all that really matters tothe incumbent government�s decision making is how voters feel about past unemployment and in�ation fromthe perspective of the election date when they actually vote. As such, decision making by the incumbent istime-consistent in the model.
4
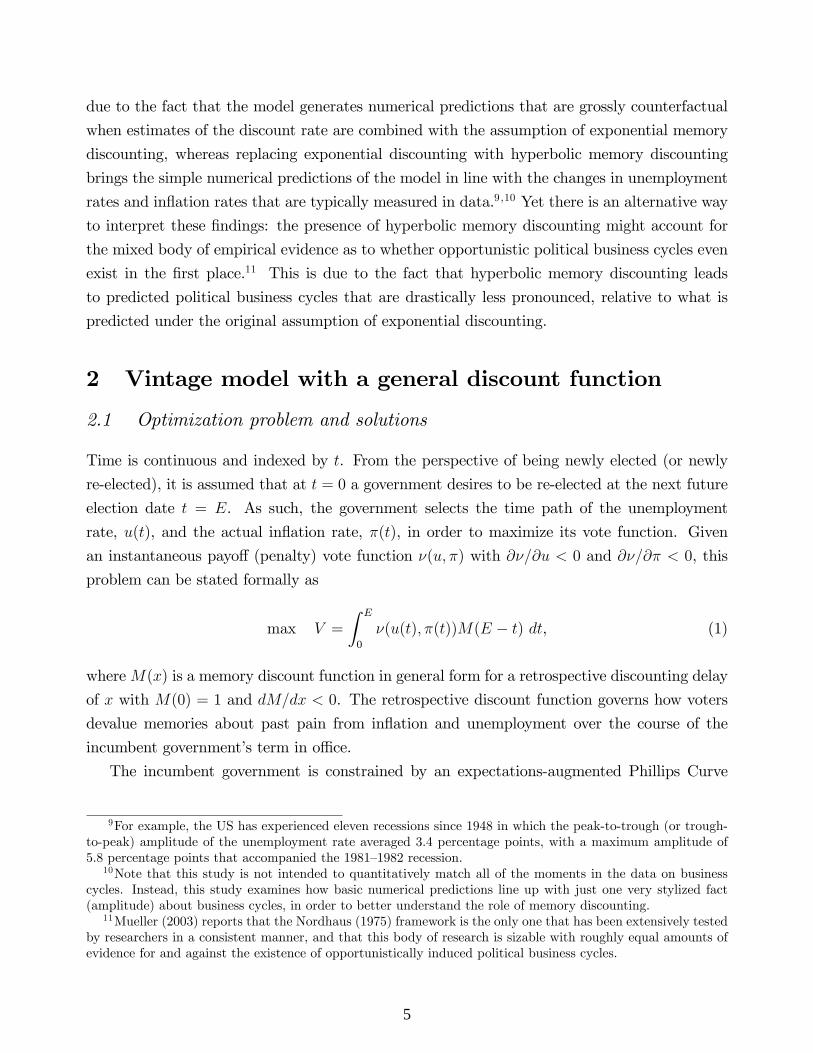
due to the fact that the model generates numerical predictions that are grossly counterfactual
when estimates of the discount rate are combined with the assumption of exponential memory
discounting, whereas replacing exponential discounting with hyperbolic memory discounting
brings the simple numerical predictions of the model in line with the changes in unemployment
rates and in�ation rates that are typically measured in data.9 ;10 Yet there is an alternative way
to interpret these �ndings: the presence of hyperbolic memory discounting might account for
the mixed body of empirical evidence as to whether opportunistic political business cycles even
exist in the �rst place.11 This is due to the fact that hyperbolic memory discounting leads
to predicted political business cycles that are drastically less pronounced, relative to what is
predicted under the original assumption of exponential discounting.
2 Vintage model with a general discount function
2.1 Optimization problem and solutions
Time is continuous and indexed by t. From the perspective of being newly elected (or newly
re-elected), it is assumed that at t = 0 a government desires to be re-elected at the next future
election date t = E. As such, the government selects the time path of the unemployment
rate, u(t), and the actual in�ation rate, �(t), in order to maximize its vote function. Given
an instantaneous payo¤ (penalty) vote function �(u; �) with @�=@u < 0 and @�=@� < 0, this
problem can be stated formally as
max V =
Z E
0
�(u(t); �(t))M(E � t) dt, (1)
whereM(x) is a memory discount function in general form for a retrospective discounting delay
of x with M(0) = 1 and dM=dx < 0. The retrospective discount function governs how voters
devalue memories about past pain from in�ation and unemployment over the course of the
incumbent government�s term in o¢ ce.
The incumbent government is constrained by an expectations-augmented Phillips Curve
9For example, the US has experienced eleven recessions since 1948 in which the peak-to-trough (or trough-to-peak) amplitude of the unemployment rate averaged 3.4 percentage points, with a maximum amplitude of5.8 percentage points that accompanied the 1981�1982 recession.
10Note that this study is not intended to quantitatively match all of the moments in the data on businesscycles. Instead, this study examines how basic numerical predictions line up with just one very stylized fact(amplitude) about business cycles, in order to better understand the role of memory discounting.
11Mueller (2003) reports that the Nordhaus (1975) framework is the only one that has been extensively testedby researchers in a consistent manner, and that this body of research is sizable with roughly equal amounts ofevidence for and against the existence of opportunistically induced political business cycles.
5

relationship
�(t) = '(u(t)) + "(t). (2)
The parameter 2 (0; 1] is the proportion by which expected in�ation materializes into actualin�ation.12 Note that d'=du < 0 and also note that the expected rate of in�ation "(t) evolves
adaptively in the vintage framework
d"(t)
dt= [�(t)� "(t)], for t 2 [0; E] , (3)
"(0) given, (4)
"(E) free. (5)
Equation (3) represents the idea that revisions to the expected in�ation rate are proportional
to the forecast error by > 0. Therefore, can be considered the speed of adaptation or
adjustment in in�ation expectations.13 ;14
As in the original framework, the following functional forms are used to solve the model
explicitly
�(u; �) = �u(t)2 � ��(t), (6)
'(u) = �� �u(t), (7)
where � > 0 governs the intensity with which in�ation enters the penalty function and where
� > 0 is the slope of and � > 0 a¤ects the intercepts of the short-run and long-run Phillips
Curves. Note that when " = � given = 1, the long-run natural rate of unemployment is
identi�ed. This is equal to �=� for the functional forms speci�ed in (2) and (7). Note also that
@�=@u < 0 and @�=@� < 0 given (6). With the appropriate substitutions, the Hamiltonian is
12The parameter determines whether or not a tradeo¤ exists between in�ation and unemployment in thelong run, wherein d"=dt = 0 and " = � by (3). In this case the Phillips Curve becomes � = (1 � )�1 � '(u)with slope (1 � )�1 � d'=du. The Phillips Curve is vertical in the long run if = 1. But if < 1, then atradeo¤ exists in the long run given that d'=du < 0.
13Burmeister and Turnovsky (1976) outline some caveats concerning the speci�cation of adaptive expectationsin continuous-time settings.
14The proposition of adaptive in�ation expectations was dismissed for the most part with the �rationalexpectations�revolution. However, recent research suggests that adaptive expectations about in�ation mightbe much more tenable in many settings than the idea that in�ation expectations are formed rationally byvoters, especially when the true data generating process is unknown (e.g., Suzuki 1991; Haller and Norpoth1994; Hey 1994; Sargent 1999; Evans and Honkapohja 2001; Agliari, Chiarella, and Gardini 2006). Muth(1960) demonstrated that adaptive expectations and rational expectations are the same if the data generatingprocess follows a random walk. See Shepherd (2012) and Sorge (2013) for a generalization in which adaptiveexpectations can be considered rational since it can produce minimized forecast errors.
6
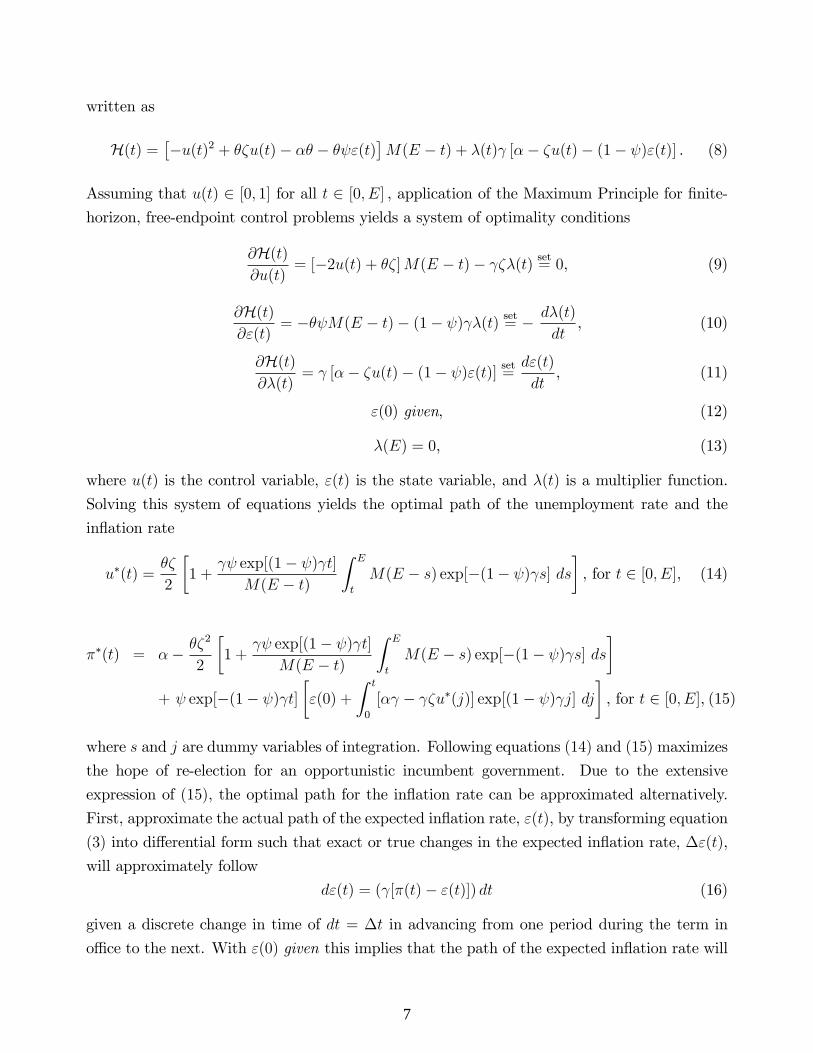
written as
H(t) =��u(t)2 + ��u(t)� �� � � "(t)
�M(E � t) + �(t) [�� �u(t)� (1� )"(t)] . (8)
Assuming that u(t) 2 [0; 1] for all t 2 [0; E] , application of the Maximum Principle for �nite-
horizon, free-endpoint control problems yields a system of optimality conditions
@H(t)@u(t)
= [�2u(t) + ��]M(E � t)� ��(t)set= 0, (9)
@H(t)@"(t)
= �� M(E � t)� (1� ) �(t)set= � d�(t)
dt, (10)
@H(t)@�(t)
= [�� �u(t)� (1� )"(t)]set=d"(t)
dt, (11)
"(0) given, (12)
�(E) = 0, (13)
where u(t) is the control variable, "(t) is the state variable, and �(t) is a multiplier function.
Solving this system of equations yields the optimal path of the unemployment rate and the
in�ation rate
u�(t) =��
2
�1 +
exp[(1� ) t]
M(E � t)
Z E
t
M(E � s) exp[�(1� ) s] ds
�, for t 2 [0; E], (14)
��(t) = �� ��2
2
�1 +
exp[(1� ) t]
M(E � t)
Z E
t
M(E � s) exp[�(1� ) s] ds
�+ exp[�(1� ) t]
�"(0) +
Z t
0
[� � �u�(j)] exp[(1� ) j] dj
�, for t 2 [0; E], (15)
where s and j are dummy variables of integration. Following equations (14) and (15) maximizes
the hope of re-election for an opportunistic incumbent government. Due to the extensive
expression of (15), the optimal path for the in�ation rate can be approximated alternatively.
First, approximate the actual path of the expected in�ation rate, "(t), by transforming equation
(3) into di¤erential form such that exact or true changes in the expected in�ation rate, �"(t),
will approximately follow
d"(t) = ( [�(t)� "(t)]) dt (16)
given a discrete change in time of dt = �t in advancing from one period during the term in
o¢ ce to the next. With "(0) given this implies that the path of the expected in�ation rate will
7
follow
"(t+ dt) = "(t) + �"(t)
� "(t) + d"(t)
= "(t) + ( [�(t)� "(t)]) dt (17)
for all t 2 [0; E], remembering that the approximation becomes more precise as dt! 0. Lastly,
insert (14) and (17) into (2) to approximate (15).
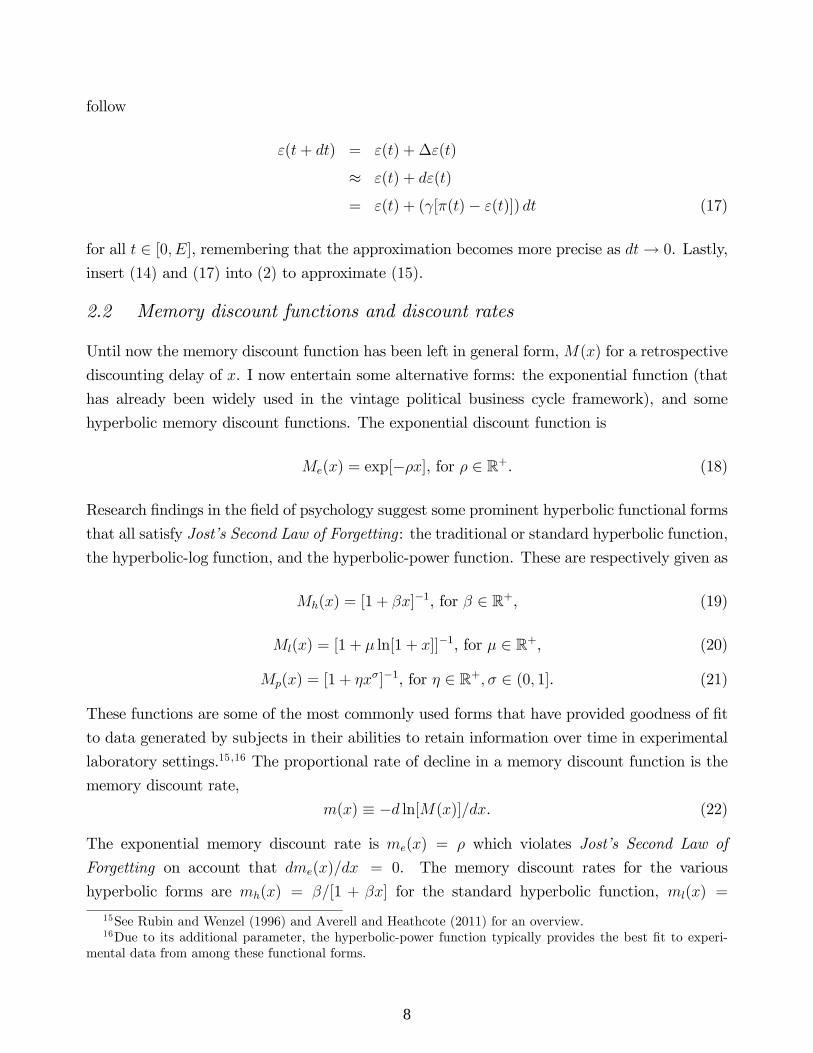
2.2 Memory discount functions and discount rates
Until now the memory discount function has been left in general form,M(x) for a retrospective
discounting delay of x. I now entertain some alternative forms: the exponential function (that
has already been widely used in the vintage political business cycle framework), and some
hyperbolic memory discount functions. The exponential discount function is
Me(x) = exp[��x], for � 2 R+. (18)
Research �ndings in the �eld of psychology suggest some prominent hyperbolic functional forms
that all satisfy Jost�s Second Law of Forgetting: the traditional or standard hyperbolic function,
the hyperbolic-log function, and the hyperbolic-power function. These are respectively given as
Mh(x) = [1 + �x]�1, for � 2 R+, (19)
Ml(x) = [1 + � ln[1 + x]]�1, for � 2 R+, (20)
Mp(x) = [1 + �x�]�1, for � 2 R+; � 2 (0; 1]. (21)
These functions are some of the most commonly used forms that have provided goodness of �t
to data generated by subjects in their abilities to retain information over time in experimental
laboratory settings.15 ;16 The proportional rate of decline in a memory discount function is the
memory discount rate,
m(x) � �d ln[M(x)]=dx. (22)
The exponential memory discount rate is me(x) = � which violates Jost�s Second Law of
Forgetting on account that dme(x)=dx = 0. The memory discount rates for the various
hyperbolic forms are mh(x) = �=[1 + �x] for the standard hyperbolic function, ml(x) =
15See Rubin and Wenzel (1996) and Averell and Heathcote (2011) for an overview.16Due to its additional parameter, the hyperbolic-power function typically provides the best �t to experi-
mental data from among these functional forms.
8
�=[(1 + x)(1 + � ln[1 + x])] for the hyperbolic-log function, and mp(x) = [��x��1]=[1 + �x�]
for the hyperbolic-power function. These alternative hyperbolic functions all satisfy Jost�s
Second Law of Forgetting since dmi(x)=dx < 0 with i 2 fh; l; pg.17
A challenge exists when comparing how the predictions of a model change when di¤erent
memory discount functions are used. Namely, alternative discount functions have di¤erent rates
of decline (slope e¤ects) in addition to potentially having di¤erent levels of overall discounting.
As mentioned above, the idea that recent memories decay at a much higher rate than the rate
at which older memories decay (Jost�s Second Law of Forgetting) is tied to the fact that the
memory discount rate decreases in the delay (i.e., dm(x)=dx < 0) and is not directly related
to the overall level of discounting. Given that the research objective is to study how the form
of the memory discount function a¤ects the predictions of the vintage political business cycle
framework, it is imperative to control for di¤erences in overall levels of memory discounting at
moments of decision making, so that the slope e¤ects of discounting can be properly identi�ed.
For a given memory discount function, a theoretically neutral measure of the overall level of
discounting is the area that is below a line at unity yet above the discount function (Myerson,
Green, and Warusawitharana 2001; Myerson, Green, Hanson, Holt, and Estle 2003; Myerson
and Green 2004). Following Caliendo and Findley (2014), this area can be mathematically
de�ned as �(t) �R Et[1 �M(E � s)]ds = E � t � A(t) from the perspective of any arbitrary
t 2 [0; E] where E � s is the retrospective delay and A(t) �R EtM(E � s)ds is the area under
the memory discount function. This represents the cumulative discounting of a �ow of past
memories over a retrospective horizon. Since the area under a discount function is inversely
proportional to the overall level of discounted memories (i.e., @�(t)=@A(t) = �1), controllingfor di¤erences in overall levels of memory discounting can be operationalized by equalizing the
areas under di¤erent discount functions at the moment of decision making in the model (t = 0),
meaning Ae(0) = Ai(0) with i 2 fh; l; pg.I therefore discipline the parameters of the hyperbolic memory discount functions (�, � ,
and � with � = 0:33) by numerically solving
minf�;�;�g
( Xi=h;l;p
�Z E
0
Me(E � t)dt�Z E
0
Mi(E � t)dt
�2), (23)
for a given value of the exponential discount rate, �. This procedure equalizes the areas under
each of the four discount functions, thus controlling for di¤erences in overall levels of discounted
memories. What remains are the e¤ects of how memories decay in the retrospective delay. I
17The restriction of � 2 (0; 1] is necessary and su¢ cient for the hyperbolic-power discount function to beconsistent with Jost�s Second Law of Forgetting. It should be noted that the hyperbolic-power function takeson the standard hyperbolic form if � = 1.
9

assume � = 0:50, � = 0:95, and � = 1:35 to depict �low�, �moderate�, and �high�rates of memory
discounting. These values all fall within the range of some empirical estimates for the rate at
which voters exponentially discount their past memories about political and macroeconomic
outcomes (e.g., Hibbs and Vasilatos 1981, 1982; Hibbs, Rivers, and Vasilatos 1982; Chappell
1983; Hibbs 1987).18 ;19 Parameterizing the alternative memory discount functions with (23) to
control for di¤erences in overall levels of discounting generates the following discount function
parameters: (i) � = 0:86, � = 1:52, and � = 1:16 if � = 0:50, which is labeled the case of
�low discounting�; (ii) � = 2:23, � = 3:68, and � = 2:60 if � = 0:95, which is labeled the case
of �moderate discounting�; and, (iii) � = 3:77, � = 5:98, and � = 4:04 if � = 1:35, which is
labeled the case of �high discounting�. The memory discount functions for these three cases are
depicted in Figure 1, Figure 5, and Figure 9, respectively. It is clear from these three �gures
that the areas under all four discount functions are the same, even though the functions have
di¤erent proportional rates of decline.
2.3 Some basic analytical �ndings
Before turning to numerical exercises, here I provide some analytical insight into the e¤ects
of hyperbolic memory discounting on the predictions of the vintage political business cycle
framework. First, it should be mentioned that in the case of exponential memory discounting
Nordhaus (1975) documented du�(t)=dt < 0 for t 2 [0; E). It is straightforward to show from(14) that this continues to hold for any speci�cation of the memory discount function. Second,
the unemployment rate that immediately precedes an election is denoted as
limt!E
fu�(t)g = ��
2. (24)
This means that the predicted unemployment rate converges to the same value by the date of
re-election regardless of the form of the memory discount function.
Lastly, the predicted unemployment rate under hyperbolic memory discounting is strictly
lower than the unemployment rate under exponential discounting over the time interval [0; �ti]
with i 2 fh; l; pg, and it is also possible, perhaps even likely, that the unemployment rate islower under hyperbolic memory discounting for some of the interval (�ti; E) with i 2 fh; l; pg,where �ti 2 (0; E) is the unique date at which each of the hyperbolic memory discount functions
18Estimates for the exponential memory discount rate of voters typically range between 50 and 144 percentper annum. However, Hibbs and Vasilatos (1982) also report that the discount rate might be as high as 4700percent per annum for voters in the United Kingdom who are unskilled or semi-skilled workers.
19Fair (1978) reports that the memory discount rate of a typical voter is a very high number that might evenapproach in�nity. This would suggest that voters might not be retrospective at all when voting. Yet despitethis incredibly high estimate, Fair still asserts that voters do pay attention to economic outcomes within theyear that immediately precedes an election.
10
respectively intersect the exponential function only once (see Figure 1, Figure 5, and Figure
9). To demonstrate this analytically, I set = 1 for convenience which means that there is no
long-run tradeo¤ between in�ation and unemployment in the model (see Footnote 12).20 For
the cases of exponential and hyperbolic memory discounting, (14) becomes
u�e(t) =��
2
�1 +
Me(E � t)Ae(t)
�, for t 2 [0; E], (25)
u�i (t) =��
2
�1 +
Mi(E � t)Ai(t)
�, for t 2 [0; E] with i 2 fh; l; pg, (26)
remembering that A(t) is the area under a memory discount function. To isolate the slope e¤ects
from the alternative forms of memory discounting, the areas under each respective discount
function need to be equalized at the moment of decision making, Ae(0) = Ai(0) with i 2 fh; l; pg.At t = 0, (25) and (26) can therefore be written as
u�e(0) =��
2
�1 +
Me(E)Ae(0)
�, (27)
u�i (0) =��
2
�1 +
Mi(E)Ai(0)
�, with i 2 fh; l; pg, (28)
where it is clear to see that u�e(0) > u�i (0), since Me(E) < Mi(E) with i 2 fh; l; pg. Thus,u�e(0) > u�i (0) and u�e(E) = u�i (E) with i 2 fh; l; pg from (24). But how does hyperbolic
memory discounting a¤ect the unemployment rate over the interval t 2 (0; E)?It should be noted that if Ae(0) = Ai(0) with i 2 fh; l; pg to perform a controlled comparison
of discount functions, then it is the case mathematically that Ae(t) > Ai(t) for all t 2 (0; E),recognizing that Ae(t)! 0 and Ai(t)! 0 with i 2 fh; l; pg as t! E. This is an unambiguous
force for the unemployment rate under hyperbolic discounting to be strictly less than the
unemployment rate under exponential discounting for t 2 (0; E). Therefore, all that remains tobe determined is the relative heights of the alternative discount functions, meaning isMe(E�t)greater than, equal to, or less than Mi(E � t) with i 2 fh; l; pg over the interval t 2 (0; E)?On account that Ae(0) = Ai(0) with i 2 fh; l; pg to perform a controlled comparison, there
exists a unique date �ti 2 (0; E) at which each one of the hyperbolic discount functions intersectsthe exponential discount function only once (again see Figure 1, Figure 5, and Figure 9). As
such, Me(E � �ti) =Mi(E � �ti) with i 2 fh; l; pg at the unique date of intersection, �ti 2 (0; E).Moreover, it follows that Me(E � t) < Mi(E � t) for t 2 [0; �ti), and Me(E � t) > Mi(E � t)
with i 2 fh; l; pg for all t 2 (�ti; E). Therefore, it is unambiguously the case that u�e(t) > u�i (t)
with i 2 fh; l; pg for all t 2 [0; �ti], since Me(E � t) � Mi(E � t) for t 2 [0; �ti] reinforces
20Gordon (1997) provides an overview of the evidence that the long-run Phillips Curve is likely vertical.
11

Ae(t) > Ai(t) for t 2 (0; E). Whether or not u�e(t) > u�i (t) for t 2 (�ti; E) is a quantitativequestion since Me(E� t) > Mi(E� t) for t 2 (�ti; E) is a counterforce on Ae(t) > Ai(t) over the
interval. In sum, the predicted unemployment rate under hyperbolic memory discounting will
be unambiguously lower than the unemployment rate under exponential discounting during the
�rst part of an electoral term, meaning for t 2 [0; �ti]. And it is also quantitatively possible,perhaps even likely, that the unemployment rate is lower under hyperbolic discounting for much
of the interval (�ti; E) as well.
3 Numerical exercises
3.1 Parameter values and calibration
I set E = 4 to re�ect a term in o¢ ce of four years. The speed of adjustment in in�ation
expectations is set to = 0:14. This is lower than the value used in Nordhaus (1975) because
higher values for lead to predicted unemployment rates that exceed 100 percent (which
invalidates the solutions to the optimal control problem) given the range of empirical estimates
for the exponential discount rate. I normalize ��p(0) = 0:03 by calibrating the initial condition
on in�ation expectations, "(0). However, this is an innocuous exercise since this only sets the
level of the in�ation rate for expositional purposes and it does not have any material a¤ect on its
amplitude. Following the analytical section above, the proportion by which expected in�ation
a¤ects actual in�ation is set to = 1. This means that the long-run Phillips Curve is vertical
at the natural rate of unemployment in the model. Yet, this assumption also is innocuous since
the �ndings are generally robust to a long-run Phillips Curve that is negatively sloped.21
Common estimates for the slope coe¢ cient of the short-run Phillips Curve range between
0.3 to 0.9 (e.g., Staiger, Stock, and Watson 1997; King and Morley 2007; Lee and Nelson 2007).
I entertain the midpoint on this range for the slope parameter: � = 0:6. As noted by (24), the
unemployment rate that immediately precedes an election is ��=2. This is used to calibrate
the unobservable parameter, �, given the above-mentioned midpoint value for the slope of the
short-run Phillips Curve. The average unemployment rate in the month of October prior to
presidential elections in the US since 1948 is around 4 percent. Using this target gives � = 0:133
if � = 0:6. A value of � = 0:03 generates a natural rate of unemployment in the model that is
equal to 5 percent given = 1 and given the numerical value of � = 0:6 outlined above.22
3.2 Low discounting: Numerical examples and discussion21I �nd that the predicted in�ation cycle can be eliminated and sometimes it can even be slightly inverted
at parameterizations in which there is a long-run tradeo¤ between in�ation and unemployment in the model.22This value for the natural rate of unemployment is consistent with estimates for the US economy (Staiger,
Stock, and Watson 1997; Salemi 1999; King and Morley 2007).
12

Recall that (23) is used to select the parameters for each of the hyperbolic discount functions
given a particular value of �. This controls for di¤erences in total memories discounted across
all of the alternative discount functions. For the case of � = 0:50 labeled as �low discounting�,
this procedure generates the following hyperbolic discount function parameters: � = 0:86,
� = 1:52, and � = 1:16 with � = 0:33. Recall that a value of � = 0:50 is at the lower bound of
empirical estimates (50 percent to 144 percent per annum) for the rate of exponential memory
discounting over political-economic outcomes (e.g., Hibbs and Vasilatos 1981, 1982; Hibbs,
Rivers, and Vasilatos 1982; Chappell 1983; Hibbs 1987). The alternative memory discount
functions are each depicted in Figure 1 for this parameterization. It is straightforward to see
that each of the hyperbolic memory discount functions have higher rates of decline over shorter
retrospective delays (relative to the exponential discount function), yet lower rates of decline
over longer retrospective delays.
The time paths of the unemployment rate and the in�ation rate corresponding to each of
the alternative memory discount functions are depicted in Figures 2 and 3 for the duration of
one electoral term (i.e., E = 4). As described in Nordhaus (1975), the cyclical �uctuations
in the predicted unemployment rate and the predicted in�ation rate are constructed in the
model over the span of multiple electoral terms. As discussed in the analytical section above,
the unemployment rate falls over the course of a term in o¢ ce for each of the di¤erent cases
of memory discounting. Moreover, the time paths of the unemployment rate all converge to
4 percent by the date of re-election, as also outlined above. Yet, there are several additional
things to note from Figure 2. First, the model-generated natural rate of unemployment has
been inserted as a benchmark of comparison. This suggests that the opportunistic incumbent
government in the model pushes the economy above full employment by the date of re-election.
Second, the average unemployment rate over the course of a term in o¢ ce is 6.5 percent, 5.9
percent, 5.6 percent, and 5.3 percent for the exponential, standard hyperbolic, hyperbolic-log,
and hyperbolic-power functions, respectively. All of these predicted averages are reasonably
close to the average unemployment rate of 5.8 percent in the US since 1948. However, it is
important to recall that these predicted averages actually follow from the calibration procedure
(outlined above) in which a numerical value for the unobservable parameter � is selected such
that the pre-election unemployment rate is equal to 4 percent regardless of the form of the
memory discount function. Other pre-election unemployment rates could have been targeted
alternatively, which would lead to di¤erent predicted averages that could match the average
unemployment rates in other economies.
Lastly, the peak-to-trough amplitude of the unemployment rate is 7.2 percentage points
for the case of exponential discounting, while the amplitudes are 4.3 percentage points, 3.3
percentage points, and 2.7 percentage points for the standard hyperbolic, hyperbolic-log, and
13

hyperbolic-power functions respectively. Since 1948 the US has experienced eleven recessions
in which the peak-to-trough (or trough-to-peak) amplitude of the unemployment rate averaged
3.4 percentage points, with a maximum amplitude of 5.8 percentage points that accompanied
the 1981�1982 recession. The predicted amplitude of 7.2 percentage points for the case of
exponential discounting exceeds the largest amplitude ever experienced in the US since 1948,
while the predicted amplitudes for the alternative cases of hyperbolic discounting are fairly close
to the average amplitude and below the largest amplitude experienced over this time frame.
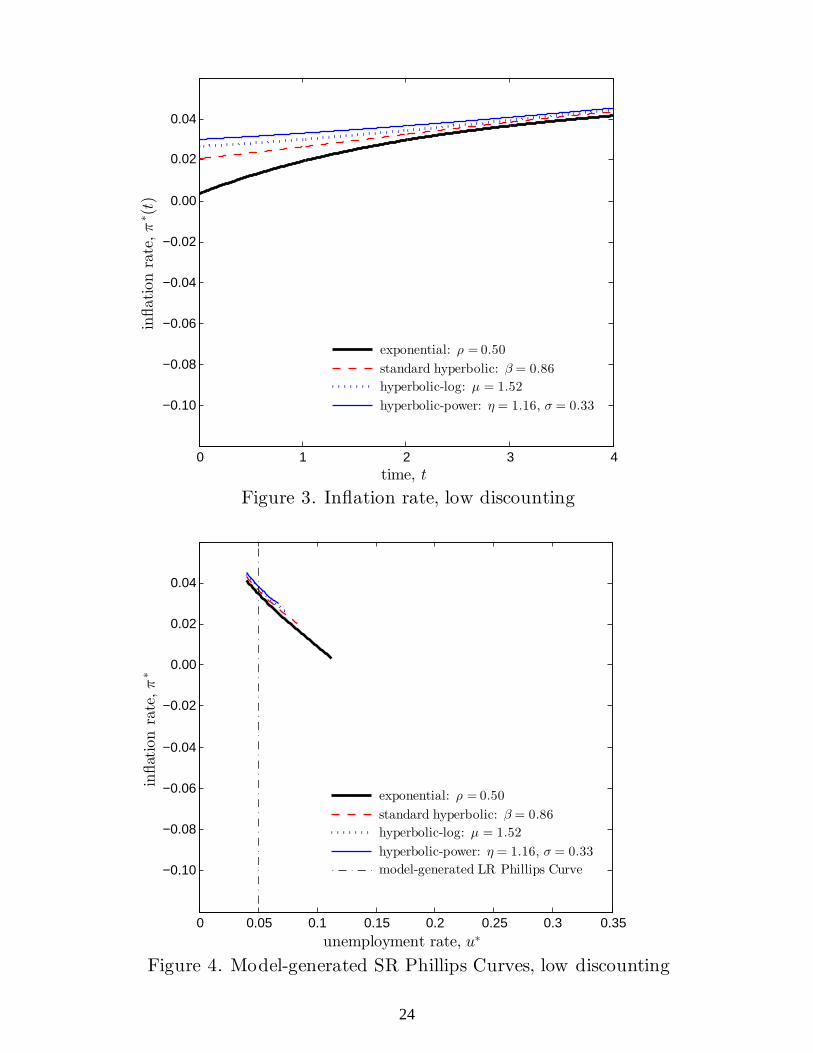
Figure 3 documents how the predicted in�ation rate is a¤ected by hyperbolic discounting.
Given that the incumbent is constrained by a tradeo¤ between unemployment and in�ation,
the in�ation rate rises over the duration of an electoral term given that the unemployment rate
is falling. What is of interest in Figure 3 is the fact that the amplitude of the predicted in�ation
rate is moderated with a relative bias in the level of the in�ation rate.
Figure 4 depicts the model-generated short-run Phillips Curves and the model-generated
long-run Phillips Curve. At the beginning of an electoral term, the incumbent government
starts at the most south-easterly point on a short-run Phillips Curve where the unemployment
rate is relatively high but the in�ation rate is relatively low. As time advances over the course
of an electoral term, the economy travels up the short-run Phillips Curve in the north-westerly
direction such that the unemployment rate is relatively low and the in�ation rate is relatively
high by the pending date of re-election. After being re-elected the incumbent government
enacts policies to immediately reduce the in�ation rate such that this process repeats itself.23
The moderation of the political business cycle under hyperbolic memory discounting is readily
visible in Figure 4, wherein the lengths of the model-generated short-run Phillips Curves are
signi�cantly shorter compared to the case of exponential discounting. Alternatively stated, the
distance traveled in the in�ation-unemployment policy space by an incumbent government is
relatively smaller over the course of a four-year electoral term. This is due to the fact that voters
remember relatively more about the pain of high unemployment over longer discounting delays
(the hyperbolic memory discount functions are decaying more slowly than the exponential
function), such that the incumbent government cannot get away with nearly as much policy
manipulation during the early part of an electoral term.
3.3 Moderate discounting: Numerical examples and discussion
When � = 0:95 the implementation of (23) generates the following discounting parameters:
� = 2:23, � = 3:68, and � = 2:60 with � = 0:33. This is labeled the case of �moderate
23As outlined in Nordhaus (1975), the ability to immediately reduce the in�ation rate (thereby raisingthe unemployment rate) follows from the simplifying assumption in the vintage model that the incumbentgovernment has instantaneous control over policy instruments and economic outcomes. The introduction of lagsbetween the implementation of policies and outcomes would serve to smooth this process.
14

discounting�. The memory discount functions are depicted in Figure 5 for these parameter
values. Again, a retrospective voter recalls less during the year or so that immediately precedes
an election if the voter hyperbolically discounts past outcomes, relative to an otherwise identical
voter who exponentially discounts the past. Yet, over longer retrospective delays, for example
between two to four years preceding an election, a voter remembers more under hyperbolic
discounting than compared to exponential discounting. Recall that this again re�ects Jost�s
Second Law of Forgetting.
Figure 6 depicts the time paths of the predicted unemployment rate over the course of one
electoral term. Remember that cyclical �uctuations exist over the span of multiple electoral
terms in this framework. It can be seen in Figure 6 that the incumbent government keeps the
economy well below full employment (the model-generated natural rate) for most of a term in
o¢ ce, especially for the case of exponential discounting. But what is most apparent in Figure 6
is the amplitude of the predicted unemployment rate is 25.7 percentage points with exponential
discounting, while the peak-to-trough amplitudes are 5.7 percentage points, 4.0 percentage
points, and 2.9 percentage points for the standard hyperbolic, hyperbolic-log, and hyperbolic-
power forms respectively. The predicted amplitudes corresponding to the alternative hyperbolic
functions are reasonable from an empirical perspective. But the amplitude corresponding to the
exponential discount function is counterfactual from the perspective that the model economy
experiences �uctuations in the unemployment rate at an amplitude that is greater than what
was experienced during the US Great Depression, but at a frequency in the model of every four
years across electoral cycles!
Figure 7 depicts the time paths of the in�ation rate. The average rates of in�ation under
hyperbolic discounting are roughly in line with what has been experienced in the US over the last
several decades. But this is for expositional purposes only. Indeed, it is important to remember
that the level of the in�ation rate is an artifact of the calibration procedure, which normalizes
��p(0) = 0:03 for the case of hyperbolic-power discounting by searching over numerical values for
the initial condition on in�ation expectations, "(0). Any other level can be easily achieved by
using alternative targets to calibrate "(0). What is of real importance are the trough-to-peak
amplitudes of the in�ation rate: amplitudes of 1.6 to 2.9 percentage points corresponding to
the alternative cases of hyperbolic discounting are perfectly plausible in advanced economies,
yet the amplitude is counterfactual for the case of exponential discounting since most advanced
economies do not experience cyclical �uctuations or swings in the in�ation rate on the order of
13.7 percentage points every four years.
The model-generated short-run Phillips Curves and the model-generated long-run Phillips
Curve are all depicted in Figure 8 for the case of �moderate discounting�. Recall that the level
of the in�ation rate is an artifact of the calibration procedure, meaning that all of the curves
15
can be shifted easily in the vertical space with alternative in�ation targets. Also recall that
the incumbent government in the model starts a new electoral term at the most south-easterly
point on a short-run Phillips Curve, where the unemployment rate is relatively high but the
in�ation rate is relatively low. The incumbent government moves the economy up a short-
run Phillips Curve in the north-westerly direction over the course of an electoral term, and
it is readily apparent that the distance traveled in the in�ation-unemployment policy space is
counterfactual with exponential discounting but empirically reasonable under the hyperbolic
discounting cases.
3.4 High discounting: Numerical examples and discussion
Recall that for a value of � = 1:35, (23) produces the following discount function parameters:
� = 3:77, � = 5:98, and � = 4:04 with � = 0:33. A value of � = 1:35 is nine percentage
points less than the upper bound of empirical estimates for the exponential memory discount
rate, yet this parameterization is selected as the �high discounting� case because it is more
than su¢ cient to reinforce the main point of this paper. Moreover, the predicted amplitude of
the unemployment rate under exponential discounting exceeds 100 percentage points at higher
discount rates, which is not admissible in the solution technique to the dynamic optimization
problem. The alternative memory discount functions are depicted in Figure 9.
In Figure 10 note the grossly counterfactual amplitude of the predicted unemployment
rate under exponential memory discounting� the peak-to-trough amplitude is 91.4 percentage
points, meaning that the unemployment rate �uctuates between 95.4 percent and 4 percent
ever four years! Yet, the amplitudes of the predicted unemployment rate under hyperbolic
discounting range between 2.9 percentage points and 6.6 percentage points across the various
hyperbolic forms, which is consistent with the US historical experience for the most part. This
reveals that the predicted amplitudes of the unemployment rate under hyperbolic discounting
are quite robust to the degree of discounting! Figures 11 and 12 depict the time path of the
in�ation rate and the Phillips Curves respectively. Recall that the level of the in�ation rate in
these �gures is a by-product of the calibration procedure, and what matters most are the sizes
of the relative amplitudes across alternative discount functions. These �gures reinforce the fact
that hyperbolic memory discounting delivers empirical predictions concerning the amplitude of
the predicted business cycle that are in line with real-world evidence, whereas an amplitude of 50
percentage points in the in�ation rate under exponential discounting is yet again counterfactual.
16
4 Concluding remarks
Beginning with the �ndings of Ebbinghaus (1885) and Jost (1897), a large body of research
in the �eld of psychology documents that individuals discount their memories hyperbolically.
This behavioral phenomenon has come to be recognized as Jost�s Second Law of Forgetting.
Given that this research has not received much attention (to the best of my knowledge) in the
economics literature to date, the objective of this paper is to demonstrate how incorporating
hyperbolic memory discounting into a seminal political economy model can a¤ect its main
predictions. I focus on the vintage political business cycle model of Nordhaus (1975) because
its setup, motivating assumptions, and baseline predictions are generally well-known.
A key assumption in the original Nordhaus (1975) framework is that voters exponentially
discount their memories about the pain of in�ation and unemployment. I �nd that replacing
exponential memory discounting with hyperbolic discounting a¤ects the predictions in a signi�-
cant way. Namely, I �nd both analytically and numerically that the amplitude of the predicted
business cycle is moderated in both the in�ation and the unemployment dimensions. This re-
sults from the fact that it is not nearly as easy for an opportunistic incumbent government to
exploit retrospective voters during the early part of an electoral term if such voters remember
relatively more about economic outcomes in that part of the term under hyperbolic discount-
ing relative to exponential memory discounting. A signi�cantly moderated amplitude of the
predicted political business cycle might be an underlying reason for the di¢ culty that many
empirical studies have faced in attempting to detect the existence of opportunistic political
business cycles in the data.
The �ndings presented in this paper highlight the potential role and impact that hyperbolic
memory discounting can have on predicted economic outcomes. There are other strands of
research on political business cycles that I think would be interesting to re-visit with hyperbolic
discounting, such as models with political-partisan competition (e.g., Hibbs 1977, 1992; Alesina
and Rosenthal 1995) and political budget cycles (e.g., Aidt, Veiga, and Veiga 2011; Efthyvoulou
2012; Klomp and de Haan 2013; Foremny and Riedel 2014; Shelton 2014). It would also be very
interesting to re-visit the literature on rational (opportunistic and partisan) political business
cycles (e.g., Alesina 1987; Rogo¤ 1990; Sieg 1997, 2001, 2006; Aidt, Veiga, and Veiga 2011) and
explore how the predictions of such models might change under the alternative assumption of
forward-looking hyperbolic discounting à la Strotz (1956) and Laibson (1997, 1998). Lastly, it
would be of interest to see how the predicted political business cycle and the timing of elections
might be a¤ected by hyperbolic discounting if the date of re-election is a choice variable of the
incumbent (Chappell and Peel 1979; Lächler 1982). I believe that studying these possibilities
deserves more attention, and I have therefore placed these on the agenda for future research.
17
Acknowledgments
I thank Shantanu Bagchi, Frank Caliendo, Mike Clagg, Chris Fawson, Jim Feigenbaum, Vin-
cenzo Galasso, Gerhard Glomm, Nick Guo, Hyeon Park, Bill Shughart, Randy Simmons, Di-
ana Thomas, Michael Thomas, Christoph Trebesch, and seminar participants at the CESifo
Venice Summer Institute on Behavioural Political Economy (July 2014; Venice, Italy), the Bay
Area Behavioral and Experimental Economics Workshop (May 2014; Stanford University), the
Center for Economic Studies (CES) at Ludwig-Maximilians-Universität München, and at the
SABE/IAREP/ICABEEP Biennial Conference (July 2013; Atlanta, Georgia) for providing
helpful comments. I acknowledge and thank two anonymous reviewers and Heinrich Ursprung
for suggestions that have improved this manuscript during the review process. An early version
of this manuscript was circulated under the title, �Nordhaus Meets Ebbinghaus and Jost in the
Political Business Cycle Model�.
References
Agliari, A., Chiarella, C., Gardini, L., 2006. A re-evaluation of adaptive expectations in lightof global nonlinear dynamic analysis. Journal of Economic Behavior and Organization 60,526-552.
Aidt, T.S., Veiga, F.J., Veiga, L.G., 2011. Election results and opportunistic policies: A newtest of the rational political business cycle model. Public Choice 148, 21-44.
Ainslie, G., 1975. Specious reward: A behavioral theory of impulsiveness and impulse control.Psychological Bulletin 82, 463-496.
Alesina, A., 1987. Macroeconomic policy in a two-party system as a repeated game. QuarterlyJournal of Economics 102, 651-678.
Alesina, A., Rosenthal, H., 1995. Partisan Politics, Divided Government, and the Economy.Cambridge University Press, New York.
Alin, L.H., 1997. The memory laws of Jost. Göteborg Psychological Reports 27, 1-21.
Anderson, C.J., 2000. Economic voting and political context: A comparative perspective. Elec-toral Studies 19, 151-170.
Averell, L., Heathcote, A., 2011. The form of the forgetting curve and the fate of memories.Journal of Mathematical Psychology 55, 25-35.
Basak, G.K., Ghosh, M.K., Mukherjee, D., 2015. A mean-reverting stochastic model for thepolitical business cycle. Working paper, unpublished. Indian Statistical Institute, Kolkata,India.
Brown, G.D.A., Neath, I., Chater, N., 2007. A temporal ratio model of memory. PsychologicalReview 114, 539-576.
Burmeister, E., Turnovsky, S.J., 1976. The speci�cation of adaptive expectations in continuoustime dynamic economic models. Econometrica 44, 879-905.
18

Caliendo, F.N., Findley, T.S., 2014. Discount functions and self-control problems. EconomicsLetters 122, 416-419.
Campbell, J.E., Dettrey, B.J., Yin, H., 2010. The theory of conditional retrospective voting:Does the presidential record matter less in open-seat elections? Journal of Politics 72,1083-1095.
Chappell, D., Peel, D.A., 1979. On the political theory of the business cycle. Economics Letters2, 327-332.
Chappell, Jr., H.W., 1983. Presidential popularity and macroeconomic performance: Are votersreally so naive? Review of Economics and Statistics 65, 385-392.
Ebbinghaus, H., 1885. Ueber das Gedächtnis. Verlag von Duncker & Humbolt, Leipzig.
Efthyvoulou, G., 2012. Political budget cycles in the European Union and the impact of politicalpressures. Public Choice 153, 295-327.
Evans, G.W., Honkapohja, S., 2001. Learning and Expectations in Macroeconomics. PrincetonUniversity Press, Princeton.
Fair, R.C., 1978. The e¤ect of economic events on votes for president. Review of Economicsand Statistics 60, 159-173.
Fiorina, M.P., 1981. Retrospective Voting in American National Elections. Yale UniversityPress, New Haven.
Foremny, D., Riedel, N., 2014. Business taxes and the electoral cycle. Journal of Public Eco-nomics 115, 48-61.
Francis, W.L., Kenny, L.W., Morton, R.B., Schmidt, A.B., 1994. Retrospective voting andpolitical mobility. American Journal of Political Science 38, 999-1024.
García-Sanchez, I.-M., Mordán, N., Cuadrado-Ballesteros, B., 2014. Do electoral cycles a¤ectlocal �nancial health? Policy Studies 35, 533-556.
Gordon, R.J., 1997. The time-varying NAIRU and its implications for economic policy. Journalof Economic Perspectives 11, 11-32.
Haller, H.B., Norpoth, H., 1994. Let the good times roll: The economic expectations of U.S.voters. American Journal of Political Science 38, 625-650.
Herrnstein, R.J., 1961. Relative and absolute strength of responses as a function of frequencyof reinforcement. Journal of the Experimental Analysis of Behavior 4, 267-272.
Hey, J.D., 1994. Expectations formation: Rational or adaptive or...? Journal of EconomicBehavior and Organization 25, 329-349.
Hibbs, Jr., D.A., 1977. Political parties and macroeconomic policies. American Political ScienceReview 71, 1467-1487.
Hibbs, Jr., D.A., 1987. The American Political Economy: Macroeconomics and Electoral Poli-tics. Harvard University Press, Cambridge.
Hibbs, Jr., D.A., 1992. Partisan theory after �fteen years. European Journal of Political Econ-omy 8, 361-373.
19

Hibbs, Jr., D.A., Vasilatos, N., 1981. Economics and politics in France: Economic performanceand mass political support for Presidents Pompidou and Giscard d�Estaing. European Jour-nal of Political Research 9, 133-145.
Hibbs, Jr., D.A., Vasilatos, N., 1982. Economic outcomes and political support for Britishgovernments among occupational class: A dynamic analysis. American Political ScienceReview 76, 259-279.
Hibbs, Jr., D.A., Rivers, R.D., Vasilatos, N., 1982. On the demand for economic outcomes:Macroeconomic performance and mass political support in the United States, Great Britain,and Germany. Journal of Politics 44, 426-462.
Hovland, C.I., 1951. Human learning and retention. In: Stevens, S.S. (Ed.), Handbook ofExperimental Psychology. John Wiley & Sons, Inc., New York, pp. 613-689.
Jost, A., 1897. Die Assoziationsfestigkeit in ihrer Abhängigkeit von der Verteilung der Wieder-holungen. Zeitschrift fuer Psychologie und Physiologie der Sinnesorgane 14, 436-472.
Kalecki, M., 1943. Political aspects of full employment. Political Quarterly 14, 322-330.
Kiewiet, D.R., Udell, M., 1998. Twenty-�ve years after Kramer: An assessment of economic ret-rospective voting based upon improved estimates of income and unemployment. Economicsand Politics 10, 219-248.
King, T.B., Morley, J., 2007. In search of the natural rate of unemployment. Journal of MonetaryEconomics 54, 550-564.
Klomp, J., de Haan, J., 2013. Political budget cycles and election outcomes. Public Choice 157,245-267.
Lächler, U., 1982. On political business cycles with endogenous election dates. Journal of PublicEconomics 17, 111-117.
Laibson, D., 1997. Golden eggs and hyperbolic discounting. Quarterly Journal of Economics112, 443-478.
Laibson, D., 1998. Life-cycle consumption and hyperbolic discount functions. European Eco-nomic Review 42, 861-871.
Lanoue, D.J., 1994. Retrospective and prospective voting in presidential-year elections. PoliticalResearch Quarterly 47, 193-205.
Lee, J., Nelson, C.R., 2007. Expectation horizon and the Phillips curve: The solution to anempirical puzzle. Journal of Applied Econometrics 22, 161-178.
Mueller, D.C., 2003. Public Choice III. Cambridge University Press, Cambridge UK.
Murakami, M.H., 2008. Paradoxes of democratic accountability: Polarized parties, hard deci-sions, and no despot to veto. Critical Review: A Journal of Politics and Society 20, 91-113.
Muth, J.F., 1960. Optimal properties of exponentially weighted forecasts. Journal of the Amer-ican Statistical Association 55, 299-306.
Myerson, J., Green, L., Warusawitharana, M., 2001. Area under the curve as a measure ofdiscounting. Journal of the Experimental Analysis of Behavior 76, 235-243.
20
Myerson, J., Green, L., Hanson, J.S., Holt, D.D., Estle, S.J., 2003. Discounting delayed andprobabilistic rewards: Processes and traits. Journal of Economic Psychology 24, 619-635.
Myerson, J., Green, L., 2004. A discounting framework for choice with delayed and probabilisticrewards. Psychological Bulletin 130, 769-792.
Nadeau, R., Lewis-Beck, M.S., 2001. National economic voting in U.S. presidential elections.Journal of Politics 63, 159-181.
Nordhaus, W.D., 1975. The political business cycle. Review of Economic Studies 42, 169-190.
Rachlin, H., 2006. Notes on discounting. Journal of the Experimental Analysis of Behavior 85,425-435.
Rachlin, H., Green, L., 1972. Commitment, choice and self control. Journal of the ExperimentalAnalysis of Behavior 17, 15-22.
Rogo¤, K., 1990. Equilibrium political budget cycles. American Economic Review 80, 21-36.
Rubin, D.C., Wenzel, A.E., 1996. One hundred years of forgetting: A quantitative descriptionof retention. Psychological Review 103, 734-760.
Salemi, M.K., 1999. Estimating the natural rate of unemployment and testing the natural ratehypothesis. Journal of Applied Econometrics 14, 1-25.
Sargent, T.J., 1999. The Conquest of American In�ation. Princeton University Press, Princeton.
Shepherd, B., 2012. When are adaptive expectations rational? A generalization. EconomicsLetters 115, 4-6.
Shelton, C.A., 2014. Legislative budget cycles. Public Choice 159, 251-275.
Sieg, G., 1997. A model of partisan central banks and opportunistic political business cycles.European Journal of Political Economy 13, 503-516.
Sieg, G., 2001. A political business cycle with boundedly rational agents. European Journal ofPolitical Economy 17, 39-52.
Sieg, G., 2006. A model of an opportunistic-partisan political business cycle. Scottish Journalof Political Economy 53, 242-252.
Snowdon, B., 1997. Politics and the business cycle. Political Quarterly 68, 255-265.
Söderlund, P., 2008. Retrospective voting and electoral volatility: A Nordic perspective. Scan-dinavian Political Studies 31, 217-240.
Sorge, M.M., 2013. Generalized adaptive expectations revisited. Economics Letters 120, 203-205.
Staiger, D.O., Stock, J.H., Watson, M.W., 1997. How precise are estimates of the natural rateof unemployment? In: Romer, C.D., Romer, D.H. (Eds.), Reducing In�ation: Motivationand Strategy. University of Chicago Press, Chicago, pp. 195-246.
Strotz, R.H., 1956. Myopia and inconsistency in dynamic utility maximization. Review of Eco-nomic Studies 23, 165-180.
Suzuki, M., 1991. The rationality of economic voting and the macroeconomic regime. AmericanJournal of Political Science 35, 624-642.
21
Vásquez-Ruíz, H.A., Rivas, R., Díaz, R., 2014. Do politics determine policy? Evidence on thepolitical-economic business cycle in the Dominican Republic. Working paper, unpublished.Central Bank of the Dominican Republic, Santo Domingo, Dominican Republic.
Williams, K.C., 1994. Sequential elections and retrospective voting: Some laboratory experi-ments. Journal of Theoretical Politics 6, 239-255.
Wixted, J.T., Ebbesen, E.B., 1991. On the form of forgetting. Psychological Science 2, 409-415.
Wixted, J.T., 2004. The psychology and neuroscience of forgetting. Annual Review of Psychol-ogy 55, 235-269.
Yi, R., Gatchalian, K.M., Bickel, W.K., 2006. Discounting of past outcomes. Experimental andClinical Psychopharmacology 14, 311-317.
Yi, R., Landes, R.D., Bickel, W.K., 2009. Novel models of intertemporal valuation: Past andfuture outcomes. Journal of Neuroscience, Psychology, and Economics 2, 102-111.
22

0 1 2 3 4
0.2
0.4
0.6
0.8
1.0
mem
orydiscount
function,M
(E−
t)
time, t
Figure 1. Memory discount functions, low discounting
0 1 2 3 4
0.05
0.10
0.15
0.20
0.25
unem
ploym
entrate,u∗(t)
time, t
Figure 2. Unemployment rate, low discounting
exponential: ρ = 0.50
standard hyperbolic: β = 0.86
hyperbolic-log: µ = 1.52
hyperbolic-power: η = 1.16, σ = 0.33
exponential: ρ = 0.50
standard hyperbolic: β = 0.86
hyperbolic-log: µ = 1.52
hyperbolic-power: η = 1.16, σ = 0.33
model-generated natural rate
23
0 1 2 3 4
−0.10
−0.08
−0.06
−0.04
−0.02
0.00
0.02
0.04
inflationrate,π∗(t)
time, t
Figure 3. Inflation rate, low discounting
0 0.05 0.1 0.15 0.2 0.25 0.3 0.35
−0.10
−0.08
−0.06
−0.04
−0.02
0.00
0.02
0.04
inflationrate,π∗
unemployment rate, u∗
Figure 4. Model-generated SR Phillips Curves, low discounting
exponential: ρ = 0.50
standard hyperbolic: β = 0.86
hyperbolic-log: µ = 1.52
hyperbolic-power: η = 1.16, σ = 0.33
exponential: ρ = 0.50
standard hyperbolic: β = 0.86
hyperbolic-log: µ = 1.52
hyperbolic-power: η = 1.16, σ = 0.33
model-generated LR Phillips Curve
24

0 1 2 3 4
0.2
0.4
0.6
0.8
1.0
mem
orydiscount
function,M
(E−
t)
time, t
Figure 5. Memory discount functions, moderate discounting
0 1 2 3 4
0.05
0.10
0.15
0.20
0.25
unem
ploym
entrate,u∗(t)
time, t
Figure 6. Unemployment rate, moderate discounting
exponential: ρ = 0.95
standard hyperbolic: β = 2.23
hyperbolic-log: µ = 3.68
hyperbolic-power: η = 2.60, σ = 0.33
exponential: ρ = 0.95
standard hyperbolic: β = 2.23
hyperbolic-log: µ = 3.68
hyperbolic-power: η = 2.60, σ = 0.33
model-generated natural rate
25

0 1 2 3 4
−0.10
−0.08
−0.06
−0.04
−0.02
0.00
0.02
0.04
inflationrate,π∗(t)
time, t
Figure 7. Inflation rate, moderate discounting
0.00 0.05 0.10 0.15 0.20 0.25 0.30 0.35
−0.10
−0.08
−0.06
−0.04
−0.02
0.00
0.02
0.04
inflationrate,π∗
unemployment rate, u∗
Figure 8. Model-generated SR Phillips Curves, moderate discounting
exponential: ρ = 0.95
standard hyperbolic: β = 2.23
hyperbolic-log: µ = 3.68
hyperbolic-power: η = 2.60, σ = 0.33
exponential: ρ = 0.95
standard hyperbolic: β = 2.23
hyperbolic-log: µ = 3.68
hyperbolic-power: η = 2.60, σ = 0.33
model-generated LR Phillips Curve
26

0 1 2 3 4
0.2
0.4
0.6
0.8
1.0
mem
orydiscount
function,M
(E−
t)
time, t
Figure 9. Memory discount functions, high discounting
0 1 2 3 4
0.10
0.20
0.30
0.40
0.50
0.60
0.70
0.80
0.90
1.00
unem
ploym
entrate,u∗(t)
time, t
Figure 10. Unemployment rate, high discounting
exponential: ρ = 1.35
standard hyperbolic: β = 3.77
hyperbolic-log: µ = 5.98
hyperbolic-power: η = 4.04, σ = 0.33
exponential: ρ = 1.35
standard hyperbolic: β = 3.77
hyperbolic-log: µ = 5.98
hyperbolic-power: η = 4.04, σ = 0.33
model-generated natural rate
27

0 1 2 3 4
−0.50
−0.40
−0.30
−0.20
−0.10
0.00
0.10
inflationrate,π∗(t)
time, t
Figure 11. Inflation rate, high discounting
0.00 0.20 0.40 0.60 0.80 1.00
−0.50
−0.40
−0.30
−0.20
−0.10
0.00
0.10
inflationrate,π∗
unemployment rate, u∗
Figure 12. Model-generated SR Phillips Curves, high discounting
exponential: ρ = 1.35
standard hyperbolic: β = 3.77
hyperbolic-log: µ = 5.98
hyperbolic-power: η = 4.04, σ = 0.33
exponential: ρ = 1.35
standard hyperbolic: β = 3.77
hyperbolic-log: µ = 5.98
hyperbolic-power: η = 4.04, σ = 0.33
model-generated LR Phillips Curve
28


![151106 NewContentHandoutsmypixels2pages.com/1_P2P_Handouts/Checklists/p2P_NewContentC… · Vintage Christmas 1 C] Vintage Christmas 2 Vintage Christmas Extras C] Vintage Christmas](https://static.documents.pub/doc/80x56/605b450e20c6a215223ab800/151106-newcontentha-vintage-christmas-1-c-vintage-christmas-2-vintage-christmas.jpg)

