

T H E W O R L D B A N K O P E R A T I O N S E V A L U A T I O N D E P A R T M E N T
Director-General, Operations Evaluation: Gregory K. Ingram Director: Ajay Chhibber Manager: R. Kyle Peters Task Manager: Alice Galenson * The William Davidson Institute at the University of Michigan Business School, Department of Economics at the University of Michigan and CERGE-EI, Prague. The paper benefited from comments by Alice Galenson and Michael Lav. The author is responsible for any errors.
Assistance to the Transition Economies: Were There Alternatives?
Jan Svejnar*
2002The World Bank
Washington, D.C.
Pub
lic D
iscl
osur
e A
utho
rized
Pub
lic D
iscl
osur
e A
utho
rized
Pub
lic D
iscl
osur
e A
utho
rized
Pub
lic D
iscl
osur
e A
utho
rized
Pub
lic D
iscl
osur
e A
utho
rized
Pub
lic D
iscl
osur
e A
utho
rized
Pub
lic D
iscl
osur
e A
utho
rized
Pub
lic D
iscl
osur
e A
utho
rized

ENHANCING DEVELOPMENT EFFECTIVENESS THROUGH EXCELLENCE AND INDEPENDENCE IN EVALUATION The Operations Evaluation Department (OED) is an independent unit within the World Bank; it reports directly to the Bank’s Board of Executive Directors. OED assesses what works, and what does not; how a borrower plans to run and maintain a project; and the lasting contribution of the Bank to a country’s overall development. The goals of evaluation are to learn from experience, to provide an objective basis for assessing the results of the Bank’s work, and to provide accountability in the achievement of its objectives. It also improves Bank work by identifying and disseminating the lessons learned from experience and by framing recommendations drawn from evaluation findings. OED Working Papers are an informal series to disseminate the findings of work in progress to encourage the exchange of ideas about development effectiveness through evaluation. The findings, interpretations, and conclusions expressed here are those of the author(s) and do not necessarily reflect the views of the Board of Executive Directors of the World Bank or the governments they represent. The World Bank cannot guarantee the accuracy of the data included in this work. The boundaries, colors, denominations, and other information shown on any map in this work do not imply on the part of the World Bank any judgment of the legal status of any territory or the endorsement or acceptance of such boundaries.
Contact: Operations Evaluation Department Partnerships & Knowledge Programs (OEDPK) e-mail: [email protected] Telephone: 202-458-4497 Facsimile: 202-522-3125 http:/www.worldbank.org/oed

Contents
1. Introduction 1 2. Performance Since 1989 1 Gross Domestic Product 2 Inflation 3 Exchange Rates and Current Account 3 External Debt and Financial Crisis 4 Budget and Taxes 4 Privatization and Creation of New Firms 5 Domestic and Foreign Investment 7 Employment Adjustment, Wage Setting and Unemployment 7 Life Expectancy 9 Marriage Rates 10 Fertility 10 Attitudes 11 3. Alternative Policy Recommendations 11 Type I Reforms 12 Type II Reforms 18 Concluding Observations on Actual Policies 25
4. Were Alternative Approaches and Outcomes Possible? 27 Figures Figure 1: Real GDP Percentage Change Index 33 Figure 2: Foreign Direct Investment Per Capita 35 Figure 3: Employment Index 37 Tables Table 1: Consumer Price Inflation 39 Table 2: Current Account Balance 40 Table 3: External Debt as % of GDP 41 Table 4: Government Budget Balance 42 Table 5: Private Sector Share of GDP 43 Table 6: Unemployment 44 Table 7: Income Inequality (Gini Coefficients) 45 Table 8: Life Expectancy at Birth 46 Table 9: Marriage Rates 47 Table 10: Fertility Rate, Total 48 References 49

1
1. Introduction 1. Twelve years after the fall of the Berlin Wall, domestic and international analysts of the transition economies by and large agree that the transition from central planning to a market economy has been exceedingly difficult. There has also been a major debate about the extent to which the transition to date has succeeded or failed. In this paper, I provide an assessment of the policies that were followed and I discuss the extent to which there were known alternatives that could have resulted in superior outcomes in terms of (a) GDP growth and other principal performance indicators, (b) building honest and competent institutions, and (c) creating a more transparent and less corrupt system of corporate and national governance.
2. I start in Section 2 by providing a brief overview of performance since 1989. In Section 3 I discuss the recommendations that were made and policies that were followed. I conclude in Section 4 by assessing the extent to which alternative paths could have been followed and what the likely outcomes would have been.
3. While my goal is to present a relatively comprehensive view of the transition countries as a whole, I obviously cannot cover in-depth all the countries of the former Soviet bloc, former Yugoslavia and Albania. In presenting data and examples, I hence focus primarily on the five Central European countries (Czech Republic, Hungary, Poland, Slovakia, and Slovenia) that were the first to launch the transition, and on Russia as the principal country of the former Soviet Union and now of the Commonwealth of Independent States (CIS).1 My secondary focus is on the three Baltic countries (Estonia, Latvia, and Lithuania) that staged a relatively fast transition, the Balkan countries that have not been affected by war or other conflicts (Albania, Bulgaria, and Romania), and Ukraine as the second-largest economy of the former Soviet Union and now CIS.
2. Performance Since 19892 4. The Soviet bloc countries entered the transition after three decades of diminishing economic growth. They are estimated to have achieved a 4.5 percent annual growth rate in per capita GNP during the 1950s, thus exceeding the 3.7 percent rate of growth of a comparison group of market economies (Gregory and Stuart 1997). However, while the comparison group of market economies is estimated to have average rates of growth of GNP per capita of 4.5 percent in the 1960s, 2.8 percent in the 1970s, and 2 percent in the 1980s, the per capita GNP growth rate of the Soviet bloc countries is estimated to have fallen to about 3.6 percent in the 1960s, 2.8 percent in the 1970s, and 0.8 percent in the 1980s.
1. The CIS includes Armenia, Azerbaijan, Belarus, Georgia, Kazakhstan, Kyrgyzstan, Moldova, Russia, Tajikistan, Turkmenistan, Ukraine, and Uzbekistan. 2. The material in this section draws in part on Svejnar (2002) and on data from the Davidson Institute Data Center.

2
5. The Fall of Communism naturally created expectations that the centrally planned economies would generate rapid economic growth and gradually catch up with middle- income developed countries as they moved to a market system and enjoyed the benefits of stronger incentives, Western technology, and more efficient allocation of resources. However, most of these economies have not performed as well as many had expected in absolute terms and relative to the advanced economies. Economic performance has also varied widely across the transition countries, with the Central European countries generally performing better than the Baltic and Balkan countries, which in turn performed better than the countries in the CIS.
Gross Domestic Product 6. Calculating the evolution of GDP is a difficult exercise in the transition economies since the communist countries used "gross material product" (GMP) instead of GDP, prices did not reflect scarcity and consumer demand, and there were few small firms and their number increased dramatically during the transition, thus making it difficult for the official statistics to capture them. Moreover, both before and during the transition, the underground economy in these countries had evolved in unknown but significant magnitudes. As a result, the early data obviously have to be interpreted with caution (Filer and Hanousek 2000; Brada, King, and Kutan 2000).
7. With these caveats in mind, one may interpret the growth performance since 1989 as having been disappointing in Central Europe, and poor to disastrous in Eastern Europe and the CIS countries. Figure 1 provides data for an illustrative set of countries. As the figure shows, all of the transition economies experienced unexpectedly large declines in output at the start of the transition. The decline varied from 13 to 25 percent in Central and Eastern Europe; over 40 percent in the Baltic countries; and as much as 45 percent or more in Russia and even more in many of the other nations of the CIS (e.g., almost 65 percent in Ukraine). Moreover, while the Central and Eastern European countries reversed the decline after 3–4 years, in Russia and the CIS no turnaround was visible through most of the 1990s.
8. All Central European countries except for the Czech Republic have generated sustained economic growth since the early to mid-1990s. However, only in Poland has the rate of growth been sufficient to start bringing the relative income gap with the advanced (OECD) economies toward its initial 1989 level. Yet, by 2001 no transition economy had even started closing the relative income gap with the advanced economies that existed in 1989.
9. What is the magnitude of the income gap? At the average 1999 exchange rates, GDP per capita ranged from $620 in Ukraine to $1,250 in Russia, $4,070 in Poland, $5,200 in the Czech Republic, and $10,000 in Slovenia (EBRD 2000). The comparable figures for the United States, the 15 European Union countries, and Japan were $33,900, $22,560, and $32,600, respectively. The gap between the poor and rich countries is of course reduced when calculated in terms of purchasing power parity, but for most

3
transition economies the above numbers represent enormous absolute and relative income gaps that will take decades to close.3
Inflation
10. A number of the transition economies experienced high or hyperinflation as the communist system disintegrated. As may be seen from table 1, Poland, Slovenia, Albania, Bulgaria, and Romania, for instance, all experienced at least one year from 1990 to 1993 when consumer price inflation exceeded 200 percent; Estonia, Latvia, and Lithuania had inflation around 1,000 percent; and Russia, Ukraine, and Kazakhstan experienced at least one year when inflation was above 2,000 percent. In some cases these bouts of inflation arose in the aftermath of lifting price controls; in other cases the inflation grew out of financial sector crises. The possibility of high inflation in the transition economies was a major concern in the late 1980s and early 1990s. However, by the later part of the 1990s, many of these countries had shown that they could reduce inflation rates with speed and effectiveness. As may be seen from table 1, by 2001 inflation rates in many transition economies were in single digits. Even countries that experienced very high rates of inflation during the 1990s—Russia, Ukraine, Kazakhstan, and Bulgaria, for example—had inflation rates in the range of 9 to 35 percent by 2001.
Exchange Rates and Current Account
11. Most transition economies devalued their currency as a means of export promotion and adopted a fixed exchange rate as part of macroeconomic stabilization. They also significantly reoriented their foreign trade away from the old CMEA arrangements and toward market economies. However, as domestic inflation exceeded world inflation in the 1990s, the fixed exchange rates often became overvalued, leading in some cases to substantial current account deficits. As may be seen from table 2, Russia, Albania, Kazakhstan, and Bulgaria, for instance, all had at least one year between 1990 and 1993 when the current account balance was –10 percent or greater. Most countries responded by devaluing their currencies again and adopting more flexible exchange rate regimes, although Bulgaria, Estonia, and Lithuania have fixed their exchange rate through currency boards as a means of long-term economic stabilization. As may be seen from table 2, countries in Central and Eastern Europe now have current account deficits of moderate size, which would be expected for countries that are seeking to attract a net inflow of foreign investment capital. However, Russia and the CIS economies are often significant exporters of natural resources and are experiencing a net outflow of investment funds, as shown by their current account surpluses.
3. Note also that since these numbers reflect the actual GDP levels almost one decade after comprehensive price liberalization, they do not suffer from the aforementioned possible biases due to mismeasurement of inflation during the early transition.

4
External Debt and Financial Crises
12. As may be seen from table 3, a number of transition countries (e.g., Bulgaria, Hungary, Poland, and Russia) started the 1990s with a high degree of foreign indebtedness. Other transition economies, such as Romania, Slovenia, Czech Republic, and Slovakia had conservative regimes, where foreign debt was less than 20 percent of GDP in 1990.
13. These different initial conditions greatly affected the subsequent performance of these countries. For instance, high-debt Poland succeeded in renegotiating its debt, while high-debt Hungary serviced its debt in full. The Hungarian approach imposed a heavy fiscal burden and induced a number of policies, including the revenue-oriented form of large-scale privatization of state-owned enterprises (SOEs). Of course, these divergent approaches to debt also reflected global political economy, with Poland, for instance, being able to renegotiate in part because of its influence within U.S. domestic politics and the influence of the U.S. in the Paris Club.
14. By the mid-1990s, most of the highly indebted countries reduced their debt relative to GDP, while a number of the less-indebted countries raised theirs. But since about 1996, one observes an increase in variance as foreign indebtedness has risen in the relatively more indebted countries, especially Hungary and Russia. By 2000, all the countries in table 3 had external debt in excess of 25 percent of GDP, but leaving aside the outlier of Bulgaria with its poor macro management, none had external debt higher than 70 percent of GDP. This is in line with a number of other developing and some developed countries.
Budget and Taxes
15. Since under communism the government owned almost everything, the entire economy by and large constituted the government budget and public finances. Taxes and expenditures were transfers among centrally determined activities. As the transition unfolded, governments lost direct control over firms and had to develop new fiscal institutions that would enable them to rely on more standard taxes for revenue. This institutional development was one of the hardest reforms to achieve. While tax collection has been relatively effective in Central and Eastern Europe, Russia and some other CIS countries have faced significant declines in tax revenue as many producers have been operating in the form of barter and accumulating tax arrears. At the same time, the governments have been facing numerous public expenditures, including traditional ones such as those on infrastructure, and new ones such as those on the social safety net. The relative inability of Russia and the CIS nations to collect taxes is one reason why the social safety net has been much better developed and maintained in Central and Eastern Europe than in the CIS.
16. The accompanying problem is that the transition economies, especially those in Central and Eastern Europe, have higher tax rates than other countries at a similar level of GDP per capita. A study by Tanzi and Tsiboures (2000) indicates that the highest tax

5
burdens—35 to 42 percent of GDP—are found in central Europe among the most advanced economic reformers, who rely primarily on the payroll tax, value-added tax, and personal income tax to finance government programs. These countries have been trying to maintain social services at adequate levels, even in the face of initially falling GDP.
17. As may be seen from table 4, the relatively high ratios of taxes to GDP in transition economies have not prevented governments of many of these countries from running budget deficits. Thus, Albania, Bulgaria, Czech Republic, Hungary, Lithuania, Kazakhstan, Russia, Slovakia, and Ukraine have in a number of years had annual budget deficits in excess of 5 percent of GDP. The public expenditures that follow from these patterns indicate that the governments continue to be heavily involved in public programs in Central Europe and the Balkan countries, followed by the Baltics and CIS countries.
18. An especially problematic aspect of the public finances in many transition economies is the increasing strain placed on the government budget by the pension system. The countries of Central and Eastern Europe entered the transition period with publicly funded pension systems, almost universal coverage of the population, low retirement ages (on average, 60 for men and 55 for women), a high and growing ratio of retirees to workers, high payroll tax contribution levels, and high levels of promised benefits relative to recently earned pre-retirement wages (World Bank 1994; Svejnar 1997). Moreover, most of these systems practice a perverse redistribution of benefits from lower-income workers to higher-income workers. The promises of these systems, which are largely pay-as-you-go, are not sustainable given the promised benefits and current tax levels. Several countries, including Hungary, Poland, Latvia, and Kazakhstan, have already moved to raise the retirement age and to supplement the public retirement system by a multi-pillar public/private retirement system with a funded component. Russia and other CIS countries face less of a public sector burden with regard to retirement costs, because the level of government-promised retirement benefits is lower.
19. Given the fiscal pressure under which most of the transition economies operate, it is interesting to note that governments in these economies have collected very little revenue from privatization (Tanzi and Tsiboures 2000). The average in Central and Eastern Europe as well as in the former Soviet Union was only about 5 percent of GDP. Hungary, which was most revenue-oriented in its privatization, generated a total of about 14 percent of GDP, which is still a very modest figure when spread over several years.
Privatization and Creation of New Firms
20. In the early 1990s, most transition economies rapidly privatized small enterprises and small units of state-owned firms, thus creating small and medium-sized enterprises in countries where most firms were, by ideological and practical design, large. Casual evidence suggests that this shift in ownership increased efficiency of production and quality of products and services.
21. Parallel developments were the breakups of SOEs, which contributed in a major way to the growth in the number of firms, restructuring of firms and management, and

6
increased competition. Breakups of small, average, and somewhat above-average size appear to have increased efficiency of both the remaining master enterprises and the spun-off units (Lizal, Singer, and Svejnar 2001). Some of the broken-up firms were privatized in the aforementioned small-scale privatization, while others were privatized in the large-scale privatization discussed below.
22. A large number of new (mostly small) firms were founded. These firms filled niches in demand and gradually started to compete with existing state-owned enterprises and with imports. The growth of new firms has varied across countries. In general, it proceeded faster and more smoothly in Central Europe than in Eastern Europe and the CIS. Gomulka (1994) and others attribute much of the success of the Polish economy to the rising production in the new firms.
23. Finally, in most countries, the majority of private assets were generated through large-scale privatization, which differed in its method across countries. What is remarkable, however, is how quickly most countries generated private ownership, irrespective of the particular privatization methods used. As may be seen from table 5, in 1990, the private sector had perhaps 20–25 percent of GDP in Hungary and Poland, but typically only 5–10 percent of GDP in other transition economies. But these figures increased very quickly. As early as 1994, the private sector was more than 30 percent of GDP in all of the transition economies and represented half or more of GDP in many countries, including Russia. By 2000, the private sector share of GDP was at or above 60 percent in all of the transition economies except Slovenia and in most of them it constituted 70–80 percent.
24. The effect of privatization on economic performance is surprisingly hard to determine. At the country-level, one observes that some of the fastest growing economies (China, Poland, and Slovenia) have been among the slowest to privatize. In a cross-country econometric study, Sachs, Zinnes, and Eilat (2000) find that privatization does not by itself increase GDP growth, but they find a positive effect when privatization is accompanied by in-depth institutional reforms. Four recent surveys of the micro-econometric literature come up with assessments that range from finding a large variation of outcomes but no systematically significant effect of privatization on performance (Bevan, Estrin, and Schaffer 1999), to cautiously concluding that privatization improves firm performance (Megginson and Netter 2001), to being fairly confident that privatization tends to improve performance (Shirley and Walsh 2000; Djankov and Murrell 2000). My assessment is that there is a variety of findings and that the results are not yet conclusive. Many of the micro-econometric studies suffer from serious problems, such as using small and unrepresentative samples of firms, data problems such as mis-reporting and errors in measurement, limited ability to control for other major shocks that occurred at the same time as privatization, having a short period of observations after privatization, and above all not controlling adequately for selectivity bias. Selectivity bias is likely to be a particularly serious problem since recent econometric evidence indicates that better performing firms tend to be privatized first (Gupta, Ham, and Svejnar 2000). Since many studies estimate the effect of privatization on performance by comparing the post-privatization performance of privatized firms to the performance of the remaining
7
state-owned firms, by not controlling for selectivity they erroneously attribute the inherently superior performance of the privatized firms to privatization.
Domestic and Foreign Investment
25. The communist countries, like the east Asian tigers, were known for high rates of investment, often exceeding 30 percent, as a share of GDP. The investment rates slowed down to about 30 percent in the 1980s in a number of countries as governments yielded to public pressure for more consumer goods. The investment rates declined further to about 20 percent of GDP in the 1990s in a number of transition economies (EBRD 1996), although countries such as the Czech and Slovak Republics maintained relatively high levels of investment. Unfortunately, much of this investment appears to have been allocated inefficiently—by the monobank system through the 1980s and by the inexperienced and often politically directed or corrupt commercial banks in the 1990s (Lizal and Svejnar 2001).
26. As figure 2 shows, until 1997 Hungary was the only transition economy receiving a significant inflow of foreign direct investment. Analysts usually attribute this success to the fact that Hungary was more hospitable to and had well-defined rules and regulations for foreign direct investment since the early 1980s, long before the end of the communist system. But starting in 1998, major foreign investments went to the Czech Republic, followed by Poland and Slovakia. However, many countries of Eastern Europe remain, along with Russia, rather unattractive to foreign direct investment. Overall, it appears that the rate of foreign direct investment is increasing as a function of the proximity of the perceived date of accession of a given country to the European Union; the desirability of the country's political, economi,c and legal environment for foreign direct investment; and the availability of attractive privatization projects in the country.
Employment Adjustment, Wage Setting, and Unemployment
27. SOEs in all the transition economies rapidly decreased employment and/or real wages as they experienced falling demand for their output in the early 1990s (Svejnar 1999). In Central Europe, the greatest initial reduction in industrial employment occurred in Hungary (over 20 percent), followed by Slovakia (over 13 percent) and Poland (over 10 percent). Czech industrial firms experienced the smallest decline in output and they reduced employment the least (9 percent). However, they and their Slovak counterparts were the leaders in reducing real wages (24 and 21 percent, respectively). Polish firms reduced wages much less (1 percent), and Hungarian real wages actually rose by 17 percent (Basu, Estrin, and Svejnar 2000). In Russia and the CIS, the adjustment took place in a mixture of wage and employment adjustment as firms frequently delayed the payment of wages and many workers were idled (Desai and Idson 2000).
28. The trend in employment, captured in figure 3, suggests that while in the Czech Republic the fall in employment did not exceed 10 percent during most of the 1990s, in the other economies employment decline reached 15–30 percent. A continuous decline is observed in Russia, Slovakia, and Romania; an L-shape pattern detected in Bulgaria,
8
Hungary and Slovenia; a U-shape pattern in Poland; and a sideways S-shape pattern in the Czech Republic. When combined with the GDP data in figure 1, the employment data point to an initial decline and a subsequent rise in labor productivity. This pattern is consistent with enterprise restructuring—one of the principal means of carrying out the transition. However, a note of caution is in order here. With a significant part of production shifting from large to small firms (Jurajda and Terrell 2002), the decline in employment and output may be less pronounced than suggested by the official data, since small firms are harder to capture in official statistics.
29. As may be seen from table 5, unemployment was an unknown phenomenon before the transition and it rapidly emerged in Central and Eastern European countries, except for the Czech Republic. Within two years after the start of the transition, the unemployment rate rose into double digits in most economies of Central and Eastern Europe. By 1993, for example, the unemployment rate reached 16 percent in Bulgaria and Poland, 12 percent in Hungary and Slovakia, 10 percent in Romania, 9 percent in Slovenia, but only 3.5 percent in the Czech Republic. The high unemployment rates reflected high rates of inflow into unemployment as firms laid-off workers, and relatively low outflow rates as the unemployed found it hard to find new jobs. The Czech labor market was an ideal model of a transition labor market, characterized by high inflows as well as outflows, with unemployment representing a transitory state between old and new jobs (Ham, Svejnar, and Terrell 1998, 1999; Svejnar 1999; Boeri 2000; Boeri and Terrell 2002). Unemployment rose more slowly in the CIS and Baltic countries, as firms were slower to lay off workers and used wage declines and arrears as alternative devices to hold on to workers. For example, unemployment in Russia was still under 6 percent in 1993 and in Estonia it was only a shade over 6 percent.
30. Over time, one observes considerable differentiation in the patterns of unemployment. The Czech Republic was the only central European country to enter recession in the second half of the 1990s, and its unemployment rate correspondingly rose to 8 percent. The fast-growing economies of Poland, Hungary, Slovenia, and to a lesser extent Slovakia managed to reduce their unemployment rates in the late 1990s. Conversely, the CIS and Baltic countries continued to experience gradual increases in unemployment as their transition proceeded, reaching more than 10 percent in Russia and almost 10 percent in Estonia by 1997. By 1999–2000, the unemployment rate rose again in Bulgaria, the Czech Republic, Poland, Slovakia, and Slovenia. It stabilized in countries such as Hungary, Romania, and Russia. By 2000 transition economies had relatively high unemployment rates that were similar to and often significantly above those observed in the European Union.
31. While in Central and Eastern Europe real wages have increased by about 15–20 percent after their initial decline in the 1989–91 period, in Russia and a number of other CIS countries real wages declined until 1993 and stagnated or increased only moderately thereafter (Svejnar 1999; EBRD 2000). The trajectory of real incomes has thus been very different in the more and less advanced transition economies.

9
32. Data on income distribution, expressed in the form of Gini coefficients, are summarized in table 7.4 As may be seen from the table, the communist countries had highly egalitarian income distributions. In Central and Eastern Europe, the Gini coefficients ranged from 20 in Czechoslovakia and Slovenia to 25 in Poland in the late 1980s. The 1988 Ukrainian Gini coefficient of 23 (based on survey data) and the 1991 Russian coefficient of 26 based on the registry wage data of the Russian Statistical Office (Goskomstat) suggest that income distribution was relatively egalitarian in the former Soviet Union as well. Using analogous measures, one finds that inequality increased during the 1990s, with the Gini coefficient reaching 26–34 in Central and Eastern Europe, 30 in Ukraine, and 40 in Russia. These coefficients bring the transition economies into the range of inequality levels spanned by capitalist economies from the relatively egalitarian Sweden to the relatively inegalitarian U.S., and in line with developing countries such as India. However, while the Central and Eastern European data seem to reflect reality, the Russian (and possibly also Ukrainian) data suffer from errors in measurement. In particular, the Goskomstat data are based on wages that firms are supposed to be paying to workers. In reality, many Russian firms have not been paying contractual wages or pay them with delay (Desai and Idson 2000). The second row of the Russian Gini coefficients in table 7 is based on the Russian longitudinal monitoring survey (RLMS) of households. These data suggest that income inequality in Russia achieved high levels (Gini around 50) from early on and with some fluctuations it remained at this level throughout the 1990s. The second row of Ukrainian Gini coefficients suggests that by 1995 Ukraine also reached high levels of inequality (Gini of 47). These findings suggest that income inequality in Russia and Ukraine started resembling that found in developing economies with the most inegalitarian distribution of income (e.g., Brazil). The relatively egalitarian structure of income distribution in Central and Eastern European countries has been brought about by their social safety nets, which rolled back inequality that would have been brought about by market forces alone (Garner and Terrell 1998). Conversely, the Russian social safety net has been regressive—it has made the distribution of income more unequal than it would have been without it (Commander, Tolstopiatenko, and Yemtsov 1999).
Life Expectancy
33. A number of social indicators suggest that average living standards improved during the transition in Central Europe, improved slightly in the Baltic countries, remained about the same or declined slightly in the Balkan countries not involved in wars, and declined in the CIS. The data on life expectancy presented in table 8 are a case in point. For comparison, between 1989 and 1999, life expectancy at birth increased by about two years from 75 to 76.9 years in the United States and from 76.5 to 78.5 in France. During the same period, life expectancy increased by one to three years in most Central European countries, increased slightly in the Baltic countries, declined slightly in Albania, Bulgaria ,and Romania, and declined by 2.5 years in Russia, over three years in Ukraine, and almost four years in Kazakhstan. These divergent trends contrast with the 4. The Gini coefficient varies from 0 to 100, with 0 representing a perfectly egalitarian distribution of income (every individual or household receiving the same income) and 100 denoting the most inegalitarian distribution (one person or household receiving all income).

10
uniformly rising (albeit at different rates) life expectancies in all these countries during the 1980s. The decline in life expectancy in Russia, Ukraine, and Kazakhstan during the transition hence represents a major break from the past trend. It suggests that the transition had a strong negative impact in the former Soviet Union, excluding the Baltic states, while the effect was roughly neutral in the Balkan and Baltic countries, and positive in Central Europe. More disaggregated data indicate that the decline in life expectancy in the CIS countries is to a large extent accounted for by middle-age males, who are presumably more exposed to stress and resort to heavy alcohol consumption.
Marriage Rates
34. Marriage rates have been declining over time in most Western as well as transition economies, as seen in table 9. Moreover, marriage rates in continental European countries have traditionally been lower than those in the United Kingdom and United States. What is striking in table 9 is that the rate of decline in marriage rates accelerated in most transition economies as compared to the Western countries. In 1989 the marriage rates in the Soviet republics and the Czech part of Czechoslovakia were in the 8–10 percent range, thus being on average closer to the 10 percent rate found in the United States than the 5–6.5 percent rate observed in France and Germany. By 2000 these transition economies recorded rates of 3.3–6 percent, thus being around the 4.9–5.4 rates of France and Germany, as compared to the 8.5 percent rate observed in 2000 in the United States. The transition has therefore coincided with a dramatic decline in the formation of traditional families in the former Soviet Union and the Czech Republic, while the other transition countries experienced declines that were similar to those in Western Europe.
Fertility
35. Fertility data, reported in table 10, indicate that the number of births per woman declined dramatically in virtually all the transition economies in the 1990s, as compared to the counterpart numbers in western countries and to the trend in the 1980s. Using the sample of countries included in the table, one observes that fertility rates declined modestly in most countries in the 1980s, the exceptions being Slovenia where the decline was quite steep, Ukraine where the rate remained constant, and Russia and the United States where the rates increased. By 1989, the transition and Western countries had similar ranges of fertility rates, from 1.52 in Slovenia to 2.20 in Romania among the transition countries, and from 1.42 in Germany to 2.01 in the United States. In the 1990s we see the rates decline modestly in Western Europe and rise slightly in the United States. In contrast, in Russia and Ukraine the fertility rates decline from the U.S. level of about 2 to 1.25 and 1.3, respectively, thus plunging below the lowest rate observed in Western Europe (1.35 in Germany). The rate of decline is even steeper in Romania (from 2.20 to 1.32) and it is substantial in all the other transition economies. The lowest 1999 fertility rate is registered in the Czech Republic at 1.17.

11
Attitudes
36. The indicators that we have examined so far capture the actual behavior of individuals, firms, and governments. People’s attitudes toward the changes that took place provide interesting complementary information. For instance, a 1999 comparative attitudinal study carried out by Public Opinion Research Center (1999) on national random samples of 1,018 individuals in the Czech Republic, 1,523 individuals in Hungary, and 1,111 individuals in Poland suggests that citizens of these countries harbor relatively critical attitudes toward the accomplishments of the transition. This is especially informative, given that these three countries are the most advanced transition economies that have succeeded in joining OECD and NATO, and are among the five front-runners for admission to the European Union. In particular, while many respondents are indifferent, when asked if the changes since 1989 have brought people more losses than gains, in each country the fraction of respondents feeling that there were more losses than gains greatly exceeds the fraction that feels that there were more gains than losses. Similarly, in each country more respondents feel that their “material conditions of living are now a little worse” than they were before. The attitudinal survey hence provides a sobering assessment of how people in the most advanced transition economies feel about the benefits and costs of the transition. It is likely that the sentiment in the more poorly performing countries is even more pessimistic.
3. Alternative Policy Recommendations
37. With guidance from various individual advisors and institutions such as the International Monetary Fund and the World Bank, the new policymakers in the former Soviet bloc formulated initial strategies that focused on macroeconomic stabilization and microeconomic restructuring, along with institutional and political reforms to support these strategies. The implementation of the strategies varied across countries, both in speed and in the specifics of the actual change that occurred.
38. A major international debate has been going on since 1989 about the relative merits of fast (“big bang”) vs. slow (“gradual”) transformation. As this debate proceeded, part of it became irrelevant from a practical standpoints since almost all the transition governments in the former Soviet bloc and former Yugoslavia plunged ahead in rapid big bang style with what I have called Type I reforms (Svejnar 2002). However, the big bang vs. gradualism debate was relevant and significant policy differences ensued in what I term Type II reforms, which only some governments carried out, especially early on.5
39. Type I reforms focused on macro stabilization, price liberalization and dismantling of the institutions of the communist system. The macroeconomic strategy emphasized restrictive fiscal and monetary policies, wage controls and in most cases also 5. The debate is also relevant in comparing the former Soviet bloc to China. China proceeded gradually even with respect to Type I reforms and it also avoided the initial recession.

12
a fixed exchange rate. The micro strategy entailed moving quickly toward price liberalization, although a number of key prices like those of energy, housing and basic consumption goods often remained controlled along with wages and exchange rates. The institution governing the Soviet bloc trading area, the Council for Mutual Economic Assistance (CMEA), was abolished and most countries opened up rapidly to international trade, thus inducing a more efficient allocation of resources based on world market prices. Most countries also quickly reduced direct subsidies to trusts and SOEs, and allowed them to restructure or break up. They also removed or stopped enforcing barriers to the creation of new firms and banks, and they carried out small-scale privatizations. Moreover, early on most governments broke up the “monobank” system, whereby a single state bank (or a system of tightly knit but nominally independent banks) functioned as a country’s central bank as well as a nationwide commercial and investment bank, and allowed new and independent banks. The final feature was the introduction of some elements of a social safety net in order to make citizens more willing to accept the disruptions associated with the introduction of a market economy. An important outcome is that the Type I reforms proved relatively sustainable and were associated with improving economic performance in Central Europe (except the Czech Republic) and in the Baltic countries, whereas they were much less successful in the Balkans and the CIS.
40. Type II reforms involved the development and especially enforcement of laws, regulations and institutions that would ensure a successful functioning of a market-oriented economy. These reforms include the privatization of large and medium-sized enterprises, establishment and enforcement of a market-oriented legal system and accompanying institutions, further (in-depth) development of a viable commercial banking sector and the appropriate regulatory infrastructure, labor market regulations, and parameters and institutions related to the unemployment, social security, and retirement system.
41. What was the external advice provided with respect to Type I and Type II reforms? In the rest of this section, I provide an overview of the advice that was provided in the early phases of the transition to the former Soviet bloc countries.
Type I Reforms Macroeconomic Stabilization 42. Since some of the early transition countries, notably Poland and Slovenia, ended the 1980s in or near hyper-inflation, virtually all advisors agreed that achieving and maintaining macroeconomic stability was a key goal. The differences occurred in what specific policies were advocated to achieve this goal.
43. The so-called Balcerowicz plan, prepared in the last quarter of 1989 by a group of Polish and Western economists, including Leszek Balcerowicz, Marek Dabrowski, Stanislaw Gomulka, David Lipton, Jacek Rostowski, and Jeffrey Sachs, advocated restrictive monetary and fiscal policies, large currency devaluation accompanied by establishing a unified, fixed exchange rate and internal (current account) convertibility of the currency, tough incomes policy together with price liberalization, and renegotiation of

13
Poland’s large foreign debt (Gomulka 1992). This plan also represented the basis of support from the IMF and the World Bank. Lipton and Sachs (1990) elaborated on these points. In commenting on Lipton and Sachs (1990), Fischer (1990) noted that in the context of the Polish program it was essential to reduce the budget deficit, plug gaps in the credit system, and establish a nominal exchange rate peg after major devaluation. Fischer differed from Lipton and Sachs, however, in that he allowed for the possibility of a change in the exchange rate after the initial period.
44. Advising the Czechoslovak government that faced a relatively stable and stagnant economy, Svejnar (1989) stressed the importance of maintaining existing macroeconomic stability by using conservative monetary and fiscal policies and creating/improving the tax collection mechanism. He also argued for measures that would induce microeconomic restructuring and contribute to economic growth, such as freeing wages as part of an early price liberalization package and adopting a flexible rather than fixed exchange rate with internal convertibility. Svejnar’s (1989) argument for freeing wages differed from recommendations given by most other advisors. The argument was based on the premise that (a) wages are among the most important prices and allocative signals in the economy, (b) relative wages were highly distorted under communism, and (c) significant labor mobility from low to high productivity jobs was an essential prerequisite for generating economic growth. Similarly, Svejnar (1989) stressed the role of the exchange rate as a factor price and a derived price of tradables, thus providing a signaling role and reflecting relative scarcities in the global context. He conditioned his arguments by noting that fiscal and monetary anchors, if properly implemented, were sufficient stabilizing measures.
45. Svejnar’s view was in part echoed by Coricelli and Rocha (1990), who provided an early assessment of the Polish and (ex)Yugoslav stabilization programs. From the Yugoslav situation they pointed to the possible need for de-freezing the fixed exchange rate in view of its overvaluation after the original fixing, and they also noted that wage policy was not a uniform blessing as tax penalties on the growth of the wage bill in Poland hindered the growth of the labor force and working hours in the efficient and expanding firms.
46. Calvo (1990) examined the financial aspects of stabilization. He noted that credit markets would remain dependent on the central banks for a while and he warned against monetary/credit policy that relied too heavily on credit crunch. He also stressed the importance of reducing “bad” credit (extended by the Central Bank and giving rise to inflation and resource misallocation) and extending sufficient amounts of “good” credit (working capital that provides firms with sufficient liquidity for regular operations). Finally, Calvo (1990) argued against the removal of input subsidies that could generate a serious credit crunch in view of the credit market imperfections.
47. McKinnon (1990a) noted that in the Russian context re-imposing monetary and fiscal discipline was needed to stabilize the economy and currency. He argued that this discipline was achievable only with a radically new tax and banking system.

14
48. Drawing on the experience of Chile and Mexico, Edwards (1990) pointed out that relying on a major price jump to eliminate the monetary overhang might be very costly, with inflationary expectations becoming high. If the economy were highly indexed, these expectations would translate into a high degree of inertia and a long path toward price stability. He concluded that a monetary reform, combining currency blocking with confiscation, would result in a smoother and les traumatic transition. Like Svejnar (1989) and McKinnon (1990a), Edwards (1990) stressed the importance of creating an effective tax system. Using the example of the 1974 Chilean tax system, he argued that a key feature of such a tax system is that the system itself not be vulnerable to inflation. Other important aspects stressed by Edwards were to de-link wage increases from past inflation, devalue the currency before pegging it and adopt a credible exchange rate rule. As it turned out, unlike in Latin America, indexation has not become a major problem in the transition economies. However, this was not obvious at the start of the transition because there were developments that signaled the possibility of growing indexation (e.g., the successful pressure of Polish pensioners in the early 1990s to index their state pensions to wages).
49. In the context of Hungary, Kornai (1992) provided arguments for specific restrictive fiscal measures. In particular, he stressed the need to cut back administrative expenses as a means of reducing the high budget/GDP ratio. At the same time, he pointed to an ambiguous effect of reducing subsidies to state-owned firms, with the resulting fiscal effect depending on how many firms survive and pay taxes as compared to the number of workers who become unemployed and receive government-financed unemployment and social security benefits. He felt that while the short-term effect might be negative, the hardening of budget constraints on SOEs was beneficial from a longer-term perspective. Kornai (1992) also warned that successful transition entails rapid creation of new private firms that often evade taxes and thus represent a short-term fiscal trap for the authorities. Finally, Kornai (1992) documented that various welfare expenditures (pensions, health benefits, price subsidies, etc.) constitute one of the largest items in government’s consolidated budget and pointed out that to “writhe in” this fiscal trap will be both necessary and extraordinarily painful.
50. Bofinger (1991) examined the options for payments and exchange rate systems in Eastern Europe and concluded that there was need for an early transition to current account convertibility and a fixed exchange rate. He also argued that all monetary policy competencies should be transferred to a supranational institution designed according to a European System of Central Banks.
51. The diversity of views was also reflected in Blanchard, Dornbusch, Krugman, Layard, and Summers (1991), who argued that what was needed was a standard stabilization package containing the elimination of the budget deficit and reduction in money growth. Blanchard and others (1991) stated, however, that there was much less agreement on details of any reform package beyond these two points, given that there is a tradeoff between credibility (proxied by the toughness of the package of reforms) and social painfulness of the program (proxied by the expected reduction in economic activity). They noted that fixing the exchange rate in an inflationary environment may require very high real interest rates and eventually devaluation that would reduce

15
credibility. In contrast, Fischer (1990) argued that high real interest rates have to be tolerated for some months. Blanchard and others (1991) also stressed that incomes policy is no substitute for fiscal consolidation, but came down on the side of implementing some form of incomes policy because the public sector in the former socialist economies was very large.
52. Finally, in reviewing the first two years of transition, Fisher and Frenkel (1992) argued that policymakers cannot go gradually and indeed have to move fast because of the collapse of the nonmarket system. A similar view was advanced by Aslund. In assessing the options for the Soviet policymakers after the August 1991 foiled coup, Aslund (1991a) pointed to the danger of a collapse of the old command economy (as happened in Albania in the third quarter of 1991) and argued that the principal lesson from Eastern Europe was that a rapid introduction of a comprehensive package of macroeconomic stabilization, price liberalization, privatization, liberalization of foreign trade, and the establishment of a social safety net was required. Aslund (1991c) drew the conclusion that instituting reforms in sequence rather than all at once would not work and that planning for directing the pace of change is counterproductive, with forecasts being virtually useless. Yet, Aslund (1992a) argued that a sequencing of political and economic reforms might be desirable, with democratization being a crucial precondition to a change in the economic system. A recent counterpoint to these views was provided by Stiglitz (1999).
Price Liberalization
53. As is clear from the discussion above, most policy advisors in the former Soviet bloc felt that rapid price liberalization and free trade constituted the optimal approach, given the distorted price structure. Thus Gomulka (1989), Svejnar (1989), Lipton and Sachs (1990), and others all stressed the need to free prices and introduce domestic as well as international competition once fiscal and monetary policies have been brought under control. They differed in whether the effect of rapid price liberalization and opening to trade should be temporarily cushioned or not. Svejnar (1989) argued that the rapid price liberalization would immediately provide correct signals and advocated instituting a simple (uniform) and rapidly declining set of tariffs and subsidies that would facilitate adjustment, make the process politically acceptable and generate a temporarily needed source of tariff revenue for the government. McKinnon (1990b) recommended that as they move toward full current account convertibility, transition economies pursue simultaneous “tarification” of quantitative restrictions on competing imports, eliminate export taxes on energy and material inputs, and phase down the highest tariffs step-by-step to zero or to a low uniform level over a 5–10 year horizon. Experts who examined specific sectors, such as agriculture in Russia (Desai 1992), usually came down on the side of recommending price liberalization, while pointing to the need for removing structural bottlenecks in production and distribution.
54. In practice, the strategy adopted in most countries was to move quickly toward price liberalization, although a number of key prices like those of energy, housing, and basic consumption goods often remained controlled along with wages and exchange rates.

16
Dismantling of Old Institutions
55. CMEA. On the assumption that international trade is beneficial for economic growth, foreign advisors usually stressed the need for the transition economies to open up to trade with the rest of the world. They also usually did not propose outright abolishing of the CMEA, arguing instead for its reform. Svejnar (1989), for instance, recommended restructuring trade with CMEA partners as part of the process of liberalizing foreign and domestic trade in general. Blanchard and others (1991) described the benefits of maintaining a payments union, but thought that a system of export credits and subsidies to firms exporting manufactured goods to other Eastern European countries might be a simpler and more realistic way to allow firms time to adjust or exit from these markets. Junz (1991) argued that the complicated links within CMEA and the enormous challenge of integrating the transition economies into the world system mandated continuation of CMEA trade.
56. However, feeling that CMEA was a symbol and tool of the former communist regime, policymakers in Central and East Europe moved relatively swiftly to abolish CMEA in 1990–91. The result was a major decline in trade among countries of the former Soviet bloc and reorientation of trade to the developed (European) and developing market economies.
57. Trade with the European Community (EC) and the United States. Reflecting the view of most advisors, Lipton and Sachs (1990) argued that existing trade barriers in both directions between Eastern and Western Europe should be removed and the European Union should give Eastern European countries access to its markets. Svejnar (1989) also pointed out that liberalizing foreign trade was compatible with obtaining the most-favored-nation treatment and negotiating favorable quotas into the European Community, the United States, and other countries in product categories where import quotas existed. Rollo and Smith (1992) showed that exports from Central and Eastern Europe to the European Community were modest, but that their impact was concentrated in few sensitive sectors. They warned against EC protectionism based on this limited impact.
58. Abolishing the Monobank. Many advisors recommended that the “monobank” system be abolished and replaced with a system based on a relatively independent Central Bank and private commercial banks. McKinnon (1990c) was an exception, arguing against breaking up the monobank too early in the transition because it was needed to handle the bad loans of state-owned firms.
59. In practice, very early on most governments broke up the “monobank” system and allowed the creation of new and independent banks. The important question was how to ensure that the newly created commercial banks would prosper and provide efficient intermediation of capital. Pointing to Yugoslav and Hungarian experience in the 1980s, Svejnar (1989) was in favor of creating a competitive network of adequately capitalized commercial banks whose initial conditions would not be linked to the performance of the firms placed in their portfolio (old debt) and whose lending behavior would not be influenced by these enterprises. He also stressed the need for adopting standard project evaluation principles in bank lending and warned against saddling the banks with phasing

17
out of state enterprise subsidies by recycling them in the form of bank loans. McKinnon (1990c) argued that while enterprises might have limited access to bank credit, they should get access to liquid monetary assets (deposits) at positive real yields so that they could replace excess inventories with these monetary assets. The allocation of capital would improve as enterprises see the high opportunity cost of capital.
60. Brainard (1991) asserted that the creation of a viable market for capital was indispensable for the revival of economic growth in Eastern Europe. He emphasized that the introduction of structural reforms should be synchronized as much as possible with stabilization efforts. Brainard (1991) identified the key structural reforms as consisting of cleaning up the balance sheets of enterprises and banks, bankruptcy, rehabilitation of viable enterprises and their privatization, recapitalization of commercial banks, and the necessary accompanying fiscal reforms. He also noted that a rapid creation of a modern commercial banking sector was feasible only if human skills and know-how could be transferred quickly on a significant scale.
61. Restructuring SOEs. The advice on restructuring of SOEs and creating new firms took a number of forms. Svejnar (1989) cautioned that in the short run most existing firms would have to be run as state enterprises and stressed the need to restructure them, make all of them adopt a standard accounting system, embed them in a competitive environment, gradually phase out their subsidies according to a pre-announced plan, and introduce a system of supervisory boards with external directors as well as strong incentives for managers. He also proposed a relatively fast privatization plan entailing the distribution of diversified portfolios of significant minority blocs of shares of all or most companies to citizens at large, while retaining the majority of shares in each company for strategic investors. The fast allocation of shares to citizens at large was motivated by the need to give people assets that could be instantly used as collateral in banks and would stimulate rapid creation of small and medium sized enterprises.
62. Lipton and Sachs (1990) argued that privatization would take a number of years to implement and that in the meantime “state enterprises will have to be kept on a tight leash – with wage controls and curbs on investment – to check their wasteful tendencies.” McKinnon (1990c) found break-ups of large going industrial concerns to be a dubious proposition and argued against a big bang privatization by the widespread distribution of shares in large state-owned enterprises or natural resource based industries.
63. As it turned out, most transition countries quickly reduced direct subsidies to trusts and state-owned enterprises, and allowed them to restructure and even break up. Most countries also removed or stopped enforcing barriers to the creation of new firms.
Introduction of Social Safety Nets and Institutions Facilitating Labor Mobility
64. An important feature of the reform was the introduction of a social safety net in order to make citizens more willing to accept the disruptions associated with the introduction of a market economy. Svejnar (1989) also stressed the importance of government providing job information and re-training, improving the transportation and telecommunication infrastructure and liberalizing housing so as to assist the unemployed

18
with finding jobs and facilitate their occupational and geographic mobility. Lipton and Sachs (1990) noted that in view of rising unemployment the governments would have to introduce unemployment insurance, job retraining, and credit allocation to individuals who start small businesses. Kornai (1992) pointed out that welfare expenditures were among the largest items in state budgets and that their reduction would be socially extremely painful.
Foreign Capital and Assistance
65. Svejnar (1989) noted that the prosperity of the transition economies was a prerequisite for democracy and political stability. He pointed out that while some areas (e.g., modernization of obsolete technology) could be handled through trade and private capital inflows, other areas such as infrastructure development, ecological improvements, education, and improving the safety of nuclear power plants were primary candidates for financing with foreign assistance. In a review of the early Czechoslovak experience, Dyba and Svejnar (1991) observed that investments by foreign companies into Czechoslovak enterprises, such as those by Volkswagen and Glaverbell, had been occurring and had indeed contributed to modernization and transfer of know-how. Lipton and Sachs (1990) as well as Fischer (1990) discussed the beneficial effects of both foreign investment and foreign management consultants. Brainard (1991) also pointed to the possibilities of foreign capital inflows as a solution to problems such as inadequate managerial know-how, but he cautioned that the position assumed by the transition countries vis a vis foreign investment was going to be crucial for whether foreign capital would flow in or not. Mann (1991) examined various options and concluded that foreign investment through joint ventures would be the best way to promote industrial restructuring. Aslund and Layard (1991) appealed for Western assistance to stabilize the ruble as Russia was about to free prices, introduce a balanced budget and make ruble convertible on current account in the absence of significant foreign exchange reserves. They pointed to the failure of Bulgaria to stabilize its economy during a similar liberalization exercise earlier in 1991. Aslund and Layard’s (1991b) message was echoed by Fischer and Frenkel (1992) who argued that Western aid in the form of a currency-stabilization fund for Russia would be needed if the reform momentum were to develop and be maintained.
66. In practice, Western private and public capital inflows have been very limited. As discussed in Section 2, until recently foreign direct investment inflows were small in all countries except Hungary. Large scale public assistance in the form of a “Second Marshall Plan” was actively discussed in 1990, but it never materialized.
Type II Reforms Privatization and Closures of Large and Medium-size Enterprises 67. Virtually all advisors stressed the need to privatize SOEs, but they differed on the method and speed. It is important to note that even those who otherwise advocated a rapid approach to the transition (e.g., Svejnar 1989; Kornai 1990; Lipton and Sachs 1990) warned that it would take a while to privatize the large state sector and generate capable

19
managers and entrepreneurs. The motivation for privatization ranged from perceived gains in economic efficiency to gains in much needed government revenues, to political appeal (Lipton and Sachs 1990; Gupta and others 2000).
68. The principal arguments for fast privatization were that (a) price liberalization would not give correct incentives in SOEs, (b) the state would not be able to resist intervening in SOEs (Frydman and Rapaczynski 1991; Boycko, Shleifer, and Vishny 1993) and (c) managers would decapitalize firms in the absence of rapid clarification of property rights (Frydman, Phelps, Rapaczynski, and Shleifer 1993). In contrast, Dewatripont and Roland (1992a,b) and Roland (1994) argued that gradual privatization was needed because political backlash to rapid privatization of all firms (and hence closing down of many of them) would be unacceptable and could lead to the need to renationalize. In particular, Dewatripont and Roland’s (1992a,b) first argument for gradualism was that it allowed the government to pursue a strategy that necessitated fewer workers/voters being immediately laid off and also permitted adequate compensation of the ones who were laid off. Their second argument was that rapid privatization brought about major uncertainty that might be unacceptable. Gradualism presumably generates less uncertainty and allows it to be in part resolved before the process is fully launched. As a result, Roland (1994) stressed the need to divide firms into well and poorly performing ones, privatize the good ones and keep these privatized firms under a hard budget constraint (extend no more subsidies to them). As to the bad firms, the state should keep the bad firms for a while, improve its control over these firms and restructure them before privatizing. This line of reasoning of course presupposes that the state is politically strong enough to impose financial discipline on both sets of firms. In a number of countries, including pre-1997 Bulgaria and Russia, the state was unable to do so.
69. In approaching the practical aspect of privatization, a question that arose from the start was how to privatize thousands of state firms in a manner that would be equitable, politically viable and resulting in higher efficiency due to effective corporate governance. There was a major concern that managers could seize state property and claim it as their own through the so called popular privatization as occurred early on in Hungary and to some extent the other Central European economies (Svejnar 1989; Lipton and Sachs 1990). Some also feared that workers would claim ownership of their firms (Hinds 1990; Lipton and Sachs 1990), although others have argued that both economic theory and empirical evidence indicated that this fear was exaggerated (Prasnikar and Svejnar 1991; Ellerman, 1993).
70. Numerous proposals for privatization appeared. Svejnar (1989) proposed a method that combined competitive bidding by foreign investors on majority stakes in state firms with free distribution of significant minority stakes in the form of diversified portfolios to citizens at large, as well as using part of the shares for funding pensions, health benefits and unemployment insurance. Svejnar’s proposal was motivated by the goals of (a) improving economic performance through Western capital and management, (b) ensuring fairness and minimal risk for citizens in the allocation of shares, (c) achieving the maximum price by the government from sales to foreigners while enabling citizens to participate in the process and obtain collateral for bank credit that was both

20
absent and needed to launch small enterprises, (d) preventing asset stripping by managers or other insiders, and (e) contributing to the development of a stock market.
71. Lipton and Sachs (1990) noted that political acceptability of privatization would require at least a partial transfer to stakeholders such as workers, state banks, and local government. They also pointed out that some shares might stay in the Treasury and/or that the government could sell a leveraged firm and become a rentier rather than capitalist. In his comment on Lipton and Sachs (1990), Stiglitz (1990) argued against “give away” of firms, noting the importance of giving proper signal about profitability of firms.
72. Blanchard and others (1991) started from the premise that there was no unique path to privatization or “best” structure of ownership. In particular, they assumed that the establishment of a clear system of ownership claims was urgent to avoid plundering of assets, but that restructuring of firms, by necessity, had to proceed slowly. The need for speed led them to argue that privatization should proceed by distribution rather than sale of ownership claims. They also believed that large shareholders were necessary for efficient management. These two propositions, together with a need for fairness, led them to conclude that the best program would emphasize the role of holding companies, with shares traded on the stock market and the mandate to restructure and divest themselves of firms in their portfolio over some period of time.
73. The closure of persistently loss-making enterprises was advocated by a number of advisors, including Gomulka (1989), Svejnar (1989), and Burda (1993). In practice, relatively few firms were completely closed down, although many scaled down their operations and spun off or closed down individual plants. The one country that moved aggressively to force bankruptcies on loss making firms was Hungary in 1992.
74. Many advisors used the Central and East European experience in formulating their advice for Russian privatization. Hence Aslund (1992) saw Russian privatization as proceeding excellently and advised Yeltsin and Gaidar to stick to their policies. Sachs (1992) reviewed the early Polish privatization experience and warned against a method that gave a veto to every group of stakeholders as well as a method relying on sales of individual firms. He viewed the not-yet-implemented voucher privatization program in Czechoslovakia and the investment fund program in Poland as promising. Given that Russia was facing a much larger scale of privatization (45,000 state enterprise as compared to around 8,000 in Poland), Sachs (1992) argued that Russia needed to adopt across-the-board mechanisms of privatization, in which thousands of industrial enterprises would be moved along the privatization process simultaneously, in a manner that reflected the implicit ownership claims that existed without letting these claims derail the privatization process. He also suggested that for large enterprises the key initial step should be a mass commercialization of enterprises, in which thousands of enterprises would be transformed into joint-stock company form, with the initial claims over the shares reflecting the balance of interests in the enterprises. Once mass commercialization was accomplished and managers and workers received an initial distribution of shares, new supervisory boards could be assigned the responsibility for privatizing another tranche of the shares, sufficient to bring the privatized equity to over 51 percent. Sachs

21
(1992) also noted that the crucial aspect of mass commercialization would be the introduction of corporate governance where no clear governance existed. The Russian government could then divest itself of the remaining minority equity stakes
Promotion of New Firms
75. From the start, most advisors stressed the importance of assisting the creation and nurturing of the new private firms. Svejnar (1989) used the successful experience of China in the 1980s to argue that one of the most important goals of the transition was the encouragement of entry of new firms. Since China’s success stemmed from the rapid growth of township, village and private enterprises, Svejnar (1989) advocated a pragmatic (non-ideological) approach that would permit new firms with various forms of ownership and control. He also argued for the availability of easily accessible and competitively priced credit for the new firms. Lipton and Sachs (1990) noted that the private sector had been unable to tap adequately credit from state banks and advised that governments encourage the formation of financial institutions catering to the needs of small businesses. Kornai (1990) argued that policy emphasis should be placed on the creation and promotion of small- and medium-sized businesses.
76. In practice, most Central and East European countries carried out privatization of small and medium-sized firms. In varying degrees, they also supported access to financing by these firms. However, econometric evidence by Lizal and Svejnar (2001) suggests that small and medium-sized firms faced credit constraints throughout the 1990s. In the Balkans and CIS, restrictions often appear to have remained against the creation and expansion of new firms. Pissarides and others (2000) report that financing problems, including high interest rates, hinder expansion and that these firms also face problems in getting land, office space, and buildings. At the same time, the problem does not appear to have been just a lack of credit, but also a lack of information about the availability of special credit lines, which were occasionally unused.
77. In retrospect, the establishment and growth of small and medium-size firms (start-ups), rather than privatization of existing SOEs, appears to have been the major driving force of the transition in the economies that generated economic growth in the 1990s (Gomulka 1994; Jurajda and Terrell 2002). In contrast, in countries that experienced longer decline, such as Russia, the development of SMEs was often stunted by policies of mayors and other government officials. The available evidence therefore suggests that placing more policy emphasis on the development of new firms would have accelerated the transition.
Development and Enforcement of Laws and Regulations
78. Contrary to the currently prevailing view, a number of early advisors stressed the importance of establishing and enforcing a market oriented legal framework that would establish a level playing field, create well defined property rights, permit the enforcement of contracts, and limit corruption. Svejnar (1989) stressed that the “first step in the transformation process is the establishment of a clear set of laws on economic activity.” He argued that defining the rules of the (new) game was essential for reducing

22
uncertainty and providing an environment that would be conducive to economic decision-making. He also emphasized the importance of having incentives for achieving economic efficiency embedded in the legal system and he recommended that the drafting of laws be carried out as a joint process between lawyers and economists. In the context of the relatively stable economic environment in Czechoslovakia, Svejnar (1989) proposed that market-oriented laws and regulations be passed and institutionally anchored before the principal reform measures, such as price and exchange rate liberalization and privatization, would be introduced.
79. Litwack (1991) also stressed that a stable legal framework was a prerequisite for successful economic reform. He argued that the experience of capitalist countries demonstrated that a secure economic legality depended on a web of social traditions and expectations that would be hard to create quickly in the transition economies. Examining the first two years of the reform at the micro level, Svejnar (1991) brought attention to a counterintuitive development – while all the countries of Eastern Europe were striving to join the European Community, none of them decided to adopt a (presumably consistent) legal framework from one of the Western European countries or from the 1992 European Community framework. Svejnar (1991) warned that this de novo creation of an entire legal system was resulting in an incomplete and at times inconsistent set of economic laws.
80. Aslund (1992c) carried out an early assessment of the main barriers to the transition and identified as key problems the absence of secure property rights and the poor quality of laws brought about by the shortage of good lawyers in the transition economies.
81. As the transition progressed, institutions such as the World Bank, USAID, and EBRD began providing legal advice, and the American Bar Association (ABA) launched a major initiative to train judges. The latter initiative has resulted in the creation of the Central and East European Legal Institute (CEELI) that operates under the ABA sponsorship with funds from USAID and other institutions.
Development of Institutions
82. Svejnar (1989) stressed that the development of institutions conducive to the functioning of a market system was a much-needed complementary measure to the establishment of an effective legal framework. He argued that some institutions, such as the tax collection offices, needed to be established simultaneously with the passage of the laws, while others had to be developed immediately thereafter. Murrell (1991) argued that efforts at creating institutions were essential, but he noted that there was no unified economic theory on how to construct the institutions that were central to the success of capitalist economies. Ellerman (1993) pointed out the difference between a rapid (big bang) and incremental (gradual) approach to institutional change and argued in favor of the latter because it would generate better and more incentive-compatible institutions.
83. Overall, the need to develop effective, market-friendly institutions was generally acknowledged (see, for example, the 1996 World Bank World Development Report and

23
annual Transition Reports of the EBRD). The problem is that the development and functioning of the relevant institutions has often lagged in practice. This reflected in part inadequate emphasis, and in part the difficulty of establishing well-functioning institutions.
In-depth Development of a Viable Banking Sector
84. Soon after the dissolution of the monobank system, problems inherent in the underdeveloped capital market started becoming evident. Calvo and Frenkel (1991) noted that the underdeveloped capital markets inhibited the effectiveness of price reform, monetary and credit policies, and trade liberalization. As a result, they argued for policies that would remove capital market imperfections. Like Brainard (1991), they focused on “cleaning” the balance sheets of enterprises and banks of bad debts and argued that this process should be carried out in a way that signals a credible government commitment to reform, namely by socializing the debt—swapping government obligations for the claims that banks and creditor firms hold against other enterprises.
85. Svejnar (1991) noted that the first round of efforts to convert the monobank system into a system consisting of a central bank and competitive and functioning commercial banks had so far failed. The newly created commercial banks were undercapitalized, lacked trained loan officers and other professionals, and their inherited assets were often in the form of loans to loss-making firms. Frequently, they were unwilling or logistically unable to provide credit to new private firms.
86. Sachs (1992) argued on the basis of Poland’s 1990–91 experience that large state banks should be rapidly commercialized and privatized because they play a vital role in the governance of firms as creditors and equity holders.
87. In practice, the transformation of the new banking system into a viable and performing system has been one of the most difficult aspects of the transition process. After initial clean-up operations most commercial banks accumulated new bad loans and banking crises erupted in virtually all the transition economies. Unable to cope with the problem, Hungary, Czech Republic and Poland have been the first countries that decided to sell virtually all domestic banks to large Western banks. The hope of this privatization into foreign hands is that the Western banks will bring in quality service and competitive interest rates.
Labor Market Institutions and Regulations
88. Most advisors predicted a rapid rise of unemployment, which was a non-existent phenomenon in the Soviet bloc countries. While acknowledging its negative social impact, many analysts discussed the beneficial expected economic effects of unemployment. Gomulka (1989) for instance argued that Poland “needs unemployment to create competitive labor markets to produce greater labor mobility, work discipline and the control of wage inflation.” Others have focused on the need to create institutions that would promote labor mobility from low to high productivity (and wage) jobs, while protecting workers during unemployment. As mentioned above, Svejnar (1989) stressed

24
the importance of government providing job information and re-training so as to assist the unemployed with finding jobs and facilitate their occupational and geographic mobility. Blanchard and others (1991) argued for generous short-term (e.g., six-month) unemployment benefits, with the generosity declining substantially thereafter. Burda (1993) noted that unemployment was needed to allow the emergence of the new private sector since workers have to move from the old state sector to the newly created firms.
89. A number, but not all, advisors addressed the issue of trade unions and the best system of industrial relations. Svejnar (1989) noted that labor and human capital were going to be the key to growth in the resource-poor transition economies and predicted that one should expect the emergence of economically oriented trade unions and possibly some forms of worker participation in management. He stressed the need to treat these institutions in such a way that they would be cooperative since this would reduce industrial conflict, increase worker identification with the firms and thus increase productivity through lower quits and higher accumulation of firm-specific human capital. In order to enable the survival of weaker firms he argued for the introduction of firm- (rather than industry-) specific bargaining systems. Moreover, to reduce firms’ propensity to resort to layoffs and thus create unemployment in the presence of shocks, Svejnar (1989) argued in favor of introducing (Vanek-Weitzman type) profit sharing schemes that would make part of worker compensation (and hence labor cost) cyclical.
90. Burda (1993) argued that emerging unemployment will offset a growing imbalance in bargaining power of workers over managers in the aftermath of central planning and pointed out that unemployment provides a “disciplining device” to raise effort and productivity to Western levels. He also stressed that the special nature of the transition process necessitated the creation of new labor market institutions that differed from those in advanced industrial countries. He argued for corporatist-style bargaining structures and tighter administration of unemployment benefits.
91. In practice, most Central and East European economies introduced or resurrected unemployment and other social safety net policies that strongly resembled those found in Western Europe (Burda 1993; Ham, Svejnar, and Terrell 1998). The level of benefits was originally very high and it was gradually scaled down to more modest but still fiscally very demanding levels. The industrial relations system was mostly recommended by the International Labor Organization, and it often translated into industry-wide bargaining in a tripartite (management-labor-government) framework.
Retirement System
92. The Central and Eastern European countries entered the transition period with publicly funded, pay-as-you-go pension systems, almost universal coverage of the population, low retirement ages (on average 60 for men and 55 for women), high and growing dependency ratios, high expenditure and contribution levels, high statutory replacement rates, and perverse redistribution of benefits. The result of the high dependency ratio was that the system was very costly and yet offered relatively low benefits. With an aging population, the tax burden would become increasingly heavier.

25
93. A number of advisors offered views on how to face this problem and restructure the retirement system. Diamond (1992) for instance described in depth issues involved in addressing the short- and long-run financial concerns, as well as institutional design. In doing so he focused on Poland’s institutional framework and drew on the Chilean system. World Bank (1994) provided an in-depth follow-up analysis and recommendations.
94. In practice, several countries have already moved to raise the retirement age and supplement the public retirement system with voluntary private schemes. However, most have delayed this painful and socially unpopular reform. With the significant aging of the population, the problem is being exacerbated over time. The current policy discussion is focusing on the desirability of allowing significant immigration of young individuals as a means of stemming the demographic problem.
Concluding Observations on Actual Policies
95. In general, the ability of transition governments to carry out Type I and Type II reforms turned on two factors: their ability to collect taxes and finance public programs, and their ability to minimize corruption and rent-seeking behavior. Type I reforms aimed at reducing subsidies and centrally planned regulation. Most transition governments quickly abolished central planning. However, a number of them, especially in CIS, had great difficulty in setting up a reliable tax system. For these governments, reducing subsidies and the scope of government was almost forced upon them. Type II reforms emphasize not only the withering away of an omnipresent dictatorial state, but also a creation of an efficient state apparatus that provides a level playing field for and regulation of the market economy. Type II reforms hence require that governments have some resources, enforce competition and market-friendly laws, and that they not be dominated or captured by special interests. In this area, most transition economies have so far failed and have a long way to go.
96. While all the differences across countries in Type II reforms are difficult to capture in a brief account, in what follows I give a sense of the range of differences across several areas: privatization, banking reform, labor and social institutions, and a market-oriented legal system.
97. Remarkable differences exist across the transition economies in the adopted strategy of privatizing large and medium-size firms. Poland and Slovenia, while quick to undertake Type I reforms, moved decidedly slowly in terms of privatization of state-owned enterprises, relying instead on their commercialization and on the creation of new private firms. Estonia and Hungary were equally vigorous Type I reformers, but they also proceeded assiduously and surprisingly effectively with privatization of individual state-owned enterprises by selling them one-by-one to outside owners. As mentioned above, this method of privatization was originally viewed by many strategists and advisors as too slow. Yet it provided much needed managerial skills and external funds for investment in the privatized firms, and generated government revenue and effective corporate governance. It also turned out to be relatively fast when carried out by determined governments. Russia and Ukraine are examples of countries that opted for rapid mass privatization and relied primarily on subsidized management-employee

26
buyouts of firms. This method had the advantage of speed, but it has led to poor corporate governance in that management usually was not able or willing greatly to improve efficiency. The method also did not generate new investment funds and skills, and it provided little revenue for the government. Finally, the Czech Republic, Lithuania, and, to a lesser extent, Slovakia carried out rapid equal-access voucher privatization, whereby a majority of shares of most firms were distributed to citizens at large. While this approach may have been the best in terms of fairness and one of the best in terms of speed, this mass privatization program did not generate new investment funds, nor did it bring revenue to the government. Instead, it resulted in dispersed ownership of shares and together with a weak legal framework it imposed little control on management and resulted in poor corporate governance. The poor corporate governance resulted in the management or majority shareholders appropriating profits or even assets of the firms (tunneling) at the expense of the minority shareholders.
98. In the development of a banking system, virtually all countries rapidly abolished the monobank system as part of Type I reforms. The development of a new banking sector became of major importance for the availability of credit to existing and newly formed firms. Some countries, such as Russia, allowed spontaneous growth of new banks from the bottom up, resulting in the creation of hundreds of banks virtually overnight. In Central and Eastern Europe, the process was much more government-controlled, but even there dozens of small banks rapidly emerged in countries like Czech Republic and Poland. While the banking systems differed in various ways, they shared some discouraging patterns. Many of the small banks quickly collapsed. In most countries the large banks started the transition with a sizable portfolio of non-performing enterprise loans and, upon restructuring, they rapidly accumulated a large number of new non-performing loans. The large banks survived primarily because they were "too large to fail" and governments bailed them out. The need to carry out repeated bailouts of banks has since the mid-1990s led Hungary, Czech Republic, and Poland to privatize virtually all domestic banks by letting them come under the control of large Western banks. Central Europe has thus become a unique laboratory where one will be able to observe the effects of an attempt to introduce competitive Western banking system without local banks.
99. The countries have differed in the nature and speed of further development of labor and social regulations and institutions. By the end of 1991, all the Central and East European countries developed relatively well-functioning unemployment compensation and social security benefit schemes, with the originally generous benefits becoming somewhat more modest over time (Ham, Svejnar, and Terrell 1998). In Russia and the other countries of the CIS, the official benefits were low to start with and decreased dramatically in real terms over time—and even the low official benefits were often not paid.
100. Virtually no country succeeded in rapidly developing a legal system and institutions that would be highly conducive to the preservation of private property and to the functioning of a market economy, although some countries did much better than others. In retrospect, this lack of a market-oriented legal structure appears to have been the Achilles heel of the first dozen years of transition. Many policymakers

27
underestimated the importance of a well-functioning legal system, or believed too readily that free markets would take care of all major problems. In addition, many newly rich individuals and groups in the transition economies—especially those who have contributed to the corruption of public officials—did not desire to have a strong legal system established. Finally, lawyers in the former Soviet bloc countries have tended not to be proposing legal reforms and spontaneously drafting bills and other reform measures, while economists were a fertile source of reform proposals. Overall, the countries that have made the greatest progress in limiting corruption and establishing a functioning legal framework and institutions are the central European and Baltic countries, with the partial exception of the Czech Republic and Slovakia. In recent years, an important impetus for carrying out legal and institutional reforms in many of these countries has been the need to develop a system that conforms to that of the European Union as a prerequisite for accession. The required terminal conditions, as opposed to initial conditions, thus gradually became an important determinant of progress in reforms.
4. Were Alternative Approaches and Outcomes Possible?
101. Most observers agree that the performance of the former Soviet bloc economies during the first twelve years of the transition has been relatively poor. What went wrong and what went right? A major problem for the transition economies was clearly the initial recession that set them back relative to the advanced economies. In Russia, Ukraine, and other CIS countries, this depression lasted almost a decade. In view of this initial handicap that was shared to varying degrees by all transition economies except China and Vietnam, I start this section with a discussion of the causes of the economic decline.
102. The depth and length of the early transition depression was unexpected, given that the countries were presumably switching from a less to a more efficient economic system. A number of explanations have been offered: tight macroeconomic policies (Bhaduri and others 1993; Rosati 1994); a credit crunch stemming from the reduction of state subsidies to firms and a rise in real interest rates (Calvo and Coricelli 1992); disorganization among suppliers, producers and consumers associated with the collapse of central planning (Blanchard and Kremer 1997; Roland and Verdier 1999); a switch from a controlled to an uncontrolled monopolistic structure in these economies (Li 1999; Blanchard 1997); difficulties of sectoral shifts in the presence of labor market imperfections (Atkeson and Kehoe 1996); and the dissolution in 1990 of the Council for Mutual Economic Assistance (CMEA), which governed trade relations across the Soviet-bloc nations. While each explanation appears to contain a grain of truth, none is in itself completely convincing. All countries have gone through the decline, yet cross-country differences in initial conditions, policies and nature of reform are substantial enough to make one question the universal applicability of any single explanation. Moreover, no explanation has strong empirical support across the board.
103. The next question is what factors account for the persistent growth in Poland, Hungary, Slovakia, and Slovenia since the early- to mid-1990s, as compared to the recession experienced in the second half of the 1990s by the Czech Republic, Bulgaria

28
and Romania, and the continuous decline in Russia and the other CIS countries? Again, there is no single explanation and it is interesting to note that geography alone does not explain the outcomes since the western-most country, Czech Republic, did much worse in the second half of the 1990s than countries further east such as Hungary, Poland and Slovakia. In fact, as may be seen from figure 1, the evolution of Czech GDP in the second half of the 1990s resembles that of Bulgaria and Romania.
104. The extent to which countries pursued a complete or incomplete set of Type II reforms provides some explanatory power. For instance, the overall experience suggests that rapid mass privatization in the absence of a strong legal system has negative effects on performance (e.g., Czech Republic, Russia, and Ukraine), while the absence of rapid privatization may not detract from growth if the countries expose the state-owned enterprises to competition and a genuine risk of financial failure, and if they create new private firms (e.g., Poland and Slovenia).
105. The four leading transition economies shown in figure 1—Poland, Slovenia, Hungary, and Slovakia—have steadily pursued a relatively complete set of reforms, with the exceptions of large-scale privatization in Poland and Slovenia and the development of a strong legal framework in Slovakia. Among the intermediate cases, the Czech Republic has been a clear leader in terms of rigorous Type I reforms, but it failed to carry out sufficient Type II reforms, especially in the area of legal and banking sector development. This failure, together with the reliance on mass voucher privatization, resulted in weak corporate governance, managers who diverted corporate assets to their own uses, inability to enforce contracts, and ultimately a credit crunch during the major banking crisis of the mid-to-late 1990s.
106. Upon reflection, it is obvious that the success of mass privatization is contingent on a functioning legal and institutional system, since millions of financially inexperienced citizens suddenly become small and highly dispersed minority shareholders of many firms. In the Czech and, to a lesser extent, the Slovak cases, there was virtually no legal protection of minority shareholders. As a result, enterprise managers, as well as managers of investment funds that held significant blocs of shares in given firms, frequently appropriated the firm’s profit and stripped its assets (i.e., tunneled the firm) for their own private gain rather than restructuring it for the long term benefit of shareholders and the society at large. The tunneling was a sensible strategy for those in control of firms since the absence of a legal system was presumably a temporary phenomenon. There were many ways in which this tunneling was carried out, including the use of transfer pricing through related companies, private trading in securities at artificially low or high prices, and concluding unfavorable options and futures contracts (Black, Kraakman and Tarassova 1999). As the practice spread, foreign investors fled, thus further reducing the liquidity of the emerging capital market. The lack of a functioning legal system also prevented Czech banks from enforcing contracts. The banks therefore increased the collateral requirements, in some cases up to 200 percent of the value of the loan. However, lengthy bankruptcy proceedings allowed the debtor to strip assets to the point where the banks were reluctant to initiate bankruptcy proceedings, relying instead on jawboning and eventually also highly discounted out-of-court settlements. In the end, the banks severely reduced lending to the private sector, thus

29
bringing about the financial crisis of the mid-to-late 1990s. The Czech government also maintained an overvalued fixed exchange rate and its central bank pursued perhaps overly tight monetary policy.
107. After a relatively promising start, Bulgaria and Romania encountered problems in maintaining Type I measures and implementing Type II reforms. Bulgaria has succeeded in re-imposing macroeconomic controls and its economy has resumed moderate growth since 1998. Romania has had a more difficult time in reaching a political consensus and in re-embarking on a consistent set of integrated reforms. Russia, like other CIS countries, has experienced similar shortcomings in its Type II reforms, but its situation has been further aggravated by difficult initial conditions (political and economic disintegration of the Soviet Union, attempted coup, greater presence of organized crime, etc.), less vigorous pursuit of Type I reforms, and a more serious problem of loss of state control that has resulted in the spread of aggressive rent seeking and corruption.
108. A key observation is that the transition countries further east have on average performed worse than their more Western counterparts. This pattern suggests that geography-related initial conditions have been important in the transition process. The central European countries, located most to the west among the transition economies, have historically shared the same alphabet and religions, had similar educational and bureaucratic systems, and intensively traded and otherwise interacted with countries in Western Europe. They, together with the Balkan and Baltic countries, were under the Soviet system for only about four decades, as compared to seven decades in the CIS countries. Finally, they were the first to aspire and be encouraged to prepare for entry to the European Union. The physical proximity and historical belongingness to Europe hence seem to have provided an important advantage for the “Western” transition economies in moving from the Soviet-style system to a democratic and market-oriented system. However, as noted above, my assessment is that while these geographically-related initial conditions are important, they do not provide the whole story. The fact that the Western-most transition economy, Czech Republic, performed worse than others in the second half of the 1990s, and that differences in performance have been observed among the Baltic countries, indicates that geography does not provide a complete explanation and that Type II policies do matter.
109. Given the diversity of advice provided in the early stages of the transition (see Section 3), a number of alternative policies could obviously have been pursued. Within the class of Type I reforms, too much emphasis was in my view placed on multiple anchors (monetary and fiscal policies, fixed exchange rate, and incomes policies), especially in countries that did not suffer from high or hyper inflation. As stressed in Svejnar (1989), there was a recognized trade-off between using incomes policies and fixed exchange rate as additional tools over and above monetary and fiscal measures to induce macro stability, rather than allowing wage and exchange rate flexibility to induce restructuring at the micro level through reallocation of labor, tolerable interest rates, and opening up to world competition. This tradeoff in a way represented a clash of macro and micro views at the time, and the macro advocates prevailed.

30
110. Calvo’s (1990) warning against excessive monetary restriction that could result in a credit crunch and hence a recession appears accurate, since in some countries the GDP decline of the early 1990s was probably brought about in part by the restrictive monetary policy.
111. While exhilarating politically, the rapid dismantling rather than restructuring of CMEA appears to have been economically costly for the transition economies. While Western advisors did not argue for the elimination of CMEA, and many pointed out the benefits of maintaining some form of trading area, more advice probably could have been given to the policymakers in the former Soviet bloc on how to restructure CMEA and prevent the collapse of trade within the region.
112. While trade between the Central and Eastern European transition economies and the European Community grew rapidly, the transition countries faced numerous anti-dumping procedures and safeguards. Given the small size of the transition countries relative to the EC and the urgent need for the transition economies to reorient trade, a more open-arms approach on the part of the EC would have been beneficial for the transition economies, and it would have imposed only limited cost on the Western European countries.
113. Western assistance was in general limited. While discussions took place in the United States and Europe in 1990 about the desirability of mounting a second Marshall plan, a major assistance program was never launched. Instead, limited assistance was provided on a bilateral and multilateral basis. There were also specific initiatives carried out to assist in the development of specific markets and institutions, such the financial markets (USAID), labor legislation and unemployment and social security systems (ILO) and lending for the development of small and medium-size firms (EBRD). They appear to have been successful in that they usually established the legal and institutional features, although the practical implementation often lagged, especially in the less developed transition economies. Without Western guarantees, private capital also moved in selectively and slowly. As a result, in the first half of the 1990s, the total inflow of foreign direct investment into all the former Soviet bloc countries fell short of the amount flowing to Singapore. In sum, there is no doubt that the strategic decision of the Western countries not to launch a major reconstruction program for the former communist countries had a negative effect on their ability to avoid a deep recession and start catching up with the advanced market economies.
114. Within the class of Type II reforms, where governments’ achievements varied dramatically across countries, the issue of speed and sequencing was obviously much more important. My personal view, expressed already in 1989, is that the development of a market-oriented legal system and institutional framework should have preceded the other structural reforms. If this sequencing were not possible, the development of a market-oriented legal system and institutional framework should have at least received top priority within the cluster of initial reforms that were being carried out simultaneously. Evidence to date indicates that countries that placed emphasis on the development of a functioning legal framework and corporate governance of firms (e.g.,

31
Hungary, Poland, and Slovenia) have performed better than those that did not (e.g., Czech Republic, Russia, and Ukraine).
115. The speed and form of privatization of medium and large enterprises depends on the underlying political economy. If rapid and large-scale privatization constitutes the only politically acceptable option, as some have argued was the case in Russia, then this political imperative may dominate the economic benefit-cost calculus. In the absence of such an imperative, however, numerous options existed and still exist. Evidence indicates that large-scale privatization can be handled in a variety of ways, or even delayed, as long as the government is able to make state-owned firms face the discipline of needing to earn their way without government bailouts and as long as new firms appear through new creation, breakups of old firms, and foreign investment. Interestingly, while this was by and large achievable in countries such as Poland and Slovenia, Russian policymakers in the early 1990s felt that without privatization one could not impose discipline on state-owned firms. Hungary also dispelled the notion that a country could not sell firms one-by-one within a reasonable period of time. Thus, while the rapid large-scale privatization in the Czech Republic ended in 1995, Hungary reached a similar stage of privatization by 1996. Moreover, the quality of corporate governance has on average been better in Hungary than in the Czech Republic. Overall, evidence form the 1990s indicates that except in extreme circumstances, countries can choose from a variety of forms and speeds of privatization.
116. While advisors stressed and government officials by and large acknowledged that newly created firms could play an important part in the transition, the importance of supporting the development of these firms was in general greatly underestimated. As it turned out, de novo firms have played a major part in several (mostly Central European) economies and their contribution to economic growth and employment could have been even greater had credit and other policies been more supportive. The implication is that policy could have been and still should be geared much more toward the support for the creation of new firms.
117. A number of governments started the transition with a degree of skepticism toward foreign investment. While Western advisors generally stressed the beneficial aspect of foreign investment, in retrospect it appears that even stronger advice should have been given in this area. Firms with Western capital tend to do better than local firms and they have had beneficial spillover effects. Moreover, while there is a selectivity problem in that Western firms tend to invest in better local firms, available evidence suggests that the selectivity effect does not dominate.
118. Western advice on the development of the banking sector was generally sound. It identified the main likely areas of trouble – the burden of inherited non-performing loans, the danger of accumulating new bad loans, the lack of banking skills and accountability, corruption of banking officials, and the inadequate capitalization and supervision of the banks. The advisors stressed the need to (a) clean the banks’ balance sheets of the non-performing loans, (b) socialize the debt, (c) supervise the banks, and (d) capitalize and privatize the banks so as to avoid the need for repeated bailouts. As it turned out, the advice was not heeded and most countries have encountered repeated banking crisis. In

32
Central Europe, the governments realized that they were unable to prevent these crises from recurring and they eventually decided to privatize their commercial banks to large Western banks.
119. Western advice was also quite adequate in the area of labor market institutions and regulation. The subsequent institutional developments reflected primarily the advice given by the International Labor Organization and the fiscal conditions of the individual countries. As with other legal developments, in countries where problems arose, the shortcomings were more in the area of compliance than in the absence of rules and regulations on the books.
120. Finally, it is important to re-iterate that most developments in the transition economies have been conditioned by the ability and willingness of government to collect adequate but not excessive tax revenues and, similarly, finance adequate but not excessive social programs. The patterns of public revenues and expenditures reflect local factors as well as the advice that the transition economies received from Western countries and institutions. Let me conclude the discussion by illustrating that diversity of official Western advice can lead to potential problems in coordinating multiple goals. The World Bank and the International Monetary Fund have generally advised the transition economies to aim for balanced government budgets, or to run only small budget deficits, while increasing the size of the private sector and reducing the role of the government. The European Union (EU) also emphasized low budget deficits and imposed a 3 percent upper bound on the size of the deficit relative to GDP as a precondition for entry into the Union. The EU has been also requiring, however, that Central and Eastern European countries applying for EU membership adopt a number of relatively costly social programs and structural measures that form the essence of the acquis communautaire. This has placed upward pressure on government expenditures and through the (relatively) balanced budget constraint also on the need to raise tax revenue and maintain relatively large share of government expenditures in GDP. Greater policy coordination among the donors would have facilitated the policy work of the transition governments in this and other areas.

-50
-40
-30
-20
-10010203040
1989
1990
1991
1992
1993
1994
1995
1996
1997
1998
1999
2000
2001
Rus
sia
Bulg
aria
Cze
ch
Rep
ublic
Slov
akia
Hun
gary
Slov
enia
Pola
nd
OEC
DFi
gure
1R
eal G
DP
Perc
enta
ge C
hang
e In
dex
(198
9 =
Bas
e)
Sour
ces
: Willi
am D
avid
son
Inst
itute
bas
ed o
n O
ECD
Eco
nom
ic O
utlo
ok V
ol. 6
9 Ju
ly 2
001,
EBR
D T
rans
ition
Rep
ort 2
001
Upd
ate,
and
Dav
idso
n In
stitu
te s
taff
calc
ulat
ions
.
Rom
ania
+ + ++

Rea
l GD
P In
dex
(198
9=10
0)So
urce
: EBR
D T
rans
ition
Rep
ort 2
001
Upd
ate,
OEC
D E
cono
mic
Out
look
Vol
. 69
July
200
1, a
nd W
DI s
taff
calc
ulat
ions
19
8919
9019
9119
9219
9319
9419
9519
9619
9719
9819
9920
0020
01C
zech
Rep
ublic
0-1
.2-1
2.66
08-1
3.09
75-1
3.01
059
-11.
0968
3-5
.851
539
-1.3
3241
3-2
.319
089
-4.4
6806
9-5
.232
325
-2.2
9452
71.
1251
65H
unga
ry0
-3.5
-14.
9835
-17.
6190
1-1
8.11
33-1
5.73
858
-14.
4746
6-1
3.36
283
-9.3
7752
3-4
.937
021
-0.6
5918
74.
5065
359.
2093
29Po
land
0-1
1.6
-17.
788
-15.
6504
9-1
2.44
521
-7.8
9235
7-1
.444
822
4.56
7044
11.7
8217
17.1
4771
21.9
5077
26.9
5075
31.3
9403
Slov
akia
0-2
.5-1
6.73
5-2
2.14
723
-25.
0277
8-2
1.35
414
-16.
0848
7-1
0.88
213
-5.3
5682
-1.4
7644
90.
3954
982.
6041
995.
6823
25Sl
oven
ia0
-4.7
-13.
1817
-17.
9567
1-1
5.65
949
-11.
1894
5-7
.548
215
-4.3
1240
20.
0892
273.
8926
189.
0872
4914
.214
3518
.782
92Bu
lgar
ia0
-9.1
-19.
7353
-25.
5946
2-2
6.71
07-2
5.39
15-2
3.82
472
-32.
1278
2-3
6.81
1-3
4.59
939
-33.
0297
7-2
9.68
126
-26.
5169
2R
oman
ia0
-5.6
-17.
7776
-25.
0131
7-2
3.88
837
-20.
9200
2-1
5.30
534
-12.
0022
4-1
7.37
011
-21.
8321
2-2
4.33
349
-23.
1228
3-2
1.20
09R
ussi
a0
-4-8
.8-2
2.02
4-2
8.80
791
-37.
8493
1-4
0.39
749
-42.
4835
7-4
2.02
344
-44.
6903
6-4
2.75
453
-38.
3466
3-3
6.25
041
OEC
D0
3.1
4.33
726.
5282
818.
0196
7711
.476
3114
.263
2117
.691
1121
.810
325
.099
1829
.102
3534
.395
5537
.083
46
GD
P (R
eal G
row
th R
ate) 19
8919
9019
9119
9219
9319
9419
9519
9619
9719
9819
9920
0020
01C
zech
Rep
ublic
-1.2
-11.
6-0
.50.
12.
25.
94.
8-1
.0-2
.2-0
.83.
13.
5H
unga
ry-3
.5-1
1.9
-3.1
-0.6
2.9
1.5
1.3
4.6
4.9
4.5
5.2
4.5
Pola
nd-1
1.6
-7.0
2.6
3.8
5.2
7.0
6.1
6.9
4.8
4.1
4.1
3.5
Slov
akia
-2.5
-14.
6-6
.5-3
.74.
96.
76.
26.
24.
11.
92.
23.
0Sl
oven
ia-4
.7-8
.9-5
.52.
85.
34.
13.
54.
63.
85.
04.
74.
0Bu
lgar
ia-9
.1-1
1.7
-7.3
-1.5
1.8
2.1
-10.
9-6
.93.
52.
45.
04.
5R
oman
ia-5
.6-1
2.9
-8.8
1.5
3.9
7.1
3.9
-6.1
-5.4
-3.2
1.6
2.5
Ukr
aine
-3.4
-11.
6-1
3.7
-14.
2-2
3.0
-12.
2-1
0.0
-3.0
-1.9
-0.4
6.0
3.5
Rus
sia
-4.0
-5.0
-14.
5-8
.7-1
2.7
-4.1
-3.5
0.8
-4.6
3.5
7.7
3.4
OEC
D3.
11.
22.
11.
43.
22.
53.
03.
52.
73.
24.
12.
0
Inde
x 19
89 =
100
1989
1990
1991
1992
1993
1994
1995
1996
1997
1998
1999
2000
2001
Cze
ch R
epub
lic10
098
.80
87.3
486
.90
86.9
988
.90
94.1
598
.67
97.6
895
.53
94.7
797
.71
101.
13H
unga
ry10
096
.50
85.0
282
.38
81.8
984
.26
85.5
386
.64
90.6
295
.06
99.3
410
4.51
109.
21Po
land
100
88.4
082
.21
84.3
587
.55
92.1
198
.56
104.
5711
1.78
117.
1512
1.95
126.
9513
1.39
Slov
akia
100
97.5
083
.27
77.8
574
.97
78.6
583
.92
89.1
294
.64
98.5
210
0.40
102.
6010
5.68
Slov
enia
100
95.3
086
.82
82.0
484
.34
88.8
192
.45
95.6
910
0.09
103.
8910
9.09
114.
2111
8.78
Bulg
aria
100
90.9
080
.26
74.4
173
.29
74.6
176
.18
67.8
763
.19
65.4
066
.97
70.3
273
.48
Rom
ania
100
94.4
082
.22
74.9
976
.11
79.0
884
.69
88.0
082
.63
78.1
775
.67
76.8
878
.80
Rus
sia
100
96.0
091
.20
77.9
871
.19
62.1
559
.60
57.5
257
.98
55.3
157
.25
61.6
563
.75
OEC
D*
100
103.
1010
4.34
106.
5310
8.02
111.
4811
4.26
117.
6912
1.81
125.
1012
9.10
134.
4013
7.08

Figu
re 2
Fore
ign
Dir
ect I
nves
tmen
t Per
Cap
ita
( net
inflo
ws i
n U
S D
olla
rs re
cord
ed in
the
bala
nce
of p
aym
ents
, per
cap
ita)
0
100
200
300
400
500
600 19
9219
9319
9419
9519
9619
9719
9819
9920
0020
01Cze
ch
Rep
ublic
Slov
akia
Pola
nd
Hun
gary
Bul
garia
Rom
ania
Slov
enia
Rus
sia
Sources
: Willi
am D
avid
son
Inst
itute
bas
ed o
n EB
RD
Tra
nsiti
on R
epor
t 200
1 U
pdat
e an
d D
avid
son
Inst
itute
sta
ff ca
lcul
atio
ns.

Fore
ign
Dire
ct In
vest
men
t (n
et in
fow
s re
cord
ed in
the
bala
nce
of p
aym
ents
)EB
RD
Tra
nsiti
on R
epor
t 200
1 U
pdat
e1989
1990
1991
1992
1993
1994
1995
1996
1997
1998
1999
2000
2001
Bulg
aria
na4
5642
4010
598
138
507
537
806
975
900
Cze
ch R
epub
licna
nana
983
563
749
2,52
61,
276
1,27
53,
591
6,23
44,
477
6,00
0H
unga
ry18
731
11,
459
1,47
12,
328
1,09
74,
410
1,98
71,
653
1,45
31,
414
1,65
01,
650
Pola
nd0
117
284
580
542
1,13
42,
741
3,04
14,
966
6,34
89,
299
8,00
0R
oman
ia
-18
3773
8734
141
741
51,
267
2,07
91,
070
1,00
01,
200
Rus
sia
500
1,66
31,
665
4,03
61,
734
746
2,00
02,
500
Slov
akia
1024
8210
010
723
619
419
984
374
701
1,50
02,
000
Slov
enia
-14
-2-4
111
311
113
118
318
834
025
014
413
310
0
Popu
latio
n in
mil
Bulg
aria
8.6
8.5
8.5
8.4
8.4
8.3
8.3
8.2
8.2
8.1
8.1
Cze
ch R
epub
lic10
.310
.310
.310
.310
.310
.310
.310
.310
.310
.310
.3H
unga
ry10
.310
.310
.310
.210
.210
.210
.110
.110
.110
.010
.0Po
land
38.3
38.4
38.5
38.6
38.6
38.6
38.7
38.7
38.7
38.7
38.7
Rom
ania
23
.222
.822
.822
.722
.722
.622
.622
.522
.522
.322
.3R
ussi
a14
8.7
148.
714
8.7
148.
414
8.3
148.
014
7.5
146.
414
5.7
145.
414
5.4
Slov
akia
5.3
5.3
5.3
5.3
5.4
5.4
5.4
5.4
5.4
5.4
5.4
Slov
enia
2.0
2.0
2.0
2.0
2.0
2.0
2.0
2.0
2.0
2.0
2.0
1992
1993
1994
1995
1996
1997
1998
1999
2000
2001
Bulg
aria
4.94
1176
4.72
8132
12.4
5611
.695
16.5
4761
.232
65.2
4998
.293
120.
0711
0.84
Cze
ch R
epub
lic95
.436
8954
.660
1972
.718
245.
2412
3.88
123.
7934
8.64
605.
2443
4.66
582.
52H
unga
ry14
2.67
722
6.01
9410
7.55
432.
3519
4.8
163.
6614
3.86
140
165
165
Pola
nd7.
3958
3315
.064
9414
.041
29.3
7871
.01
78.5
7912
8.32
164.
0324
0.28
206.
72R
oman
ia
3.20
1754
3.81
5789
15.0
2218
.37
18.3
6356
.062
92.4
47.5
5644
.843
53.8
12R
ussi
a0
03.
3693
11.2
1411
.25
27.3
6311
.844
5.12
0113
.755
17.1
94Sl
ovak
ia18
.867
9220
.188
6844
.528
35.9
2636
.852
15.5
5669
.259
129.
8127
7.78
370.
37Sl
oven
ia56
.555
.565
.591
.594
170
125
7266
.550
TR U
PDAT
E 20
01

Figu
re 3
Empl
oym
ent I
ndex
(198
9=B
ase)
-35
-30
-25
-20
-15
-10-505 19
8919
9019
9119
9219
9319
9419
9519
9619
9719
9819
99
Pola
nd
Cze
ch R
epub
lic
Rus
sia
Slov
enia
Slov
akia
Rom
ania
Bulg
aria
Hun
gary
Sour
ce: W
illiam
Dav
idso
n In
stitu
te b
ased
on
UN
Eco
nom
ic C
omm
issi
on fo
r Eur
ope,
Sta
tistic
al D
ivis
ion.
+

Dat
a co
mes
from
Uni
ted
Nat
ions
Eco
nom
ic C
omm
issi
on fo
r Eur
ope,
Sta
tistic
al D
ivis
ion.
1989
1990
1991
1992
1993
1994
1995
1996
1997
1998
1999
2000
Slov
akia
2,50
4.07
92,
458.
615
2,15
1.58
42,
174.
562
2,11
7.93
42,
096.
282
2,14
6.79
12,
116.
554
2,06
7.77
92,
047.
517
1,95
2.30
0Sl
ovak
ia
100.
000
98.1
8485
.923
86.8
4184
.579
83.7
1585
.732
84.5
2482
.576
81.7
6777
.965
Slov
enia
946.
300
909.
700
839.
000
792.
900
769.
608
750.
067
748.
846
744.
794
743.
431
745.
170
758.
474
Slov
enia
100.
000
96.1
3288
.661
83.7
8981
.328
79.2
6379
.134
78.7
0678
.562
78.7
4680
.152
Cze
ch R
ep5,
402.
533
5,35
1.24
25,
058.
633
4,92
7.13
64,
848.
285
4,88
4.75
35,
011.
645
5,04
4.41
64,
946.
574
4,86
9.22
24,
693.
096
Cze
ch R
ep10
0.00
099
.051
93.6
3491
.200
89.7
4190
.416
92.7
6593
.371
91.5
6090
.129
86.8
68R
oman
ia10
,945
.700
10,8
39.5
0010
,785
.800
10,4
58.0
0010
,062
.000
10,0
11.6
009,
493.
000
9,37
9.00
09,
022.
700
8,81
2.60
08,
419.
600
Rom
ania
100.
000
99.0
3098
.539
95.5
4491
.927
91.4
6686
.728
85.6
8782
.431
80.5
1276
.922
Bulg
aria
4,36
5.03
44,
096.
848
3,56
4.03
73,
273.
661
3,22
1.83
83,
241.
601
3,28
2.18
33,
285.
877
3,15
7.43
53,
152.
554
3,07
1.91
3Bu
lgar
ia10
0.00
093
.856
81.6
5074
.997
73.8
1074
.263
75.1
9375
.277
72.3
3572
.223
70.3
75Po
land
17,0
01.8
0016
,280
.000
15,3
26.4
0014
,676
.600
14,3
30.1
0014
,474
.500
14,7
35.2
0015
,020
.600
15,4
38.7
0015
,800
.400
15,3
73.5
00Po
land
100.
000
95.7
5590
.146
86.3
2484
.286
85.1
3586
.668
88.3
4790
.806
92.9
3490
.423
Hun
gary
5,22
7.20
05,
052.
500
4,53
4.10
04,
082.
700
3,82
7.30
03,
751.
500
3,67
8.80
03,
648.
100
3,64
6.30
03,
697.
700
3,81
1.50
03,
849.
100
Hun
gary
100.
000
96.6
5886
.741
78.1
0573
.219
71.7
6970
.378
69.7
9169
.756
70.7
4072
.917
Rus
sia
75,5
99.1
0075
,324
.700
73,8
47.8
0072
,071
.100
70,8
51.5
0068
,484
.400
66,4
40.9
0065
,950
.000
64,6
38.5
0063
,642
.000
63,9
63.4
0064
,600
.000
Rus
sia
100.
000
99.6
3797
.683
95.3
3393
.720
90.5
8987
.886
87.2
3685
.502
84.1
8484
.609
NB.
Dat
a fo
r Bul
garia
, Slo
veni
a, H
unga
ry is
not
har
mon
ised
Bulg
aria
dat
a is
an
annu
al a
vera
geH
unga
ry D
ata
is a
s of
Jan
1st

Tabl
e 1
Con
sum
er P
rice
Infla
tion
(ann
ual p
erce
ntag
e ch
ange
)
1990
1991
1992
1993
1994
1995
1996
1997
1998
1999
2000*
2001**
Cze
ch R
epub
lic9.
752
.011
.120
.89.
99.
18.
88.
510
.72.
13.
94.
6
Hun
gary
28.9
35.0
23.0
22.5
18.8
28.2
23.6
18.3
14.3
10.1
9.8
9.4
Pola
nd58
5.8
70.3
43.0
35.3
32.2
27.8
19.9
14.9
11.8
7.3
10.1
6.6
Slov
ak R
epub
lic10
.861
.210
.023
.213
.49.
95.
86.
16.
710
.612
.07.
1
Slov
enia
549.
711
7.7
207.
332
.921
.013
.59.
98.
48.
06.
18.
97.
7
Alb
ania
0.0
35.5
226.
085
.022
.67.
812
.733
.220
.60.
40.
44.
0
Bul
garia
26.3
333.
582
.073
.096
.362
.012
3.0
1082
.022
.20.
79.
98.
0
Rom
ania
5.1
170.
221
0.4
256.
113
6.7
32.3
38.8
154.
859
.145
.845
.735
.0
Kaz
akhs
tan
na78
.813
81.0
1662
.018
92.0
176.
339
.117
.47.
38.
313
.28.
7
Rus
sia
5.6
92.7
1526
.087
5.0
311.
419
7.7
47.8
14.7
27.6
86.1
20.8
22.4
Ukr
aine
4.2
91.0
1210
.047
35.0
891.
037
7.0
80.0
15.9
10.5
22.7
28.2
16.0
Esto
nia
23.1
210.
510
76.0
89.8
47.7
29.0
23.1
11.2
8.2
3.3
4.0
6.2
Latv
ia10
.517
2.2
951.
210
9.2
35.9
25.0
17.6
8.4
4.7
2.4
2.8
3.3
Lith
uani
a8.
422
4.7
1021
.041
0.4
72.1
39.6
24.6
8.9
5.1
0.8
1.0
2.0
EU5.
85.
14.
53.
63.
13.
12.
52.
11.
81.
32.
51.
8
Uni
ted
Stat
es5.
44.
23.
03.
02.
62.
82.
92.
31.
52.
23.
42.
6
Notes:
*Est
imat
e; *
*Pro
ject
ion
Sources:
Will
iam
Dav
idso
n In
stitu
te b
ased
on
EBR
D T
rans
ition
Rep
ort U
pdat
e 2
001
and
OEC
D E
cono
mic
Out
look
Vol
. 69
July
200
1.

Tabl
e 2
Cur
rent
Acc
ount
Bal
ance
(A
s % o
f GD
P )
1990
1991
1992
1993
1994
1995
1996
1997
1998
1999
2000*
2001**
Cze
ch R
epub
lic-3
.9-4
.2-1
.01.
3-1
.9-2
.6-7
.4-6
.1-2
.4-3
.0-4
.8-5
.1
Hun
gary
0.4
0.8
0.9
-9.0
-9.4
-5.6
-3.7
-2.1
-4.9
-4.2
-3.5
-5.4
Pola
nd1.
0-2
.61.
1-0
.70.
74.
5-1
.0-3
.2-4
.4-7
.5-6
.2-6
.0
Slov
ak R
epub
lic-6
.13.
01.
6-4
.74.
62.
1-1
0.6
-9.6
-9.7
-5.5
-3.4
-3.8
Slov
enia
3.0
1.0
7.4
1.5
4.0
-0.5
0.2
0.1
-0.8
-3.9
-2.9
-3.0
Alb
ania
nana
-68.
5-3
0.1
-14.
4-7
.2-9
.1-1
2.1
-6.1
-8.0
-8.2
-6.3
Bul
garia
-8.2
-1.0
-4.2
-10.
1-0
.3-0
.20.
24.
2-0
.5-5
.5-5
.8-5
.2
Rom
ania
-9.6
-3.5
-8.0
-4.5
-1.4
-5.0
-7.3
-6.1
-7.7
-3.8
-3.9
-3.9
Kaz
akhs
tan
-85.
9-5
0.0
-24.
5-7
.9-7
.8-1
.3-3
.6-3
.6-5
.6-1
.45.
32.
0
Rus
sia
-10.
711
.20.
10.
72.
92.
33.
00.
50.
413
.518
.310
.2
Ukr
aine
nana
na-2
.4-3
.1-3
.1-2
.7-2
.7-3
.12.
74.
71.
4
Esto
nia
nana
3.3
1.3
-7.3
-4.4
-9.1
-12.
2-9
.2-5
.7-6
.8-7
.7
Latv
iana
nana
19.1
5.5
-0.4
-5.4
-6.1
-10.
7-9
.7-6
.8-7
.1
Lith
uani
ana
nana
-3.2
-2.2
-10.
2-9
.2-1
0.2
-12.
1-1
1.2
-6.0
-6.4
EU-0
.5-1
.2-1
.00.
10.
20.
61.
40.
80.
3-0
.3-0
.4-0
.2
Uni
ted
Stat
es-1
.30.
1-0
.8-1
.2-1
.7-1
.5-1
.6-1
.7-2
.5-3
.6-4
.4-4
.2
Notes:
* E
stim
ate;
**P
roje
ctio
nSo
urce
s: W
illiam
Dav
idso
n In
stitu
te b
ased
on
EBR
D T
rans
ition
Rep
ort U
pdat
e 20
01, O
ECD
Eco
nom
ic O
utlo
ok 6
9, a
nd IM
F W
orld
Eco
nom
ic O
utlo
ok 2
001.

Tabl
e 3
Ext
erna
l Deb
t (a
s % o
f GD
P)
1990
1991
1992
1993
1994
1995
1996
1997
1998
1999
2000
*
Cze
ch R
epub
lic20
.333
.123
.824
.326
.031
.836
.040
.643
.142
.646
.5
Hun
gary
64.4
67.7
58.1
63.7
68.7
70.4
61.1
51.9
56.9
59.9
67.8
Pola
nd83
.769
.956
.454
.947
.138
.035
.336
.637
.641
.742
.8
Slov
ak R
epub
lic13
.024
.524
.126
.632
.030
.938
.848
.555
.953
.453
.5
Slov
enia
11.2
14.7
13.9
14.8
15.7
15.8
21.1
22.6
25.1
27.0
33.4
Alb
ania
nana
130.
178
.952
.427
.627
.333
.128
.726
.529
.1
Bul
garia
52.5
159.
216
0.4
127.
711
6.8
77.4
97.7
95.8
83.7
80.5
86.0
Rom
ania
3.0
7.4
16.5
16.1
18.3
19.1
24.3
27.1
26.1
25.8
27.8
Kaz
akhs
tan
nana
24.5
52.4
38.4
28.7
27.8
35.0
45.0
71.8
67.6
Rus
sia
148.
510
6.6
90.7
60.7
43.7
36.6
32.3
30.8
58.3
83.7
62.0
Ukr
aine
nana
0.6
11.8
19.1
21.7
19.8
19.1
27.5
40.4
33.2
Esto
nia
nana
na14
.016
.717
.635
.255
.356
.156
.163
.0
Latv
iana
nana
16.3
22.6
34.6
40.7
48.9
50.9
57.9
66.2
Lith
uani
ana
na3.
112
.212
.422
.826
.432
.833
.342
.643
.8
Not
es:
*Est
imat
eSo
urce
s: W
illia
m D
avid
son
Inst
itute
bas
ed o
n EB
RD
Tra
nsiti
on R
epor
t var
ious
issu
es.

Tabl
e 4
Gov
ernm
ent B
udge
t Bal
ance
(a
s % o
f GD
P)
1990
1991
1992
1993
1994
1995
1996
1997
1998
1999
2000
*20
01**
Cze
ch R
epub
lic-0
.2-1
.9-3
.10.
5-1
.1-1
.4-0
.9-1
.7-2
.0-3
.3-4
.9-9
.2
Hun
gary
0.0
-3.0
-7.2
-6.6
-8.4
-6.7
-5.0
-6.6
-5.6
-5.6
-3.4
-3.5
Pola
nd3.
1-2
.1-4
.9-2
.4-2
.2-3
.1-3
.3-3
.1-3
.2-3
.3-3
.0-3
.0
Slov
ak R
epub
lic0.
1-2
.0-1
1.9
-6.0
-1.5
0.4
-1.3
-5.2
-5.0
-3.6
-3.5
-4.0
Slov
enia
-0.3
2.6
0.3
0.6
-0.2
-0.3
-0.2
-1.7
-1.4
-0.9
-1.3
-1.3
Alb
ania
-6.1
-20.
7-2
3.1
-15.
5-1
2.6
-10.
1-1
2.1
-12.
6-1
0.4
-11.
3-8
.8-9
.2
Bul
garia
-8.1
-4.5
-2.9
-8.7
-3.9
-5.7
-10.
4-2
.10.
9-0
.9-1
.0-1
.5
Rom
ania
-0.4
-1.9
-4.6
-0.4
-2.2
-2.5
-3.9
-4.6
-5.0
-3.5
-3.7
-4.0
Kaz
akhs
tan
1.4
-7.9
-7.3
-4.1
-7.7
-3.4
-5.3
-7.0
-7.7
-5.0
-0.8
-1.5
Rus
sia
na-2
.7-1
8.9
-7.3
-10.
4-6
.0-8
.9-7
.9-8
.0-3
.82.
50.
0
Ukr
aine
nana
na-1
6.2
-7.7
-6.1
-3.2
-5.4
-2.8
-2.4
-0.5
-3.0
Esto
nia
nana
na
-0.7
1.4
-0.6
-1.9
2.2
-0.3
-4.6
-0.7
-0.5
Latv
iana
nana
na
-4.4
-3.9
-1.8
0.3
-0.8
-4.2
-3.0
-2.0
Lith
uani
ana
nana
-5.3
-4.8
-4.5
-4.5
-1.8
-5.9
-8.5
-3.3
-1.4
EU15
-3.9
-4.4
-5.2
-4.8
-4.4
-4.3
-3.1
-1.3
-0.8
-0.1
0.3
-0.2
Uni
ted
Stat
es-3
.9-4
.6-4
.7-3
.9-3
.0-2
.3-1
.4-0
.70.
20.
61.
01.
5
Not
es:
* Es
timat
e;
**
Pro
ject
ion
Sour
ces:
Will
iam
Dav
idso
n In
stitu
te b
ased
on
EBR
D T
rans
ition
Rep
ort v
ario
us is
sues
and
IMF
Wor
ld E
cono
mic
Out
look
, May
200
1.

Tabl
e 5
Priv
ate
Sect
or S
hare
of G
DP
(in p
er c
ent,
mid
-yea
r)
1991
1994
1995
1996
1997
1998
1999
2000
*
Cze
ch R
epub
lic15
6570
7575
7580
80
Hun
gary
3055
6070
7585
8080
Pola
nd40
5560
6065
6565
70
Slov
ak R
epub
lic15
5560
7075
7575
75
Slov
enia
1530
4545
5050
5555
Alb
ania
550
6075
7575
7575
Bul
garia
2040
5055
6065
7070
Rom
ania
2540
4555
6060
6060
Kaz
akhs
tan
520
2540
5555
6060
Rus
sia
550
5560
7070
7070
Ukr
aine
1040
4550
5555
5560
Esto
nia
1055
6570
7070
7575
Latv
ia10
4055
6060
6565
65
Lith
uani
a10
6065
7070
7070
70
Not
es:*
EB
RD
est
imat
esSo
urce
: W
illia
m D
avid
son
Inst
itute
bas
ed o
n EB
RD
Tra
nsiti
on R
epor
t var
ious
issu
es.

Table 6Unemployment(percent)
1991 1992 1993 1994 1995 1996 1997 1998 1999 2000
Czech Republic 4.1 2.6 4.2 4.3 3.7 4.1 5.4 7.3 9.0 8.9
Hungary 8.5 9.8 11.9 10.7 10.2 9.9 8.7 7.8 7.0 6.5
Poland 11.8 13.6 14.0 14.4 13.3 12.3 11.2 10.5 13.0 16.1
Slovak Republic 6.6 11.4 12.9 13.7 13.1 11.3 11.8 12.5 16.2 18.6
Slovenia 8.2 11.5 9.1 9.0 7.4 7.3 7.1 7.7 7.4 7.0
Estonia 1.5 3.7 6.5 7.6 9.7 10.0 9.7 9.9 11.7 13.7
Latvia 0.6 3.9 8.7 16.7 18.9 18.3 14.4 13.8 14.5 14.3
Lithuania 0.3 1.0 4.4 17.4 17.1 16.4 14.1 13.3 14.1 16.1
Bulgaria 11.1 15.3 21.4 20.2 16.5 14.2 14.4 16.0 16.8 16.2
Romania 3.0 8.2 10.4 8.2 8.0 6.7 6.0 6.3 6.8 7.2
Russian Federation … 5.2 5.9 8.1 9.5 … 11.8 13.3 12.9 10.0
Ukraine … 0.3 0.4 0.4 5.6 7.6 8.9 11.3 11.9 …
United States 6.8 7.5 6.9 6.1 5.6 5.4 4.9 4.5 4.2 4.0
Notes : For most countries data based on ILO methodology.
Sources : William Davidson Institute based on ILO(2000), World Bank (2001), EBRD various issues, and OECD (2001) based on labor force surveys. Russian data from Sabirianova & Earle 2001 using LFS figures, reported in Goskomstat (2000c), Goskomstat (1999a), and OECD (2000). Unless otherwise indicated, the data are generally annual averages of monthly, quarterly, or semi-annual data. See the following website for full source information: http://www.wdi.bus.umich.edu

Table 7Income Inequality (Gini Coefficients)
Year Gini Year Gini Year Gini
Czech Republic 1988 20.0 1992 23.0 1996 26.0
Hungary 1987 24.4 1992 26.0 1998 25.3
Poland 1987 25.0 1993 29.8 1998 32.7
Slovak Republic 1988 19.5 1993 21.5 1996 26.3
Slovenia 1987 19.8 1993 24.1 1996 26.1
Bulgaria 1989 21.7 1993 33.3 1997 34.1
Romania 1989 23.3 1994 28.6 1997 30.5
Russiaa 1991 26.0 1993 39.8 2000 39.9
Russiab 1992 54.3 1994 45.5 1996 51.8
Ukraine 1988 23.3 1996 33.4 1999 30.0Notes : a) based on Goskomstat data; b) based on RLMS data
Late 1980s Early 1990s Late 1990s
Sources : William Davidson Institute based on various sources and Davidson Institute staff calculations. See the following website for full source information: http://www.wdi.bus.umich.edu.
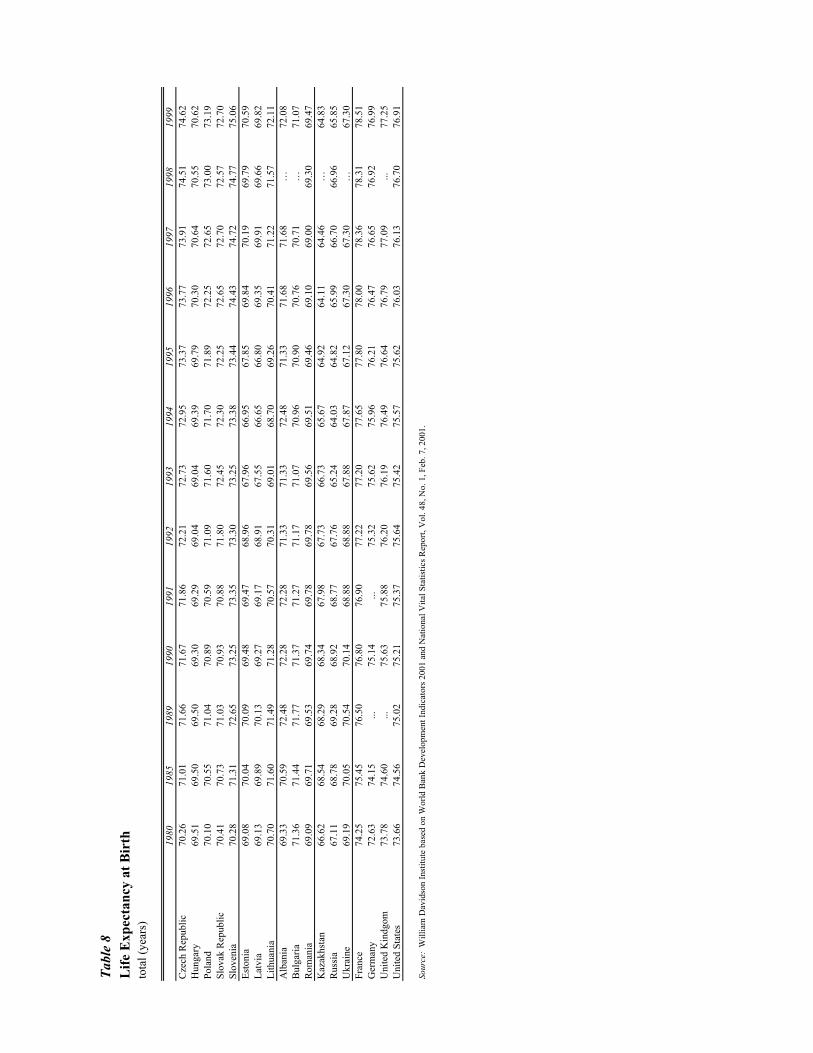
Tabl
e 8
Life
Exp
ecta
ncy
at B
irth
to
tal (
year
s)
1980
1985
1989
1990
1991
1992
1993
1994
1995
1996
1997
1998
1999
Cze
ch R
epub
lic70
.26
71.0
171
.66
71.6
771
.86
72.2
172
.73
72.9
573
.37
73.7
773
.91
74.5
174
.62
Hun
gary
69.5
169
.50
69.5
069
.30
69.2
969
.04
69.0
469
.39
69.7
970
.30
70.6
470
.55
70.6
2Po
land
70.1
070
.55
71.0
470
.89
70.5
971
.09
71.6
071
.70
71.8
972
.25
72.6
573
.00
73.1
9Sl
ovak
Rep
ublic
70.4
170
.73
71.0
370
.93
70.8
871
.80
72.4
572
.30
72.2
572
.65
72.7
072
.57
72.7
0Sl
oven
ia70
.28
71.3
172
.65
73.2
573
.35
73.3
073
.25
73.3
873
.44
74.4
374
.72
74.7
775
.06
Esto
nia
69.0
870
.04
70.0
969
.48
69.4
768
.96
67.9
666
.95
67.8
569
.84
70.1
969
.79
70.5
9La
tvia
69.1
369
.89
70.1
369
.27
69.1
768
.91
67.5
566
.65
66.8
069
.35
69.9
169
.66
69.8
2Li
thua
nia
70.7
071
.60
71.4
971
.28
70.5
770
.31
69.0
168
.70
69.2
670
.41
71.2
271
.57
72.1
1A
lban
ia69
.33
70.5
972
.48
72.2
872
.28
71.3
371
.33
72.4
871
.33
71.6
871
.68
…72
.08
Bul
garia
71.3
671
.44
71.7
771
.37
71.2
771
.17
71.0
770
.96
70.9
070
.76
70.7
1…
71.0
7R
oman
ia69
.09
69.7
169
.53
69.7
469
.78
69.7
869
.56
69.5
169
.46
69.1
069
.00
69.3
069
.47
Kaz
akhs
tan
66.6
268
.54
68.2
968
.34
67.9
867
.73
66.7
365
.67
64.9
264
.11
64.4
6…
64.8
3R
ussi
a67
.11
68.7
869
.28
68.9
268
.77
67.7
665
.24
64.0
364
.82
65.9
966
.70
66.9
665
.85
Ukr
aine
69.1
970
.05
70.5
470
.14
68.8
868
.88
67.8
867
.87
67.1
267
.30
67.3
0…
67.3
0Fr
ance
74.2
575
.45
76.5
076
.80
76.9
077
.22
77.2
077
.65
77.8
078
.00
78.3
678
.31
78.5
1G
erm
any
72.6
374
.15
...75
.14
...75
.32
75.6
275
.96
76.2
176
.47
76.6
576
.92
76.9
9U
nite
d K
indg
om
73.7
874
.60
...75
.63
75.8
876
.20
76.1
976
.49
76.6
476
.79
77.0
9...
77.2
5U
nite
d St
ates
73.6
674
.56
75.0
275
.21
75.3
775
.64
75.4
275
.57
75.6
276
.03
76.1
376
.70
76.9
1
Sour
ce:
Will
iam
Dav
idso
n In
stitu
te b
ased
on
Wor
ld B
ank
Dev
elop
men
t Ind
icat
ors 2
001
and
Nat
iona
l Vita
l Sta
tistic
s Rep
ort,
Vol
. 48,
No.
1, F
eb. 7
, 200
1.

Tabl
e 9
Mar
riag
e R
ates
(Per
'000
inha
bita
nts)
1980
1985
1989
1990
1991
1992
1993
1994
1995
1996
1997
1998
1999
2000
Cze
ch R
epub
lic7.
67.
88.
68.
87.
07.
26.
45.
65.
35.
25.
65.
44.
54.
3
Hun
gary
7.5
6.9
6.3
6.4
5.9
5.5
5.3
5.3
5.2
4.9
4.6
4.5
4.7
4.6
Pola
nd8.
67.
26.
86.
76.
05.
75.
45.
45.
45.
35.
35.
43.
73.
6
Slov
ak R
epub
lic7.
97.
57.
67.
77.
26.
45.
85.
35.
15.
15.
25.
15.
05.
0
Slov
enia
6.5
5.4
4.9
4.3
4.1
4.6
4.5
4.2
4.2
3.8
3.8
3.8
3.7
3.7
Bul
garia
7.9
7.4
7.0
6.8
5.6
5.0
4.9
4.5
4.0
4.3
4.2
4.3
4.1
4.0
Rom
ania
8.2
7.1
7.7
8.3
7.9
7.7
7.1
6.7
6.8
6.7
6.5
6.4
6.0
5.9
Kaz
akhs
tan
……
10.0
9.9
9.9
8.7
8.7
7.5
7.2
6.4
6.4
6.3
6.2
6.0
Rus
sia
10.6
9.7
9.4
8.9
8.5
7.1
7.5
7.3
7.3
5.9
6.3
5.8
5.2
5.0
Ukr
aine
9.3
9.6
9.5
9.3
9.5
6.6
8.2
7.7
8.4
6.0
6.8
6.2
6.1
6.0
Esto
nia
8.8
8.4
8.1
7.5
6.6
5.7
5.1
4.9
4.7
3.8
3.8
3.7
3.6
3.5
Latv
ia9.
89.
39.
08.
88.
47.
25.
64.
54.
43.
93.
93.
93.
33.
3
Lith
uani
a9.
29.
79.
49.
89.
28.
16.
46.
36.
05.
55.
15.
05.
15.
0
Fran
ce6.
24.
95.
05.
14.
94.
74.
44.
44.
44.
84.
84.
84.
94.
9
Ger
man
y6.
36.
4…
6.5
6.3
5.7
5.4
5.4
5.3
5.2
5.2
5.1
5.4
5.4
Uni
ted
Kin
dgom
14
.813
.914
.013
.113
.712
.211
.611
.310
.910
.710
.410
.810
.710
.6
Uni
ted
Stat
es10
.510
.29.
79.
89.
49.
29.
09.
18.
98.
88.
98.
58.
68.
5
Sources:
Will
iam
Dav
idso
n In
stitu
te b
ased
on
the
Glo
bal M
arke
t Inf
orm
atio
n D
atab
ase,
http
://w
ww
.eur
omon
itor.c
om.

Tabl
e 10
Fert
ility
Rat
e, T
otal
(birt
hs p
er w
oman
)
1980
1985
1989
1990
1991
1992
1993
1994
1995
1996
1997
1998
1999
Cze
ch R
epub
lic2.
071.
951.
871.
891.
861.
721.
671.
441.
281.
181.
171.
161.
17
Hun
gary
1.91
1.83
1.78
1.84
1.86
1.77
1.69
1.64
1.57
1.46
1.38
1.33
1.32
Pola
nd2.
282.
332.
082.
042.
051.
931.
851.
801.
611.
581.
501.
401.
40
Slov
ak R
epub
lic2.
31..
2.08
2.09
2.05
1.98
1.92
1.66
1.52
1.47
1.43
1.38
1.37
Slov
enia
2.08
1.72
1.52
1.46
1.42
1.34
1.34
1.32
1.29
1.28
1.25
1.23
1.24
Rom
ania
2.43
2.31
2.20
1.84
1.57
1.52
1.44
1.41
1.34
1.30
1.32
1.32
1.32
Rus
sia
1.88
2.06
2.01
1.89
1.73
1.55
1.38
1.40
1.34
1.28
1.23
1.24
1.25
Ukr
aine
1.99
2.07
1.99
1.85
1.81
1.72
1.60
1.50
1.40
1.30
1.30
..1.
30
Fran
ce1.
951.
821.
791.
781.
771.
731.
651.
651.
701.
721.
711.
751.
77
Ger
man
y1.
441.
371.
421.
451.
331.
291.
281.
241.
251.
301.
35..
1.35
Uni
ted
Kin
dgom
1.
891.
801.
801.
831.
821.
791.
821.
741.
711.
721.
71..
1.71
Uni
ted
Stat
es1.
841.
842.
012.
082.
072.
072.
052.
042.
022.
032.
032.
062.
06
Sources:
Will
iam
Dav
idso
n In
stitu
te b
ased
on
the
Glo
bal M
arke
t Inf
orm
atio
n D
atab
ase,
http
://w
ww
.eur
omon
itor.c
om.

49
References
Aslund, Anders. 1991(a). “The Case for Swift Currency Reform in the New Republics.” Transition, Vol. 2, No. 8, pp. 4–5.
———. 1991(b). “Four Key Reforms: The Eastern European Experiment Phase II.” The
American Enterprise, pp. 49–55. ———. 1992(a). “A Critique of Soviet Reform Plans.” In Anders Aslund (ed.) The Post-
Soviet Economy: Soviet and Western Perspectives.” Pinter Publishers, pp. 167–180 ———. 1992(b). “Go Faster on Russian Reform.” The New York Times. ———. 1992 (c). “Debate: Anders Aslund.” Acta Oeconomica, Vol. 44, , pp. 231–235. Aslund, Anders and Richard Layard. 1991. “Help Russia Now.” The New York Times. Atkeson, A. and P.J. Kehoe. 1996. “Social Insurance and Transition.” International
Economic Review, Vol. 37, 377–402. Basu, Swati, Saul Estrin and Jan Svejnar. 2000. “Employment and Wages in Enterprises
under Communism and in Transition: Evidence from Central Europe and Russia,” The William Davidson Institute Working Papers, No.114b (1995, revised 2000).
Bevan, Alan, Saul Estrin and Mark Schaffer. 1999. “Determinants of Enterprise
Performance during Transition.” Centre for Economic Reform and Transformation (CERT), Working Paper 99/03.
Bhaduri, A., K. Kaski, and F. Levcik. 1993. “ Transition from the Command to the
Market System: What Went Wrong and Want To Do for Now?” Vienna Institute for Comparative Economic Studies. Photocopy.
Black, Bernard, Reinier Kraakman and Anna Tarassova. 1999. “Russian Privatization and
Corporate Governance: What Went Wrong?” William Davidson Institute Working Papers, No. 169.
Blanchard, Olivier J. 1997. The Economics of Post-Communist Transition, Oxford:
Clarendon Press. Blanchard, Olivier, Rudiger Dornbusch, Paul Krugman, Richard Layard and Lawrence
Summers. 1991. Reform in Eastern Europe. Cambridge, MA: MIT Press. Blanchard, O. and M. Kremer. 1997. “Disorganization.” Quarterly Journal of Economics,
Vol.112 (4), 1091–1126.

50
Boeri, Tito. 2000. Structural Change, Welfare Systems and Labor Allocation. Oxford: Oxford University Press.
Boeri, Tito and Katherine Terrell. 2002. “Institutional Determinants of Labor Reallocation in
Transition.” Journal of Economic Perspectives. Bofinger, Peter. 1991. “Options for the Payments and Exchange Rate System in Eastern
Europe.” Centre for Economic Policy Research Discussion Paper, No. 545. Boycko, M., A. Shleifer and R. Vishny. 1993. “Privatizing Russia.” Brookings Papers on
Economic Activity. Brada, Josef C., Arthur E. King and Ali M. Kutan. 2000. “Inflation bias and productivity
shocks in transition economies: The case of the Czech Republic.” Economic Systems 24(2), 119–138.
Brainard, Lawrence J. 1991. “Reform in Eastern Europe: Creating a Capital Market.”
Economic Review, pp. 49–58. Burda. 1993. “Unemployment, Labour Markets and Structural Change in Eastern Europe.
Economic Policy 16: 101-38. Calvo, Guilermo. 1990. “Financial Aspects of Socialist Economies: From Inflation to
Reform.” Conference on Adjustment and Growth: Lessons for Eastern Europe. IMF.
Calvo, Guilermo A. and Fabrizio Coricelli. 1992. "Capital Market Imperfections and
Output Response in Previously Centrally Planned Economies." In G. Caprio, D. Folkerts-Landau and T. Lane (eds.), Building Sound Finance in Emerging Market Economies, Washington, D.C.: IMF.
Calvo, Guilermo A. and Jacob A. Frenkel. 1991. “Credit Markets, Credibility, and
Economic Transformation.” Journal of Economic Perspectives, Vol. 5, No. 4, pp. 139–148.
Commander, S., Toltopiantenko, and Yemetsov. 1999. “Channels of Redistribution:
Inequality and Poverty in the Russian Transition.” Economics of Transition 7(1): 411-65.
Coricelli, Fabrizio and Roberto Rocha. 1990. “Stabilization Programs in Eastern Europe:
A Comparative Analysis of the Polish and the Yugoslav Programs of 1990.” Conference on Adjustment and Growth: Lessons for Eastern Europe. IMF.
Desai, Padma. 1992. “Reforming the Soviet Grain Economy: Performance, Problems and
Solutions.” American Economic Review, Papers and Proceedings, Vol. 82, No. 2, pp. 49–54.

51
Desai, Padma and Todd Idson. 2000. Work without Wages: Russia’s Nonpayment Crisis.
Cambridge, MA: MIT Press. Dewatripont, M. and Gerard Roland. 1992(a). “Economic Reform and Dynamic Political
Constraints.” Review of Economic Studies, Vol. 59, No. 4, pp. 703–730. ———. 1992(b). “The Virtues of Gradualism and the Legitimacy in the Transition to a
Market Economy.” The Economic Journal, Vol. 102, pp. 291–300. Diamond, Peter. 1992. “Pension Reform in a Transition Economy: Notes on Poland and
Chile.” NBER Conference on Transition in Eastern Europe, 26–29. Djankov, Simeon and Peter Murrell. “Enterprise Restructuring in Transition: A
Quantitative Survey.” Working Paper, University of Maryland, College Park, MD. Dyba, K. and Jan Svejnar. 1991. “Czechoslovakia: Recent Economic Developments and
Prospects.” American Economic Review, Papers and Proceedings, Vol. 81, No. 2, pp. 185–190.
EBRD (European Bank for Reconstruction and Development). Transition Report.
Various annual issues. EBRD: London. Edwards, Sebastian. 1990. “Stabilization and Liberalization Policies in Eastern Europe:
Lessons from Latin America.” Paper presented at the American Economic Association Annual Meetings, Washington, D.C., December 27–30.
Ellerman, David. 1993. “Management and Employee Buy-Outs in Central and Eastern
Europe: Introduction.” In D. Ellerman (ed.), Management and Employee Buy-Outs as a Technique of Privatization. CEEPN, Ljubljana.
Filer, Randall K. and Jan Hanousek. 2000. “Output changes and inflationary bias in
transition.” Economic Systems, 24(3), 285–294. Fischer, Stanley. 1990. “Comment on Creating A Market Economy in Eastern Europe:
The Case of Poland.” Brookings Papers on Economics, Vol. 1, pp. 75–147. Fischer, Stanley and Jacob Frenkel. 1992. “Macroeconomic Issues of Soviet Reform.”
American Economic Review, Papers and Proceedings, Vol. 82, No. 2, pp. 37–42. Frydman, Roman and Andrei Rapaczynski. 1991. “Markets and Institutions in Large
Scale Privatization: An Approach to Economic and Social Transformation in Eastern Europe.” In V. Corbo, S. Corbicelli, and J. Bossak, J. (eds.), Reforming Central and Eastern European Economics; Initial Results and Challenges. The World Bank.
52
Frydman, Roman, Edmund S. Phelps, Andrzej Rapaczynski, and Andrei Shleifer. 1993. “Needed mechanisms of corporate governance and finance in Eastern Europe.” Economics of Transition, Vol. 1(2), pp. 171–207.
Garner and Terrell. 1998. “A Gini Decomposition Analysis of Inequality in the Czech
and Slovak Republics during the Transition.” Economics of Transition 6(1): 23-46. Gomulka, Stanislaw. 1989. “Shock Needed for Polish Economy.” The Guardian, August
19, p. 5. ———. 1992. “Polish Economic Reform, 1990-1991: Principle, Policies, and
Outcomes.” Cambridge Journal of Economics 16: 355-72. ———. 1994. “Obstacles to Recovery in Transition Economies.” In P. Aghion and N.
Stern (eds.), Obstacles to Enterprise Restructuring in Transition, 1994, EBRD Working Paper No. 16.
Gregory, Paul and Robert Stuart. 1997. Comparative Economic Systems, Boston:
Houghton-Mifflin, 6th edition. Gupta, Nandini, John Ham and Jan Svejnar. 2000. “Priorities and Sequencing in
Privatization: Theory and Evidence from the Czech Republic.” Working Paper No. 323, The William Davidson Institute, May 2000 (revised September 2001).
Ham, John, Jan Svejnar and Katherine Terrell. 1998. “Unemployment and the Social
Safety Net During Transitions to a Market Economy: Evidence from the Czech and Slovak Republics. American Economic Review, Vol. 88, No. 5, pp. 1117–1142.
———. 1999. “Women’s Unemployment During the Transition: Evidence from Czech
and Slovak Micro Data.” Economics of Transition, Vol.7, No. 1, pp. 47–78. Hinds, Manuel. 1990. “Issues in the Introduction of Market Forces in Eastern European
Socialist Economies.” Managing Inflation in Socialist Economies in Transition, The Economic Development Institute of the World Bank.
Junz, Helen. 1991. “Integration of Eastern Europe into the World Trading System.”
American Economic Review, Papers and Proceedings, Vol. 81, No. 2, pp. 176–180. Jurajda, Stepan and Katherine Terrell. 2002. “What Drives the Speed of Job Reallocation
During Episodes of Massive Adjustment?” The William Davidson Institute Working Papers, No. 432.
Kornai, Janos. 1990. The Road to a Free Economy. Shifting from a Socialist System: The
Example of Hungary. New York: W. W. Norton and Budapest: HVG Kiadó.

53
———. 1992. “The Postsocialist Transition and the State: Reflections in the Light of Hungarian Fiscal Problems.” American Economic Review, Papers and Proceedings, Vol. 82, No. 2, pp. 1–21.
Li, Wei. 1999. “A Tale of Two Reforms.” RAND Journal on Economics, Vol. 30 (1),
120–136. Lipton, David and Jeffrey Sachs. 1990. “Creating A Market Economy in Eastern Europe:
The Case of Poland.” Brookings Papers on Economics, Vol. 1. Litwack, John. 1991. “Legality and Market Reform in Soviet-Type Economies.” Journal
of Economic Perspectives, Vol. 5, No. 4, pp. 77–90. Lizal, Lubomir and Jan Svejnar. 2001. “Investment, Credit Rationing and the Soft Budget
Constraint: Evidence from Czech Panel Data. The Review of Economics and Statistics.
Mann, Catherine. 1991. “Industry Restructuring in East-Central Europe: The Challenge
and the Role for Foreign Investment.” American Economic Review, Papers and Proceedings, Vol. 81, No. 2, pp 181–185.
McKinnon, Ronald I. 1990(a). “Stabilizing the Ruble: The Problem of Internal Currency
Convertibility.” Second International Monetary Conference Fu and Landeszentralbank. Berlin, Germany May 10–12.
———. 1990(b). “Financial Control in the Transition to a Market Economy.” Mimeo. McKinnon, Ronald I. 1991. “Liberalizing Foreign Trade in a Socialist Economy: The
Problem of Negative Value Added,” Chapter 12. The Order of Economic Liberalization, Johns Hopkins Press.
Megginson, William and Jeffrey Netter. 2001. “From State to Market: A Survey of
Empirical Studies on Privatization.” Journal of Economic Literature, Vol. 39, No. 2.
Murrell, Peter. 1991. “Can Neoclassical Economics Underpin the Reform of Centrally
Planned Economies?” Journal of Economic Perspectives, Vol. 5, No. 4, pp. 59–76. Pissarides, Francesco, Miroslav Singer, and Jan Svejnar. 2000. “Objectives and
Constraints of Entrepreneurs: Evidence from Small and Medium Size Enterprises in Russia and Bulgaria.” The William Davidson Working Paper No. 346.
Prasnikar, Janez and Jan Svejnar. 1991. “Workers Participation in Management vs. Social
Ownership and Government Policies: Yugoslav Lessons for Transforming Socialist Economies.” Comparative Economic Studies, Vol. 33, No. 4, pp. 27–46.

54
Public Opinion Research Center. 1999 “Was it Worthwhile? The Czechs, Hungarians and Poles on the Changes of the Last Decade.” Warsaw, Poland. November. http://www.cbos.pl/ENGLISH/cbos_en.htm.
Roland, Gerard. 1994. “On the Speed and Sequencing of Privatization and
Restructuring.” The Economic Journal, Vol. 104, Issue 426, pp. 1158–1168. Roland, Gerard and Thierry Verdier. 1999. “Transition and the Output Fall.” Economics
of Transition, Vol. 7 (1), pp. 1–28. Rollo, Jim and Alasdair Smith. 1992. “The Political Economy of Central European Trade
with the European Community: Why So Sensitive?” Economic Policy A European Forum, hosted by the Bank of England and HM Treasury, October 15–16.
Sachs, Jeffrey. 1992. “Privatization in Russia: Some Lessons from Eastern Europe.”
American Economic Review, Papers and Proceedings, Vol. 82, No. 2, pp. 43–48. Sachs, Jeffrey, Clifford Zinnes, and Yair Eilat. 2000. “The Gains from Privatization in
Transition Economies: Is ‘Change of Ownership’ Enough?” CAER II Discussion Paper No. 63, Harvard Institute for International Development, Cambridge, MA.
Shirley, Mary and Patrick Walsh. 2000. “Public versus Private Ownership: The Current
State of the Debate.” Policy Research Working Paper WPS2420. The World Bank, Washington, D.C.
Stiglitz, Joseph. 1990. “Comment on Creating A Market Economy in Eastern Europe:
The Case of Poland.” Brookings Papers on Economics, Vol. 1, pp. 75–147. ———. 1999. “Whither Reform? Ten Years of the Transition” In Annual World Bank
Conference on Development Economics 1999. Washington D.C: The World Bank. Svejnar, Jan. 1989. “A Framework for the Economic Transformation of Czechoslovakia,
PlanEcon Report, Vol. V, No. 52, 1–18. ———. 1991. “Microeconomic Issues in the Transition to Markets.” Journal of
Economic Perspectives, Vol. 5, No. 4, pp. 123–138. ———. 1997. “Pensions in the Former Soviet Bloc: Problems and Solutions.” In Council
on Foreign Relations, The Coming Global Pension Crisis, New York. ———. 1999. “Labor Markets in the Transitional Central and East European Economies.” In
Orley Ashenfelter and D. Card, eds., Handbook of Labor Economics. Elsevier. ———. 2002. “Transition Economies: Performance and Challenges.” Journal of Economic
Perspectives.

55
Tanzi, Vito and George Tsiboures. 2000. “Fiscal Reform over Ten Years of Transition.” IMF Working Paper WP/00/113.
World Bank. 1994. Averting the Old Age Crisis. New York: Oxford University Press,.
———. 1996. World Development Report 1996: From Plan to Market. New York: Oxford University Press for the World Bank.


