

This is an Open Access document downloaded from ORCA, Cardiff University's institutional
repository: http://orca.cf.ac.uk/76983/
This is the author’s version of a work that was submitted to / accepted for publication.
Citation for final published version:
Jiang, Huimin, Kwong, C. K., Siu, K. W. M. and Liu, Ying 2015. Rough set and PSO-based ANFIS
approaches to modeling customer satisfaction for affective product design. Advanced Engineering
Informatics 29 (3) , pp. 727-738. 10.1016/j.aei.2015.07.005 file
Publishers page: http://dx.doi.org/10.1016/j.aei.2015.07.005
<http://dx.doi.org/10.1016/j.aei.2015.07.005>
Please note:
Changes made as a result of publishing processes such as copy-editing, formatting and page
numbers may not be reflected in this version. For the definitive version of this publication, please
refer to the published source. You are advised to consult the publisher’s version if you wish to cite
this paper.
This version is being made available in accordance with publisher policies. See
http://orca.cf.ac.uk/policies.html for usage policies. Copyright and moral rights for publications
made available in ORCA are retained by the copyright holders.

Dear Author,
Please, note that changes made to the HTML content will be
added to the article before publication, but are not reflected
in this PDF.
Note also that this file should not be used for submitting
corrections.

1
3 Rough set and PSO-based ANFIS approaches to modeling customer
4 satisfaction for affective product design
5
6
7 Huimin Jiang a,⇑, C.K. Kwong a, M.W.K. Siu b, Y. Liu c
8 aDepartment of Industrial and Systems Engineering, The Hong Kong Polytechnic University, Hong Kong, China9 b School of Design, The Hong Kong Polytechnic University, Hong Kong, China
10 c Institute of Mechanical and Manufacturing, School of Engineering, Cardiff University, Cardiff CF24 3AA, UK
1112
1 4a r t i c l e i n f o
15 Article history:16 Received 29 January 201517 Received in revised form 15 July 201518 Accepted 18 July 201519 Available online xxxx
20 Keywords:21 Affective product design22 Customer satisfaction23 Rough set theory24 Particle swarm optimization25 ANFIS26
2 7
a b s t r a c t
28Facing fierce competition in marketplaces, companies try to determine the optimal settings of design
29attribute of new products from which the best customer satisfaction can be obtained. To determine
30the settings, customer satisfaction models relating affective responses of customers to design attributes
31have to be first developed. Adaptive neuro-fuzzy inference systems (ANFIS) was attempted in previous
32research and shown to be an effective approach to address the fuzziness of survey data and nonlinearity
33in modeling customer satisfaction for affective design. However, ANFIS is incapable of modeling the rela-
34tionships that involve a number of inputs which may cause the failure of the training process of ANFIS
35and lead to the ‘out of memory’ error. To overcome the limitation, in this paper, rough set (RS) and par-
36ticle swarm optimization (PSO) based-ANFIS approaches are proposed to model customer satisfaction for
37affective design and further improve the modeling accuracy. In the approaches, the RS theory is adopted
38to extract significant design attributes as the inputs of ANFIS and PSO is employed to determine the
39parameter settings of an ANFIS from which explicit customer satisfaction models with better modeling
40accuracy can be generated. A case study of affective design of mobile phones is used to illustrate the pro-
41posed approaches. The modeling results based on the proposed approaches are compared with those
42based on ANFIS, fuzzy least-squares regression (FLSR), fuzzy regression (FR), and genetic
43programming-based fuzzy regression (GP-FR). Results of the training and validation tests show that
44the proposed approaches perform better than the others in terms of training and validation errors.
45� 2015 Published by Elsevier Ltd.
46
47
48
49 1. Introduction
50 Affective design has been shown to excite psychological feelings
51 of customers and can help improve the emotional aspects of cus-
52 tomer satisfaction. It is an important design strategy to enhance
53 customer satisfaction of new products in customer-driven product
54 development. Design attributes, such as shape and color, evoke the
55 affective responses of customers to products. Products with good
56 affective design can help attract customers and influence their
57 choices and preferences, such as loyalty and joy of use [1,2]. The
58 process of affective design includes identifying, measuring, analyz-
59 ing, and understanding the relationship between the affective
60 needs of the customer domain and the perceptual design attributes
61 in the design domain [3]. One of the major processes of affective
62 design is to determine the design attributes settings of new prod-
63 ucts such that high, or even optimal, customer affective satisfaction
64of the new products can be obtained. To determine the design
65attribute settings, customer satisfaction models that relate affec-
66tive responses of customers to design attributes have to be devel-
67oped first. However, the modeling process is quite complex as the
68relationships to be modeled can be highly nonlinear and fuzzy.
69Modeling customer satisfaction for affective product design has
70been applied in the industry for various product designs, such as
71the design of vehicle interior [4], office chairs [5], mobile phones
72[6], and digital camera [7].
73A handful of studies previously attempted to model the rela-
74tionships between affective responses and design attributes using
75statistical and artificial intelligence methods. Artificial neural net-
76work (ANN) was proposed to model the affective relationship in
77product design [8,9]. An interactive evolutionary system based
78on neural networks was proposed to analyze the aesthetic percep-
79tions of customers and approximate their aesthetic intentions [10].
80Chen et al. developed a prototype system for affective design in
81which Kohonen’s self-organizing map neural network was
82employed to consolidate the relationships between design
http://dx.doi.org/10.1016/j.aei.2015.07.005
1474-0346/� 2015 Published by Elsevier Ltd.
⇑ Corresponding author.
E-mail address: [email protected] (H. Jiang).
Advanced Engineering Informatics xxx (2015) xxx–xxx
Contents lists available at ScienceDirect
Advanced Engineering Informatics
journal homepage: www.elsevier .com/ locate/ae i
ADVEI 620 No. of Pages 12, Model 5G
30 July 2015
Please cite this article in press as: H. Jiang et al., Rough set and PSO-based ANFIS approaches to modeling customer satisfaction for affective product design,
Adv. Eng. Informat. (2015), http://dx.doi.org/10.1016/j.aei.2015.07.005

83 attributes and affective dimensions [11]. The main advantage of
84 the ANN is the development of models through learning from data
85 without requiring prior knowledge. Although a trained ANN can
86 possibly provide an accurate prediction or classification, it is
87 known as a ‘black box’ model from which no explicit knowledge
88 of the relationships can be obtained [12].
89 Multiple linear regression has been used to model affective rela-
90 tionships [13]. The approach is easy to apply, but it assumes that
91 the design attributes in the regression are linear, and the effect
92 of an independent design attribute is the same throughout the
93 entire range of the affective response. A decision support system
94 has been proposed to provide guidelines for optimizing affective
95 satisfaction based on principal component analysis and multiple
96 regression [14]. Petiot and Grognet [15] proposed an explicit mod-
97 eling method based on a vector field to model affective relation-
98 ships. You et al. [16] developed the customer satisfaction models
99 for automotive interior material using quantification I analysis.
100 Based on the models, the significance of the design attributes can
101 be identified. Han et al. [17] attempted to evaluate product usabil-
102 ity based on statistical regression models that relate usability
103 dimensions and design attributes. However, the above statistical
104 approaches are unable to address the fuzziness involved in the
105 affective responses of customers.
106 To address the fuzziness of affective modeling, Park and Han
107 proposed a fuzzy rule-based approach to examine customer satis-
108 faction towards office chair designs [18]. They reported that the
109 fuzzy rule-based approach outperformed the multiple linear
110 regression approaches in terms of the number of design attributes
111 to be considered in modeling. A fuzzy expert system with gradient
112 descent optimization was proposed to develop models that relate
113 affective responses to design attributes in fashion product develop-
114 ment [19]. Shimizu and Jindo [4] applied a fuzzy regression
115 method to model the relationship between design attributes and
116 affective responses to address the fuzziness of human sensations
117 towards vehicle interior design. Tanaka’s fuzzy regression
118 approach was proposed to model customer satisfaction for improv-
119 ing the design of driver seat [20]. However, the fuzzy regression
120 approach is unable to capture nonlinearity of the modeling. Chan
121 et al. introduced genetic programming into fuzzy regression for
122 modeling affective relationships [6]. An evolutionary algorithm
123 was used to construct branches of a tree representing the struc-
124 tures of a model where the nonlinearity of the model could be
125 addressed and the fuzzy regression was then used to determine
126 the fuzzy coefficients of the model. The limitation of this approach
127 is that the size of the search space increases exponentially with the
128 number of nodes and the tree depth.
129 The hybrid approaches of fuzzy logic and ANN combine the
130 capability of fuzzy logic in the linguistic representation of knowl-
131 edge and the adaptive learning capability of ANN for automatic
132 generation and optimization of a fuzzy inference system. Fuzzy
133 neural networks have been introduced to establish the relation-
134 ships between design attributes and consumer affections [21].
135 Fuzzy neural networks utilize a series of output nodes of the
136 ANN to emulate a fuzzy membership grade of affection intensity
137 and then determine the aggregate value of customer affection
138 through defuzzification. Hsiao and Tsai [22] proposed a method
139 that enables an automatic product form or product image evalua-
140 tion by means of a neural network-based fuzzy reasoning and
141 genetic algorithm, which was applied to establish relationships
142 between the design attributes of a new product and the customers’
143 affective image. An adaptive neuro-fuzzy inference system (ANFIS)
144 was examined by Kwong and Wong [23] to generate explicit cus-
145 tomer satisfaction models which can capture the nonlinearity
146 and fuzziness existing in the modeling. Compared with ANN, a
147 set of fuzzy if-then rules with appropriate membership functions
148 and the internal models can be generated based on ANFIS to
149stipulate input–output pairs explicitly. However, the conventional
150learning algorithms for ANFIS are gradient descent, in which the
151calculation of gradients in each step is difficult and the use of chain
152rules may cause a local minimum. These issues have been shown to
153affect modeling accuracy. On the other hand, ANFIS is not suitable
154for the modeling problems that involve a number of inputs. If the
155number of inputs is large, the number of generated fuzzy rules
156increases exponentially. These increases would cause long compu-
157tational time and even execution errors. To overcome the limita-
158tion and further improve modeling accuracy of ANFIS, in this
159paper, rough set (RS) and particle swarm optimization
160(PSO)-based ANFIS approaches are proposed to modeling customer
161satisfaction for affective design.
162The organization of this paper is as follows: Section 2 describes
163how the proposed approaches are used to model customer satisfac-
164tion for affective design. In Section 3, a case study of mobile phone
165design is described to illustrate the proposed approaches. The val-
166idation of the proposed approaches is shown in Section 4. Finally,
167conclusions are given in Section 5.
1682. Modeling customer satisfaction using RS and PSO-based
169ANFIS approaches
170To address the deficiency of ANFIS for modeling affective rela-
171tionships, RS and PSO-based ANFIS approaches are proposed in this
172research. Since ANFIS is incapable for application in those model-
173ing problems that involve a number of attributes, in the proposed
174approaches, RS theory is introduced to reduce the number of inputs
175and determine indispensable design attributes for generating cus-
176tomer satisfaction models. The PSO-based ANFIS approach is intro-
177duced to develop nonlinear customer satisfaction models, in which
178PSO is used to determine the optimal values of antecedent param-
179eters in membership functions, such that the errors between the
180predictive customer satisfaction values and the actual customer
181satisfaction values can be minimized. Fig. 1 shows a flowchart of
182the proposed approaches to modeling customer satisfaction for
183affective design.
1842.1. ANFIS structure
185ANFIS is a multilayer feed-forward network in which the neural
186network is regarded as a learning algorithm and fuzzy reasoning is
187used to map inputs into an output [24]. It is a fuzzy inference
Design and conduct customer
survey for affective design
Extract indispensable design
attributes using RS theory
Model customer satisfaction based
on PSO-based ANFIS approach
Generate customer satisfaction
models for affective design
Collect product samples and define
affective dimensions and design
attributes for customer survey
Fig. 1. The flowchart of the proposed approaches.
2 H. Jiang et al. / Advanced Engineering Informatics xxx (2015) xxx–xxx
ADVEI 620 No. of Pages 12, Model 5G
30 July 2015
Please cite this article in press as: H. Jiang et al., Rough set and PSO-based ANFIS approaches to modeling customer satisfaction for affective product design,
Adv. Eng. Informat. (2015), http://dx.doi.org/10.1016/j.aei.2015.07.005
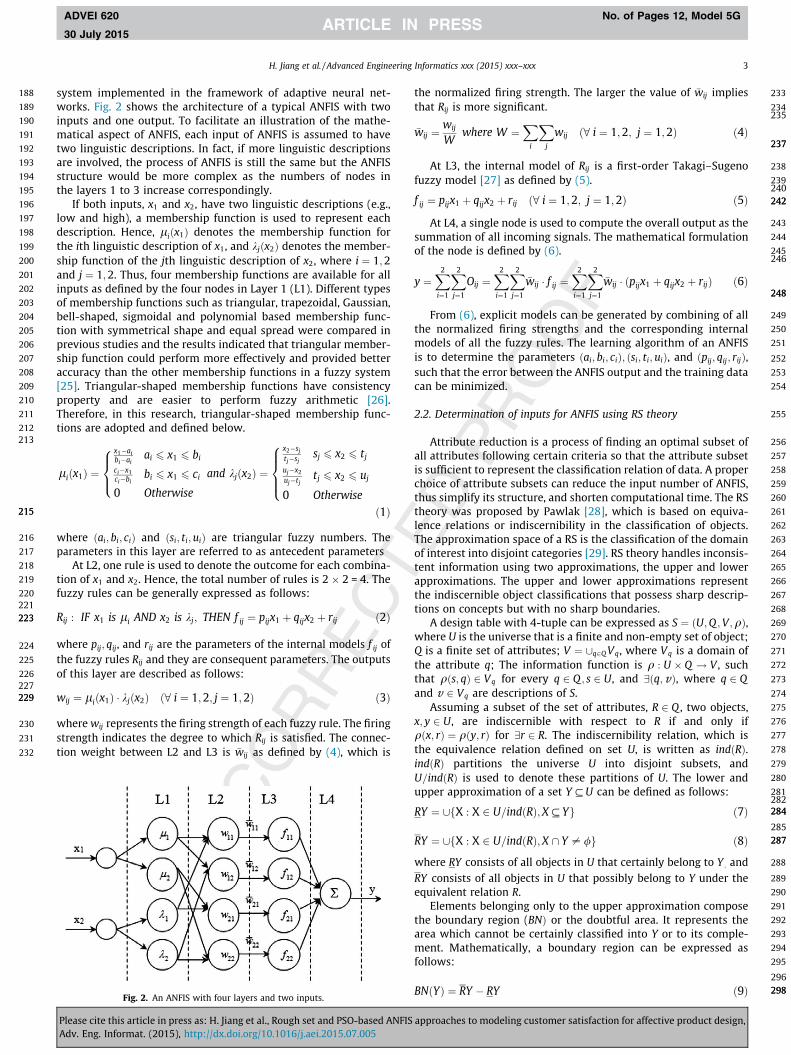
188 system implemented in the framework of adaptive neural net-
189 works. Fig. 2 shows the architecture of a typical ANFIS with two
190 inputs and one output. To facilitate an illustration of the mathe-
191 matical aspect of ANFIS, each input of ANFIS is assumed to have
192 two linguistic descriptions. In fact, if more linguistic descriptions
193 are involved, the process of ANFIS is still the same but the ANFIS
194 structure would be more complex as the numbers of nodes in
195 the layers 1 to 3 increase correspondingly.
196 If both inputs, x1 and x2, have two linguistic descriptions (e.g.,
197 low and high), a membership function is used to represent each
198 description. Hence, liðx1Þ denotes the membership function for
199 the ith linguistic description of x1, and kjðx2Þ denotes the member-
200 ship function of the jth linguistic description of x2, where i ¼ 1;2
201 and j ¼ 1;2. Thus, four membership functions are available for all
202 inputs as defined by the four nodes in Layer 1 (L1). Different types
203 of membership functions such as triangular, trapezoidal, Gaussian,
204 bell-shaped, sigmoidal and polynomial based membership func-
205 tion with symmetrical shape and equal spread were compared in
206 previous studies and the results indicated that triangular member-
207 ship function could perform more effectively and provided better
208 accuracy than the other membership functions in a fuzzy system
209 [25]. Triangular-shaped membership functions have consistency
210 property and are easier to perform fuzzy arithmetic [26].
211 Therefore, in this research, triangular-shaped membership func-
212 tions are adopted and defined below.213
liðx1Þ ¼
x1�aibi�ai
ai 6 x1 6 bi
ci�x1ci�bi
bi 6 x1 6 ci
0 Otherwise
8
>
<
>
:
and kjðx2Þ ¼
x2�sjtj�sj
sj 6 x2 6 tjuj�x2uj�tj
tj 6 x2 6 uj
0 Otherwise
8
>
>
<
>
>
:
ð1Þ215215
216 where ðai; bi; ciÞ and ðsi; ti;uiÞ are triangular fuzzy numbers. The
217 parameters in this layer are referred to as antecedent parameters
218 At L2, one rule is used to denote the outcome for each combina-
219 tion of x1 and x2. Hence, the total number of rules is 2 � 2 = 4. The
220 fuzzy rules can be generally expressed as follows:221
Rij : IF x1 is li AND x2 is kj; THEN f ij ¼ pijx1 þ qijx2 þ rij ð2Þ223223
224 where pij; qij, and rij are the parameters of the internal models f ij of
225 the fuzzy rules Rij and they are consequent parameters. The outputs
226 of this layer are described as follows:227
wij ¼ liðx1Þ � kjðx2Þ ð8 i ¼ 1;2; j ¼ 1;2Þ ð3Þ229229
230 wherewij represents the firing strength of each fuzzy rule. The firing
231 strength indicates the degree to which Rij is satisfied. The connec-
232 tion weight between L2 and L3 is �wij as defined by (4), which is
233the normalized firing strength. The larger the value of �wij implies
234that Rij is more significant.235
�wij ¼wij
Wwhere W ¼
X
i
X
j
wij ð8 i ¼ 1;2; j ¼ 1;2Þ ð4Þ237237
238At L3, the internal model of Rij is a first-order Takagi–Sugeno
239fuzzy model [27] as defined by (5).240
f ij ¼ pijx1 þ qijx2 þ rij ð8 i ¼ 1;2; j ¼ 1;2Þ ð5Þ 242242
243At L4, a single node is used to compute the overall output as the
244summation of all incoming signals. The mathematical formulation
245of the node is defined by (6).246
y ¼X
2
i¼1
X
2
j¼1
Oij ¼X
2
i¼1
X
2
j¼1
�wij � f ij ¼X
2
i¼1
X
2
j¼1
�wij � ðpijx1 þ qijx2 þ rijÞ ð6Þ248248
249From (6), explicit models can be generated by combining of all
250the normalized firing strengths and the corresponding internal
251models of all the fuzzy rules. The learning algorithm of an ANFIS
252is to determine the parameters ðai; bi; ciÞ; ðsi; ti; uiÞ, and ðpij; qij; rijÞ,
253such that the error between the ANFIS output and the training data
254can be minimized.
2552.2. Determination of inputs for ANFIS using RS theory
256Attribute reduction is a process of finding an optimal subset of
257all attributes following certain criteria so that the attribute subset
258is sufficient to represent the classification relation of data. A proper
259choice of attribute subsets can reduce the input number of ANFIS,
260thus simplify its structure, and shorten computational time. The RS
261theory was proposed by Pawlak [28], which is based on equiva-
262lence relations or indiscernibility in the classification of objects.
263The approximation space of a RS is the classification of the domain
264of interest into disjoint categories [29]. RS theory handles inconsis-
265tent information using two approximations, the upper and lower
266approximations. The upper and lower approximations represent
267the indiscernible object classifications that possess sharp descrip-
268tions on concepts but with no sharp boundaries.
269A design table with 4-tuple can be expressed as S ¼ ðU;Q ;V ;qÞ,270where U is the universe that is a finite and non-empty set of object;
271Q is a finite set of attributes; V ¼ [q2QVq, where Vq is a domain of
272the attribute q; The information function is q : U � Q ! V , such
273that qðs; qÞ 2 Vq for every q 2 Q ; s 2 U, and 9ðq;vÞ, where q 2 Q
274and v 2 Vq are descriptions of S.
275Assuming a subset of the set of attributes, R 2 Q , two objects,
276x; y 2 U, are indiscernible with respect to R if and only if
277qðx; rÞ ¼ qðy; rÞ for 9r 2 R. The indiscernibility relation, which is
278the equivalence relation defined on set U, is written as indðRÞ.
279indðRÞ partitions the universe U into disjoint subsets, and
280U=indðRÞ is used to denote these partitions of U. The lower and
281upper approximation of a set Y #U can be defined as follows:282
RY ¼ [fX : X 2 U=indðRÞ;X#Yg ð7Þ 284284
285
RY ¼ [fX : X 2 U=indðRÞ;X \ Y – /g ð8Þ 287287
288where RY consists of all objects in U that certainly belong to Y ; and
289RY consists of all objects in U that possibly belong to Y under the
290equivalent relation R.
291Elements belonging only to the upper approximation compose
292the boundary region (BNÞ or the doubtful area. It represents the
293area which cannot be certainly classified into Y or to its comple-
294ment. Mathematically, a boundary region can be expressed as
295follows:
296
BNðYÞ ¼ RY � RY ð9Þ 298298Fig. 2. An ANFIS with four layers and two inputs.
H. Jiang et al. / Advanced Engineering Informatics xxx (2015) xxx–xxx 3
ADVEI 620 No. of Pages 12, Model 5G
30 July 2015
Please cite this article in press as: H. Jiang et al., Rough set and PSO-based ANFIS approaches to modeling customer satisfaction for affective product design,
Adv. Eng. Informat. (2015), http://dx.doi.org/10.1016/j.aei.2015.07.005

299 The positive region PosRðYÞ and the negative region NegRðYÞ of Y on
300 R are defined by (10) and (11), respectively.301
PosRðYÞ ¼ RY ð10Þ303303
304
NegRðYÞ ¼ U � PosRðYÞ ð11Þ306306
307 Based on the above definitions, attribute reduction is defined as
308 follows:
309 If R is a set of equivalent relation, r 2 R, and PosRðYÞ
310 – PosR�frgðYÞ, namely, indðRÞ – indðR� frgÞ;R is the independent
311 attribute and r is the indispensable attribute in R, otherwise r is
312 dispensable.
313 If R is independent, R# P and indðRÞ ¼ indðPÞ;R is a reduction of
314 P;R 2 REDðPÞ. REDðPÞ represents the set of all the attribute reduc-
315 tions of P. The intersection of REDðPÞ is the core of P, which is
316 expressed as CoreðPÞ.
317 The number of each design attribute appearing in the attribute
318 reductions reflects the importance of each design attribute. A lar-
319 ger number implies that the corresponding design attribute is
320 more important. Based on the numbers, ranking of the design attri-
321 butes can be performed and the top ranking attributes are selected
322 as the inputs of the PSO-based ANFIS.
323 2.3. Determination of parameters for ANFIS using PSO and LSE
324 The learning algorithm of an ANFIS aims to determine the ante-
325 cedent and consequent parameters such that the error between the
326 ANFIS output and the actual output can be minimized. Jang pro-
327 posed a hybrid learning algorithm which is composed of a forward
328 pass and a backward pass to complete training and updating in an
329 adaptive network [30]. Referring to the ANFIS structure (Fig. 2),
330 given the values of antecedent parameters, the overall output can
331 be expressed as a linear combination of the consequent parameters
332 as follows:333
y¼X
2
i¼1
X
2
j¼1
�wijðpijx1þqijx2þ rijÞ
¼ �w11ðp11x1þq11x2þ r11Þþ �w12ðp12x1þq12x2þ r12Þ
þ �w21ðp21x1þq21x2þ r21Þþ �w22ðp22x1þq22x2þ r22Þ
¼ ð �w11x1Þp11þð �w11x2Þq11þð �w11Þr11þð �w12x1Þp12þð �w12x2Þq12þð �w12Þr12
þð �w21x1Þp21þð �w21x2Þq21þð �w21Þr21þð �w22x1Þp22
þð �w22x2Þq22þð �w22Þr22 ¼Ah
ð12Þ335335
336 where A ¼ ð�w11x1, �w11x2, �w11, �w12x1, �w12x2, �w12, �w21x1, �w21x2, �w21,
337 �w22x1, �w22x2, �w22Þ and h is a vector of the consequent parameters
338 (p11, q11, r11, p12, q12, r12, p21, q21, r21, p22, q22, r22Þ. The number of
339 the consequent parameters of (12) is 12. If there are t training data
340 sets, the dimensions of A; h, and y are t � 12;12� 1, and t � 1,
341 respectively.
342 In the forward pass, the antecedent parameters are fixed, and
343 the input signals go forward to calculate each node output until
344 matrix A in (12) is obtained. The consequent parameters are then
345 determined using the least square estimation (LSE) method. An
346 LSE value of h; h, aims at minimizing the squared error Ah� yk k2,
347 which is calculated based on the following formulations.348
hiþ1 ¼ hi þSiþ1aiþ1ðb
Tiþ1 � aTiþ1hiÞ
1þ aTiþ1Siþ1aiþ1
ð13Þ350350
351
Siþ1 ¼ Si �Siaiþ1a
Tiþ1Si
1þ aTiþ1Siaiþ1
ð14Þ353353
354 where aTi is the ith row vector of matrix A;bTi is the ith element of
355 y; i ¼ 1; . . . ; t; Si is the covariance matrix and S0 ¼ cI; c is a positive
356 large number; and I is the identity matrix with a 12� 12 dimension.
357The predictive output y of ANFIS is obtained based on the iden-
358tified value of h.359
y ¼ Ah ð15Þ 361361
362In the backward pass, the error rates propagate backward, and
363the antecedent parameters are updated. The conventional algo-
364rithm for updating the antecedent parameters is the gradient des-
365cent method. However, it is very difficult to determine the best
366learning rate in the gradient descent method, and the convergence
367of antecedent parameters based on the method is slow. In this
368study, a PSO algorithm is introduced to determine and update
369the antecedent parameters. PSO has a high degree of stability
370and has been demonstrated to have fast convergence. It does not
371rely on the derivative nature of objective function and can achieve
372global optimization by comparing objective function values time
373after time.
374PSO is a popular search algorithm based on the social behavior
375of a bird flock [31]. In PSO, every potential solution of the optimiza-
376tion problem can be imagined as being a point in a D-dimensional
377search space. This point is called a ‘particle’. Particles fly in search
378space with a certain speed, which is dynamically adjusted accord-
379ing to its own and its companions’ flight experience. Every particle
380has a fitness value determined by the objective function and knows
381its current position and its own current best position, pbest . The pbest
382can be seen as the particle’s own flying experience. In addition,
383every particle also knows the global best position gbest , which has
384the best value in pbest . The gbest can be seen as its companions’ flying
385experience for the particle. Every particle uses the following infor-
386mation to change their current location: (1) the current location;
387(2) the current speed; (3) the distance between the current loca-
388tion and its own best location; and (4) the distance between the
389current location and the global best location. The optimization
390search is achieved by the iteration of a particle swarm which is
391formed by a group of random initialized particles.
392A swarm is composed of m particles flying in the D-dimension
393in a certain speed. Every particle changes its position based on
394considering its own historical best position and other particles’
395historical best position. The position for the ith particle is xi ¼
396ðxi1; xi2; . . . ; xidÞ, where 1 6 i 6 m and 1 6 d 6 D. D is the dimension
397of the search space as well as the number of antecedent parame-
398ters. The speed for the ith particle is v i ¼ ðv i1;v i2; . . . ;v idÞ. The his-
399torical best position of the ith particle, which has the minimum
400fitness value, is pi ¼ ðpi1; pi2; . . . ; pidÞ. The best position gbest for the
401whole swarm is pg ¼ ðpj1; pj2; . . . ; pjdÞ; j 2 1;2; . . . ;mf g. The final
402result of pg denotes the optimal values of the antecedent parame-
403ters. The process of updating the speed and the position of the par-
404ticle based on the idea of inertia weight [32] is expressed as
405follows:406
vkþ1id ¼ xvk
id þ c1r1ðpkid � xkidÞ þ c2r2ðp
kjd � xkidÞ ð16Þ 408408
409
xkþ1id ¼ xkid þ v
kþ1id ð17Þ 411411
412where vkid and xkid are the speed vector and the position vector of the
413ith particle at the kth iteration, respectively; k is the number of iter-
414ations; w is the inertia weight, the value of which decides the quan-
415tity inherited from the current speed of the particle; c1 and c2 are
416learning factors and are usually set as 2; The values of r1 and r2417are randomly chosen from the range 0;1½ �.
4182.4. Proposed RS and PSO-based ANFIS approaches to modeling
419customer satisfaction for affective design
420The processes of modeling customer satisfaction for affective
421design based on the proposed approaches are shown as follows:
4 H. Jiang et al. / Advanced Engineering Informatics xxx (2015) xxx–xxx
ADVEI 620 No. of Pages 12, Model 5G
30 July 2015
Please cite this article in press as: H. Jiang et al., Rough set and PSO-based ANFIS approaches to modeling customer satisfaction for affective product design,
Adv. Eng. Informat. (2015), http://dx.doi.org/10.1016/j.aei.2015.07.005

422 Step 1: A customer survey is designed and conducted to obtain
423 affective responses of customers on products.
424 Step 2: Once survey data is obtained, the values of the affective
425 responses are discretized and used as the outputs. Based on the
426 survey data, RS theory is introduced to identify redundant attri-
427 butes and generate a list of attribute reductions.
428 Step 3: Based on the list of the attribute reductions, the number
429 of each design attribute appearing in the list is calculated. The
430 ranking for all the design attributes is obtained based on the
431 number and the important design attributes are then selected
432 as the inputs of PSO-based ANFIS.
433 Step 4: Using the extracted design attributes as the inputs, the
434 ANFIS is trained by the hybrid learning algorithm of PSO and
435 LSE. The initialization for a particle swarm is first conducted,
436 including iteration number, swarm size, dimension of search
437 space, search range and learning factors. The speed and position
438 of each particle are initialized randomly.
439 Step 5: In the first iteration, the initial position of every particle
440 is used as the initial individual best position pb, and the position
441 vector of each particle is used as the antecedent parameters of
442 ANFIS in sequence. The initial iteration is followed by calculat-
443 ing the values of membership functions li and kj, the firing
444 strength wij, and the normalized firing strength wij using (1),
445 (3), and (4), respectively. Based on the input data sets and the
446 initial values of the consequent parameters, the values of the
447 fuzzy rule f ij are determined based on (5). Therefore, the out-
448 puts of all nodes reach L4. The final output y is then obtained
449 using (6). LSE is used to identify the consequent parameters h
450 using (13) and (14). The identified h and the matrix A in (12)
451 are then used to compute for the value of the predictive output
452 y based on (15). Next, the mean absolute percentage error (MEÞ
453 between the model output y and the actual value for the ith par-
454 ticle is calculated, which is also the fitness value ME1i of the ith
455 particle in the first iteration. ME1i is recorded as the initial indi-
456 vidual best fitness value pbest . The particle which has the small-
457 est value in ME1i is selected as the best particle. The particle’s
458 position vector is defined as the initial global best position pg ,
459 and its fitness value is defined as the initial global best fitness
460 value gbest .
461 Step 6: The iteration is continued by nþ 1 ! n. In each itera-
462 tion, the speed vector vnþ1id and the position vector xnþ1
id for each
463 particle are updated based on (16) and (17), respectively. Then,
464 the MEni of the ith particle in the nth iteration is calculated
465 based on the updated position of particles. The current fitness
466 value MEni is compared with pbest for each particle. If the value
467 of MEni is smaller than pbest , the individual best fitness value
468 pbest is set as the value of MEni , and the particle’s individual opti-
469 mal position along with its new position pb ¼ xnid are updated.
470 Step 7: The iteration stops when the pre-defined number of
471 iterations is satisfied. The global best fitness value gbest is
472 updated by selecting the smallest value in pbest and the number
473 of the best particle is then recorded. The global best position pg
474 is decided as the position of the selected best particle. The val-
475 ues of pg are the identified antecedent parameters and the val-
476 ues of h are the identified consequent parameters.
477 Step 8: Based on the antecedent and consequent parameters,
478 the customer satisfaction models can be obtained using (1),
479 (3), (4), and (6). The fuzzy rules are generated based on (2).
480
481 3. Case study
482 A case study of mobile phone design is used in this study to
483 illustrate the proposed approaches to model the relationships
484between affective responses and design attributes. A total of
48532 mobile phones of various brands were selected.
486Morphological analysis was used to study the representative
487attributes of mobile phones as numerical data sets. Table 1
488shows the nine representative design attributes: top shape, bot-
489tom shape, side shape, function button shape, number buttons
490style, screen size, thickness, layout, and weight, which are
491denoted as x1; x2; x3; x4; x5; x6; x7; x8, and x9, respectively. Design
492attributes have different numbers of form which range from 3
493to 6. Four affective dimensions were used to evaluate the affec-
494tive design of the mobile phones. They are simple–complex
495(S–C), unique–general (U–G), high-tech–classic (H–C), and
496handy–bulky (H–B), which are denoted as y1; y2; y3 and y4,
497respectively. A survey was conducted using a questionnaire, in
498which a five-point scale was used to assess the mobile phone
499appearance corresponding to the four affective dimensions.
500Design profiles of the samples and the means of the affective
501responses of respondents to the S–C, U–G, H–C, and H–B of
502the samples are shown in Table 2.
5033.1. Determination of inputs for PSO-based ANFIS
504With the survey data, Rosetta software was employed to extract
505important design attributes. Rosetta is a toolkit for analyzing tab-
506ular data within the framework of RS theory and can be used to
507support the overall data mining and knowledge discovery process
508including initial browsing and preprocessing of the data, computa-
509tion of minimal attribute sets, generation of descriptive patterns,
510and validation [33]. The previous research has shown that genetic
511algorithm based RS approach can obtain reducts effectively with
512high classification accuracy and derive larger number of reducts
513[34]. Therefore, in this study, the genetic reducer in Rosetta is used
514to conduct attributes reduction. The set of attribute reductions for
515S–C obtained from the software is shown in Table 3. The numbers
516for design attributes x1; x2; x3; x4; x5; x6; x7; x8, and x9 are 14, 11, 18,
51713, 9, 19, 14, 10, and 17, respectively. Based on the numbers, the
518ranking of importance of the design attributes is
519x6 > x3 > x9 > x7 ¼ x1 > x4 > x2 > x8 > x5. Similarly, the ranking
520results of the nine design attributes for U–G, H–C, and H–B are
521x1 > x7 > x5 ¼ x4 ¼ x3 > x6 ¼ x2 > x9 ¼ x8; x1 > x3 > x7 ¼ x5 > x9 ¼
522x4 > x8 ¼ x6 ¼ x2, and x9 > x7 > x4 > x5 ¼ x1 > x2 > x6 ¼ x3 > x8,
523respectively.
524In order to determine the number of inputs, the first two, three
525and four design attributes in the ranking were selected as inputs to
526model customer satisfaction. Using S–C as an example, if the num-
527ber of inputs is two, the input attributes are x3 and x6. The general
528form of wij and �wij can be expressed by (1), (3), and (4), as follows:
529
wij ¼ aijx3x6 þ bijx3 þ cijx6 þ dij ð18Þ 531531
532
�wij ¼aijx3x6 þbijx3 þcijx6 þdij
W ¼P3
i¼1
P3j¼1ðaijÞx3x6 þ
P3i¼1
P3j¼1ðbijÞx3 þ
P3i¼1
P3j¼1ðcijÞx6 þ
P3i¼1
P3j¼1ðdijÞ
ð19Þ 534534
535where
536
aij ¼
1ðbi�aiÞðtj�sjÞ
ai 6 x3 6 bi and sj 6 x6 6 tj
�1ðbi�aiÞðuj�tjÞ
ai 6 x3 6 bi and tj 6 x6 6 uj
�1ðci�biÞðtj�sjÞ
bi 6 x3 6 ci and sj 6 x6 6 tj
1ðci�biÞðuj�tjÞ
bi 6 x3 6 ci and tj 6 x6 6 uj
0 otherwise
8
>
>
>
>
>
>
>
>
>
>
>
>
>
<
>
>
>
>
>
>
>
>
>
>
>
>
>
:
538538
H. Jiang et al. / Advanced Engineering Informatics xxx (2015) xxx–xxx 5
ADVEI 620 No. of Pages 12, Model 5G
30 July 2015
Please cite this article in press as: H. Jiang et al., Rough set and PSO-based ANFIS approaches to modeling customer satisfaction for affective product design,
Adv. Eng. Informat. (2015), http://dx.doi.org/10.1016/j.aei.2015.07.005

539
bij ¼
�sjðbi�aiÞðtj�sjÞ
ai 6 x3 6 bi and sj 6 x6 6 tjuj
ðbi�aiÞðuj�tjÞai 6 x3 6 bi and tj 6 x6 6 uj
sjðci�biÞðtj�sjÞ
bi 6 x3 6 ci and sj 6 x6 6 tj�uj
ðci�biÞðuj�tjÞbi 6 x3 6 ci and tj 6 x6 6 uj
0 otherwise
8
>
>
>
>
>
>
>
>
>
<
>
>
>
>
>
>
>
>
>
:
541541
542
cij ¼
�aiðbi�aiÞðtj�sjÞ
ai 6 x3 6 bi and sj 6 x6 6 tjai
ðbi�aiÞðuj�tjÞai 6 x3 6 bi and tj 6 x6 6 uj
ciðci�biÞðtj�sjÞ
bi 6 x3 6 ci and sj 6 x6 6 tj�ci
ðci�biÞðuj�tjÞbi 6 x3 6 ci and tj 6 x6 6 uj
0 otherwise
8
>
>
>
>
>
>
>
>
<
>
>
>
>
>
>
>
>
:
544544
545
dij ¼
aisjðbi�aiÞðtj�sjÞ
ai 6 x3 6 bi and sj 6 x6 6 tj
�aiujðbi�aiÞðuj�tjÞ
ai 6 x3 6 bi and tj 6 x6 6 uj
�cisjðci�biÞðtj�sjÞ
bi 6 x3 6 ci and sj 6 x6 6 tj
ciujðci�biÞðuj�tjÞ
bi 6 x3 6 ci and tj 6 x6 6 uj
0 otherwise
8
>
>
>
>
>
>
>
>
>
>
>
>
>
<
>
>
>
>
>
>
>
>
>
>
>
>
>
:
547547
548Given that
549
Table 1
Morphological analysis on the 32 mobile phone samples.
Design attributes Alt. 1 Alt. 2 Alt. 3 Alt. 4 Alt. 5 Alt. 6
Top shape (x1Þ
Bottom shape (x2Þ
Side shape (x3Þ
Function button shape (x4Þ Other shape
Number buttons style (x5Þ Other style No number buttons
Screen size(x6Þ 52:2 in 2.4–2.8 in = 3 in
Thickness (x7Þ 510 mm 11–14 mm 15–18 mm =19 mm
Layout (x8Þ Other layout
Weight (x9Þ 580 g 83–100 g 101–120 g 125–140 g 141–149 g =150 g
Alt. – Alternative.
Oij ¼ �wij � f ij ¼ðaijx3x6 þ bijx3 þ cijx6 þ dijÞðpijx3 þ qijx6 þ rijÞ
W
¼aijpijðx3Þ
2x6 þ aijqijx3ðx6Þ2 þ bijpijðx3Þ
2 þ cijqijðx6Þ2 þ ðcijpij þ bijqij þ aijrijÞx3x6 þ ðdijpij þ bijrijÞx3 þ ðdijqij þ cijrijÞx6 þ dijrij
Wð20Þ
6 H. Jiang et al. / Advanced Engineering Informatics xxx (2015) xxx–xxx
ADVEI 620 No. of Pages 12, Model 5G
30 July 2015
Please cite this article in press as: H. Jiang et al., Rough set and PSO-based ANFIS approaches to modeling customer satisfaction for affective product design,
Adv. Eng. Informat. (2015), http://dx.doi.org/10.1016/j.aei.2015.07.005

550 The customer satisfaction model for S–C can be formulated by
551 (5), as follows:
552 where553
AP ¼X
3
i¼1
X
3
j¼1
aijpij; AQ ¼X
3
i¼1
X
3
j¼1
aijqij; BP ¼X
3
i¼1
X
3
j¼1
bijpij;
CQ ¼X
3
i¼1
X
3
j¼1
cijqij; CP ¼X
3
i¼1
X
3
j¼1
cijpij;555555
556557
BQ ¼X
3
i¼1
X
3
j¼1
bijqij; AR ¼X
3
i¼1
X
3
j¼1
aijrij; DP ¼X
3
i¼1
X
3
j¼1
dijpij;
BR ¼X
3
i¼1
X
3
j¼1
bijrij; DQ ¼X
3
i¼1
X
3
j¼1
dijqij;559559
560
CR ¼X
3
i¼1
X
3
j¼1
cijrij; DR ¼X
3
i¼1
X
3
j¼1
dijrij; A ¼X
3
i¼1
X
3
j¼1
aij;
B ¼X
3
i¼1
X
3
j¼1
bij; C ¼X
3
i¼1
X
3
j¼1
cij; D ¼X
3
i¼1
X
3
j¼1
dij
562562
563In this study, triangular-shaped membership functions are
564used. Both inputs have three linguistic descriptions: small, med-
565ium, and large. The parameter settings of the proposed approaches
566for two inputs, three inputs and four inputs are shown in Table 4.
567Using the two inputs as an example, six sets of the antecedent
568parameters ðai; bi; ciÞ are available and the number of antecedent
569parameters to be identified is 6 � 3 = 18. The number of fuzzy rules
570is 3 � 3 = 9, and the number of consequent parameters to be
571trained is 9 � 3 = 27. The size of the particle swarm was set as
57230. The number of dimensions of the search space for PSO is 18,
573which is equal to the number of the antecedent parameters. The
574iteration number is directly related to the search time which was
575determined as 200 through the repeated operations to make sure
576that the least number of iterations and the proper search range
577can be obtained. The upper and lower values of the inertia weight
578w are 0.9 and 0.1, respectively. The learning factors c1 and c2 were
579set as 2. The proposed approaches were implemented using a
580Matlab software package to generate models that relate affective
581responses and the design attributes. Assuming that the values of
582the inputs belong to the left range of the membership function,
583the generated S–C models with two inputs, three inputs and four
584inputs are obtained as shown in (22)–(24), respectively.
585586
Table 2
Design matrix of 32 mobile phone samples.
Phone No. x1 x2 x3 x4 x5 x6 x7 x8 x9 S–C U–G H–C H–B
1 3 3 1 3 2 2 3 1 2 1.85 3.62 2.97 2.56
2 3 3 2 2 1 1 2 1 2 2.59 3.44 3.15 2.79
3 6 6 1 1 5 1 4 1 4 2.88 2.76 3.21 3.32
4 4 4 3 1 6 1 2 2 2 2.41 2.65 2.88 2.59
5 3 4 3 4 6 1 2 2 3 2.06 2.85 2.53 2.47
6 3 3 1 5 6 2 3 2 4 2.71 2.41 2.15 3.18
7 1 1 2 4 6 2 4 2 4 3.26 2.53 2.47 3.18
8 1 1 1 2 6 2 2 2 2 2.79 2.74 2.50 2.71
9 3 4 6 1 6 1 3 2 2 2.91 2.65 2.85 3.12
10 4 4 3 6 4 1 2 1 2 2.65 2.82 3.00 2.15
11 2 2 6 5 6 2 4 2 3 2.76 2.62 2.47 3.18
12 2 2 6 3 6 2 3 2 4 2.71 2.56 2.41 3.38
13 6 6 6 4 6 1 3 2 2 2.09 2.76 2.85 2.71
14 4 4 2 6 6 3 2 3 2 2.21 2.09 2.09 1.94
15 4 3 6 1 6 2 3 2 4 2.44 2.82 2.71 3.09
16 3 3 6 5 6 3 3 2 5 2.62 2.15 2.35 2.94
17 3 3 2 6 6 3 2 3 3 2.12 2.53 2.35 3.03
18 2 4 6 5 2 1 1 1 2 2.50 3.38 2.97 2.59
19 3 3 1 4 5 2 3 1 3 2.41 3.00 3.00 3.03
20 4 4 6 5 1 1 2 1 3 2.68 3.68 3.53 3.06
21 4 4 1 1 2 1 2 1 2 2.88 3.35 3.29 3.12
22 6 4 3 1 4 2 2 1 3 2.88 2.94 2.97 2.97
23 3 3 6 2 3 1 3 1 3 3.12 3.38 3.15 3.56
24 5 5 1 4 3 1 2 1 1 2.50 2.85 3.24 2.62
25 4 4 6 1 6 1 3 2 2 2.44 3.21 3.06 3.09
26 3 6 5 1 6 2 3 2 3 2.68 2.97 2.85 3.32
27 1 1 5 1 6 1 2 2 3 2.65 2.79 2.79 2.91
28 3 3 4 1 6 3 2 3 4 2.00 1.91 1.91 2.53
29 4 4 2 1 6 2 2 2 3 2.41 2.47 2.21 2.56
30 4 4 4 5 2 2 3 1 2 3.26 3.15 2.82 3.03
31 3 3 1 6 6 2 3 4 3 3.38 2.79 2.76 3.18
32 3 3 1 1 6 2 3 2 6 2.32 2.62 2.56 3.50
y ¼X
3
i¼1
X
3
j¼1
Oij ¼X
3
i¼1
X
3
j¼1
�wij � f ij ¼APðx3Þ
2x6 þ AQx3ðx6Þ2 þ BPðx3Þ
2 þ CQðx6Þ2 þ ðCP þ BQ þ ARÞx3x6 þ ðDP þ BRÞx3 þ ðDQ þ CRÞx6 þ DR
Ax3x6 þ Bx3 þ Cx6 þ Dð21Þ
H. Jiang et al. / Advanced Engineering Informatics xxx (2015) xxx–xxx 7
ADVEI 620 No. of Pages 12, Model 5G
30 July 2015
Please cite this article in press as: H. Jiang et al., Rough set and PSO-based ANFIS approaches to modeling customer satisfaction for affective product design,
Adv. Eng. Informat. (2015), http://dx.doi.org/10.1016/j.aei.2015.07.005

y1 ¼
0:0228x3ðx6Þ2x9�0:0171ðx3Þ
2x6x9þ0:0058x3x6ðx9Þ2þ0:0541ðx6Þ
2x9
þ0:3443x3ðx6Þ2þ0:0005ðx3Þ
2x9þ0:0098ðx3Þ2x6þ0:0216x6ðx9Þ
2
�0:0040x3ðx9Þ2þ0:1790x3x6x9þ0:8213ðx6Þ
2þ0:0028ðx3Þ2þ0:0009ðx9Þ
2
þ0:3974x6x9�0:9325x3x6�0:2384x3x9�0:1120x6þ0:5569x3
�0:1383x9�0:0755
0:0742x3x6x9�0:0829x3x9�0:0941x6x9�0:0740x3x6þ0:1051x9
þ0:0828x3þ0:0939x6�0:1049
ð23Þ588588
589
y1 ¼
0:0019x3ðx6Þ2x7x9þ0:0007ðx3Þ
2x6x7x9�0:0020x3x6x7ðx9Þ2
þ0:0021x3x6ðx7Þ2x9þ0:0232ðx6Þ
2x7x9þ0:0299x3ðx6Þ
2x7
þ0:0021x3ðx6Þ2x9�0:0039ðx3Þ
2x7x9þ0:0660ðx3Þ2x6x7
�0:0016ðx3Þ2x6x9�0:0019x3x7ðx9Þ
2þ0:0177x6x7ðx9Þ2
�0:0108x3x6ðx9Þ2�0:0009x3ðx7Þ
2x9þ0:0276x6ðx7Þ
2x9
þ0:0271x3x6ðx7Þ2þ0:0198x3x6x7x9þ0:3469ðx6Þ
2x7þ0:0304ðx6Þ2x9
þ0:0524x3ðx6Þ2�0:0111ðx3Þ
2x7�0:0049ðx3Þ
2x9þ0:0819ðx3Þ
2x6
þ0:0142x7ðx9Þ2�0:0010x3ðx9Þ
2�0:0730x6ðx9Þ2�0:0055ðx7Þ
2x9
�0:0074x3ðx7Þ2þ0:2745x6ðx7Þ
2þ0:3810x6x7x9þ0:1925x3x6x7
�0:0525x3x6x9�0:0443x3x7x9þ0:4586x6x7�0:7456x6x9þ0:3896x3x6
�0:3440x3x7�0:0459x3x9�0:0566x7x9þ0:6697ðx6Þ2�0:0124ðx3Þ
2
þ0:0418ðx9Þ2�0:0896ðx7Þ
2�0:0962x6�0:5378x3þ0:2785x9
�0:2842x7�0:1167
0:0656x3x6x7x9�0:0581x3x7x9�0:0635x6x7x9�0:0714x3x6x7
�0:0699x3x6x9þ0:0562x7x9þ0:0633x3x7þ0:0692x6x7þ0:0619x3x9
þ0:0677x6x9þ0:0762x3x6�0:0612x7�0:0600x9�0:0675x3
�0:0738x6þ0:0653
ð24Þ 591591
592To compare the modeling results based on the two inputs, three
593inputs and four inputs, ME and variance of errors (VoEÞ were
594adopted, as defined by (25) and (26), respectively.595
ME ¼1
t
X
t
k¼1
yk � ykj j
yk� 100 ð25Þ
597597
598
VoE ¼1
t � 1
X
t
k¼1
yk � ykj j
yk� 100�ME
� �2
ð26Þ600600
601where t is the number of data sets. yk is the kth predictive output
602based on the identified model and yk is the kth actual output based
603on the survey data.
604The training errors and structure of the generated models are
605compared in Table 5. From the table, it can be seen that the values
606of ME and VoE for two inputs, three inputs and four inputs all are
607very small and have the same order of magnitude. However, the
608number of terms of the generated models based on the four inputs
609and three inputs are five times and two times more than that with
610two inputs, respectively. On the other hand, the number of fuzzy
611rules generated for the four inputs and three inputs are nine times
Table 5
Comparison of modeling results for two inputs, three inputs and four inputs.
Training results Two inputs (x6and x3Þ
Three inputs
(x6; x3 and x9Þ
Four inputs
(x6; x3; x9 and x7Þ
Structure
(number of
terms)
12 28 64
ME (%) 4.1071 ⁄ 10�2 6.7214 ⁄ 10�2 4.0846 ⁄ 10�2
VoE (%) 3.3555 ⁄ 10�2 7.9524 ⁄ 10�2 3.2517 ⁄ 10�2
Table 3
Attribute reduction sheet for S–C.
No. Reduct Support Length
1 fx1; x3; x9g 100 3
2 fx3; x4; x6g 100 3
3 fx4; x6; x9g 100 3
4 fx2; x6; x9g 100 3
5 fx2; x3; x6g 100 3
6 fx2; x6; x7g 100 3
7 fx4; x5; x6g 100 3
8 fx2; x3; x5; x9g 100 4
9 fx1; x3; x6; x8g 100 4
10 fx2; x3; x4; x9g 100 4
11 fx1; x5; x7; x9g 100 4
12 fx1; x6; x8; x9g 100 4
13 fx1; x2; x3; x4g 100 4
14 fx1; x5; x6; x9g 100 4
15 fx1; x6; x7; x9g 100 4
16 fx1; x3; x5; x6g 100 4
17 fx2; x3; x4; x8g 100 4
18 fx3; x6; x7; x9g 100 4
19 fx3; x5; x6; x9g 100 4
20 fx3; x5; x6; x7g 100 4
21 fx1; x4; x7; x9g 100 4
22 fx2; x3; x4; x5g 100 4
23 fx1; x2; x3; x8g 100 4
24 fx3; x4; x7; x9g 100 4
25 fx2; x4; x7; x9g 100 4
26 fx3; x7; x8; x9g 100 4
27 fx2; x3; x8; x9g 100 4
28 fx1; x4; x8; x9g 100 4
29 fx1; x5; x6; x7g 100 4
30 fx1; x4; x6; x7g 100 4
31 fx3; x6; x7; x8g 100 4
32 fx1; x6; x7; x8g 100 4
33 fx4; x6; x7; x8g 100 4
Table 4
Parameter settings of the proposed approaches for different inputs.
Parameters Two inputs
(x6 and x3Þ
Three inputs
(x6; x3 and x9Þ
Four inputs
(x6; x3; x9 and x7Þ
Number of
antecedent
parameters
18 27 36
Number of
consequent
parameters
27 108 405
Number of fuzzy
rules
9 27 81
Dimensions of the
search space
18 27 36
The size of particle
swarm
30
Iteration number 200
Inertia weight [0.1, 0.9]
Learning factors 2
y1 ¼0:1170ðx3Þ
2x6 � 0:1421x3ðx6Þ2 � 0:1561ðx3Þ
2 þ 1:6626ðx6Þ2 þ 1:0187x3x6 � 0:8097x3 þ 0:4499x6 þ 0:0269
0:3900x3x6 � 0:3870x3 � 0:4065x6 þ 0:4035ð22Þ
8 H. Jiang et al. / Advanced Engineering Informatics xxx (2015) xxx–xxx
ADVEI 620 No. of Pages 12, Model 5G
30 July 2015
Please cite this article in press as: H. Jiang et al., Rough set and PSO-based ANFIS approaches to modeling customer satisfaction for affective product design,
Adv. Eng. Informat. (2015), http://dx.doi.org/10.1016/j.aei.2015.07.005

612and three times more than that for the two inputs, respectively.
613Therefore, having more inputs could substantially increase the
614complexity of the models and cause long computational time. In
615this research, models with two inputs were selected because of
616their simpler structures and good training accuracy.
617Using S–C as an example, the inputs were selected as x6 and x3,
618namely ‘screen size’ and ‘side shape’. Though intuitively the attri-
619butes ‘layout’ and ‘number buttons style’ are relevant to the S–C
620dimension, when we look at the morphological analysis of the 32
621mobile phones and also their product images, it can be noted that
622the larger screen size of mobile phones is, the less number of but-
623tons and larger screen layout are. The effect of ‘screen size’ is more
624dominated compared with the other two attributes in the survey
625data. Thus, the ‘screen size’ and ‘side shape’ were picked up by
626the algorithms.
6273.2. Evaluation of the proposed approaches
628To evaluate the effectiveness of the proposed approaches, the
629modeling results based on the proposed approaches are compared
Table 6
Developed models and their training results.
Affective responses Methods Generated models Training error (%)
ME VoE
S–C FLSR y1 ¼ 2:1624;2:4883ð Þ þ 0:1424;0:4980ð Þx1 þ ð�0:1442;0:4677Þx2 þ ð0:0350; 0Þx3 þ ð0:0423;0:3680Þx4þð�0:0047; 0Þx5 þ ð�0:1014;1:2000Þx6 þ ð0:0323;0:8275Þx7 þ ð0:0487;0Þx8 þ ð0:0832;0Þx9
11.9358 86.7696
FR y1 ¼ 2:2926; 0:0398ð Þ þ 0:0794;0:8812ð Þx1 þ ð�0:0532;1:5028Þx2 þ ð0:0268;0:4970Þx3 þ ð0:0080;0:4426Þx4þð�0:0299;11:4561Þx5 þ ð�0:3197;0:1294Þx6 þ ð0:1200;0:1075Þx7 þ ð0:0898; 0:0815Þx8 þ ð0:1048;0:0391Þx9
10.5370 99.3563
GP-FR y1 ¼ ð3:0111;0Þx1x8 þ ð�0:0655;1:9000Þ 8.6447 63.2346
RS-PSO-ANFIS
y1 ¼
0:1170ðx3Þ2x6 � 0:1421x3ðx6Þ
2 � 0:1561ðx3Þ2 þ 1:6626ðx6Þ
2
þ1:0187x3x6 � 0:8097x3 þ 0:4499x6 þ 0:02690:3900x3x6�0:3870x3�0:4065x6þ0:4035
4.1071 ⁄ 10�2 3.3555 ⁄ 10�2
U–G FLSR y2 ¼ 3:0714;1:2023ð Þ þ �0:0208;0:1323ð Þx1 þ ð0:0311;0:0706Þx2 þ ð0:0183;0:2025Þx3 þ ð0:0197;0:2203Þx4þð�0:1360;0:0752Þx5 þ ð�0:0692; 0:7018Þx6 þ ð0:2407;0:4483Þx7 þ ð�0:0305;0:2812Þx8 þ ð�0:0704;0:0680Þx9
8.7704 22.1099
FR y2 ¼ 3:7652; 0ð Þ þ �0:0265;0:0115ð Þx1 þ ð�0:0181;0:0431Þx2 þ ð0:0164; 0Þx3 þ ð�0:0172; 0:0310Þx4þð�0:1966;0:0625Þx5 þ ð�0:1601; 0Þx6 þ ð0:2352;0Þx7 þ ð0:0234;0Þx8 þ ð�0:0913;0Þx9
6.9932 16.8974
GP-FR y2 ¼ ð3:7400;0Þx5 þ ð�0:1025;0Þðx1 þ x5x6Þ þ ð�0:0322;0:4066Þ 5.9050 22.7076
RS-PSO-ANFIS
y2 ¼
�0:0295ðx1Þ2x7 þ 0:1912x1ðx7Þ
2 � 0:0334ðx1Þ2 � 0:1516ðx7Þ
2
þ0:0155x1x7 þ 0:0122x1 þ 0:0346x7 þ 1:87390:2141x1x7�0:2943x1�0:9145x7þ1:2570
4.1701 ⁄ 10�2 2.2427 ⁄ 10�2
H–C FLSR y3 ¼ 2:8018;1:1861ð Þ þ 0:0294; 0:1507ð Þx1 þ ð0:0521;0:0930Þx2 þ ð0:0370; 0Þx3 þ ð�0:0125; 0:2105Þx4þð�0:0822;0:1407Þx5 þ ð�0:1852; 0:6564Þx6 þ ð0:1857;0:2869Þx7 þ ð�0:0602;0:1308Þx8 þ ð�0:0227;0:2046Þx9
6.8264 23.0816
FR y3 ¼ 3:4891; 0ð Þ þ 0:0407;0ð Þx1 þ ð�0:0052;0Þx2 þ ð0:0236;0Þx3 þ ð0:0124; 0:0509Þx4þð�0:0544;0:0790Þx5 þ ð�0:3748;0Þx6 þ ð0:0953;0Þx7 þ ð�0:1003;0Þx8 þ ð�0:0440;0Þx9
6.2405 21.2462
GP-FR y3 ¼ ð4:3690; 0:0826Þx8 þ ð�0:9904;0:1261Þx28 þ ð0:1857;2:3901Þx6 þ ð�0:3144;0:2013Þ
4.8831 20.9459
RS-PSO-ANFIS
y3 ¼
0:3778ðx1Þ2x3 � 0:2061x1ðx3Þ
2 � 0:0577ðx1Þ2 þ 1:7976ðx3Þ
2
þ0:6227x1x3 � 0:2026x1 � 6:3250x3 þ 5:83720:0394x1x3�0:0595x1�0:0613x3þ0:0925
1.3829 ⁄ 10�2 1.7254 ⁄ 10�3
H–B FLSR y4 ¼ 1:4996; 0:6132ð Þ þ 0:0259; 0:2954ð Þx1 þ ð0:0518;0:2442Þx2 þ ð0:0404; 0Þx3 þ ð�0:0528; 0:0018Þx4þð�0:0157;0:0446Þx5 þ ð�0:0023;0:4259Þx6 þ ð0:3466;0:0134Þx7 þ ð0:0112; 0:3099Þx8 þ ð0:1391; 0:0515Þx9
9.0608 42.9147
FR y4 ¼ 1:7395; 0ð Þ þ 0:0352;0:0117ð Þx1 þ ð0:0493;0:0167Þx2 þ ð0:0215; 0Þx3 þ ð�0:0456; 0:0043Þx4þð�0:1063;0:1479Þx5 þ ð�0:2709; 0Þx6 þ ð0:2904;0Þx7 þ ð0:3296;0Þx8 þ ð0:2166; 0Þx9
8.6941 39.4641
GP-FR y4 ¼ ð2:6600;0Þx9x7 þ ð0:0711;0:0171Þx5x2x6 þ ð�0:0110;0:3819Þ
7.3000 48.9273
RS-PSO-ANFIS
y4 ¼
�0:0689ðx7Þ2x9 þ 0:0595x7ðx9Þ
2 þ 0:4928ðx7Þ2 � 0:0146ðx9Þ
2
þ0:1840x7x9 þ 0:5159x7 � 0:2617x9 þ 0:40970:1614x7x9�0:1698x7�0:2114x9þ0:2224
1.2640 ⁄ 10�2 3.6467 ⁄ 10�3
Fig. 3. Results of the iteration process of PSO for b1.
H. Jiang et al. / Advanced Engineering Informatics xxx (2015) xxx–xxx 9
ADVEI 620 No. of Pages 12, Model 5G
30 July 2015
Please cite this article in press as: H. Jiang et al., Rough set and PSO-based ANFIS approaches to modeling customer satisfaction for affective product design,
Adv. Eng. Informat. (2015), http://dx.doi.org/10.1016/j.aei.2015.07.005

630with those based on ANFIS, fuzzy least-squares regression (FLSR),
631fuzzy regression (FR) and genetic programming based fuzzy regres-
632sion (GP-FR). However, the ANFIS models could not be developed
633since the training process of ANFIS was a failure and an ‘out of
634memory’ error occurred, because its structure was too complex.
635Considering that the PSO-based ANFIS is a stochastic method, 30
636runs on the proposed approaches were conducted, and the mean
637of the 30 runs was calculated. The generated fuzzy rules (RijÞ for
638the S–C, U–G, H–C, and H–B are shown in Appendix A, where
639i ¼ 1; 2; 3; j ¼ 1; 2; 3. The optimal value setting of the antece-
640dent parameters is determined through the iteration of PSO.
641Fig. 3 shows the results of the iteration process of PSO for the cen-
642ter of the first membership function b1 for S–C.
643The same survey data was also used to develop the models
644based on the proposed approaches, FLSR, FR and GP-FR approaches
645for the four affective dimensions. Table 6 shows the developed
646models, training errors, and the variance of training errors. From
647the table, it can be seen that all the developed models can capture
648the fuzziness of the modeling. However, only the models devel-
649oped based on the proposed approaches and the GP-FR models
650can address the nonlinearity of the modeling. The table also shows
651that the values of ME and VoE based on the proposed approaches
652are the smallest compared with those based on the other three
653approaches.
6544. Validation of the proposed approaches
655A total of 30 validation tests were conducted to further evaluate
656the effectiveness of the proposed methodology. In each validation
657test, five data sets were randomly selected from the 32 data sets
Fig. 4. Validation results of the models for S–C.
Fig. 7. Validation results of the models for H–B.
Fig. 6. Validation results of the models for H–C.
Fig. 5. Validation results of the models for U–G.
Table 7
Means and variances of the validation errors for the four affective dimensions.
Affective
responses
Validation
error
FLSR FR GP-FR RS-PSO-ANFIS
S–C ME (%) 13.5352 9.5727 6.7991 0.0024
VoE (%) 74.5989 83.2105 35.8331 4.7686 ⁄ 10�5
U–G ME (%) 10.8509 6.7610 3.7295 0.0062
VoE (%) 72.7121 14.6969 12.9238 1.6056 ⁄ 10�4
H–C ME (%) 11.9449 5.4254 3.6154 0.0110
VoE (%) 40.1570 16.5305 12.1622 6.2361 ⁄ 10�4
H–B ME (%) 9.2836 8.4071 5.6903 0.0028
VoE (%) 44.1524 37.2721 25.9304 1.2190 ⁄ 10�4
10 H. Jiang et al. / Advanced Engineering Informatics xxx (2015) xxx–xxx
ADVEI 620 No. of Pages 12, Model 5G
30 July 2015
Please cite this article in press as: H. Jiang et al., Rough set and PSO-based ANFIS approaches to modeling customer satisfaction for affective product design,
Adv. Eng. Informat. (2015), http://dx.doi.org/10.1016/j.aei.2015.07.005

658 as the testing data sets, and the remaining 27 data sets were used
659 to develop the customer satisfaction models. The validation tests
660 primarily aim to compare the validation errors of the generated
661 customer satisfaction models based on the proposed approaches
662 with those based on FLSR, FR, and GP-FR.
663 FLSR is developed based on the definition of weighted fuzzy
664 arithmetic and the least squares fitting criterion [35]. Different val-
665 ues for h (0 6 h < 1Þ were selected to examine how h affects the
666 results of FLSR [36]. It was found that the changes of h value do
667 not affect the center value of each fuzzy coefficient but influence
668 the value of spread. Also, when a larger value of h is chosen, the
669 prediction capability of the models would increase. Thus, in this
670 study, the h value of FLSR was set as 0.9 for obtaining good predic-
671 tion capability. After a number of trials using different h values
672 within a range of 0;1½ �, the h values of FR were set as 0.9 for S–C
673 and 0.5 for U–G, H–C, and H–B, as these settings led to the smallest
674 modeling errors. For GP-FR, the population size and the number of
675 iteration were set as 40 and 200, respectively. The generation gap,
676 crossover probability, and mutation probability were set as 0.8, 0.7,
677 and 0.3, respectively. The maximum depth of tree was set as 5. The
678 parameter settings of the generated models based on the proposed
679 approaches are shown in Section 3.1. The validation errors and VoE
680 were obtained using (25) and (26), respectively. The 30 validation
681 results for the S–C, U–G, H–C, and H–B models based on the four
682 methods are shown in Figs. 4–7, respectively. The lines with ‘+’,
683 ‘⁄’, ‘O’, and the solid line ‘-’ denote the validation results of the
684 FLSR, FR, GP-FR, and the proposed approaches, respectively.
685 Table 7 shows the mean validation errors and the mean VoE for
686 the four affective dimensions S–C, U–G, H–C, and H–B based on
687 the four approaches. From the figures and the table, it can be seen
688 that the proposed approaches outperform the other three
689 approaches in modeling customer satisfaction for affective design
690 in terms of prediction errors, mean validation errors and mean
691 VoE for all the affective dimensions.
692 5. Conclusion
693 ANFIS was shown to be an effective approach to generate expli-
694 cit customer satisfaction models for affective design, and can
695 address both fuzziness and nonlinearity of the modeling.
696 However, it is incapable of modeling the problems that involve a
697 number of inputs. Additionally, the conventional learning algo-
698 rithm of ANFIS is based on the gradient descent method, which
699 leads to slow convergence of the parameters. In this paper, RS
700 and PSO-based ANFIS approaches to modeling customer satisfac-
701 tion for affective design are proposed to overcome the limitation
702 and further improve the modeling accuracy. In the proposed
703 approaches, RS theory is introduced to reduce the number of inputs
704 and determine the indispensable attributes as the inputs of
705 PSO-based ANFIS. PSO is employed to determine the parameter
706 settings of the ANFIS which can provide better modeling accuracy.
707 A case study of affective product design of mobile phones was con-
708 ducted to illustrate and validate the proposed approaches. The four
709 affective dimensions, namely, S–C, U–G, H–C, and H–B, were con-
710 sidered. A total of 30 validation tests were conducted to evaluate
711 the effectiveness of the proposed approaches. At the beginning,
712 we included all the nine design attributes as the inputs of an
713 ANFIS, but ‘out of memory’ error occurred and the training process
714 of ANFIS failed due to highly complex structure of the ANFIS. With
715 the proposed approaches, explicit customer satisfaction models
716 can be generated which can address both the nonlinearity and
717 fuzziness of the modeling. Compared with the FLSR, FR, and
718 GP-FR approaches in modeling customer satisfaction for affective
719 design, the proposed approaches perform better than all these
720approaches in terms of training errors and validation errors.
721Future work could involve a study of determining optimal settings
722of design attributes for affective product design based on the gen-
723erated customer satisfaction models. On the other hand, some
724techniques could be explored to simplify the structures of the gen-
725erated customer satisfaction models.
726Acknowledgement
727The work described in this paper was fully supported by a grant
728from The Hong Kong Polytechnic University (Project No. G-YK81).
729Appendix A
730Fuzzy rules for S–C are shown as follows:731
R11 : IF x6 is l1 AND x3 is k1; THEN f 11 ¼1:5117x6�0:3394x3þ1:3808
R12 : IF x6 is l1AND x3 is k2; THEN f 12 ¼0:7060x6þ1:4597x3þ0:3531
R13 : IF x6 is l1 AND x3 is k3; THEN f 13 ¼0:4722x6þ0:1991x3þ0:1180
R21 : IF x6 is l2 AND x3 is k1; THEN f 21 ¼2:3674x6�0:2254x3þ3:9512
R22 : IF x6 is l2 AND x3 is k2; THEN f 22 ¼�8:5420x6þ1:4312x3�4:2708
R23 : IF x6 is l2 AND x3 is k3; THEN f 23 ¼0:0369x6�0:0121x3þ0:0092
R31 : IF x6 is l3 AND x3 is k1; THEN f 31 ¼0:0035x6þ0:0817x3þ0:0026
R32 : IF x6 is l3 AND x3 is k2; THEN f 32 ¼0:0051x6þ0:0823x3þ0:0026
R33 : IF x6 is l3 AND x3 is k3; THEN f 33 ¼0:0101x6þ0:0805x3þ0:0025733733
734Fuzzy rules for U–G are shown as follows:735
R11 : IF x1 is l1 AND x7 is k1; THEN f 11 ¼�0:4917x1�0:8716x7þ4:3940
R12 : IF x1 is l1 AND x7 is k2; THEN f 12 ¼�0:0379x1þ0:5080x7�0:8927
R13 : IF x1 is l1 AND x7 is k3; THEN f 13 ¼0:1869x1þ0:3145x7þ0:0393
R21 : IF x1 is l2 AND x7 is k1; THEN f 21 ¼�0:4399x1þ5:3350x7þ3:5210
R22 : IF x1 is l2 AND x7 is k2; THEN f 22 ¼�0:9409x1þ2:5969x7þ0:9266
R23 : IF x1 is l2 AND x7 is k3; THEN f 23 ¼0:0400x1þ0:1038x7þ0:0130
R31 : IF x1 is l3 AND x7 is k1; THEN f 31 ¼0:0941x1þ0:0065x7þ0:0029
R32 : IF x1 is l3 AND x7 is k2; THEN f 32 ¼0:0835x1þ0:0086x7þ0:0026
R33 : IF x1 is l3 AND x7 is k3; THEN f 33 ¼0:0811x1þ0:0203x7þ0:0025737737
738Fuzzy rules for H–C are shown as follows:739
R11 : IF x1 is l1 AND x3 is k1; THEN f 11 ¼�0:2365x1þ9:5598x3þ4:8719
R12 : IF x1 is l1 AND x3 is k2; THEN f 12 ¼45:9082x1þ12:3290x3�245:3522
R13 : IF x1 is l1 AND x3 is k3; THEN f 13 ¼0:0496x1þ0:0775x3þ0:0024
R21 : IF x1 is l2 AND x3 is k1; THEN f 21 ¼�0:0533x1�36:4828x3�0:3111
R22 : IF x1 is l2 AND x3 is k2; THEN f 22 ¼41:5233x1�46:2008x3þ20:1252
R23 : IF x1 is l2 AND x3 is k3; THEN f 23 ¼0:0042x1þ0:0993x3þ0:0031
R31 : IF x1 is l3 AND x3 is k1; THEN f 31 ¼0:1029x1þ0:0204x3þ0:0032
R32 : IF x1 is l3 AND x3 is k2; THEN f 32 ¼0:0462x1þ0:0063x3þ0:0014
R33 : IF x1 is l3 AND x3 is k3; THEN f 33 ¼0:0445x1þ0:0445x3þ0:0014741741
742Fuzzy rules for H–B are shown as follows:743
R11 : IF x7 is l1 AND x9 is k1; THEN f 11 ¼0:9047x7þ0:5873x9þ0:6901
R12 : IF x7 is l1 AND x9 is k2; THEN f 12 ¼�4:4788x7þ0:6989x9�2:2507
R13 : IF x7 is l1 AND x9 is k3; THEN f 13 ¼0:0026x7þ0:0204x9þ0:0006
R21 : IF x7 is l2 AND x9 is k1; THEN f 21 ¼0:2146x7þ0:9237x9þ0:0952
R22 : IF x7 is l2 AND x9 is k2; THEN f 22 ¼�1:4136x7þ0:6612x9�0:8071
R23 : IF x7 is l2 AND x9 is k3; THEN f 23 ¼0:0153x7þ0:1222x9þ0:0038
R31 : IF x7 is l3 AND x9 is k1; THEN f 31 ¼0:3298x7þ0:2137x9þ0:0412
R32 : IF x7 is l3 AND x9 is k2; THEN f 32 ¼0:1251x7þ0:1017x9þ0:0156
R33 : IF x7 is l3 AND x9 is k3; THEN f 33 ¼0745745
H. Jiang et al. / Advanced Engineering Informatics xxx (2015) xxx–xxx 11
ADVEI 620 No. of Pages 12, Model 5G
30 July 2015
Please cite this article in press as: H. Jiang et al., Rough set and PSO-based ANFIS approaches to modeling customer satisfaction for affective product design,
Adv. Eng. Informat. (2015), http://dx.doi.org/10.1016/j.aei.2015.07.005

746 References
747 [1] E.H. Creusen, J.P.L. Schoormans, The different roles of product appearance in748 consumer choice, J. Prod. Innov. Manage 22 (2005) 63–81.749 [2] C.H. Noble, M. Kumar, Using product design strategically to create deeper750 consumer connections, Bus. Horiz. 51 (2008) 441–450.751 [3] H.H. Lai, Y.M. Chang, H.C. Chang, A robust design approach for enhancing the752 feeling quality of a product: a car profile case study, Int. J. Ind. Ergon. 35 (2005)753 445–460.754 [4] Y. Shimizu, T. Jindo, A fuzzy logic analysis method for evaluating human755 sensitivities, Int. J. Ind. Ergon. 15 (1995) 39–47.756 [5] S.W. Hsiao, H.C. Huang, A neural network based approach for product form757 design, Des. Stud. 23 (2002) 67–84.758 [6] K.Y. Chan, C.K. Kwong, T.S. Dillon, K.Y. Fung, An intelligent fuzzy regression759 approach for affective product design that captures nonlinearity and fuzziness,760 J. Eng. Des. 22 (2011) 523–542.761 [7] F. Guo, W.L. Liu, F.T. Liu, H. Wang, T.B. Wang, Emotional design method of762 product presented in multi-dimensional variables based on Kansei763 engineering, J. Eng. Des. 25 (2014) 194–212.764 [8] M. Nagamachi, Kansei engineering: a new ergonomic consumer-oriented765 technology for product development, Appl. Ergon. 33 (1995) 3–11.766 [9] H. Wang, Q. Yang, Personalized customization in product design using767 customer attributes and artificial neural network, Proc. Inst. Mech. Eng. B: J.768 Eng. Manuf. 226 (2012) 1416–1420.769 [10] Z. Gu, M.X. Tang, J.H. Frazer, Capturing aesthetic intention during interactive770 evolution, Comput. Aided Des. 38 (2006) 224–237.771 [11] C.H. Chen, L.P. Khoo, W. Yan, An investigation into affective design using772 sorting technique and Kohonen self-organizing map, Adv. Eng. Softw. 37773 (2006) 334–349.774 [12] C.C. Yang, M.D. Shieh, A support vector regression based prediction model of775 affective responses for product form design, Comput. Ind. Eng. 59 (2010) 682–776 689.777 [13] M.C. Chuang, Y.C. Ma, Expressing the expected product images in product778 design of micro-electronic products, Int. J. Ind. Ergon. 27 (2001) 233–245.779 [14] C. Barnes, S.P. Lillford, Decision support for the design of affective products, J.780 Eng. Des. 20 (2009) 477–492.781 [15] J.F. Petiot, S. Grognet, Product design: a vectors field-based approach for782 preference modeling, J. Eng. Des. 17 (2006) 217–233.783 [16] H. You, T. Ryu, K. Oh, M.H. Yun, K.J. Kim, Development of customer satisfaction784 models for automotive interior materials, Int. J. Ind. Ergon. 36 (2006) 323–330.785 [17] S.H. Han, M.H. Yun, K.J. Kim, J.Y. Kwahk, Evaluation of product usability:786 development and validation of usability dimensions and design elements787 based on empirical models, Int. J. Ind. Ergon. 26 (2000) 477–488.788 [18] J. Park, S.H. Han, A fuzzy rule-based approach to modeling affective user789 satisfaction towards office chair design, Int. J. Ind. Ergon. 34 (2004) 31–47.
790[19] T.W. Lau, P.C.L. Hui, F.S.F. Ng, K.C.C. Chan, A new fuzzy approach to improve791fashion product development, Comput. Ind. 57 (2006) 82–92.792[20] G. Sekkeli, G. Koksal, I. Batmaz, O.T. Bayrak, Classification models based on793Tanaka’s fuzzy linear regression approach: the case of customer satisfaction794modeling, J. Intell. Fuzzy Syst. 21 (2010) 341–351.795[21] H.C. Tsai, S.W. Hsiao, F.K. Hung, An image evaluation approach for parameter-796based product form and color design, Comput. Aided Des. 38 (2006) 157–171.797[22] S.W. Hsiao, H.C. Tsai, Applying a hybrid approach based on fuzzy neural798network and genetic algorithm to product form design, Int. J. Ind. Ergon. 35799(2005) 411–428.800[23] C.K. Kwong, T.C. Wong, A neuro-fuzzy approach to generating customer801satisfaction model for new product development. in: IEEE International802Conference on Industrial Engineering and Engineering Management, 2008,803pp.1804–1808.804[24] Y.M. Wang, T.M.S. Elhag, An adaptive neuro-fuzzy inference system for bridge805risk assessment, Expert Syst. Appl. 34 (2008) 3099–3106.806[25] J. Zhao, B.K. Bose, Evaluation of membership functions for fuzzy logic807controlled induction motor drive, in: Proceeding of IEEE 2002 28th Annual808Conference of the Industrial Electronics Society, vol. 1, 2002, pp. 229–234.809[26] F.D. Sciascio, R. Carelli, Fuzzy basis functions for triangle-shaped membership810functions: Universal approximation – MISO case, in: Proceedings of Sixth811International Fuzzy Systems Association World Congress (IFSA’95), vol. 11,8121995, pp. 439-442.813[27] M. Sugeno, Industrial Applications of Fuzzy Control, Elsevier, Amsterdam,8141985.815[28] Z. Pawlak, Rough sets, Int. J. Comput. Inf. Sci. 11 (1982) 341–356.816[29] Z. Pawlak, Rough Sets: Theoretical Aspects of Reasoning About Data, Kluwer817Academic Pulishers, Boston, 1991.818[30] J.S.R. Jang, ANFIS: Adaptive-network-based fuzzy inference systems, IEEE819Trans. Syst. Man Cybern. 23 (1993) 665–685.820[31] A.G. Li, Z. Qin, F.M. Bao, S.P. He, Particle swarm optimization algorithms,821Comput. Eng. Appl. 38 (2002) 1–3.822[32] Y. Shi, R. Eberhart, A modified particle swarm optimizer, in: The 1998 IEEE823International Conference on Evolutionary Computation Proceedings, IEEE824World Congress on Computational Intelligence, 1998, pp. 69–73.825[33] D.L. Olson, D. Delen, Advanced Data Mining Techniques, Springer, Heidelberg,8262008.827[34] K. Zuhtuogullari, N. Allahverdi, N. Arikan, Genetic algorithm and rough sets828based hybrid approach for reduction of the input attributes in medical829systems, Int. J. Innov. Comput. Inf. Control 9 (2013) 3015–3037.830[35] Y.H.O. Chang, Hybrid fuzzy least-squares regression analysis and its reliability831measures, Fuzzy Sets Syst. 119 (2001) 225–246.832[36] C.K. Kwong, Y. Chen, K.Y. Chan, X. Luo, A generalized fuzzy least-squares833regression approach to modeling functional relationships in QFD, J. Eng. Des.83421 (2010) 601–613.
835
12 H. Jiang et al. / Advanced Engineering Informatics xxx (2015) xxx–xxx
ADVEI 620 No. of Pages 12, Model 5G
30 July 2015
Please cite this article in press as: H. Jiang et al., Rough set and PSO-based ANFIS approaches to modeling customer satisfaction for affective product design,
Adv. Eng. Informat. (2015), http://dx.doi.org/10.1016/j.aei.2015.07.005


