

* Author to whom the correspondence should be sent ([email protected])
Tel: +351 253 510 210 Fax: +351 253 510 217
1
2
TIME-DEPENDENT FLEXURAL BEHAVIOUR OF CRACKED STEEL FIBRE REINFORCED 3
SELF-COMPACTING CONCRETE PANELS 4
5
Amin Abrishambaf *1, Joaquim A. O. Barros1 and Vitor M.C.F. Cunha1 6
1 ISISE, Dep. Civil Eng., School Eng., University of Minho, Campus de Azurém 4800-058 Guimarães, Portugal 7
8
ABSTRACT 9
In the present work are described and discussed the results of an extensive experimental program that aims to study 10
the long-term behaviour of cracked steel fibre reinforced self-compacting concrete, SFRSCC, applied in laminar 11
structures. In a first stage, the influence of the initial crack opening level (wcr = 0.3 and 0.5 mm), applied stress level, 12
fibre orientation/dispersion and distance from the casting point, on the flexural creep behaviour of SFRSCC was 13
investigated. Moreover, in order to evaluate the effects of the creep phenomenon on the residual flexural strength, a 14
series of monotonic tests were also executed. It was found that wcr = 0.5 mm series showed a higher creep 15
coefficient comparing to the series with a lower initial crack opening. Furthermore, the creep performance of the 16
SFRSCC was influenced by the orientation of the extracted prismatic specimens regarding the direction of the 17
concrete flow within the cast panel. 18
19
Keywords: Long-Term Performance; Creep; Tensile Properties; Rheology; Fibre Reinforcement. 20

1
1. INTRODUCTION 1
Discrete fibres are increasingly being used in the construction industry to overcome the brittle nature of plain 2
concrete under tension, and either to avoid or reduce the use of conventional steel reinforcement. In fibre reinforced 3
concrete, FRC, macro-cracks that arise within the cementicious matrix are bridged by fibres randomly distributed in 4
the concrete. The fibres are able to transfer the stresses across the crack’s surfaces improving the tensile post-5
cracking strength that enhances the composite’s toughness and crack growth control, resulting favourable effects in 6
terms of load carrying capacity, ductility and durability of structures made by FRCs. It has been investigated 7
extensively that mechanical properties of steel fibre reinforced concrete, SFRC, depend on both the fibre orientation 8
and distribution [1-3]. Moreover, discrete fibres are more effective when preferentially aligned along the directions 9
of the principal tensile stresses. 10
The effectiveness of a fibre as a reinforcing element becomes more predominant after has been crossed by a crack. 11
Determination of the tensile post-cracking behaviour of SFRC has been widely studied, either by direct or indirect 12
tests [4-8]. However, regarding the long-term response of this composite, the available knowledge in literature is 13
still somehow quite scarce. 14
The creep deformation of the material could ultimately lead to the failure mechanism of the structural element at a 15
lower load than static ultimate load [9]. On the other hand, in some structural systems, the long-term deformation of 16
the structural element can be beneficial, since it enforces stresses to redistribute, which can limit the crack 17
propagation. From another point of view, if the creep deformation damages significantly affect the fibre/matrix 18
interface bond, it will lead to an undesirable excessive decrease on the post-cracking strength, thus the influence of 19
creep will be adverse [10]. Some information is available in literature regarding to the time-dependent behaviour of 20
FRC in the cracked state [10-14]. However, many of them mainly assessed the creep behaviour of concrete 21
reinforced with synthetic fibres [15-17]. It was reported that the cracked micro/macro-synthetic fibre reinforced 22
concrete presented significant crack widening over time under sustained uniaxial tensile load [9, 18]. There are also 23
some works regarding the creep evaluation of steel fibre reinforced concrete under uniaxial tensile loading [19, 20] 24
and flexural loading [10, 14]. It was showed that application of steel fibres in concrete limited long-term crack 25
widening considerably [13, 21]. It is worth noting that focus of the mentioned studies was principally on the beams 26

2
where, in the case of using steel fibre reinforced self-compacting concrete, the rotation of the fibres due to the 1
concrete flow was completely distinct of planar structures [22, 23]. 2
Creep in bending of a cracked SFRC element is the result of the following phenomena: concrete creep in 3
compression (produce basic creep); fibres creep at material level in tension; loss of fibre-matrix adherence and 4
subsequent fibre free-sliding. Creep of fibres is only significant in fibres susceptible to thermo-hygrometric effects, 5
not in the case of the steel fibres. It was shown that the time dependent alterations in the fibre and matrix interface 6
zone influence significantly the long-term fibre reinforcement effectiveness, and, consequently, the creep behaviour 7
of cracked fibre reinforced concrete [9, 18]. The crack width opening and progression with time are strongly 8
dependent of the long-term behaviour of concrete, load and environmental conditions. Therefore, it is important to 9
evaluate the concrete capability to maintain the crack opening width relatively low under a sustained load, in order 10
to guarantee the effectiveness of fibres under serviceability conditions. Moreover, despite being available some 11
standards for designing SFRC structures [24, 25], it seems that they still not take into account the long-term 12
behaviour under cracked conditions. Therefore, information regarding the long-term behaviour of cracked SFRC 13
elements, particularly planar structures, is still limited. Consequently, understanding the behaviour of cracked SFRC 14
elements under a sustained load will help towards a more rational design and accurate prediction of the composite 15
behaviour under serviceability conditions. 16
In the present work an extensive experimental program that aims to study the long-term behaviour of cracked steel 17
fibre reinforced self-compacting concrete, SFRSCC, is described. For this purpose, prismatic specimens were 18
extracted from a SFRSCC panel cast from its centre, and the relevant results obtained from the creep tests with these 19
specimens are presented and discussed. The influence of fibre orientation and dispersion on the creep behaviour of 20
cracked SFRSCC elements was appraised. This was achieved based on the angle between the extracted specimen’s 21
notch plane and the expected concrete flow direction, since extracted specimens were notched in distinct directions. 22
The prismatic specimens were previously subjected to a four-point bending test up to a certain crack width opening 23
(wcr = 0.3 and 0.5 mm). Then the bending test was carried out under a sustained load until the stabilization of the 24
crack width opening. In a first stage the influence of the initial crack opening level, applied stress level [50-100%], 25
fibre orientation/dispersion, and distance from the casting point on the flexural creep behaviour was investigated. 26
Afterwards, the specimens used in the flexural creep tests were subjected to an instantaneous four-point bending test 27
until failure. Finally, a series of instantaneous four-point bending tests were also executed on uncracked prismatic 28

3
specimens, in order to quantify the influence of the creep phenomenon on the evolution of the flexural residual 1
strength. 2
2. EXPERIMENTAL PROGRAM 3
2.1. Concrete mixture 4
A SFRSCC was produced according to the mixture composition given in Table 1. W/C abbreviates water (W) to 5
cement (C) ratio. Superplasticizer Sika® 3005 (SP) has been used to assure the required self-compactibility 6
requirements due to the low water content. A crushed granite coarse aggregate was used with a maximum aggregate 7
size of 12 mm. A fibre content of 60 kg/m3 of hooked-end steel fibres was used. The fibres had the following 8
characteristics: 33 mm of length, lf ; 0.55 mm of diameter, df ; aspect ratio, lf /df , of 60 and a yield stress of about 9
1100 MPa. The fresh concrete behaviour was determined by the Abrams cone slump test in the inverted position 10
according to EFNARC recommendations [26]. The spread diameter was approximately 590 mm. 11
The SFRSCC’s compressive strength was assessed by testing 6 cylinders with a diameter of 150 mm and a height of 12
300 mm. After casting, the specimens were stored in a climatic chamber room at constant temperature of 20 ºC and 13
relative humidity of 60%. The cylinders were tested at the age of 28 days, and an average compressive strength and 14
an average young modulus of 72 MPa and 42.15 GPa was obtained, respectively, with a coefficient of variation 15
(CoV) of 8.23% and 0.26%, respectively. 16
2.2. Specimens 17
The panel represents the outer layers of a sandwich panel conceived under the framework of a research project for 18
the development of modular prefabricated affordable houses [27, 28]. The casting of this panel for the SFRSCC 19
cracked creep tests was performed from its geometrical centre. However, previous research has revealed that this 20
casting procedure improves the residual tensile behaviour since due to the circular distribution of fibres through the 21
panel, a higher number of effective fibres exist in order to bridge the radial cracks formed when the panel was 22
loaded from its centre [29]. The fresh concrete was poured directly from a mixing truck by a U-shape channel 23
4
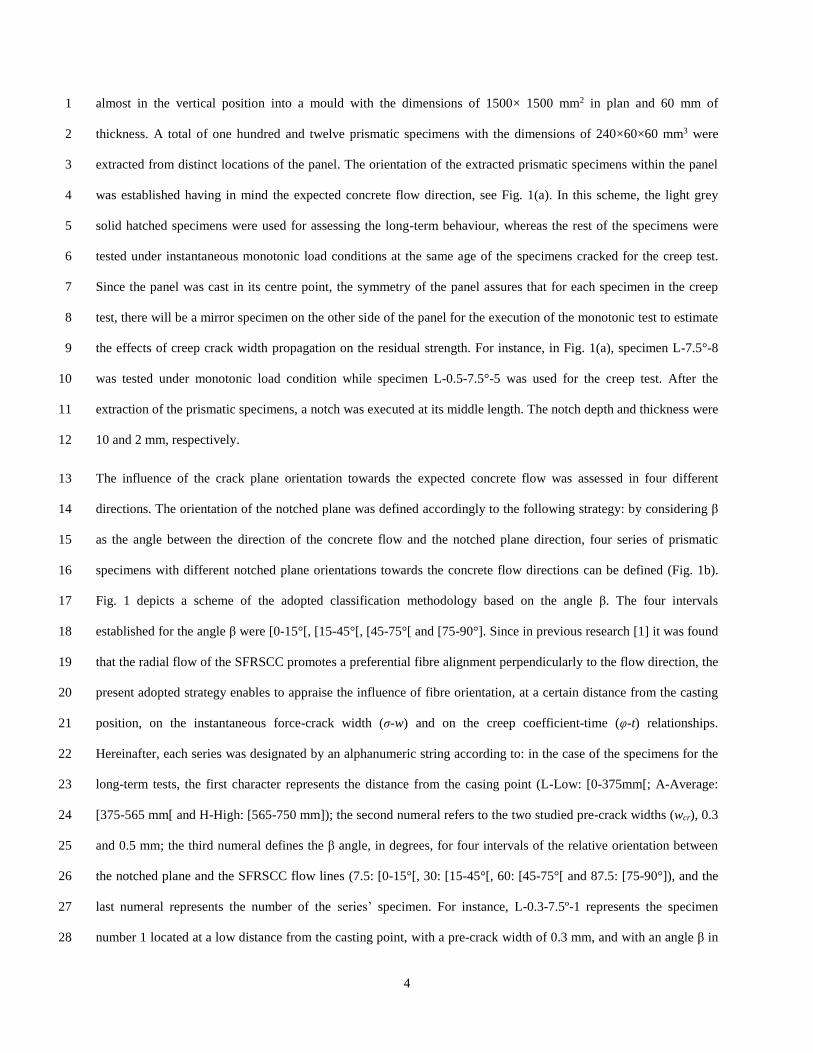
almost in the vertical position into a mould with the dimensions of 1500× 1500 mm2 in plan and 60 mm of 1
thickness. A total of one hundred and twelve prismatic specimens with the dimensions of 240×60×60 mm3 were 2
extracted from distinct locations of the panel. The orientation of the extracted prismatic specimens within the panel 3
was established having in mind the expected concrete flow direction, see Fig. 1(a). In this scheme, the light grey 4
solid hatched specimens were used for assessing the long-term behaviour, whereas the rest of the specimens were 5
tested under instantaneous monotonic load conditions at the same age of the specimens cracked for the creep test. 6
Since the panel was cast in its centre point, the symmetry of the panel assures that for each specimen in the creep 7
test, there will be a mirror specimen on the other side of the panel for the execution of the monotonic test to estimate 8
the effects of creep crack width propagation on the residual strength. For instance, in Fig. 1(a), specimen L-7.5°-8 9
was tested under monotonic load condition while specimen L-0.5-7.5°-5 was used for the creep test. After the 10
extraction of the prismatic specimens, a notch was executed at its middle length. The notch depth and thickness were 11
10 and 2 mm, respectively. 12
The influence of the crack plane orientation towards the expected concrete flow was assessed in four different 13
directions. The orientation of the notched plane was defined accordingly to the following strategy: by considering β 14
as the angle between the direction of the concrete flow and the notched plane direction, four series of prismatic 15
specimens with different notched plane orientations towards the concrete flow directions can be defined (Fig. 1b). 16
Fig. 1 depicts a scheme of the adopted classification methodology based on the angle β. The four intervals 17
established for the angle β were [0-15°[, [15-45°[, [45-75°[ and [75-90°]. Since in previous research [1] it was found 18
that the radial flow of the SFRSCC promotes a preferential fibre alignment perpendicularly to the flow direction, the 19
present adopted strategy enables to appraise the influence of fibre orientation, at a certain distance from the casting 20
position, on the instantaneous force-crack width (σ-w) and on the creep coefficient-time (φ-t) relationships. 21
Hereinafter, each series was designated by an alphanumeric string according to: in the case of the specimens for the 22
long-term tests, the first character represents the distance from the casing point (L-Low: [0-375mm[; A-Average: 23
[375-565 mm[ and H-High: [565-750 mm]); the second numeral refers to the two studied pre-crack widths (wcr), 0.3 24
and 0.5 mm; the third numeral defines the β angle, in degrees, for four intervals of the relative orientation between 25
the notched plane and the SFRSCC flow lines (7.5: [0-15°[, 30: [15-45°[, 60: [45-75°[ and 87.5: [75-90°]), and the 26
last numeral represents the number of the series’ specimen. For instance, L-0.3-7.5º-1 represents the specimen 27
number 1 located at a low distance from the casting point, with a pre-crack width of 0.3 mm, and with an angle β in 28

5
the [0-15°[ interval. A similar strategy for the designation of the instantaneous monotonic test specimens was 1
followed, however the second character that indicates the pre-crack width was ignored, since these tests were 2
performed on uncracked specimens in opposition to the creep tests. 3
2.3. Test setup 4
2.3.1. Monotonic four-point bending test 5
The instantaneous F-CTOD (crack tip opening displacement) relationship representative of the SFRSCC panel was 6
determined with a total of sixty four monotonic four-point bending tests. These tests were carried out on notched 7
beams extracted from the panel following the recommendations of Italian standard [25]. The monotonic tests were 8
carried out on a universal testing machine of 50 kN load bearing capacity and at a displacement rate of 0.002 mm/s. 9
Fig. 2 depicts the test setup and geometry of the specimen. To determine the deflection during the test, a LVDT 10
(Linear Variable Differential Transformers) was mounted on an aluminium bar supported at mid height of the 11
sections coinciding with the supports of the specimen in order to exclusively record the deflection of the specimen, 12
see Fig. 2(a). In order to follow the recommendations of UNI 11039 [25] this lateral face of the specimen coincides 13
with the surface of the SFRSCC panel in contact with the mould, and the notch was executed in the face parallel to 14
the casting direction. Therefore the bottom face of the specimen in the test setup corresponds to a lateral surface of 15
the extracted beam from the panel, i.e. the beam was rotated 90º along its longitudinal axis for testing. To assess an 16
eventual asymmetric crack opening, due to fibre segregation along the panel’s thickness, CTOD was measured by 17
installing three LVDTs on the beam’s bottom surface, see Fig. 2(b). These transducers recorded the crack opening 18
width at about 10 mm from the top and bottom surfaces of the panel, as well as at its middle height. The adopted 19
disposition of the aluminium LVDT supports mitigates the measurement of the elastic deformations surrounding the 20
mouth of the notch plane, see Fig. 2(c). 21
22
2.3.2. Long-term four-point bending tests 23
In order to obtain the long-term F-w (crack width) relationship, experimental tests were carried out in three stages: 24
firstly, the beams were pre-cracked up to a crack width of either 0.3 or 0.5 mm; secondly, the creep tests were 25

6
carried out on the pre-cracked beams until the stabilization of the creep crack width has been achieved; finally, post-1
creep bending tests were performed until failure of the specimen. 2
3
2.3.2.1. Pre-cracking of the specimens 4
The creep four-point bending tests were performed in pre-cracked specimens. Therefore, in a first stage, the 5
monotonic test set-up previously described was used to achieve the desired crack opening width (wcr). In this 6
research, two initial crack opening widths were studied, namely, 0.3 mm, recommended for the serviceability limit 7
state, and 0.5 mm that is coincide to the crack opening width corresponding to the one used to compute the residual 8
flexural strength, fR,1 [24]. Afterward, the test was stopped and the specimen unloaded. 9
10
2.3.2.2. Creep test 11
After finalizing the pre-cracking procedure, the specimens were carefully moved to the climate chamber room, at a 12
temperature of 20°C 0.5 and a 60% relative humidity 5%. The creep testing rigs were located inside this room, 13
thus the creep tests were carried out under controlled thermo-hygrometric conditions. The creep testing rig allowed 14
to simultaneously loading three specimens. Fig. 3(a) shows the adopted creep test set-up. Before mounting the 15
specimens in the creep testing frame, they were kept in the chamber room for five hours to acclimatize. The test was 16
executed under force control. Specimens were loaded by injecting oil into the hydraulic actuator until the desired 17
value of the load has been reached. The specimens’ loading procedure was carried out very carefully in order to 18
attain the target load level with the minimum deviation as possible. To measure the crack opening width, for each 19
specimen, one LVDT was installed at the middle of the notched surface, see Fig. 3(b). The LVDTs and load cell 20
were connected to a computerized data acquisition system. The data was recorded in distinct time-steps according to 21
the following procedure: during loading and unloading of specimen: one sample per 5 seconds; in the first and 22
second month after loading: one sample per 500 seconds and one sample per 1000 seconds, respectively. 23
After the initiation of the creep test, the value of the applied load, Fa, was fixed and maintained constant until the 24
crack opening width was stabilized. When the variation of the crack opening value was smaller than one micrometer 25
for three consecutive days, it was assumed that the crack opening was stabilized, and then the test was finalized. In 26

7
the present research, for each creep frame, beams where positioned and loaded according to the following 1
methodology: the beam with the highest value of Fcr (the load corresponding to wcr) was placed on the bottom, with 2
a moderate Fcr was localized in the middle, and with the lowest Fcr was placed on the top. Then, they were loaded 3
simultaneously with the smallest Fcr value of these three tested specimens. In other words, it was opted to apply a 4
load level that produces a bending moment in the notched cross section of the beam placed on top of the frame equal 5
to 100% of that observed at wcr=0.3 or 0.5 mm in the pre-cracking test. By following this methodology, the 6
influence of different loading levels (Fa / Fcr) on the long-term behaviour of the adopted SFRSCC could be 7
investigated as well. 8
Afterward the conclusion of the creep tests, the specimens were unloaded, but the data acquisition system was kept 9
active for at least a period of one week, enabling to record the closing of the crack width due to the creep recovery 10
process. Fig. 4(a) and (b) show schematically the variation of crack opening versus time and force-crack opening 11
relationship, respectively. In these figures, winst is the instantaneous crack opening, wlt is the long-term crack 12
opening, rec
instw is the instantaneous crack opening recovery at the beginning of unloading process, rec
ltw represents 13
the long-term crack opening recovery,rec
totalw is total crack opening recovery,res
ltw indicates the residual crack opening 14
after unloading stage, and Fa depicts applied load level in creep test. 15
16
2.3.2.3. Post-Creep test 17
After the end of the creep tests and one week waiting period in order to enable creep deformation recovery, the 18
specimens were then subjected to monotonic four-point bending tests until a 4 mm crack mouth opening width has 19
been reached. The monotonic test set-up was similar to the one used for pre-cracking the beams, which was 20
previously presented. A same displacement rate of 0.002 mm/s was also implemented. 21
22
2.3.2.4. Assembled long-term force-crack width curve 23
Finally, the complete F-w curves were assembled with the individual F-w curves from the pre-cracking, creep and 24
post-creep responses, as shown in Fig. 5. The push curve from this assembled response will be compared with the 25
correspondent curve from the monotonic test on uncracked beams. In Fig. 5, hereinafter, FL is the load at crack 26

8
initiation, Fcr and wcr are the load and correspondent crack opening, respectively, for the defined pre-crack levels, i.e. 1
0.3 and 0.5 mm, res
crw is the residual crack opening after unloading of the specimen, Ksec is secondary stiffness at re-2
loading process of post-creep test, max
pF and max
pw are the maximum load at post-cracking branch and its 3
correspondent crack opening width, respectively. 4
5
2.4. Assessment of fibre orientation and distribution 6
The distribution and orientation of fibres in the SFRSCC panel was assessed by an image analysis procedure. The 7
adoption of this strategy was mainly due to its simplicity and relatively low cost [3, 30, 31]. The image analysis was 8
carried out on a plane parallel to the notch plane with an offset equal to half the length of the used fibre (Fig. 6). The 9
grinded plane was obtained by cutting the specimens after the monotonic four-point (4-P) bending tests have been 10
carried out. For each series (β=[0-15°[, [15-45°[, [45-75°[ and [75-90°]) five specimens from distinct panel locations 11
were selected. After computation and analysis of the image technique results, the following parameters that 12
characterize the fibre structure were derived out: 13
1. The number of fibres per unit area,fN ; 14
2. Fibre orientation factor, ; 15
3. Fibre segregation parameter, seg ; 16
More details regarding the image analysis method and also on the process of the evaluation of the abovementioned 17
parameters can be found in appendix A. Furthermore, the number of the effective fibres per unit area,f
effN , was also 18
determined. This parameter could not be assessed through the previous technique, therefore it was appraised by 19
manually counting the fibres that intersected the notched plane of the tested beams and also had the hooked end 20
deformed (in order to be considered a fibre that provided effective reinforcement). 21
9
3. RESULTS AND DISCUSION 1
3.1. Fibre orientation and distribution 2
Table 2 includes the fibre distribution parameters obtained by an image analysis technique.f
N andf
effN were higher 3
in the specimens with the notched plane parallel to the expected concrete flow direction, confirming the results 4
already obtained in this respect [1]. In general, these values decreased as the notched plane rotated towards to the 5
perpendicular position regarding the flow direction (Fig. 7). For the case of the notched plane orientation, β, 6
comprised within [0-15°[, f
effN was approximately 76, 156 and 686% higher than when β was between [15-45°[, 7
[45-75°[ and [75-90°] intervals, respectively. Regarding to the low value of f
effN compared to
fN it should be 8
mentioned that due to the high compressive strength of the concrete which exist a strong bond between fibre and 9
matrix, many of fibres were ruptured during the execution of monotonic test. Since in the determination of f
effN 10
only fibres with mobilized hook were counted and the ruptured fibres were not taken in to the account, this 11
parameter revealed a lower value. 12
Moreover, considering the fibre orientation factor, ηθ, a similar trend to the one obtained for the number of fibres 13
was found. A quite higher ηθ value was achieved for the series with a β=[0-15°[, having been 8, 20 and 30% higher 14
than the one obtained for the series [15-45°[, [45-75°[ and [75-90°], respectively. This could be ascribed to a 15
preferential fibre alignment, which was influenced by the flowability of concrete, and induces the fibres to be 16
reoriented and remain preferentially perpendicular to the concrete flow direction. The fibre segregation parameter,17
seg , can assume values between 0 (segregation at the top of the cross-section) and 1 (segregation at the bottom of 18
the cross-section). In a SFRC with homogeneous fibre distribution, seg is 0.5. From the results in Table 2 it is 19
verified the occurrence of a slight segregation of the fibres of similar level for all the series considered, caused by 20
the highest specific weight of the steel fibres amongst the constituents of the SFRSCC. However, this segregation 21
was lower than the one reported when SFRC is cast with mechanical vibration, since this operation is not executed 22
in SFRSCC. 23
10
According to the obtained results, in the case of casting panels, and in particular from its centre, since the wall 1
effects were limited mainly to the bottom surface, the flow velocity was uniform and diffused radially outwards 2
from the centre casting point, see Fig. 7(a). As a consequence, in the specimens with the notched plane direction 3
parallel to the flow direction, a higher number of effective fibres was observed, than when the specimens had the 4
notched plane perpendicular to the expected flow direction. Fig. 7(b) shows the influence of the concrete flow 5
velocity profile on the preferential orientation of the fibres along the thickness of the panel. According to the 6
expected concrete flow velocity profile, due to friction between concrete and the bottom surface of the panel (wall 7
effect), the flow velocity starts to decrease nonlinearly from the top to bottom panel’s face. Therefore, fibres tend to 8
be more aligned in horizontal planes parallel to the bottom surface of the panel. 9
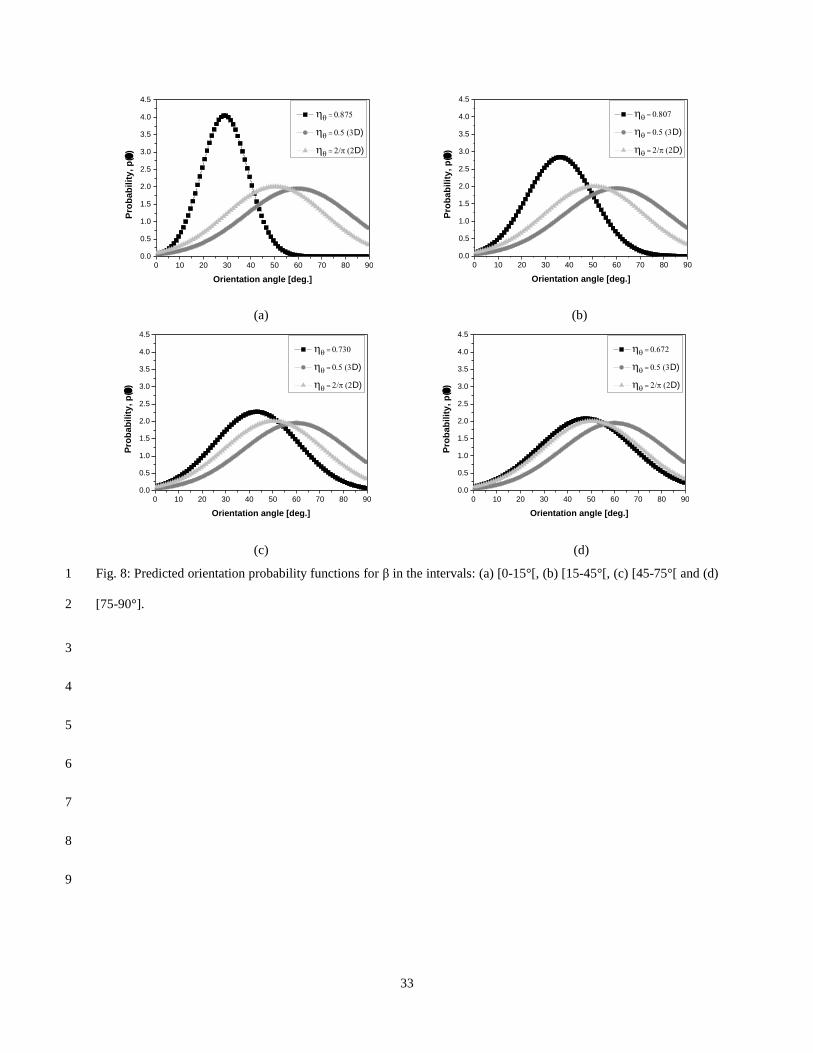
Fig. 8 illustrates the orientation probability density functions obtained for the average fibre orientation factor of each 10
series separately, (β=[0-15°[,[15-45°[, [45-75°[ and [75-90°]), as well as the orientation probability functions for 11
both the two and three-dimensional isotropic uniform random distributions. In this figure, the distribution of the 12
orientation angle through the cut plane was investigated for each specimen and the experimental results were 13
compared to Gaussian distribution. According to this study, the distribution of the orientation angle follows closely a 14
Gaussian distribution [32]. Fig. 8(a) presents the distribution of the probability of fibre orientation for the specimens 15
comprised in the interval β=[0-15°[, which was shifted to the left side, meaning that fibres have a tendency to be 16
aligned more perpendicular to the notched plane. When angle β increases, which is translated in a reduction of the 17
orientation factor, the distribution was shifted from the left to the right side progressively, see Figs. 8(b) to 8(d). 18
Comparing the theoretical orientation factor for a two-dimensional fibre distribution, 2/π [33], and a three-19
dimensional, 0.5 [34], isotropic uniform random fibre distribution with the orientation factors for the distinct β 20
series, it was observed that the [0-15°[ series showed a completely different distribution. As the value of β increased, 21
the fibre distribution within the panels tended to a two-dimensional distribution. Fig. 8(d) shows that the orientation 22
distribution of the [75-90°] series almost coincided with two-dimensional fibre distribution. Consequently, when a 23
SFRSCC panel was cast from the centre, assuming a two-dimensional distribution could be far apart from the 24
reality. Therefore, in SFRSCC panels, mainly, due to the high flowability of the self-compacting concrete, it was 25
expected an anisometric fibre structure. Hence, since the material tensile behaviour of fibre reinforced concretes was 26
intimately connected to the fibre distribution, an anisotropic material behaviour should be considered. In conclusion, 27
11
in the present case, the fibre distribution was prominently influenced by the placing conditions and concrete 1
flowability. 2
3.2. Monotonic four-point bending test 3
Fig. 9(a) to (d) depicts the envelope and average force-crack mouth opening displacement relationships, F-CTOD, 4
obtained from the monotonic four-point bending tests when β=[0-15°[, [15-45°[, [45-75°[ and [75-90°], respectively. 5
The CTOD was determined by averaging the displacements recorded in the three LVDTs fixed at the bottom face of 6
the specimen (Fig. 2). The recorded value of crack opening width (CMODy) was corrected to the real crack tip 7
opening width (CTOD) as follows: 8
y
hCTOD CMOD
h y
(1) 9
where, CMODy is the recorded value in the LVDTs at a distance y below the notch mouth of the specimen, and h is 10
the total depth of the specimen. 11
In general, the specimens have shown a linear behaviour up to the load correspondent to the crack initiation. Up to 12
this load, the value measured by the LVDTs corresponds to the elastic deformation of the SFRSCC bulk in-between 13
the LVDT’s supports (Fig. 2c). Therefore, the results exhibited a low scatter, since in this stage, the contribution of 14
the fibres was almost null as the material response was mainly dependent on the elastic behaviour of the concrete 15
constituents. After the cracking onset, the fibres started to be mobilized bridging the stresses across the crack 16
surfaces. In general, for the post-cracking stage the scatter was relatively high, because after the mobilization of 17
fibres the composite performance was extremely dependent of the fibre dispersion and orientation. Since the beams 18
were extracted from different locations of the panel at distinct distances from the casting point, a high scatter of the 19
tests results was expected. This aspect can be ascribed to the reduction of the concrete flow velocity with the 20
increase of the distance to the casting point. 21
Regarding the first two series, namely, β=[0-15°[ and [15-45°[, they have shown a similar force value at the limit of 22
proportionality. Once the tensile strength of material was attained, both series revealed a deflection-hardening 23
response up to a CTOD of around 0.6 mm, but for [15-45°[ specimens a slightly lower peak load value was attained. 24
From the micromechanical point of view, after the adhesion of fibre and surrounding matrix has been exceeded, the 25
12
fibre reinforcement effectiveness was mainly governed by the plastification process of the hooked end, which 1
provides the highest contribution for this deflection-hardening capacity. Afterward, a softening stage was observed 2
for both series. In the β=[0-15°] case, since the specimens contained more fibres that intersected the cracked plane 3
with a lower angle, i.e. 29º, the residual force decay was smoother, whereas for the β=[15-45°[ series, a higher load 4
decay was observed between 0.74 and 1.5 mm of CTOD. In the latter specimens, fibres have intersected the cracked 5
plane with a higher average orientation angle, i.e. 36°, see Fig. 8(b). Fibre pull-out tests carried out have shown that 6
fibres with an orientation angle of 30° ruptured for a slip value nearby 0.5 mm [35]. Therefore, in this series, once 7
the peak load was attained, the fibres are more prone to be ruptured within the CTOD range of 0.74-1.5 mm. 8
Actually, during the execution of the test, the strident sound of the fibres rupturing was clearly differentiated. 9
Regarding the cases of β=[45-75°[ and [75-90°] series, after the crack initiation, the load decreased suddenly, 10
followed by a small plateau, and beyond a CTOD of about 0.75 mm the load decreased smoothly. This could be 11
ascribed to a higher probability of fibre rupture [35], since in these two series, fibres have a tendency to be oriented 12
with a higher orientation angle towards the notched plane, see Fig. 8(c) and (d), with average orientation angles of 13
43° and 48°, respectively. 14
By comparing all F-CTOD relationships, Fig. 9(e), could be concluded that the post-peak behaviour of the SFRSCC 15
was highly dependent of the direction in which the mechanical properties were assessed. The series with the notched 16
plane more parallel towards to the concrete flow direction, i.e. [0-15°[ and [15- 45°[ series, showed a higher residual 17
force, and therefore a larger energy absorption capacity than the specimens with a fracture surface more 18
perpendicular to the flow direction. Further details and discussion of this aspect could be found elsewhere [1, 36]. 19
3.3. Long-term four-point bending test 20
3.3.1. Creep parameters 21
Fig. 10 shows the relationship between the crack opening rate, COR, [μm/day] and the applied load level (Fa / Fcr) 22
for the two pre-crack widths investigated (i.e. 0.3 and 0.5 mm). The crack opening rate was determined from Eq. (2) 23
at 7, 15, 30 and 60 days. 24

13
2 1
2 1
2 1
t t
lt ltt t
w wCOR
t t
(2) 1
where 2 1t tCOR is the crack opening rate between time t2 and t1, and
ti
ltw is the long-term crack opening at time ti 2
(Fig. 4). For both wcr=0.3 and 0.5 mm series, at 7 and 15 days, the COR increased with the load level. This increase 3
of COR was more significant in the wcr=0.5 mm series and for Fa / Fcr ratios higher than 80%. Considering the COR 4
evolution with Fa / Fcr in the first two weeks of loading, it was observed for wcr=0.3 mm a linear trend, while for 5
wcr=0.5 mm it was detected a nonlinear increase of the COR with Fa / Fcr. In the case of Fa / Fcr = 100%, COR was 6
in average 50% higher for the larger pre-cracking width, i.e. wcr=0.5 mm. The COR at 30 and 60 days’ time was not 7
significantly influenced by the Fa / Fcr ratio since, in generally, after a period of one month the crack opening width 8
tended to become stabilized. 9
To consider the long-term crack opening and also to take into account the loading levels of the specimens, the creep 10
coefficient parameter in the creep stage (φC) is introduced, as being calculated by the following equation [37] 11
C lt
inst
w
w
(3) 12
where winst is the instantaneous crack opening at the time of loading, and wlt represents the long-term crack opening 13
(Fig. 4a). 14
Fig. 11 illustrates the variation of the creep coefficient for different ratios of Fa / Fcr. As it was expected, this 15
coefficient has increased with the load level ratio. Considering the influence of pre-crack width, the creep coefficient 16
in wcr = 0.5 mm series has increased with the Fa / Fcr at a higher rate than in the case of the series of wcr=0.3 mm. By 17
considering the micromechanical behaviour of a single fibre, the wcr=0.5 series was submitted to higher damage 18
level of fibre/matrix interface, which led to a higher increase of the crack opening width under a creep load. This 19
influence was more meaningful for a load level of 100%. From the monotonic tests’ results, see Fig. 9, it can be 20
observed that the pre-cracking level of 0.5 mm was close to the CTOD correspondent to the maximum load at post-21
cracking branch,max
pw . Therefore, subjecting beams to a sustained load in a level near to the maximum bearing 22
capacity load of the specimen at post-cracking branch,max
pF , can lead to a significant increase in the values of the 23
creep coefficient. This was observed in the wcr= 0.5 mm series at the higher load level. 24

14
In some specimens, during the reloading procedure of beams in the creep frame, a sudden increase in winst was 1
observed. This could be due to the rupturing of some fibres that were bridging the crack’s surfaces. Since the matrix 2
had a high compressive strength, a strong bond between fibre and matrix interface was achieved. This influence was 3
more predominant for the series with wcr= 0.5 mm and Fa / Fcr = 100% due to the previously explained reasons, 4
since the probability of fibre’s rupturing is higher. For this series, larger creep coefficients and scatter were 5
expected, see Fig. 11. Regarding the wcr=0.3 mm series, this was not observed, since the 0.3 mm crack width is still 6
far frommax
pw . 7
For the simplicity sake, it was decided to categorize the Fa / Fcr ratios into two distinct intervals [50-75%[ and [75%-8
100%] with an average values of 62.5 and 87.5%, designated as low and high grade Fa / Fcr ratios, respectively. Fig. 9
12 depicts the relationship between creep coefficient and time for the studied wcr and Fa / Fcr ratios, up to a period of 10
two months. The creep curves were obtained by averaging the responses in each correspondent category. All series 11
showed a two-stage creep response, namely, the so-called primary and secondary stages. The creep coefficient 12
became stabilized within the studied time period, considering the criterion for stabilized creep, already indicated. 13
During the execution of the test, none of the beams entered into the tertiary creep stage, in which a specimen fails 14
due to creep. In general, the creep coefficient was approximately 48% and 64% higher for the high load level, 15
respectively, regarding wcr=0.3 and 0.5 mm series. On the other hand, the influence of the pre-crack width on the 16
creep coefficient was smaller. Series with a wcr= 0.5 mm, loaded with a high Fa / Fcr ratio had 30% higher creep 17
coefficient than the one of the wcr=0.3 mm series for the same level of loading. As explained earlier, this would be 18
feasible since wcr=0.5 mm was close tomax
pw , in particular for the specimens with a load level of Fa / Fcr=100%. It is 19
noteworthy that even in this case, a stable creep response was achieved. 20
It is should be mentioned that the measured long-term crack opening consists of two main phenomena: the basic 21
creep in the uncracked section under compression and time-dependent alterations between fibre and matrix 22
interface zone. However, for the specimens with proposed dimensions, the influence of the basic creep is 23
very negligible due to the following reasons: firstly, for the both studied pre-crack levels, where CTOD 24
reached to 0.3 or 0.5 mm, a major part of the section above the notch was cracked. On the other hand, the location of 25
the neutral axis was moved very close to the top of the specimen and thus, a small part of the section subjected to the 26
compressive stress. Secondly, the selected loads in the creep tests produced a very low compressive stress in the 27

15
section and if it compared with the concrete compressive strength which is relatively high, a very low basic creep 1
deformation is expected. Consequently, hereinafter, the long-term widening of the crack referred to the time-2
dependent sliding action between fibre and surrounding matrix. 3
4
3.3.2. Influence of distance from the casting point on the creep parameter 5
Fig. 13 shows the influence of the specimens’ distance to the casting point on the creep coefficient versus time 6
relationship for specimens with Fa / Fcr = 100%. It was opted to only present these relationships for the maximum 7
Fa / Fcr , since they were considered as the most critical ones. Specimens positioned near the centre of the panel (i.e. 8
casting point) presented a lower creep coefficient, while those located in the corner of the panel had the highest 9
creep coefficients. This aspect could be ascribed to the decrease of the concrete flow velocity with the increase of 10
the distance from the casting point. This decrease of the flow velocity influences both the fibre dispersion and 11
orientation along the flow profile, and, consequently, leads to quite different fibre structures within the specimens at 12
distinct distances from the casting point. From another point of view, this observation could be also attributed to a 13
decrease of the matrix strength with the increase of the distance from the casting point due to some segregation of 14
the aggregate skeleton, resulting a weaker fibre/matrix interfacial bond strength that decreases the fibre 15
reinforcement effectiveness. 16
17
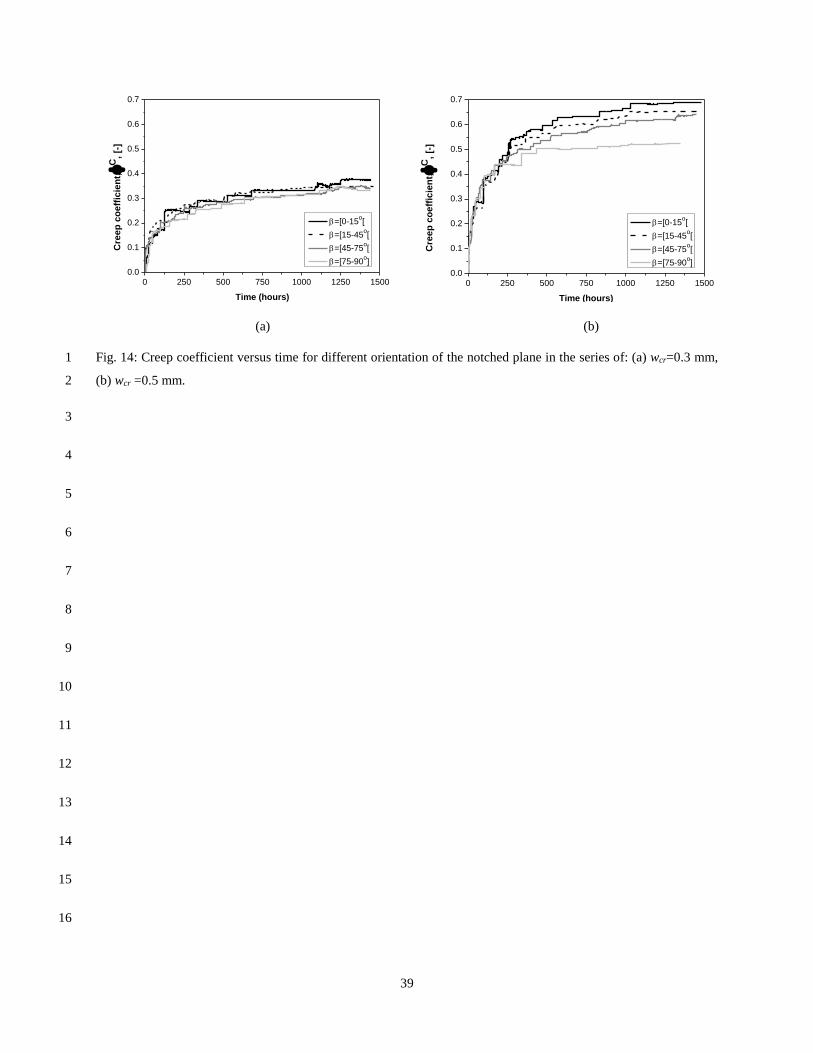
3.3.3. Influence of notch plane orientation on the creep parameter 18
Fig. 14 presents the influence of the notched plane orientation (regarded to the flow direction of SFRSCC) on the 19
relationship of creep coefficient versus time. These relationships were determined by averaging the response of the 20
specimens with Fa / Fcr = 100%. For the wcr = 0.3 mm series, the variation of creep with time was slightly affected 21
by the direction of the notched plane regarding the expected concrete flow, while in the wcr=0.5 mm series this 22
influence was more significant. In the case of the β=[0-15°[ series, the creep coefficient at the end of two months 23
was 13 and 31% higher than in β=[75-90°] for the wcr=0.3 and 0.5 mm series, respectively. It is worth noting that 24
the β=[0-15°[ specimens contain effective fibres perpendicular to the crack plane, which were pulled-out under a 25
sustain load progressively, while the β=[75-90°] specimens have fibres with a higher orientation angle towards the 26
notch plane. In this case, the fibre reinforcement mechanism of the specimen was mainly governed by matrix 27

16
spalling at the fibres’ exit points instead of fibres pulled-out. Therefore, the development of creep coefficient along 1
time was influenced by the orientation of the crack plane within the SFRSCC panel, and this influence seems as 2
larger as higher is the crack width. 3
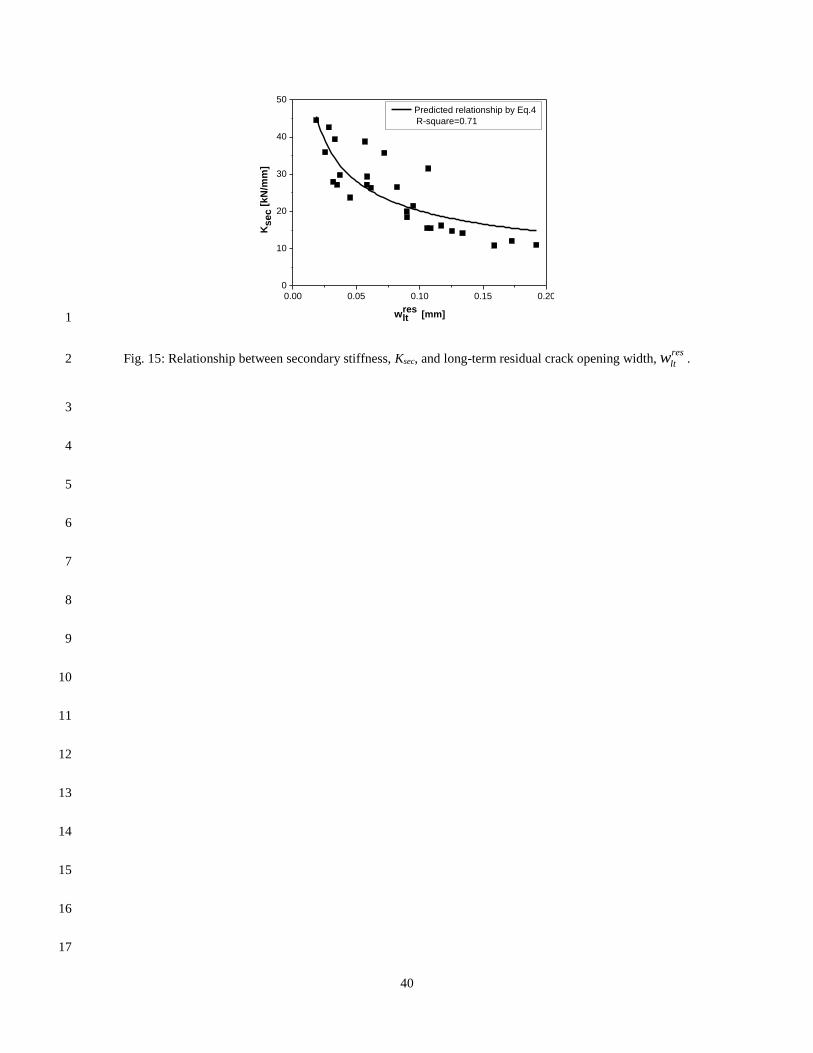
3.4. Comparison between monotonic and long-term results 4
Fig. 15 illustrates the relationship between long-term residual crack opening width, res
ltw (Fig. 4), and secondary 5
stiffness in the re-loading of post-creep test, Ksec, (Fig. 5). It is observed that the stiffness of the re-loading branch of 6
the post-creep curve decreases with the increase of the long-term residual crack width. Furthermore, the following 7
equation was also proposed to estimate the influence of res
ltw on the Ksec: 8
sec 0 2
1
( )res c
lt
ck k
w
(4) 9
where K0 is the initial stiffness determined by averaging the values obtained from force-CTOD relationships in Fig. 10
9 (K0=565.53 kN/mm with a CoV of 12%), and constants c1 and c2 were achieved by nonlinear curve fitting 11
analysis procedures, having been obtained the following values: c1=0.012 and c2=0.480. Fig. 15 shows that Eq. (4) 12
fits with reasonable accuracy the obtained experimental results (R-square equal to 0.71). 13
Figs. 16 and 17 summarize the comparison between the long-term assembled curves (Fig. 5) obtained in four-point 14
bending tests and the correspondent ones determined in the monotonic tests, for wcr = 0.3 and 0.5 mm, respectively. 15
These curves were obtained by averaging all responses. Regarding the monotonic tests, the experimental envelope 16
was also included. The long-term assembled curves consist of overlaying the force-CTOD curves from the tests 17
corresponding to: specimen’s pre-cracking, creep, and post-creep. Moreover, each wcr series was divided into eight 18
subcategories, according to the β orientation factor and the Fa / Fcr ratio. The results of the series wcr=0.3 mm with a 19
low Fa / Fcr and β=[75-90°] were not presented (Fig. 16(g)), due to technical problems during the execution of the 20
tests of this series. From the analysis of these results, in general, it was concluded that the crack growth during the 21
creep tests has a minor influence on the post-creep flexural behaviour. In fact, it is evident that the assembled curves 22
resemble quite well the average response from the monotonic tests. Nevertheless, in some cases, due to the 23
scattering in the results, as consequence of distinct fibre distributions, the assembled responses did not follow so 24

17
closely the average monotonic curves, but nonetheless, they were yet comprised within the experimental envelope of 1
the monotonic flexural tests. 2
4. ANALYTICAL APPROACH TO PREDICT CREEP BEHAVIOUR OF CRACKED SFRSCC 3
In this section, the experimental results presented in section 3.3 were used to propose an equation to predict the 4
long-term response of the cracked SFRSCC. The influence of wcr and Fa / Fcr parameters were taken into account in 5
the present approach. A combined power and hyperbolic equation was used, since similar equations were already 6
proposed by ACI 209-92 [38] and CEB (1999) [39] to predict creep behaviour of plain concrete. Therefore, the 7
following equation is proposed for predicting the long-term behaviour of cracked SFRSCC: 8
Ac
A
t
b t
(5) 9
wherec is creep coefficient, and t represents the time duration of loading (in hours). According to the 10
experimental data, for each wcr, the coefficient A is determined by: 11
1 1/ (2 )crA w F d
(6) 12
Where wcr is the pre-crack width (in mm) and F represents level of loading (Fa / Fcr). In Eqs. (5) and (6) the 13
constants b and d were determined by nonlinear curve fitting analysis procedures, and the following values were 14
obtained: b=15 (R-square value of 0.94) and d=0.17 (R-square value of 0.88). It should be mentioned that Eq. (5) is 15
only valid for / 0.5a crF F . Furthermore, the functions used may capture the shape of the phenomenon, but not 16
from their physical aspects. Fig. 18 compares the creep coefficient versus time obtained analytically and 17
experimentally for each series of different wcr and loading level, where it was be concluded that the proposed 18
equation predicts with high accuracy the registered experimental data. 19
After determination of creep coefficient from Eq. (5), in order to determine the long-term crack opening analytically, 20
wlt, Eq. (3) could be arranged as follows: c
lt instw w . Figs. 19(a) and (b) depict the results of a parametric 21
study to investigate the influence of pre-crack width (wcr = 0.3 and 0.5 mm) and also the load level (Fa / Fcr = 0.5, 22
0.6, 0.7, 0.8, 0.9 and 1.0) on the long-term crack opening, wlt, versus time response up to a period of one year. In this 23

18
study, since analytical determination of winst needs more experimental results, this parameter was determined using 1
experimental values for each studied wcr and Fa / Fcr. However, it should be mentioned that to properly validate the 2
proposed equation for more generalized pre-crack widths, load levels, and higher time periods, more experimental 3
data is required. In general, the long-term crack opening increased with the increase of the Fa / Fcr ratio, and this 4
increase was more significant for higher values of wcr. Considering now the influence of wcr on the long-term crack 5
opening, for the same load level it was observed that the increase of wcr lead to a significant increase of the long-6
term crack opening, mainly for the higher load levels. 7
5. CONCLUSIONS 8
The present work reported the results of an experimental program to investigate the long-term behaviour of pre-9
cracked SFRSCC laminar structures (of relatively small thickness). One hundred and twelve prismatic specimens 10
were extracted from a SFRSCC panel. These specimens were notched with different orientations regarding to the 11
expected SFRSCC flow direction, and were submitted to four-point flexural tests under a sustained load. The 12
influence of the following parameters on the creep behaviour was studied: initial crack opening level (0.3 mm and 13
0.5 mm), applied stress level, fibre orientation/dispersion, and distance from the casting point. Moreover, to evaluate 14
the effect of long-term crack opening on the flexural post-cracking strength, a series of instantaneous monotonic 15
tests were carried out and the corresponding force vs crack mouth opening displacement (F-CTOD) curves were 16
compared to the ones obtained by assembling the F-CTOD curves determined in pre-crack monotonic tests, creep 17
tests and post-creep monotonic tests. 18
From the monotonic tests, it was concluded that the post-cracking flexural tensile behaviour of the adopted SFRSCC 19
was considerably influenced by both the fibre dispersion and orientation. It is worthy to note that specimens with 20
notched plane parallel to concrete flow direction have shown the highest post-cracking strength. This was a direct 21
consequence of a preferential fibre orientation perpendicular to those fracture planes, due to the concrete flow 22
profile. Therefore, when a SFRSCC panel is cast from its centre, fibres tend to be aligned perpendicular to flow 23
direction. 24
Concerning the long-term creep tests, two pre-cracking levels (wcr) were considered. Stable responses were observed 25
for all specimens. However, as it was expected, by increasing the level of the applied load, higher values of the 26

19
creep coefficient were achieved. Regarding the influence of the pre-cracking levels, wcr=0.5 mm series conducted to 1
higher values of the creep coefficient than in the other studied series (wcr=0.3 mm), especially, if they were loaded 2
with a high Fa / Fcr. On the other hand, since wcr=0.5 mm was very close to the CTOD correspondent to the 3
maximum load at post-cracking branch of the monotonic responses, the bond interface between fibre and matrix was 4
more damaged, therefore the creep crack width increased with a higher rate. However, even in this case, still a stable 5
response was obtained, although requiring a higher time period for this stabilization. 6
Specimens located nearer to the panel’s corner showed a higher increase of creep coefficient with time. This aspect 7
could be ascribed to the decrease of the concrete flow velocity with the increase of the distance from the casting 8
point which leads to different fibre distribution as well as matrix constituents through the panel. 9
The creep tests also revealed that the SFRSCC was influenced by the orientation of the notch plane regarding the 10
expected concrete flow (defined by the β angle). In fact, β=[0-15°[ specimens presented the highest creep 11
coefficients, whereas β=[75-90°] series showed the lowest ones. This fact was a direct consequence of the fibre 12
orientation within the panel. 13
In general, the post-cracking strength after the long-term loading was not influenced significantly when compared to 14
the one obtained from instantaneous monotonic tests, even when the specimens were pre-cracked up to close the 15
CTOD corresponding to the maximum load at post-cracking branch, and when loaded with the higher Fa / Fcr ratios. 16
Based on the results obtained from the creep tests, an equation was proposed to predict the creep coefficient for the 17
developed SFRSCC when cracked up to 0.5 mm and loaded in the interval 0.5<Fa/Fcr≤1.0. 18
ACKNOWLEDGEMENTS 19
This work is supported by the FEDER funds through the Operational Program for Competitiveness Factors - 20
COMPETE and National Funds through FCT - Portuguese Foundation for Science and Technology under the project 21
SlabSys-HFRC-PTDC/ECM/120394/2010. The authors would like to acknowledge the materials supplied by 22
Radmix and Maccaferri (fibres), SECIL (cement), SIKA and BASF (superplasticizers), Omya Comital (limestone 23
filler), and Pegop (Fly ash). 24

20
APPENDIX A: IMAGE ANALYSIS PROCEDURE 1
The adopted procedure for fibre detection comprised four main steps. Firstly, the fracture surface of the specimen 2
was grinded. Secondly, an RGB image of this surface was taken using a high resolution digital photograph camera. 3
Afterwards, the obtained image was processed using ImageJ [40] software to recognize steel fibres. These steps are 4
depicted in Fig. 20. After analyzing the images, the acquired data was processed and the parameters herein presented 5
were determined. 6
1) The number of fibres per unit area,fN , is the ratio between the total number of fibres counted in an image,
f
TN7
, (counting all the visible ellipses and circles at the cross section) and the total area of the image, A: 8
f f
TN N A (A.1) 9
2) The orientation factor, ηθ, can be regarded as an average orientation towards a certain plane: 10
1
1. cos
fTN
ifiTN
(A.2) 11
where θ is the out-plane angle that is defined as the angle between the fibre’s longitudinal axis and a vector 12
orthogonal to the plane. 13
3) The fibre segregation parameter along the gravity direction, determined from: 14
1
1.
.
fTN
seg fiT
yh N
(A.3) 15
where y is the coordinate in the Y axis of the centre of gravity of the fibre, and h is the height (or depth) of the 16
analysed cross-section. On the other hand, an average value of the coordinates in the Y axis of entire fibres should 17
be determined in the analysed cross-section. 18
21
REFERENCES 1
[1] A. Abrishambaf, J.A.O. Barros, V.M.C.F. Cunha, Relation between fibre distribution and post-cracking 2
behaviour in steel fibre reinforced self-compacting concrete panels, Cem. Concr. Res. 51 (2013) 57-66. 3
[2] L. Ferrara, A. Meda, Relationships between fibre distribution, workability and the mechanical properties of 4
SFRC applied to precast roof elements, Mater. Struct. 39 (2006) 411-420. 5
[3] S.T. Kang, J.K. Kim, The relation between fibre orientation and tensile behavior in an ultra high performance 6
fiber reinforced cementitious composite (UHPFRCC), Cem. Concr. Res. 41 (2011) 1001-1014. 7
[4] J.A.O. Barros, J.A. Figueiras, Flexural behaviour of SFRC: Testing and modelling, ASCE J. Mater. Civ. Eng. 11 8
(1999) 331-339. 9
[5] F. Bencardino, L. Rizzuti, G. Spadea, R.N. Swamy, Experimental evaluation of fibre reinforced concrete fracture 10
properties, Compos. Part B. 41 (2010) 17-24. 11
[6] S. Carmona, A. Aguado, New model for the indirect determination of the tensile stress-strain curve of concrete 12
by means of the Brazilian test, Mater. struct. 45 (2012) 1473-1485. 13
[7] E. Denneman, E.P. Kearsley, A.T. Visser, Splitting tensile test for fibre reinforced concrete, Mater. Struct. 44 14
(2011) 1441-1449. 15
[8] M. Prisco, L. Ferrara, M.G.L. Lamperti, Double edge wedge splitting (DEWS): an indirect tension test to 16
identify post-cracking behaviour of fibre reinforced cementitious composites, Mater. Struct. 46 (2013) 1893-1918. 17
[9] W.B. Boshoff, V. Mechtcherine, G.P.A.G. van Zijl, Characterizing the time-dependant behaviour on the single 18
fibre level of SHCC: Part 1: Mechanism of fibre pull-out creep, Cem. Concr. Res. 39 (2009) 779-786. 19
[10] S.E. Arango, P. Serna, J.R. Marti-Vargs, A test method to characterize flexural creep behaviour of pre-cracked 20
FRC specimens, Exp. Mech. J. 52 (2012) 1067-1078. 21
[11] T. Kanstad, G. Zirgulis, Long-term creep testing of pre-cracked fibre reinforced concrete beams, 8th RILEM 22
International Symposium on Fibre Reinforced Concrete: Challenges and Opportunities, Guimarães, Portugal, 2012. 23
[12] L. MacKay, J.F. Trottier, Post-crack creep behavior of steel and synthetic FRC under flexural loading, 24
Shotcrete: More Engineering Developments, Taylor and Francis Group, London, 2004. 25
[13] K.H. Tan, M.K. Saha, Ten year study on steel fibre-reinforced concrete beams under sustained loads, ACI 26
Struct. J. 102 (2005) 472-480. 27

22
[14] R.I. Zerbino, B.E. Barragan, Long-term behaviour of cracked steel fibre-reinforced concrete beams under 1
sustained loading, ACI Mater. J. 109 (2012) 215-224. 2
[15] W.A. Al-Khaja, Mechanical properties and time-dependent deformation of polypropylene fibre reinforced 3
concrete, J King Saud Univ. Eng. Sci. 7 (1995) 67-76. 4
[16] S. Kurt, P. Balaguru, Post crack creep of polymeric fibre-reinforced concrete in flexure, Cem. Concr. Res. 30 5
(2000) 183-190. 6
[17] B.H. Oh, D.G. Park, J.C. Kim, Y.C. Choi, Experimental and theoretical investigation on the postcracking 7
inelastic behaviour of synthetic fibre reinforced concrete beams, Cem. Concr. Res. 35 (2005) 384-392. 8
[18] A.J. Babafemi, W.P. Boshoff, Tensile creep of macro-synthetic fibre reinforced concrete (MSFRC) under uni-9
axial tensile loading, Cem. Concr. Compos. 55 (2014) 62-69. 10
[19] C.J. Mouton, W.P. Boshoff, Initial study on the tensile creep of cracked steel fibre reinforced concrete, 8th 11
RILEM International Symposium on Fibre Reinforced Concrete: Challenges and Opportunities, Guimarães, 12
Portugal, 2012. 13
[20] G. Zhao, M. di Prisco, L. Vandewalle, Experimental research on uni-axial tensile creep behaviour of pre-14
cracked steel fibre reinforced concrete, 8th RILEM International Symposium on Fibre Reinforced Concrete: 15
Challenges and Opportunities, Guimaraes, Portugal, 2012. 16
[21] K.H. Tan, P. Paramasivan, K.C. Tan, Creep and shrinkage deflections of RC beams with steel fibres, Mater. 17
Civ. Eng. 6 (1994) 474-494. 18
[22] B. Boulekbache, M. Hamrat, M. Chemrouk, S. Amziane, Flowability of fibre-reinforced concrete and its effect 19
on the mechanical properties of the material, Constr. Build. Mater. 24 (2010) 1664-1671. 20
[23] L. Martinie, N. Roussel, Simple tools for fiber orientation prediction in industrial practice, Cem. Concr. Res. 41 21
(2011) 993-1000. 22
[24] CEB-FIP, Volume 1, Model Code 2010, Tomas Telford, Lausanne, Switzerland, 2012. 23
[25] UNI11039, Steel fibre reinforced concrete, Part I: Definition, classification, specification and conformity, Part 24
II: Test method for measuring first crack strength and ductility indexes, Italian Board for Standardization, 2003. 25
[26] EFNARC, The European guidelines for self-compacting concrete, 2005. 26
[27] R.M. Lameiras, J.A.O. Barros, I. Valente, M.A.D. Azenha, Development of load-bearing insulated panels 27
combining steel fibre reinforced self-compacting concrete layers and glass fibre reinforced polymer 28

23
connectors – part I: conception and pull-out tests, Compos. Struct. J. 105 (2013) 446-459, DOI information: 1
10.1016/j.compstruct.2013.06.015. http://hdl.handle.net/1822/26229 2
[28] R.M. Lameiras, J.A.O. Barros, M.A.D. Azenha, I. Valente, Development of load-bearing insulated panels 3
combining steel fibre reinforced self-compacting concrete layers and glass fibre reinforced polymer connectors – 4
part II: numerically evaluation of mechanical behaviour, Compos. Struct. J. 105 (2013) 460-470, DOI information: 5
10.1016/j.compstruct.2013.06.015. http://hdl.handle.net/1822/26225 6
[29] S.J. Barnett, J.F. Lataste, T. Parry, S.G. Millard, M.N. Soutsos, Assessment of fibre orientation in ultra-high 7
performance fibre reinforced concrete and its effect on flexural strength, Mater. Struct. 43 (2010) 1009-1023. 8
[30] V.M.C.F. Cunha, Steel fibre reinforced self-compacting concrete-from micromechanics to composite 9
behaviour, Civil Engineering Department, University of Minho, Portugal, 2010. 10
[31] L. Ferrara, N. Ozyurt, M. di Prisco, High mechanical performance of fiber reinforced cementitious composites - 11
the role of casting-flow induced fiber orientation, Mater. Struct. 44 (2011) 109-128. 12
[32] A. Abrishambaf, J.A.O. Barros, V.M.C.F. Cunha, A state of art study on the fibre orientation and distribution in 13
steel fibre reinforced concrete, University of Minho, Portugal, 13-DEC/E-16, 2013. 14
[33] C.V.S. KamerwaraRao, Effectiveness of random fibres in composites, Cem. Concr. Res. 9 (1979) 685-693. 15
[34] P. Stroeven, J. Hu, Effectiveness near boundaries of fibre reinforcement in concrete, Mater. Struct. 39 (2006) 16
1001-1013. 17
[35] A. Abrishambaf, J.A.O. Barros, V.M.C.F. Cunha, Determination of time-dependent behaviour of bond in steel 18
fibre reinforced self-compacting concrete, University of Minho, Portugal, 14-JUL/E-18, 2014. 19
[36] A. Abrishambaf, J.A.O., Barros, V.M.C.F. Cunha, Characterizing the time-dependent behaviour of cracked 20
steel fibre reinforced self-compacting concrete panels, University of Minho, Portugal, 14-July/E-19, 2014. 21
[37] EN1992-1-1, Eurocode 2: Design of concrete structures, European Committee of standardization, Brussels, 22
2004. 23
[38] ACI-Committee-209, Prediction of creep, shrinkage and temperature effects in concrete structures, ACI Manual 24
of concrete practice, Part 1, 1997. 25
[39] CEB-FIP, Model code for concrete structures: Evaluation of the time dependent behaviour of concrete, Comite 26
European du Beton/Federation Internationale de la Precontrainte, Lausanne Bulletin d’Information No. 199, , 1999. 27
[40] W. Rasband, ImageJ, National Institutes of Health, USA, 2008.http://rsb.info.nih.gov/ij/ 28

24
FIGURES AND TABLES 1
List of Figures: 2
Fig. 1: (a) Specimen’s extracting plane, (b) definition of β angle. 3
Fig. 2: Test setup of monotonic four-point bending test (dimensions are in mm): (a) geometry of the specimen and 4
LVDT for measuring the deflection (b) LVDTs to record CTOD, (c) LVDT connection details for measuring 5
CTOD. 6
Fig. 3: Creep test setup: (a) general view, (b) position and connection details of the LVDT. 7
Fig. 4: Definition of crack opening parameters in creep test: (a) crack opening- time relationship, w-t, (b) force-crack 8
opening curve, F-w. 9
Fig. 5: A graphical representation of assembled long-term force-crack width curve. 10
Fig. 6: Location of the plane surface in studied beams (dimensions are in mm). 11
Fig. 7: Explanation for fibre alignment in flowing concrete of a panel: (a) casting from the centre (top view), (b) 12
through the cross section. 13
Fig. 8: Predicted orientation probability functions for β in the intervals: (a) [0-15°[, (b) [15-45°[, (c) [45-75°[ and (d) 14
[75-90°]. 15
Fig. 9: Monotonic force-crack tip opening displacement relationship for β in the intervals: (a) [0-15°[, (b) [15-45°[, 16
(c) [45-75°[ and (d) [75-90°]; (e) comparison of monotonic F-CTOD relationship for different series. 17
Fig. 10: Crack opening rate as a function of Fa / Fcr: (a) specimens pre-cracked up to 0.3 mm, wcr=0.3 mm, (b) 18
specimens pre-cracked up to 0.5 mm, wcr=0.5 mm. 19
Fig. 11: Relationship between creep coefficient in creep stage and Fa / Fcr: (a) wcr=0.3 mm, (b) wcr=0.5 mm. 20
Fig. 12: Creep coefficient versus time in the creep tests for the two pre-crack width levels grouped in low and high 21
Fa / Fcr ratio. 22
Fig. 13: Creep coefficient versus time for specimens at different distances from casting point in the series of: (a) 23
wcr=0.3 mm, (b) wcr =0.5 mm. 24

25
Fig. 14: Creep coefficient versus time for different orientation of the notched plane in the series of: (a) wcr=0.3 mm, 1
(b) wcr =0.5 mm. 2
Fig. 15: Relationship between secondary stiffness, Ksec, and long-term residual crack opening width,res
ltw . 3
Fig. 16: Comparison of the monotonic and long-term assembled curves for wcr=0.3 mm: (a), (b) β = [0-15°]; (c), (d) 4
β = [15-45°]; (e), (f) β = [45-75°]; (g), (h) β = [75-90°]. (a), (c), (e), (g) 50% / 75%a cr
F F and (b), (d), (f), (h)5
75% / 100%a crF F . 6
Fig. 17: Comparison of the monotonic and long-term assembled curves for wcr=0.5 mm: (a), (b) β = [0-15°]; (c), (d) 7
β = [15-45°]; (e), (f) β = [45-75°]; (g), (h) β = [75-90°]. (a), (c), (e), (g) 50% / 75%a cr
F F and (b), (d), (f), (h)8
75% / 100%a crF F . 9
Fig. 18: Comparison between experimental and analytical creep coefficient vs. time relationship for series: (a) 10
wcr=0.3 mm and (b) wcr=0.5 mm. 11
Fig. 19: Influence of Fa / Fcr load level on the long-term crack opening vs. time response for wcr equal to: (a) 0.3 mm 12
and (b) 0.5 mm. 13
Fig. 20: Image processing steps: (a) converting a RGB image to greyscale image (b) adjusting a threshold, (c) 14
defining mask, noise (remove small noises) and watershed (separated fibres which are stuck together) functions, (d) 15
fitting the best ellipse to each fibre. 16
17
18
19
20
21
22
23

26
(a) (b)
Fig. 1: (a) Specimen’s extracting plane, (b) definition of β angle. 1
2
3
4
5
6
7
8
9
10
11
12
1500 mm1500 m
m

27
(a) (b) (c)
Fig. 2: Test setup of monotonic four-point bending test (dimensions are in mm): (a) geometry of the specimen and 1
LVDT for measuring the deflection (b) LVDTs to record CTOD, (c) LVDT connection details for measuring 2
CTOD. 3
4
5
6
7
8
9
10
11
12
13
14
15
16
NotchGlue
LVDTLVDTsupport
Cubicsupport
CTOD
L/3 L/3 L/3
180
10
20
20
10
LVDT
Support

28
(a) (b)
Fig. 3: Creep test setup: (a) general view, (b) position and connection details of the LVDT. 1
2
3
4
5
6
7
8
9
10
11
12
13
14
Notch Glue
LVDT LVDTsupport
Cubicsupport
CTOD
Load plate
Load cell
Load device
Specimen
Support
Hydraulic
actuator
Data
logger

29
(a) (b)
Fig. 4: Definition of crack opening parameters in creep test: (a) crack opening-time relationship, w-t, (b) force-crack 1
opening curve, F-w. 2
3
4
5
6
7
8
9
10
11
12
13
14
15
16
w
t
winst
wlt
wtotal
wlt
res
wtotal
w
w
rec
inst
rec
lt
rec
F
w
Fa
winst wlt
wtotal
wlt
res

30
1
Fig. 5: A graphical representation of assembled long-term force-crack width curve. 2
3
4
5
6
7
8
9
10
11
12
13
14
15
16
17
Fpmax
wpmax
Ksec
Fcr
FL
wcr
wcr
F
wres
wlt
res
Cracking Creep Post-creep
31
1
Fig. 6: Location of the plane surface in studied beams (dimensions are in mm). 2
3
4
5
6
7
8
9
10
11
12
13
14
15
16
240
60
16

32
(a) (b)
Fig. 7: Explanation for fibre alignment in flowing concrete of a panel: (a) casting from the centre (top view), (b) 1
through the cross section. 2
3
4
5
6
7
8
9
10
11
12
13
14
15
16
17
Fibre
Concrete flowdirection
Bottom surface
Top surface
Concrete flowdirection Fibre
Rotation of
fibres
33
(a) (b)
(c) (d)
Fig. 8: Predicted orientation probability functions for β in the intervals: (a) [0-15°[, (b) [15-45°[, (c) [45-75°[ and (d) 1
[75-90°]. 2
3
4
5
6
7
8
9
0 10 20 30 40 50 60 70 80 90
0.0
0.5
1.0
1.5
2.0
2.5
3.0
3.5
4.0
4.5
Pro
bab
ilit
y,
p(
)
Orientation angle [deg.]
D)
D)
0 10 20 30 40 50 60 70 80 90
0.0
0.5
1.0
1.5
2.0
2.5
3.0
3.5
4.0
4.5
Pro
bab
ilit
y,
p(
)
Orientation angle [deg.]
D)
D)
0 10 20 30 40 50 60 70 80 90
0.0
0.5
1.0
1.5
2.0
2.5
3.0
3.5
4.0
4.5
Pro
ba
bil
ity
, p
()
Orientation angle [deg.]
D)
D)
0 10 20 30 40 50 60 70 80 90
0.0
0.5
1.0
1.5
2.0
2.5
3.0
3.5
4.0
4.5
Pro
ba
bil
ity
, p
()
Orientation angle [deg.]
D)
D)

34
(a) (b)
(c) (d)
(e)
Fig. 9: Monotonic force-crack tip opening displacement relationship for β in the intervals: (a) [0-15°[, (b) [15-45°[, 1
(c) [45-75°[ and (d) [75-90°]; (e) comparison of monotonic F-CTOD relationship for different series. 2
3
0.0 0.5 1.0 1.5 2.0 2.5 3.0 3.5
0
2
4
6
8
10
12
Envelope
AverageF
orc
e [
kN
]
CTOD [mm]
0.0 0.5 1.0 1.5 2.0 2.5 3.0 3.5
0
2
4
6
8
10
12
Envelope
Average
Fo
rce
[k
N]
CTOD [mm]
0.0 0.5 1.0 1.5 2.0 2.5 3.0 3.5
0
2
4
6
8
10
12
Envelope
Average
Fo
rce
[k
N]
CTOD [mm]
0.0 0.5 1.0 1.5 2.0 2.5 3.0 3.5
0
2
4
6
8
10
12
Envelope
Average
Fo
rce
[k
N]
CTOD [mm]
0.0 0.5 1.0 1.5 2.0 2.5 3.0 3.5
0
2
4
6
8
10
Fo
rce
[k
N]
CTOD [mm]
0-15
15-45
45-75
75-90

35
(a) (b)
Fig. 10: Crack opening rate as a function of Fa / Fcr: (a) specimens pre-cracked up to 0.3 mm, wcr=0.3 mm, (b) 1
specimens pre-cracked up to 0.5 mm, wcr=0.5 mm. 2
3
4
5
6
7
8
9
10
11
12
13
14
15
50 55 60 65 70 75 80 85 90 95 100
0
2
4
6
8
10
12
14
16
18
7 days 7days tendency
15 days 15days tendency
30 days 30days tendency
60 days 60days tendency
CO
R [m
/da
y]
Fa / Fcr [%]
50 55 60 65 70 75 80 85 90 95 100
0
2
4
6
8
10
12
14
16
18 7 days 7days tendency
15 days 15days tendency
30 days 30days tendency
60 days 60days tendency
CO
R [m
/da
y]
Fa / Fcr [%]

36
(a) (b)
Fig. 11: Relationship between creep coefficient in creep stage and Fa / Fcr: (a) wcr=0.3 mm, (b) wcr=0.5 mm. 1
2
3
4
5
6
7
8
9
10
11
12
13
14
15
50 55 60 65 70 75 80 85 90 95 100
0.0
0.1
0.2
0.3
0.4
0.5
0.6
0.7
0.8
0.9
1.0
7 days 7days tendency
15 days 15days tendency
30 days 30days tendency
60 days 60days tendency
C[
Fa / Fcr [%]
50 55 60 65 70 75 80 85 90 95 100
0.0
0.1
0.2
0.3
0.4
0.5
0.6
0.7
0.8
0.9
1.0 7 days 7days tendency
15 days 15days tendency
30 days 30days tendency
60 days 60days tendency
C [
Fa / Fcr [%]

37
1
Fig. 12: Creep coefficient versus time in the creep tests for the two pre-crack width levels grouped in low and high 2
Fa / Fcr ratio. 3
4
5
6
7
8
9
10
11
12
13
14
15
16
17
0 250 500 750 1000 1250 1500
0.0
0.1
0.2
0.3
0.4
0.5
0.6
Cre
ep
co
eff
icie
nt,
C,
[-]
Time [hours]
Wcr=0.3 mm, F
a/F
cr=Low
Wcr=0.3 mm, F
a/F
cr=High
Wcr=0.5 mm, F
a/F
cr=Low
Wcr=0.5 mm, F
a/F
cr=High

38
(a) (b)
Fig. 13: Creep coefficient versus time for specimens at different distances from casting point in the series of: (a) 1
wcr=0.3 mm, (b) wcr =0.5 mm. 2
3
4
5
6
7
8
9
10
11
12
13
14
15
16
0 250 500 750 1000 1250 1500
0.0
0.1
0.2
0.3
0.4
0.5
0.6
0.7C
ree
p c
oe
ffic
ien
t,
C,
[-]
Time (hours)
Dist. = 375 mm
Dist. = 565 mm
Dist. = 750 mm
0 250 500 750 1000 1250 1500
0.0
0.1
0.2
0.3
0.4
0.5
0.6
0.7
Dist. = 375 mm
Dist. = 565 mm
Dist. = 750 mm
Cre
ep
co
eff
icie
nt,
C,
[-]
Time (hours)
39
(a) (b)
Fig. 14: Creep coefficient versus time for different orientation of the notched plane in the series of: (a) wcr=0.3 mm, 1
(b) wcr =0.5 mm. 2
3
4
5
6
7
8
9
10
11
12
13
14
15
16
0 250 500 750 1000 1250 1500
0.0
0.1
0.2
0.3
0.4
0.5
0.6
0.7
Cre
ep
co
eff
icie
nt,
C,
[-]
Time (hours)
=[0-15o[
=[15-45o[
=[45-75o[
=[75-90o]
0 250 500 750 1000 1250 1500
0.0
0.1
0.2
0.3
0.4
0.5
0.6
0.7
=[0-15o[
=[15-45o[
=[45-75o[
=[75-90o]
Cre
ep
co
eff
icie
nt,
C,
[-]
Time (hours)
40
1
Fig. 15: Relationship between secondary stiffness, Ksec, and long-term residual crack opening width,res
ltw . 2
3
4
5
6
7
8
9
10
11
12
13
14
15
16
17
0.00 0.05 0.10 0.15 0.20
0
10
20
30
40
50 Predicted relationship by Eq.4
R-square=0.71
Ks
ec [
kN
/mm
]
wreslt [mm]

41
(a) (b)
(c) (d)
(e) (f)
0.0 0.5 1.0 1.5 2.0 2.5 3.0 3.5
0
2
4
6
8
10
12
MonEnvelope
MonAverage
Cracking
Creep
Post-creep
Fo
rce [
kN
]
CTOD [mm]
0.0 0.5 1.0 1.5 2.0 2.5 3.0 3.5
0
2
4
6
8
10
12
MonEnvelope
MonAverage
Cracking
Creep
Post-creep
Fo
rce [
kN
]
CTOD [mm]
0.0 0.5 1.0 1.5 2.0 2.5 3.0 3.5
0
2
4
6
8
10
12
MonEnvelope
MonAverage
Cracking
Creep
Post-creep
Fo
rce [
kN
]
CTOD [mm]
0.0 0.5 1.0 1.5 2.0 2.5 3.0 3.5
0
2
4
6
8
10
12
MonEnvelope
MonAverage
Cracking
Creep
Post-creep
Fo
rce [
kN
]
CTOD [mm]
0.0 0.5 1.0 1.5 2.0 2.5 3.0 3.5
0
2
4
6
8
10
12
MonEnvelope
MonAverage
Cracking
Creep
Post-creep
Fo
rce [
kN
]
CTOD [mm]
0.0 0.5 1.0 1.5 2.0 2.5 3.0 3.5
0
2
4
6
8
10
12
MonEnvelope
MonAverage
Cracking
Creep
Post-creep
Fo
rce [
kN
]
CTOD [mm]

42
(g) (h)
Fig. 16: Comparison of the monotonic and long-term assembled curves for wcr=0.3 mm: (a), (b) β = [0-15°]; (c), (d) 1
β = [15-45°]; (e), (f) β = [45-75°]; (g), (h) β = [75-90°]. (a), (c), (e), (g) 50% / 75%a cr
F F and (b), (d), (f), (h)2
75% / 100%a crF F . 3
4
5
6
7
8
9
10
11
12
13
14
15
16
0.0 0.5 1.0 1.5 2.0 2.5 3.0 3.5
0
2
4
6
8
10
12
MonEnvelope
MonAverage
Cracking
Creep
Post-creep
Fo
rce [
kN
]
CTOD [mm]
Not available

43
(a) (b)
(c) (d)
(e) (f)
0.0 0.5 1.0 1.5 2.0 2.5 3.0 3.5
0
2
4
6
8
10
12
MonEnvelope
MonAverage
Cracking
Creep
Post-creep
Fo
rce [
kN
]
CTOD [mm]
0.0 0.5 1.0 1.5 2.0 2.5 3.0 3.5
0
2
4
6
8
10
12
MonEnvelope
MonAverage
Cracking
Creep
Post-creep
Fo
rce [
kN
]
CTOD [mm]
0.0 0.5 1.0 1.5 2.0 2.5 3.0 3.5
0
2
4
6
8
10
12
MonEnvelope
MonAverage
Cracking
Creep
Post-creep
Fo
rce [
kN
]
CTOD [mm]
0.0 0.5 1.0 1.5 2.0 2.5 3.0 3.5
0
2
4
6
8
10
12
MonEnvelope
MonAverage
Cracking
Creep
Post-creep
Fo
rce [
kN
]
CTOD [mm]
0.0 0.5 1.0 1.5 2.0 2.5 3.0 3.5
0
2
4
6
8
10
12
MonEnvelope
MonAverage
Cracking
Creep
Post-creep
Fo
rce [
kN
]
CTOD [mm]
0.0 0.5 1.0 1.5 2.0 2.5 3.0 3.5
0
2
4
6
8
10
12
MonEnvelope
MonAverage
Cracking
Creep
Post-creep
Fo
rce [
kN
]
CTOD [mm]
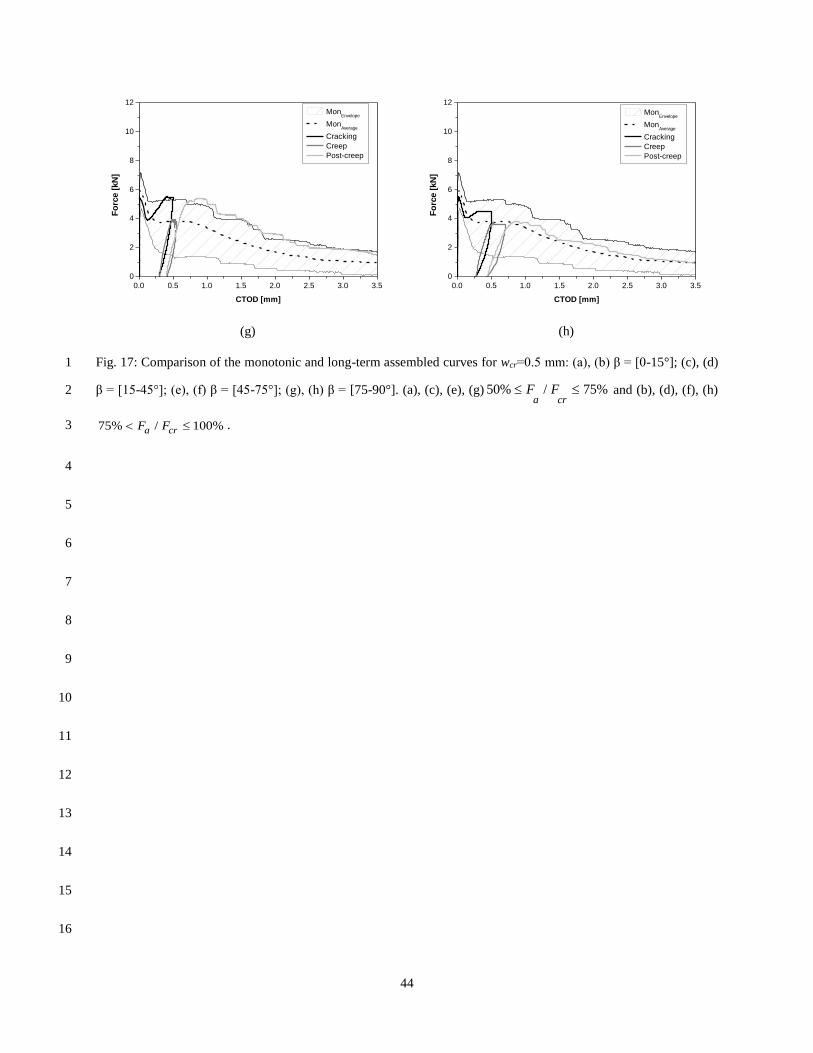
44
(g) (h)
Fig. 17: Comparison of the monotonic and long-term assembled curves for wcr=0.5 mm: (a), (b) β = [0-15°]; (c), (d) 1
β = [15-45°]; (e), (f) β = [45-75°]; (g), (h) β = [75-90°]. (a), (c), (e), (g) 50% / 75%a cr
F F and (b), (d), (f), (h)2
75% / 100%a crF F . 3
4
5
6
7
8
9
10
11
12
13
14
15
16
0.0 0.5 1.0 1.5 2.0 2.5 3.0 3.5
0
2
4
6
8
10
12
MonEnvelope
MonAverage
Cracking
Creep
Post-creep
Fo
rce [
kN
]
CTOD [mm]
0.0 0.5 1.0 1.5 2.0 2.5 3.0 3.5
0
2
4
6
8
10
12
MonEnvelope
MonAverage
Cracking
Creep
Post-creep
Fo
rce [
kN
]
CTOD [mm]

45
(a) (b)
Fig. 18: Comparison between experimental and analytical creep coefficient vs. time relationship for series: (a) 1
wcr=0.3 mm and (b) wcr=0.5 mm. 2
3
4
5
6
7
8
9
10
11
12
13
14
15
0 250 500 750 1000 1250 1500
0.0
0.1
0.2
0.3
0.4
0.5
0.6
0.7
Cre
ep
co
eff
icie
nt,
c,
[-]
Time [hours]
EXP Fa/Fcr=Low
EXP Fa/Fcr=High
ANLT Fa/Fcr=Low
ANLT Fa/Fcr=High
0 250 500 750 1000 1250 1500
0.0
0.1
0.2
0.3
0.4
0.5
0.6
0.7
EXP Fa/Fcr=Low
EXP Fa/Fcr=High
ANLT Fa/Fcr=Low
ANLT Fa/Fcr=High
Cre
ep
co
eff
icie
nt,
c,
[-]
Time [hours]

46
(a) (b)
Fig. 19: Influence of Fa / Fcr load level on the long-term crack opening vs. time response for wcr equal to: (a) 0.3 mm 1
and (b) 0.5 mm. 2
3
4
5
6
7
8
9
10
11
12
13
14
15
16
0 73 146 219 292 365
0.00
0.05
0.10
0.15
0.20
0.25
Fa/Fcr=0.5 Fa/Fcr=0.8
Fa/Fcr=0.6 Fa/Fcr=0.9
Fa/Fcr=0.7 Fa/Fcr=1.0w
lt [
mm
]
Time [days]
0 73 146 219 292 365
0.00
0.05
0.10
0.15
0.20
0.25
Fa/Fcr=0.5 Fa/Fcr=0.8
Fa/Fcr=0.6 Fa/Fcr=0.9
Fa/Fcr=0.7 Fa/Fcr=1.0
wlt [
mm
]
Time [days]

47
(a) (b)
(c) (d)
Fig. 20: Image processing steps: (a) converting a RGB image to greyscale image (b) adjusting a threshold, (c) 1
defining mask, noise (remove small noises) and watershed (separated fibres which are stuck together) functions, (d) 2
fitting the best ellipse to each fibre. 3
4
5
6
7
8
9
10
11
12

48
List of Tables: 1
Table 1: Mix design of steel fibre reinforced self-compacting concrete per m3. 2
Table 2: Fibre distribution parameters for the specimens after monotonic 4-P bending test. 3
4
5

49
Table 1: Mix design of steel fibre reinforced self-compacting concrete per m3. 1
Cement
[kg]
Water
[kg]
W/C
[–]
SP
[kg]
Filler
[kg]
Fine sand
[kg]
Coarse sand
[kg]
Coarse aggregate
[kg]
Fibre
[kg]
413 124 0.30 7.83 353 237 710 590 60
2
3
4
5
6
7
8
9
10
11
12
13
14
15
16
17
18
19

50
Table 2: Fibre distribution parameters for the specimens after monotonic 4-P bending test. 1
Specimen
fN
f
effN
ηθ seg
[fibres/cm2] [fibres/cm2]
[-] [-]
β=[0-15°[ Average 2.12 1.18 0.875 0.52
CoV (%) 21.11 27.54 1.01 2.50
β=[15-45°[ Average 1.76 0.67 0.807 0.52
CoV (%) 11.75 28.65 4.37 2.56
β=[45-75°[ Average 1.53 0.46 0.73 0.58
CoV (%) 25.93 19.59 6.36 8.77
β=[75-90°] Average 0.87 0.15 0.672 0.62
CoV (%) 21.75 78.38 12.94 15.21
2
3


![[PREVIEW] Time-dependent behaviour and design of composite ...](https://static.documents.pub/doc/80x56/61add140c29c6741007b2916/preview-time-dependent-behaviour-and-design-of-composite-.jpg)


