
Title
Center for Coastal Center for Coastal and Ocean Mapping and Ocean Mapping NOAA/UNH Joint NOAA/UNH Joint Hydrographic CenterHydrographic Center
WindowsWindowsPython Python
TutorialTutorial
Kurt Schwehr
Jan 2007

Day 2More python
• Loops and tests• Plotting• And more…
Class website:http://vislab-ccom.unh.edu/~schwehr/Classes

What does perl look
like?

First some review of Day 1
• We covered a lot of ground yesterday
• Please ask if you have any questions
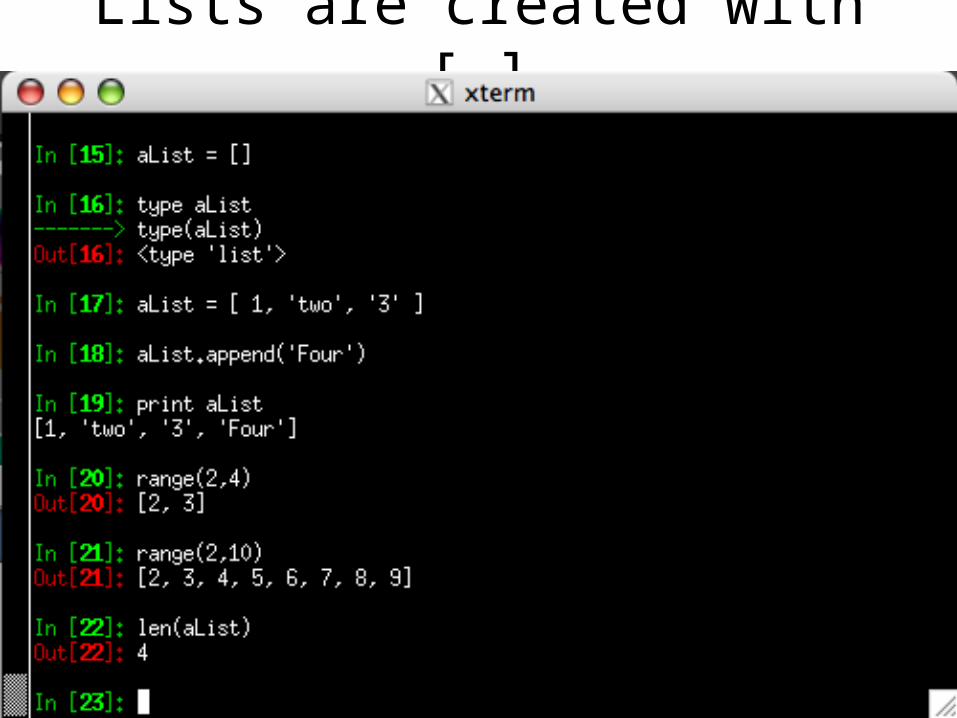
Lists are created with [ ]

Use tab to find out what ‘methods’ are available
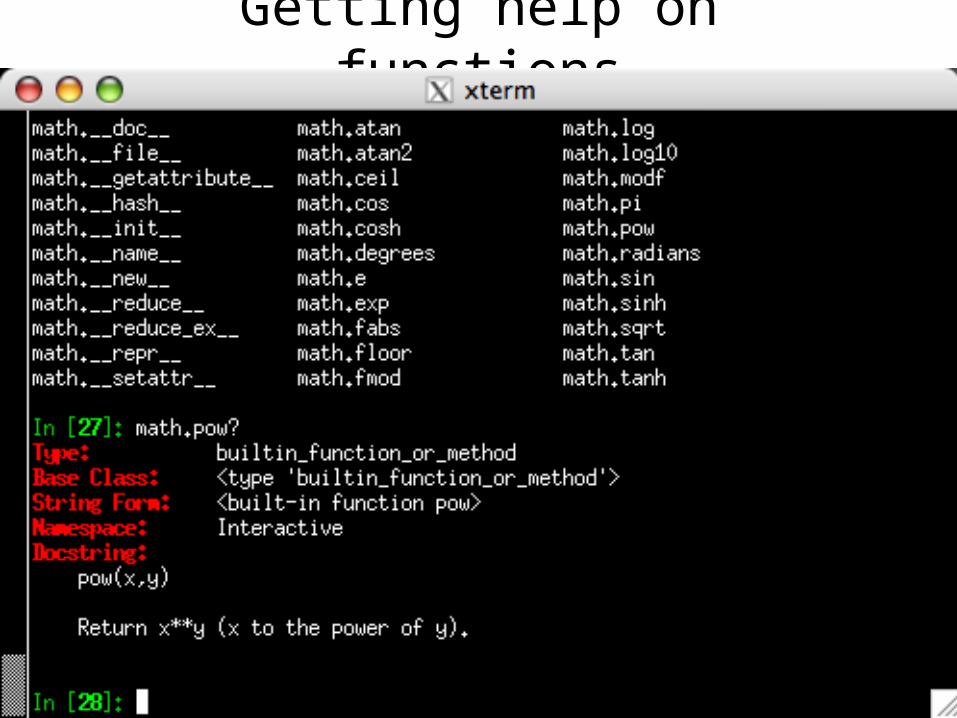
Getting help on functions
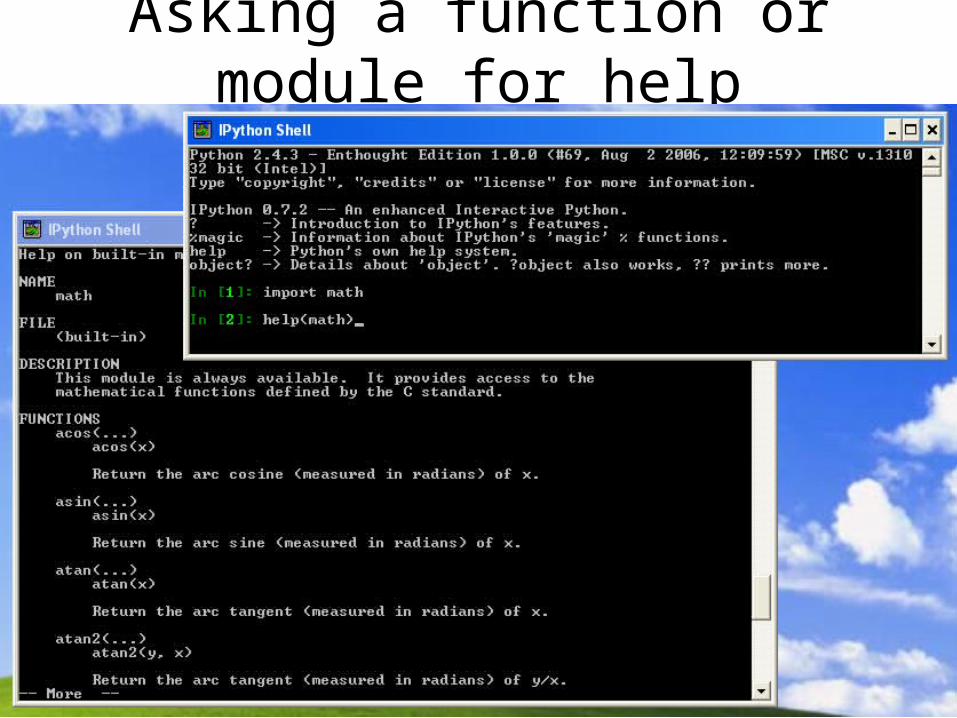
Asking a function or module for help

Start ipython

If tests and indentation matters
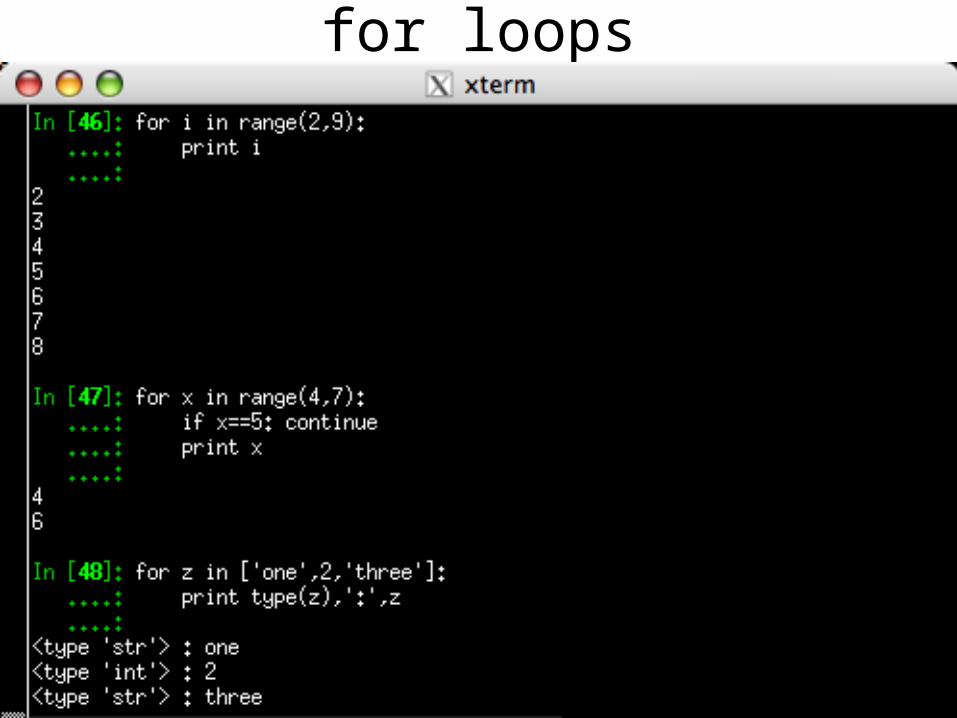
for loops
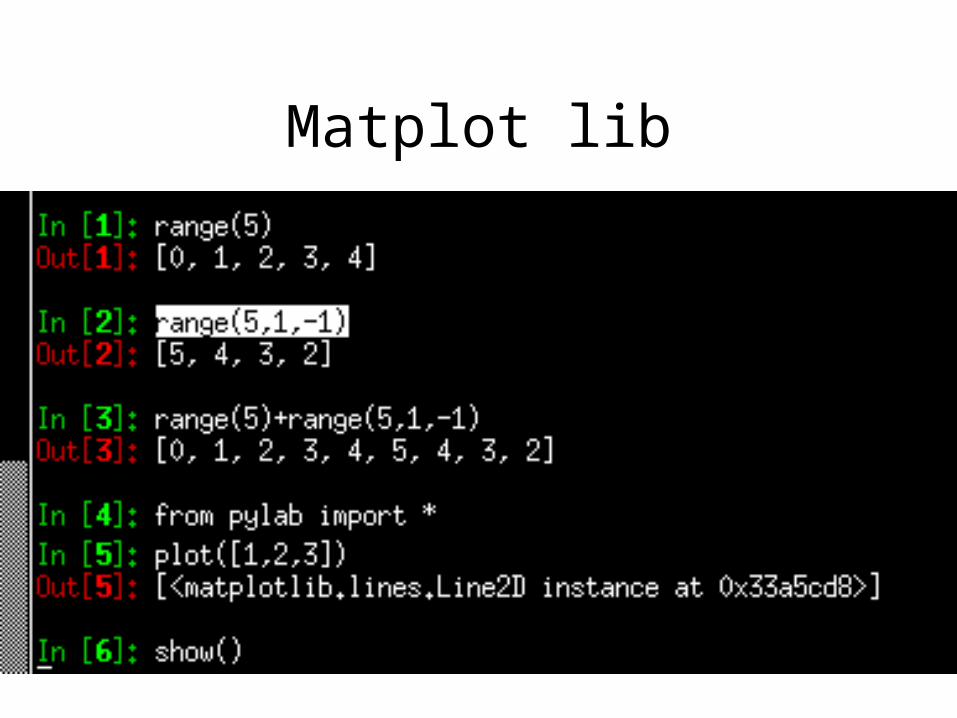
Matplot lib

1st plot

2nd plot
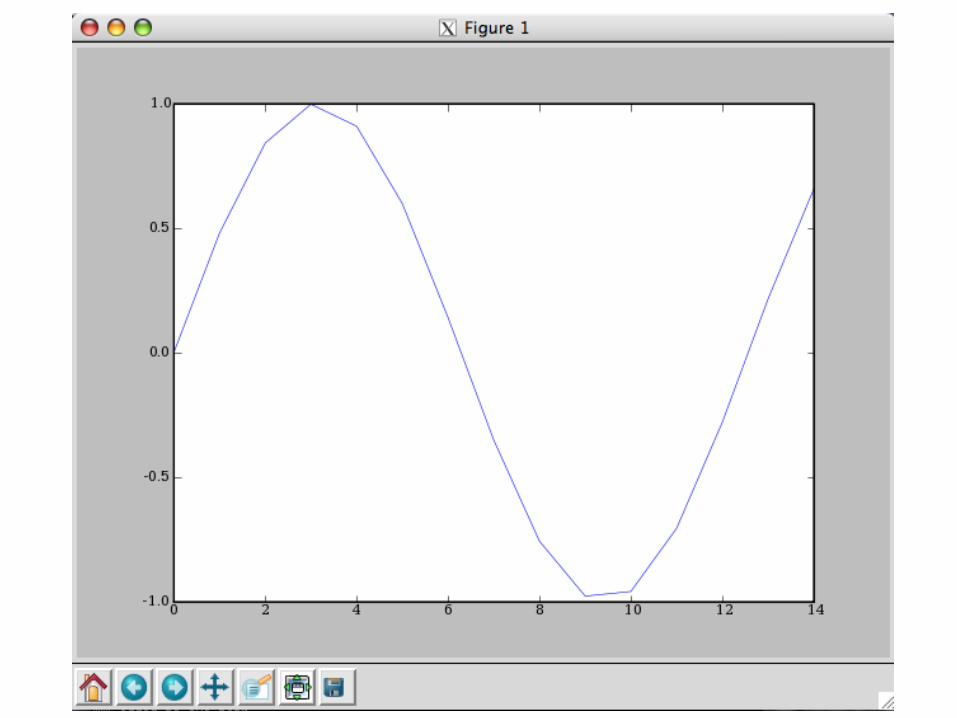
Discreet samples form a sine wave
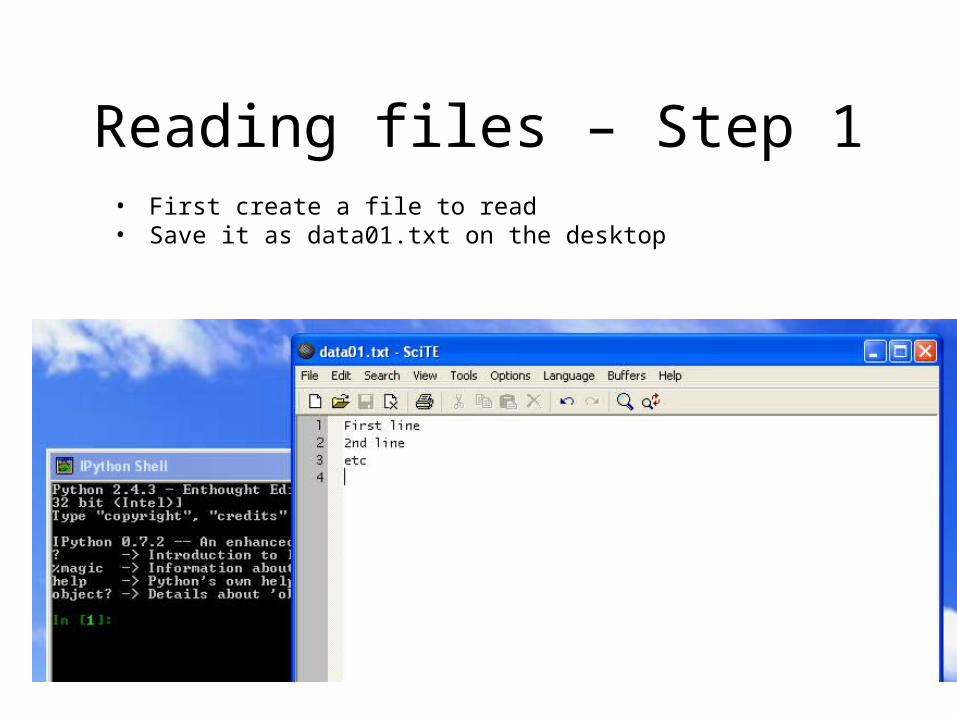
Reading files – Step 1• First create a file to read• Save it as data01.txt on the desktop
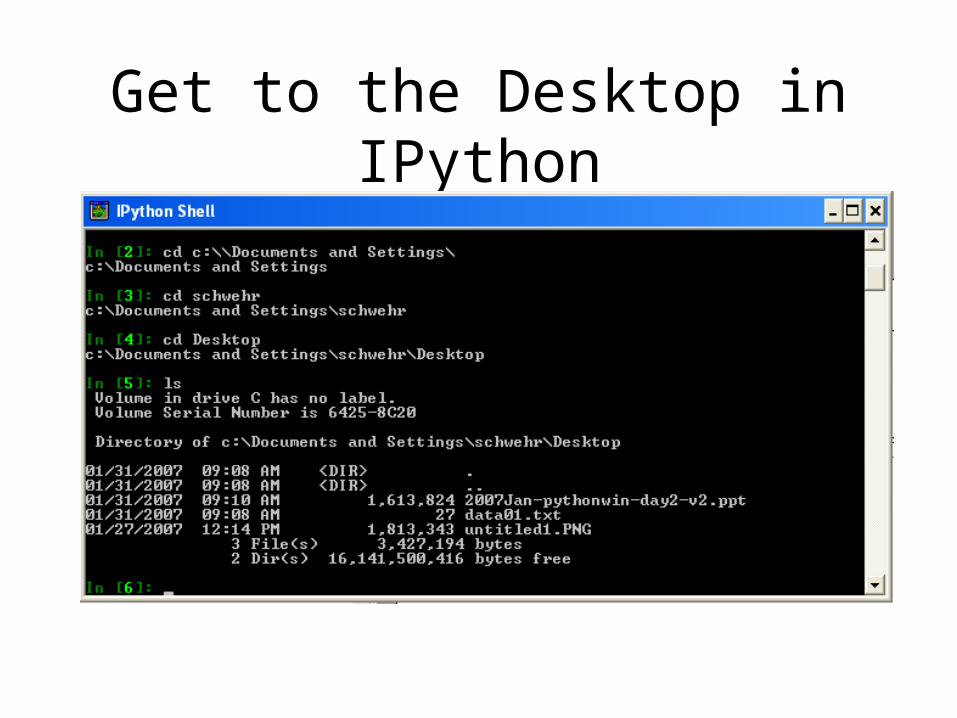
Get to the Desktop in IPython

Now read the file• Finish the for loop by going by unindenting• Each line is getting to new line characters• Use a comma to prevent the double end line
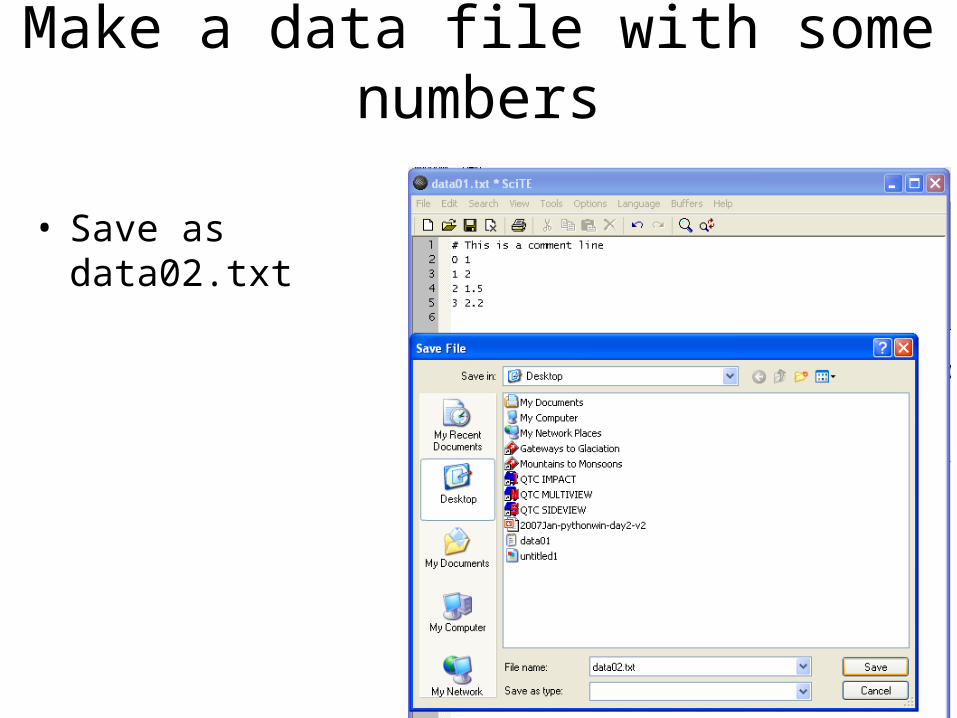
Make a data file with some numbers
• Save as data02.txt
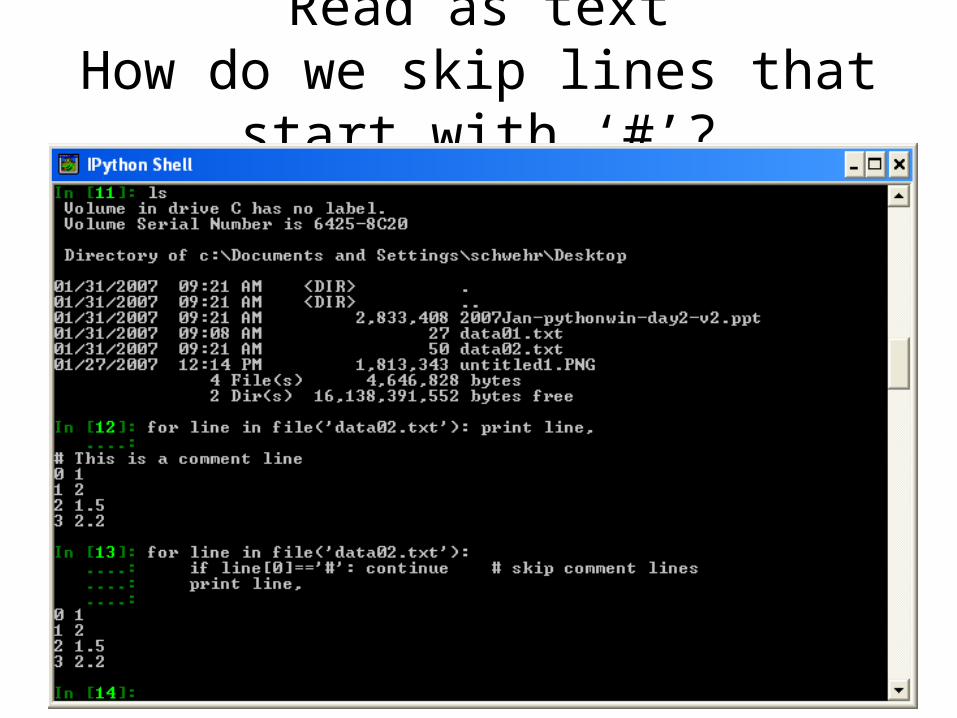
Read as textHow do we skip lines that start with ‘#’?
• Use if and continue
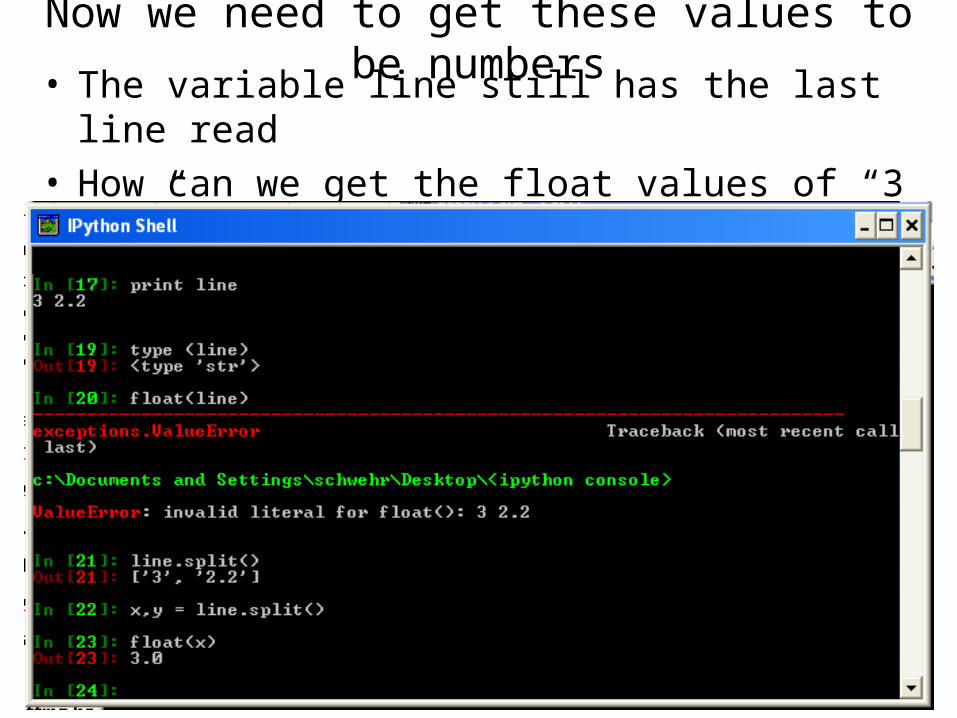
Now we need to get these values to be numbers• The variable line still has the last line read• How can we get the float values of “3 2.2”

Now put it all together in a script• Use SciTE to create the file• SciTE does not know this is python until you save the file
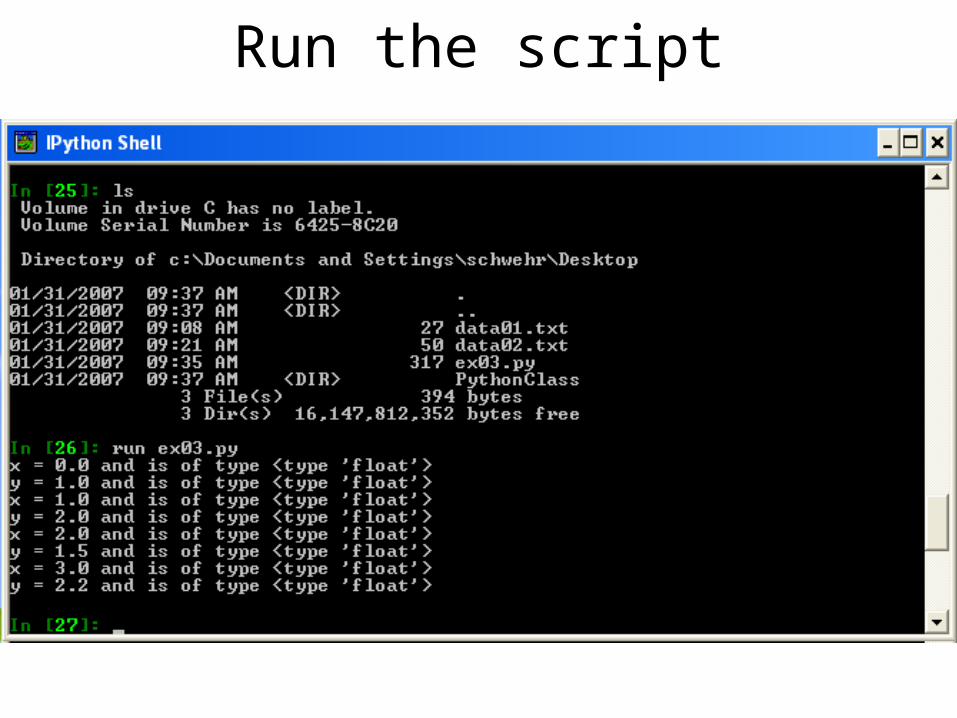
Run the script

Make that a function so you can reuse it!• Use SciTE to create ‘ex04.py’
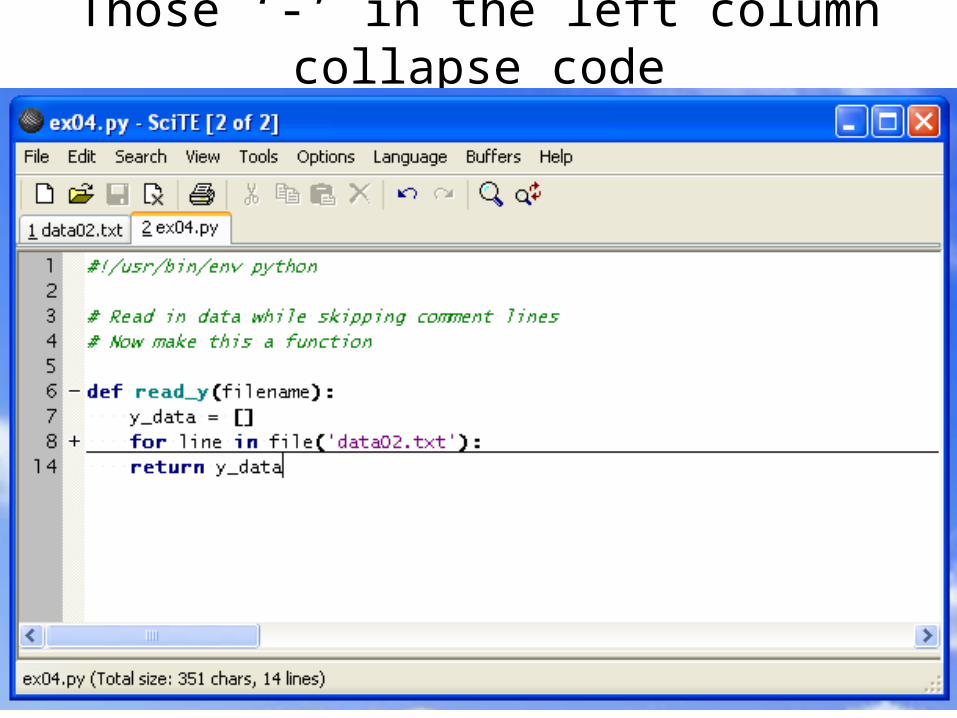
Those ‘-’ in the left column collapse code
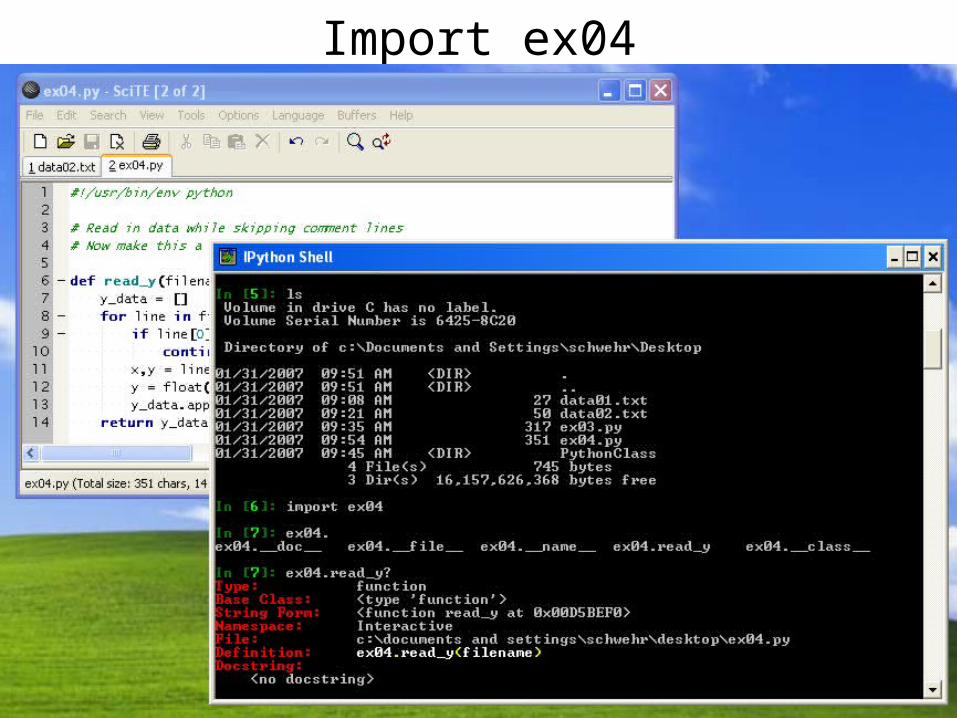
Import ex04
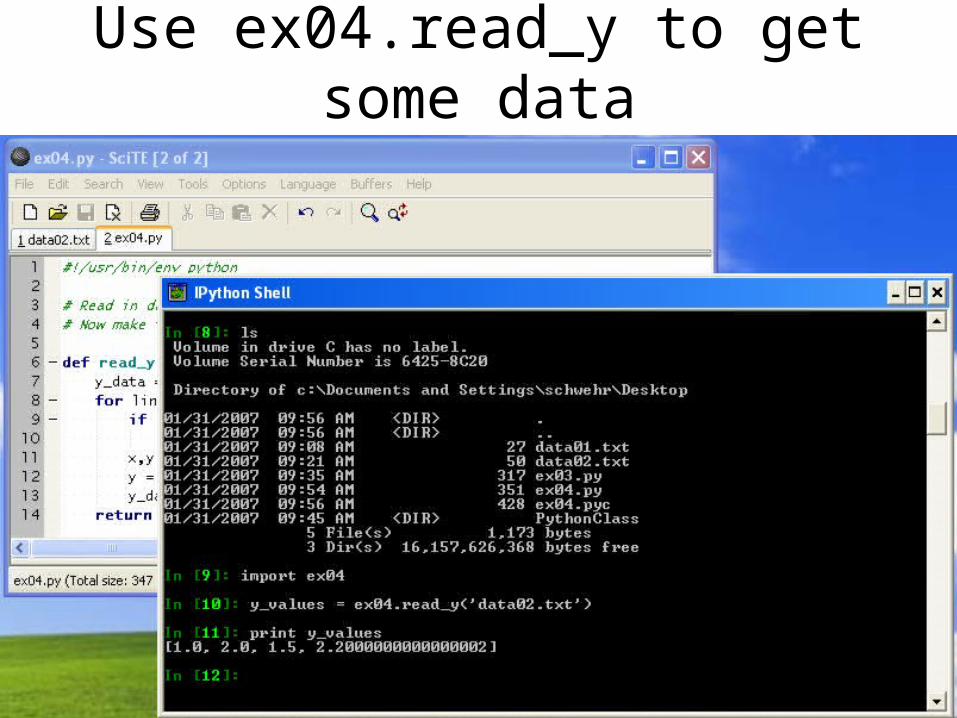
Use ex04.read_y to get some data
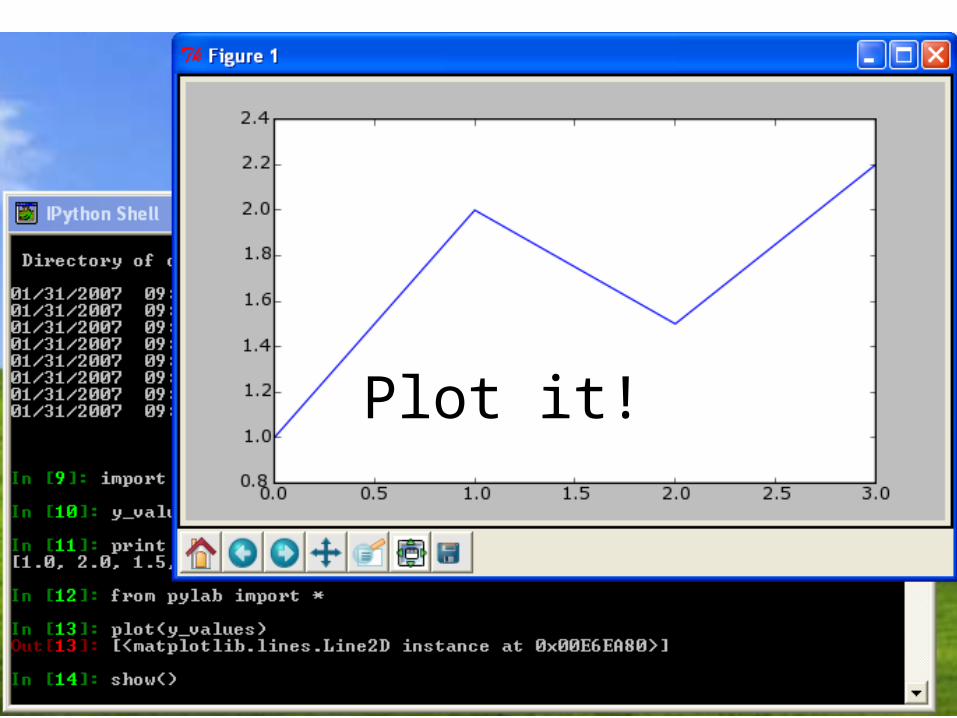
Plot it!

Save the plot

Write some data to disk• Use file to open a file, but tell it ‘w’ to open for writing• write does not append a newline and only takes strings• Close the file to make sure the data is written into the file

View the data in SciTE

Time is important for data logging
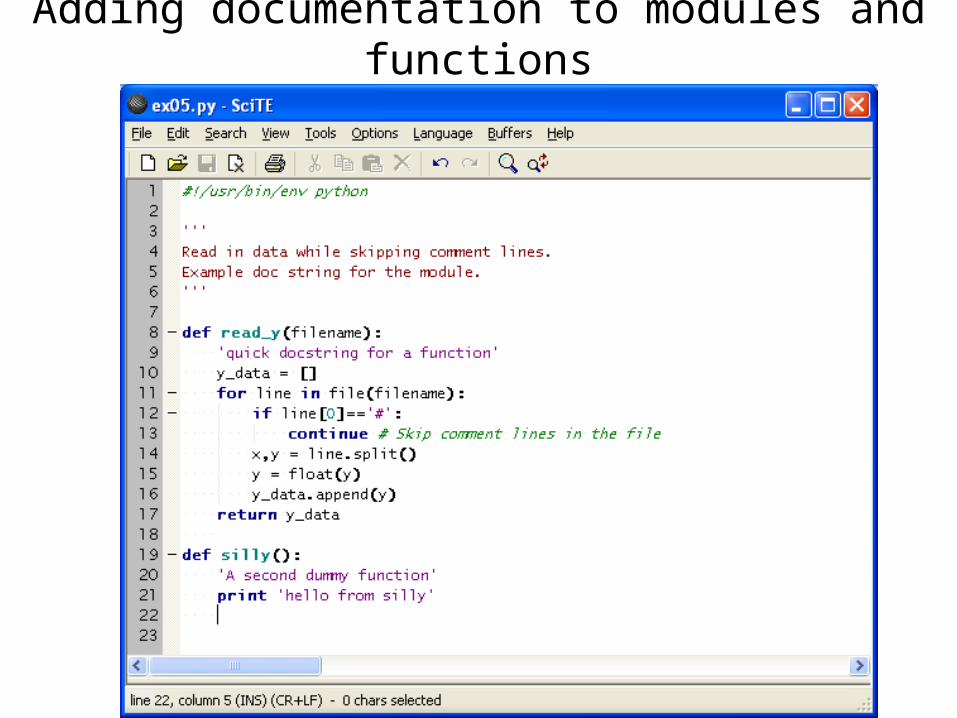
Adding documentation to modules and functions


The ex05 module now has a help


