

www.vra.com
6TH ANNUAL STAKEHOLDERS INTERFACE CHIEF EXECUTIVE’S PRESENTATION
SEPTEMBER 6, 2015
1

www.vra.com
2
• 2014 was a financially challenging year with uncertainties in economic and energy environment – Revenue of GHS 2.230.75 million. No Government subsidies to VRA in lieu of tariff
shortfall compared to a subsidy of GHS 644.27 million extended to VRA in 2013.
– Operational loss of GHS 74.13 million in 2014 compared to a profit of GHS208.11 in 2013
– Net loss of GHS 799.93 million (2013: Profit 61.74 million).
• Highest ever peak load of 1,970.9 MW, signaling continuous increased electricity demand compared to 1,942.9 MW in 2013.
• Hydro availability above consolidated target of 90%
• TTPS posted availability of 56.8%
• Tema Thermal Complex registered 80% availability.
• Navrongo Solar Power Plant recorded 100% availability.
Executive Summary
www.vra.com
3
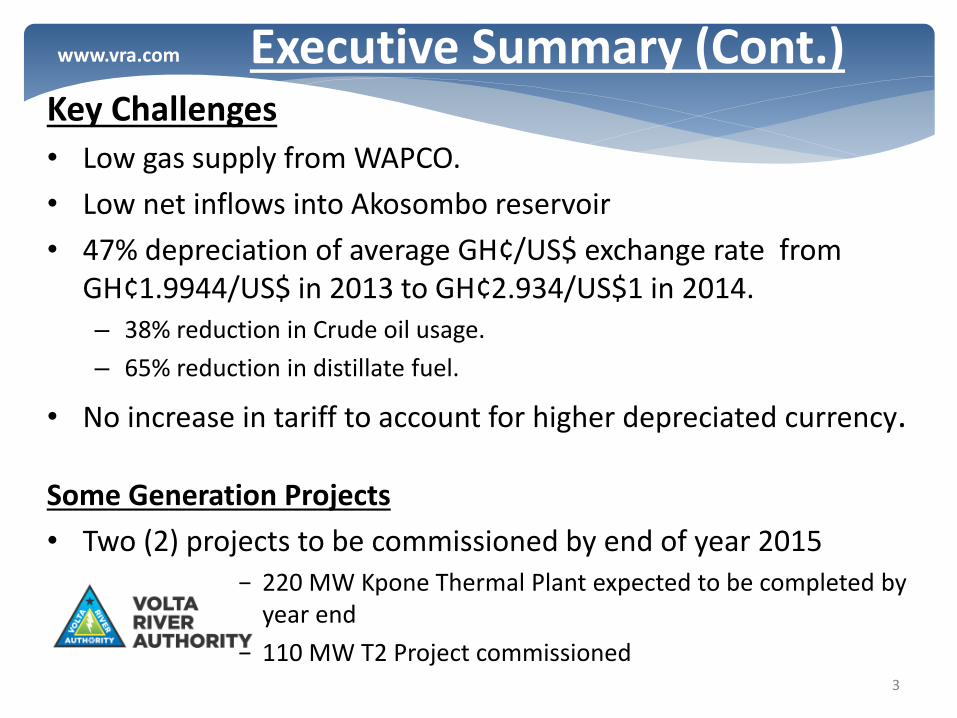
Key Challenges
• Low gas supply from WAPCO.
• Low net inflows into Akosombo reservoir
• 47% depreciation of average GH¢/US$ exchange rate from GH¢1.9944/US$ in 2013 to GH¢2.934/US$1 in 2014. – 38% reduction in Crude oil usage.
– 65% reduction in distillate fuel.
• No increase in tariff to account for higher depreciated currency.
Some Generation Projects
• Two (2) projects to be commissioned by end of year 2015 − 220 MW Kpone Thermal Plant expected to be completed by
year end
− 110 MW T2 Project commissioned
Executive Summary (Cont.)
www.vra.com
• Review of Technical and Financial Performance for 2014
• Short Term Projects to Help reduce supply shortfall
• Medium term projects
• Challenges
Presentation Outline
4

www.vra.com
5
PERFORMANCE

www.vra.com
6
THERMAL PLANT AVAILABILITY
21.01
74.62
65.06
17.42
44.53
85.00
71.60
5.59
11.98
7.20
24.09
5.00
17.30
61.26
20.85
15.83
28.81
75.00
-
25.00
50.00
75.00
100.00
32G1 32G2 32G3 T3 Plant Target
TTPS Annual Performance Statistics for 2014
Availability (%) Forced Outage (%) Capacity Utilization (%)
www.vra.com
7
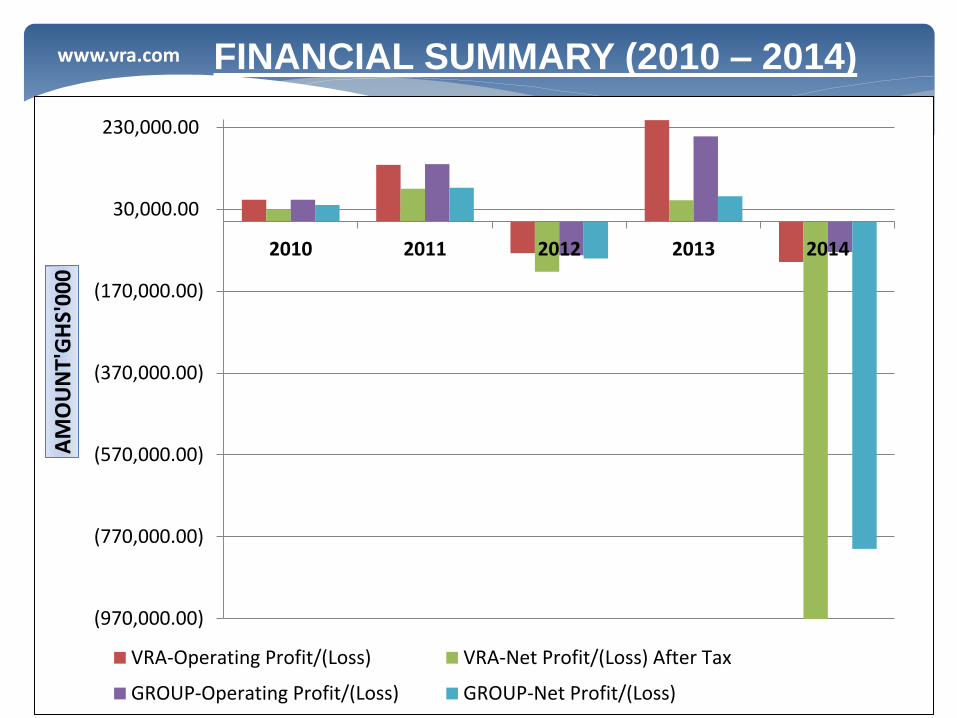
FINANCIAL SUMMARY (2010 – 2014)
(970,000.00)
(770,000.00)
(570,000.00)
(370,000.00)
(170,000.00)
30,000.00
230,000.00
2010 2011 2012 2013 2014
AM
OU
NT'
GH
S'0
00
VRA-Operating Profit/(Loss) VRA-Net Profit/(Loss) After Tax
GROUP-Operating Profit/(Loss) GROUP-Net Profit/(Loss)

www.vra.com
8
ELECTRICITY DEMAND AND SUPPLY
www.vra.com
9
• Total energy sold to VRA’s customers decreased by 576 GWh (6%) in 2014.
– Energy sales of 10,325 GWh in 2013 reducing to 9,749 GWh in 2014
POWER SALES

www.vra.com
10
GHANA ENERGY SALES
0
2,000
4,000
6,000
8,000
10,000
12,000
14,000
2003 2004 2005 2006 2007 2008 2009 2010 2011 2012 2013 2014
EN
ER
GY
IN
GW
h
OPERATIONAL YEAR
ANNUAL ENERGY CONSUMED (GWh) BY CLASS OF CUSTOMER 2003 -- 2014
SYSTEM USAGE
SONABEL+YOUGAMINE
CIE (NET)
CEB
MINES & OTHERS
ECG
VALCO

www.vra.com
11
ANNUAL DEMAND
0
500
1,000
1,500
2,000
2,500
2002 2003 2004 2005 2006 2007 2008 2009 2010 2011 2012 2013 2014
DE
MA
ND
IN
MW
OPERATIONAL YEAR
ANNUAL MAXIMUM DEMAND (MW) BY CLASS OF CUSTOMER (2002 - 2014)
SONABEL+YOUGAMINE
CIE
CEB
MINES & OTHERS
ECG
VALCO
1. The reduction in 1999 demand was due to domestic load curtailment. Also there was load curtailment in 2006 and 2007
2. The maximum demand for 2002 is higher than that of 2003 because Valco's load was curtailed.
3. Supply to SONEBEL (border towns Po and Leo) commenced in 2003 but is insignificant and therefore not visible on the
chart. Supply to Sonabel from 2009 includes Youga Mine

www.vra.com
12
2014 FINANCIALS
www.vra.com
13
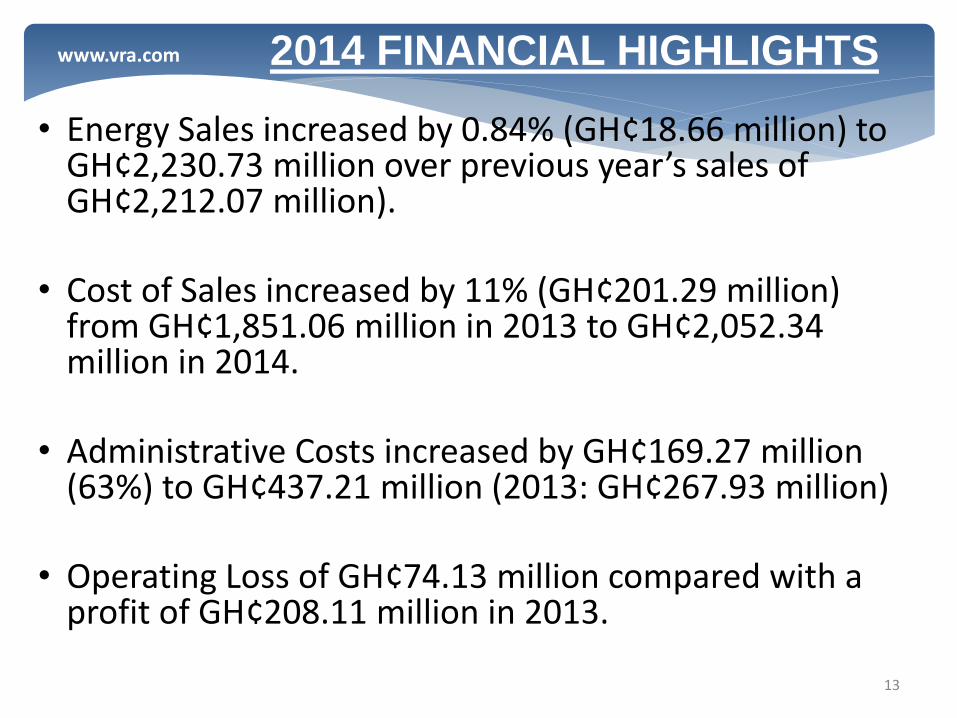
2014 FINANCIAL HIGHLIGHTS
• Energy Sales increased by 0.84% (GH¢18.66 million) to GH¢2,230.73 million over previous year’s sales of GH¢2,212.07 million).
• Cost of Sales increased by 11% (GH¢201.29 million)
from GH¢1,851.06 million in 2013 to GH¢2,052.34 million in 2014.
• Administrative Costs increased by GH¢169.27 million
(63%) to GH¢437.21 million (2013: GH¢267.93 million) • Operating Loss of GH¢74.13 million compared with a
profit of GH¢208.11 million in 2013.
www.vra.com
14
GENERATION CAPACITY ADDITIONS
www.vra.com
15
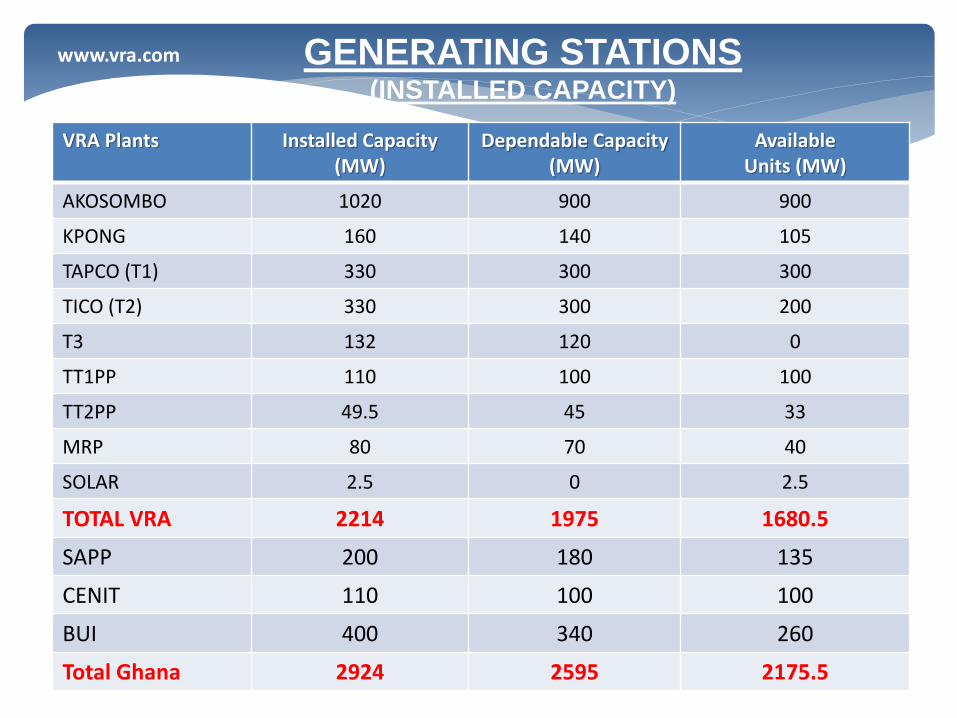
GENERATING STATIONS (INSTALLED CAPACITY)
15
VRA Plants Installed Capacity (MW)
Dependable Capacity (MW)
Available Units (MW)
AKOSOMBO 1020 900 900
KPONG 160 140 105
TAPCO (T1) 330 300 300
TICO (T2) 330 300 200
T3 132 120 0
TT1PP 110 100 100
TT2PP 49.5 45 33
MRP 80 70 40
SOLAR 2.5 0 2.5
TOTAL VRA 2214 1975 1680.5
SAPP 200 180 135
CENIT 110 100 100
BUI 400 340 260
Total Ghana 2924 2595 2175.5

www.vra.com
16
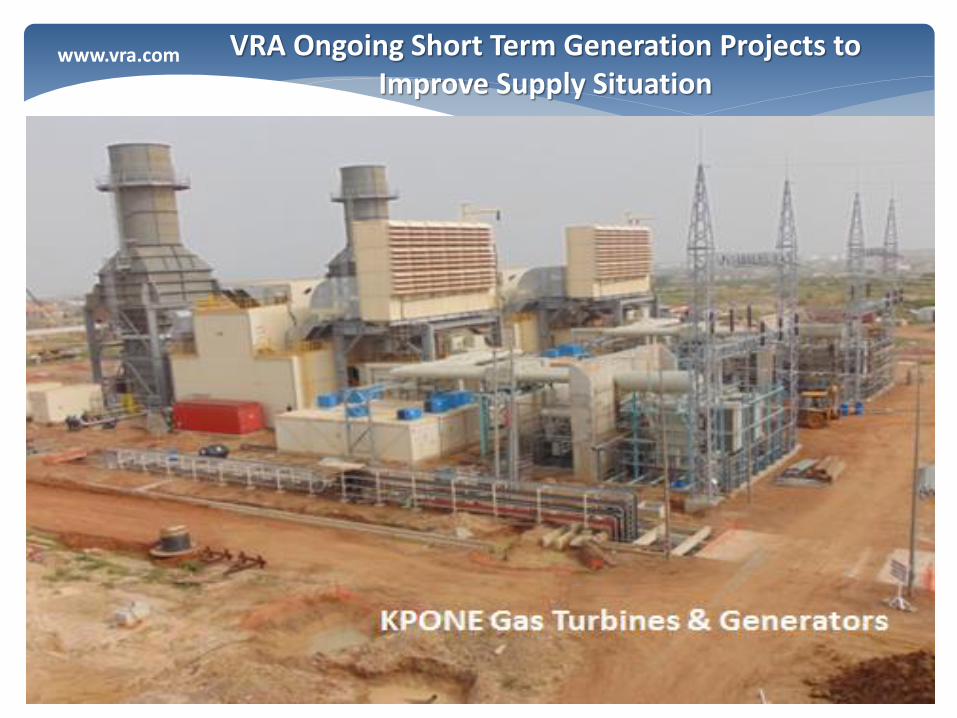
VRA Ongoing Short Term Generation Projects to Improve Supply Situation
• Currently the power system of Ghana is experiencing load shedding of up to 700 MW
• The situation has been compounded by low inflows so far into the Akosombo reservoir
• VRA is working on additional generation projects to complement the efforts of government to improve the power supply situation • 220 MW KTPP Project is currently under construction and is expected to
be commissioned by the end of the year. • The major challenge with this project has been financial and also long
years of storage of the plant equipment which rendered some parts faulty
• 250 MW AMERI Power project to be commissioned in 2016 depending on how soon financial terms are concluded
• 38 MW TT2PP Expansion project to be commissioned by 2016
www.vra.com
17
VRA Ongoing Short Term Generation Projects to Improve Supply Situation

www.vra.com
18
VRA Ongoing Short Term Generation Projects to Improve Supply Situation
AMERI POWER PLANT – Site Preparation of Plant installation
www.vra.com
19
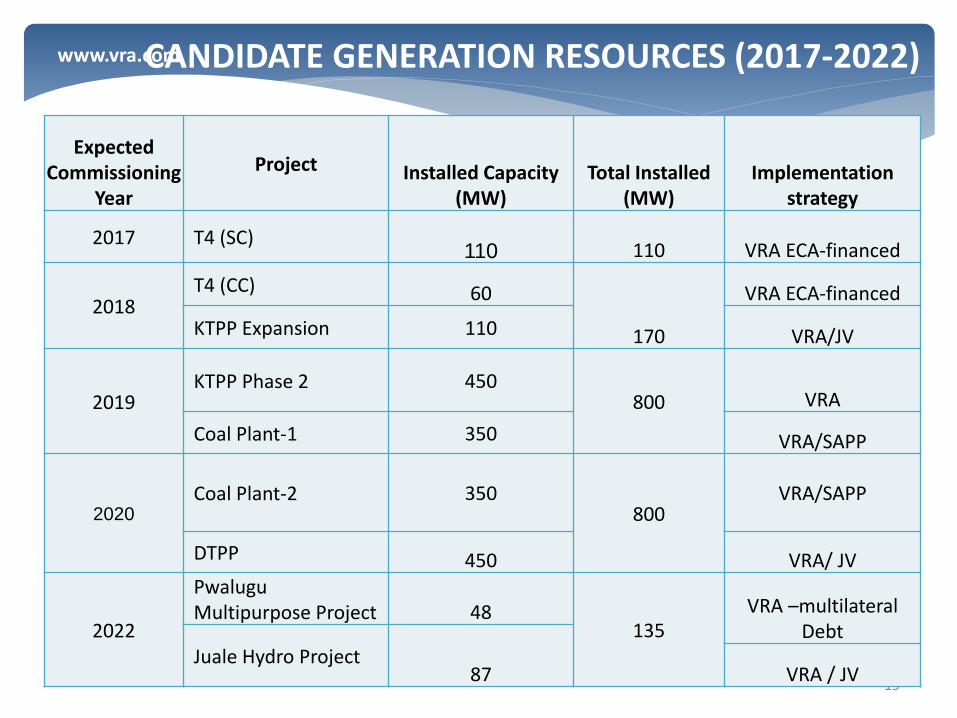
CANDIDATE GENERATION RESOURCES (2017-2022)
Expected Commissioning
Year
Project Installed Capacity (MW)
Total Installed (MW)
Implementation strategy
2017 T4 (SC) 110 110 VRA ECA-financed
2018 T4 (CC) 60
170
VRA ECA-financed
KTPP Expansion 110 VRA/JV
2019 KTPP Phase 2 450
800 VRA
Coal Plant-1 350 VRA/SAPP
2020 Coal Plant-2 350
800
VRA/SAPP
DTPP 450 VRA/ JV
2022
Pwalugu Multipurpose Project 48
135 VRA –multilateral
Debt Juale Hydro Project
87 VRA / JV
www.vra.com
20
CHALLENGES
www.vra.com
21 21
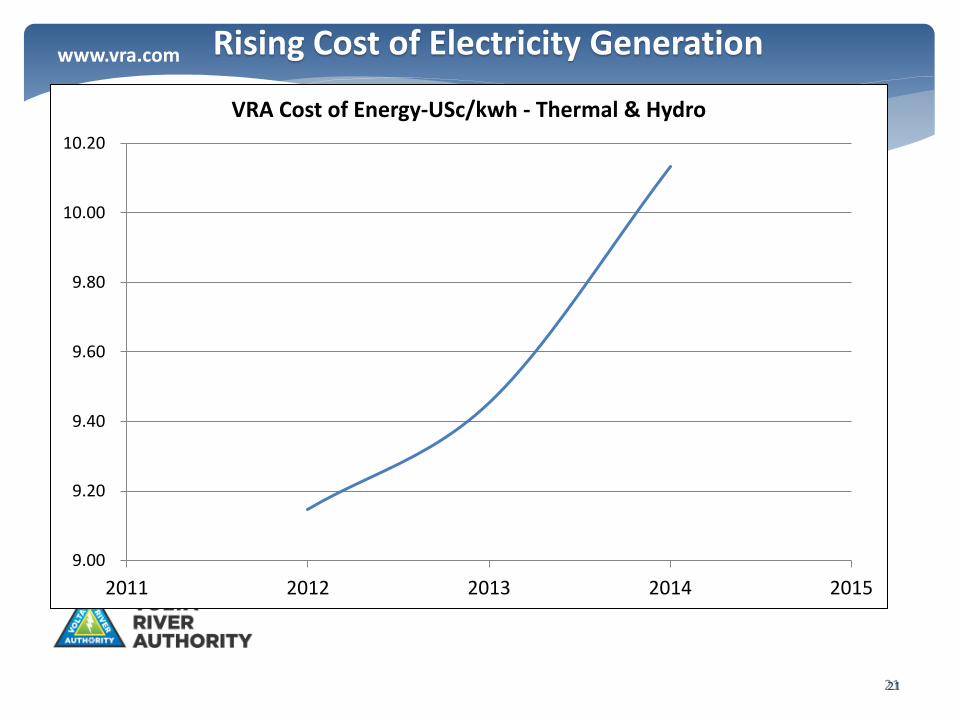
Rising Cost of Electricity Generation
9.00
9.20
9.40
9.60
9.80
10.00
10.20
2011 2012 2013 2014 2015
VRA Cost of Energy-USc/kwh - Thermal & Hydro

www.vra.com
BGT Increases Have Been Marginal In Real Terms Due to Currency Depreciation Despite Regular Adjustments by PURC
0.00
0.02
0.04
0.06
0.08
0.10
0.12
0.14
2007 2008 2009 2010 2011 2012 2013 2014
TariffGHs/kWh
PURC Tariff$/kWh
PURC Approved BGT in GHS
PURC Approved BGT is US$
BGT – Bulk Generation Tariff
www.vra.com
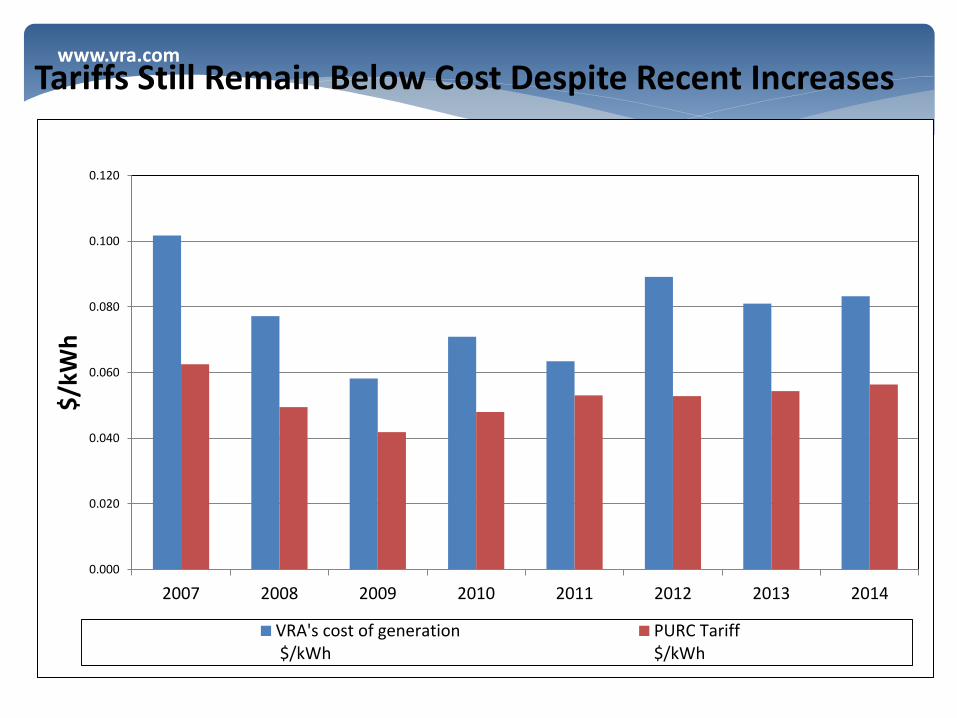
Tariffs Still Remain Below Cost Despite Recent Increases
0.000
0.020
0.040
0.060
0.080
0.100
0.120
2007 2008 2009 2010 2011 2012 2013 2014
$/k
Wh
VRA's cost of generation $/kWh
PURC Tariff$/kWh

www.vra.com NIGERIA GAS SUPPLY
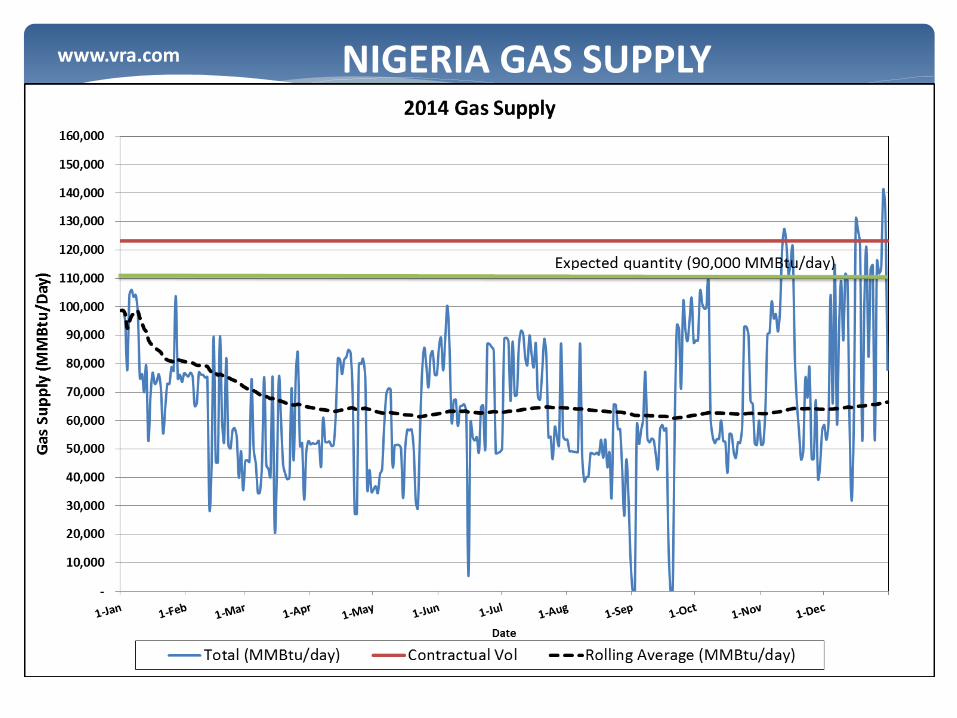
• Low gas supply since beginning of the year.
• Gas supply from Nigeria has always been erratic and 2014 was no exception.
• Discussions are on-going for additional gas supplies with potential gas supplies in Nigeria.
• Considering a proposal from Quantum Power Ghana Gas (QPRGG) to deliver re-gasified LNG to our plants in Tema.
www.vra.com NIGERIA GAS SUPPLY

www.vra.com NIGERIA GAS SUPPLY
www.vra.com GAS SUPPLY FROM GHANA
• Jubilee gas production started late 2014 with frequent interruptions, mainly as a result of unavailability of enough thermal generation units or fault at gas supply facility
• Need for additional gas supplies because of inadequacy of gas supply from Ghana Gas Company & Nigeria to meet the national gas demand

www.vra.com GAS SUPPLY FROM GHANA

www.vra.com
29
0
500,000
1,000,000
1,500,000
2,000,000
2,500,000
3,000,000
Jan-14 Feb-14 Mar-14 Apr-14 May-14 Jun-14 Jul-14 Aug-14 Sep-14 Oct-14 Nov-14 Dec-14
Gas Consumed (2014) - MMBtu(NGAS)
Low Gas Supply Volumes
www.vra.com
30
0
100
200
300
400
500
600
700
800
900
2011 2012 2013 2014 2015 2016 2017 2018 2019 2020
Vo
lum
e o
f G
as (
MM
scf/
Day
)
Year
Total Ghana Demand Total Supply VRA Demand
Deficit
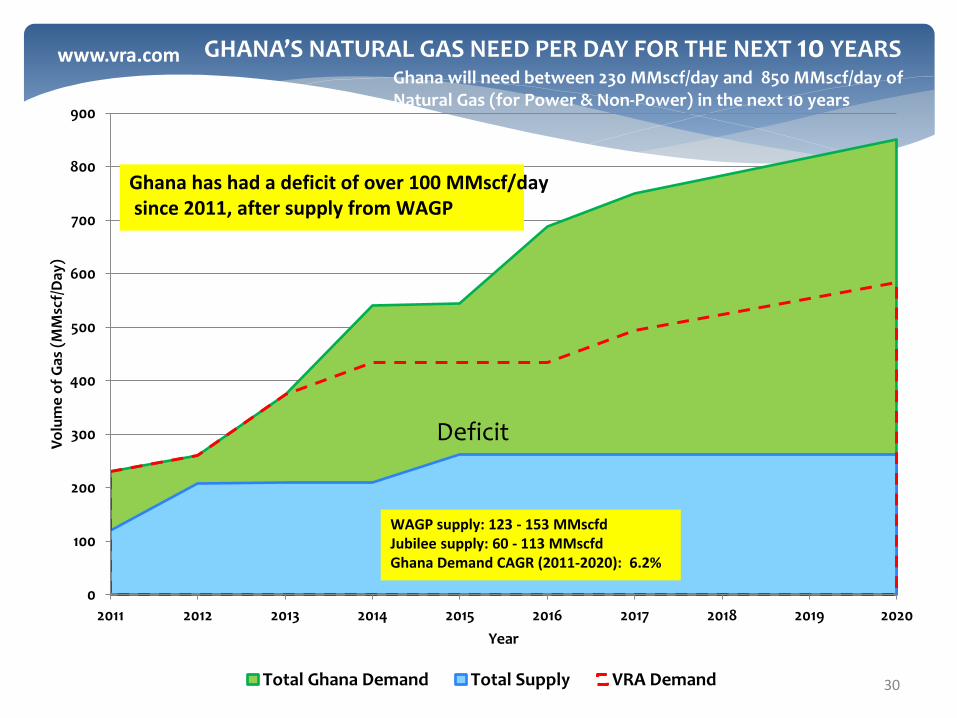
Ghana has had a deficit of over 100 MMscf/day since 2011, after supply from WAGP
WAGP supply: 123 - 153 MMscfd Jubilee supply: 60 - 113 MMscfd Ghana Demand CAGR (2011-2020): 6.2%
GHANA’S NATURAL GAS NEED PER DAY FOR THE NEXT 10 YEARS Ghana will need between 230 MMscf/day and 850 MMscf/day of Natural Gas (for Power & Non-Power) in the next 10 years
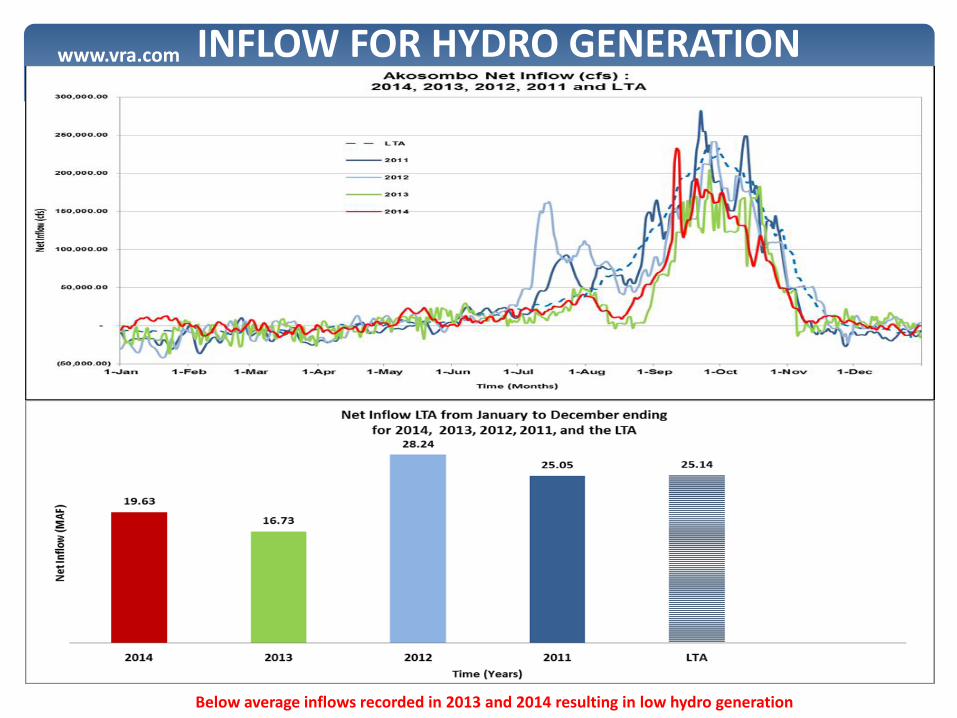
www.vra.com INFLOW FOR HYDRO GENERATION
Below average inflows recorded in 2013 and 2014 resulting in low hydro generation
www.vra.com
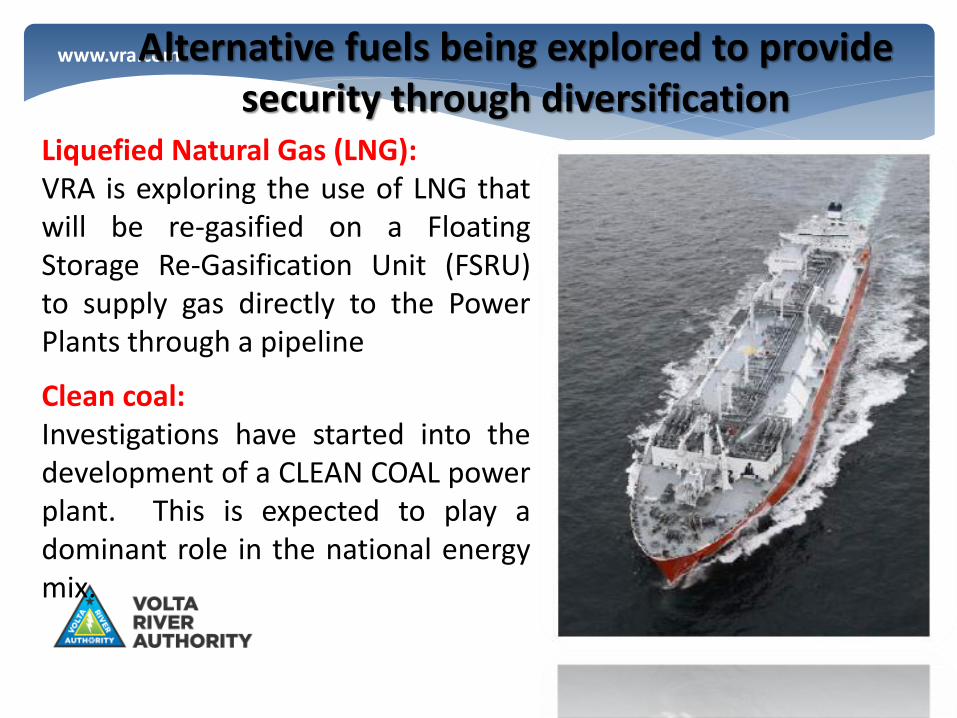
Liquefied Natural Gas (LNG): VRA is exploring the use of LNG that will be re-gasified on a Floating Storage Re-Gasification Unit (FSRU) to supply gas directly to the Power Plants through a pipeline
Clean coal: Investigations have started into the development of a CLEAN COAL power plant. This is expected to play a dominant role in the national energy mix.
Alternative fuels being explored to provide security through diversification
www.vra.com Payment performance of major customers critical to VRA’s financial health
Payment Performance of Major customers
ECG purchases about 65% of the power generated by VRA.
Payments from ECG has been erratic.
VALCO unable to pay fully for power
Weak financial health of the sector the biggest impediment to investment
Situation will improve with arrangement to finance existing ECG receivables
Long term solution needed to improve performance of distribution sector

www.vra.com SUMMARY
• 2014 was a financially challenging year even though we kept open real possibilities for continued growth and development
– No Government subsidy to shortfall in lieu of tariff shortfall.
• Stable supply of gas remains highest priority.
• Regulatory framework to promote sustainable capacity additions also critical.
• Ghana’s geographic position and political and economic stability position must be properly leveraged.
www.vra.com CONCLUSION • 2014 was a financially challenging year even though we kept open real
possibilities for continued growth and development – No Government subsidy to shortfall in lieu of tariff shortfall.
• Stable supply of gas remains highest priority.
• Supply situation to improve as short term generation projects come online
• VRA’s financial health is critical to its ability to raise funding for new projects to meet demand growing at 150-200 MW per year at an estimated cost of US$200-250 million/year
• Regulatory framework to promote sustainable capacity additions is critical. – Full implementation of Automatic Adjustment Formula required to ensure full
cost recovery

www.vra.com
Thank You
36


