
May 11th, 2020
Tokyo Seimitsu Co., Ltd.Earnings Callfor FY2020/3
*Copyright 2020 Tokyo Seimitsu Co., Ltd. (7729) All rights reserved.May 11th, 2020 1

Cautionary Statement with respect to Forward-Looking Statements This presentation data and information verbally provided contain “forward-looking statements”
that are based on current best available information and policies. There are various factors such as world economic conditions and semiconductor/automobile
market conditions which will directly and indirectly impact the Company’s results in the future. As a result, future outcomes may differ from those projected in this presentation.
Wordings and Data in presentation Unless otherwise noted, “SPE” denotes our Semiconductor Production Equipment Business
Segment, “Metrology (or Metr.)” denotes our Metrology Business Segment, “Net profit” denotes Net profit attributable to owner of the parent
Information listed in this presentation is summarized in Billions of Yen (BJPY or B) or percentage except as otherwise noted. As a result, there may be a case where the total of individual amount and total amounts in each matter may differ.
Audit procedure This presentation is not subject to audit procedures.
Copyright 2020 Tokyo Seimitsu Co., Ltd. (7729) All rights reserved.May 11th, 2020 2

Agenda
Business results for FY2020/3 Summary for the 2nd year of mid-term business
targets Outlook and policy for the targets Forecast for FY2021/3 Q&A
Tokyo Seimitsu Co., Ltd.Earnings Call for FY2020/3
Copyright 2020 Tokyo Seimitsu Co., Ltd. (7729) All rights reserved.May 11th, 2020 3

FY2020/3 Business Results
Quarter(BJPY) 1Q 2Q 3Q 4Q 1Q 2Q 3Q 4Q QoQ YoY
Orders 28.2 29.0 24.0 17.7 18.7 19.6 22.5 26.8 +19% +51%Sales 19.8 31.4 23.7 26.6 18.0 24.0 22.2 23.7 +7% -11%Operating profit(Margin)
3.1(16%)
7.1(23%)
4.8(20%)
5.2(20%)
1.8(10%)
3.8(16%)
3.4(15%)
3.3(14%) -2% -36%
Recurring profit 3.4 7.4 4.8 5.2 1.9 3.8 3.4 3.2 -7% -39%Net profit 2.6 5.3 3.5 3.3 1.4 2.9 2.3 0.6 -73% -81%
Full YearResults (BJPY)
FY2019/3 FY2020/3Full Year Full Year Vs.fcst YoY
Orders 98.9 87.6 -11%Sales 101.5 87.9 +1.9 -13%Operating profit(Margin)
20.2(20%)
12.3(14%) +0.3 -39%
Recurring profit 20.8 12.4 +0.3 -41%Net profit 14.7 7.2 -1.8 -51%Dividend per share 125Yen(incl. 20yen anniversary) 76Yen ±0Yen -49Yen
Accounted for extraordinary loss in 4Q mainly from impairment loss, arising from Hino plants’ new factory construction plan
Copyright 2020 Tokyo Seimitsu Co., Ltd. (7729) All rights reserved.May 11th, 2020 4

COVID-19 impactsSPE Segment Metrology Segment
FY2020/3Results
Some push-outs occurred due to lockdown and logistics stagnations
Impact against original plan was minimal Demand itself keeps firm tone
Impact was minimal
Impact on FY2021/3
1H
Anticipate minimum impact, but need to carefully watch any unforeseen impacts from lengthening current situation
Anticipate delay in roll-in of some products due to customers’ factory shutdown
Sales activities
Overseas activities are being handled by regional experts sometimes with remote support
Slight delay in actions due to customer’s factory shutdown
Serviceactivities Generally on-track as scheduled
Offices in Japan
Factory is in normal operation, materials’ shortages can be worked around with compatible ones
Body temperature checks, frequent disinfection, avoiding closed spaces are mandatory
Some employees are in WFHOffices in worldwide
Factories such as in China and Thailand are in normal operation Employees in specific countries are in WFH
Copyright 2020 Tokyo Seimitsu Co., Ltd. (7729) All rights reserved.May 11th, 2020 5
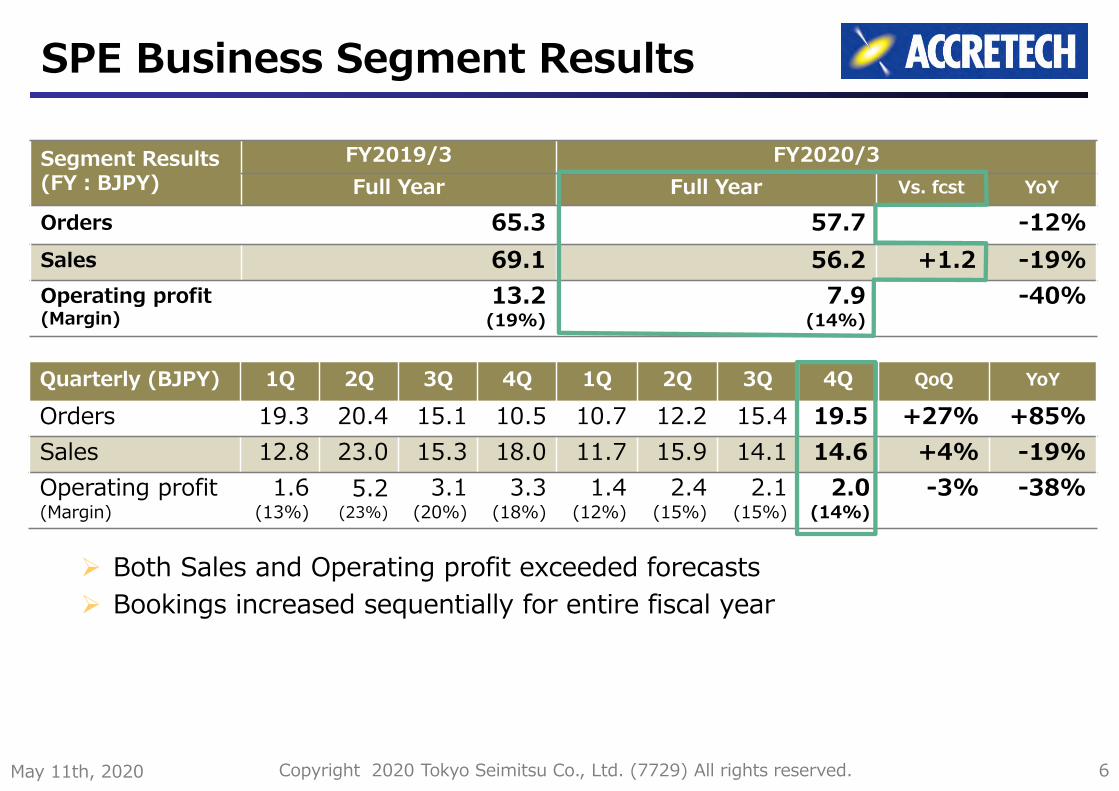
SPE Business Segment Results
Segment Results(FY︓BJPY)
FY2019/3 FY2020/3Full Year Full Year Vs. fcst YoY
Orders 65.3 57.7 -12%Sales 69.1 56.2 +1.2 -19%Operating profit(Margin)
13.2(19%)
7.9(14%)
-40%
Both Sales and Operating profit exceeded forecasts Bookings increased sequentially for entire fiscal year
Quarterly (BJPY) 1Q 2Q 3Q 4Q 1Q 2Q 3Q 4Q QoQ YoY
Orders 19.3 20.4 15.1 10.5 10.7 12.2 15.4 19.5 +27% +85%Sales 12.8 23.0 15.3 18.0 11.7 15.9 14.1 14.6 +4% -19%Operating profit(Margin)
1.6(13%)
5.2(23%)
3.1(20%)
3.3(18%)
1.4(12%)
2.4(15%)
2.1(15%)
2.0(14%)
-3% -38%
Copyright 2020 Tokyo Seimitsu Co., Ltd. (7729) All rights reserved.May 11th, 2020 6

SPE – Sales and OP
4Q Sales exceeded forecast notwithstanding pushouts due to COVID-19
Copyright 2020 Tokyo Seimitsu Co., Ltd. (7729) All rights reserved.May 11th, 2020 7
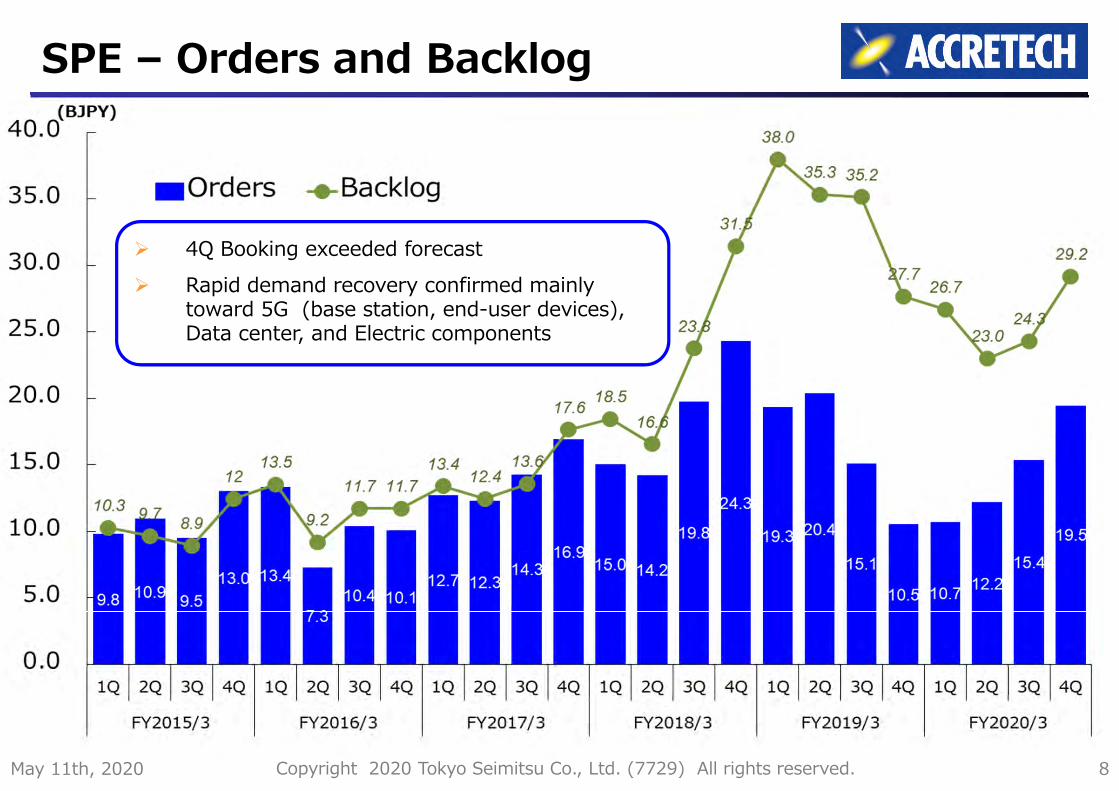
SPE – Orders and Backlog
4Q Booking exceeded forecast Rapid demand recovery confirmed mainly
toward 5G (base station, end-user devices), Data center, and Electric components
Copyright 2020 Tokyo Seimitsu Co., Ltd. (7729) All rights reserved.May 11th, 2020 8

SPE – per ProductSales per Product Orders per Product
Copyright 2020 Tokyo Seimitsu Co., Ltd. (7729) All rights reserved.May 11th, 2020 9
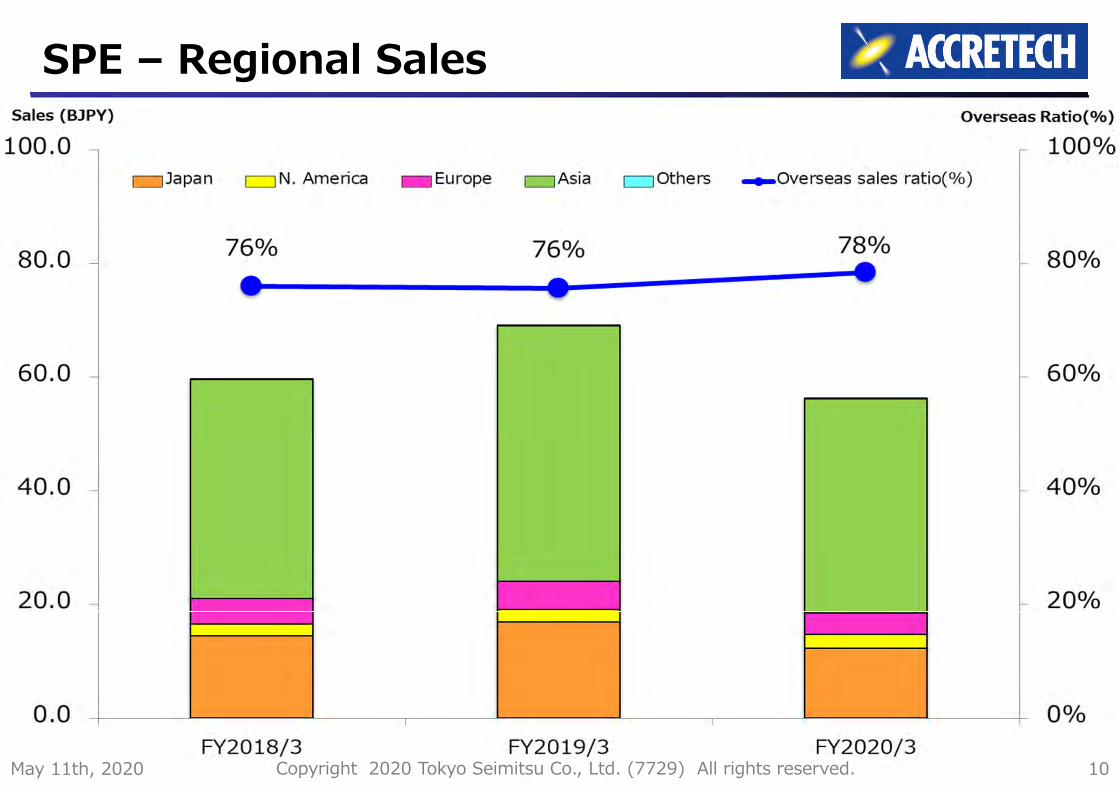
SPE – Regional Sales
Copyright 2020 Tokyo Seimitsu Co., Ltd. (7729) All rights reserved.May 11th, 2020 10

Metrology Instruments Segment
Quarterly (BJPY) 1Q 2Q 3Q 4Q 1Q 2Q 3Q 4Q QoQ YoY
Orders 8.9 8.6 8.9 7.2 8.0 7.4 7.1 7.4 +4% +2%Sales 7.0 8.4 8.4 8.6 6.3 8.2 8.2 9.1 +12% +6%Operating profit(Margin)
1.5(21%)
1.9(23%)
1.7(21%)
1.9(22%)
0.4(7%)
1.4(17%)
1.3(16%)
1.3(14%)
+0% -33%
Segment Results(FY︓BJPY)
FY2019/3 FY2020/3Full Year Full Year Vs. fcst YoY
Orders 33.6 29.9 -11%Sales 32.4 31.7 +0.7 -2%Operating profit(Margin)
7.0(22%)
4.4(14%)
-38%
Sales slightly exceeded forecast but Bookings were below forecast Entire Manufacturing Industries’ demand were stagnant OP decreased due to sales decrease, transient cost at 1Q, and R&D /
renovation cost for Charge / discharge test system dept.
Copyright 2020 Tokyo Seimitsu Co., Ltd. (7729) All rights reserved.May 11th, 2020 11
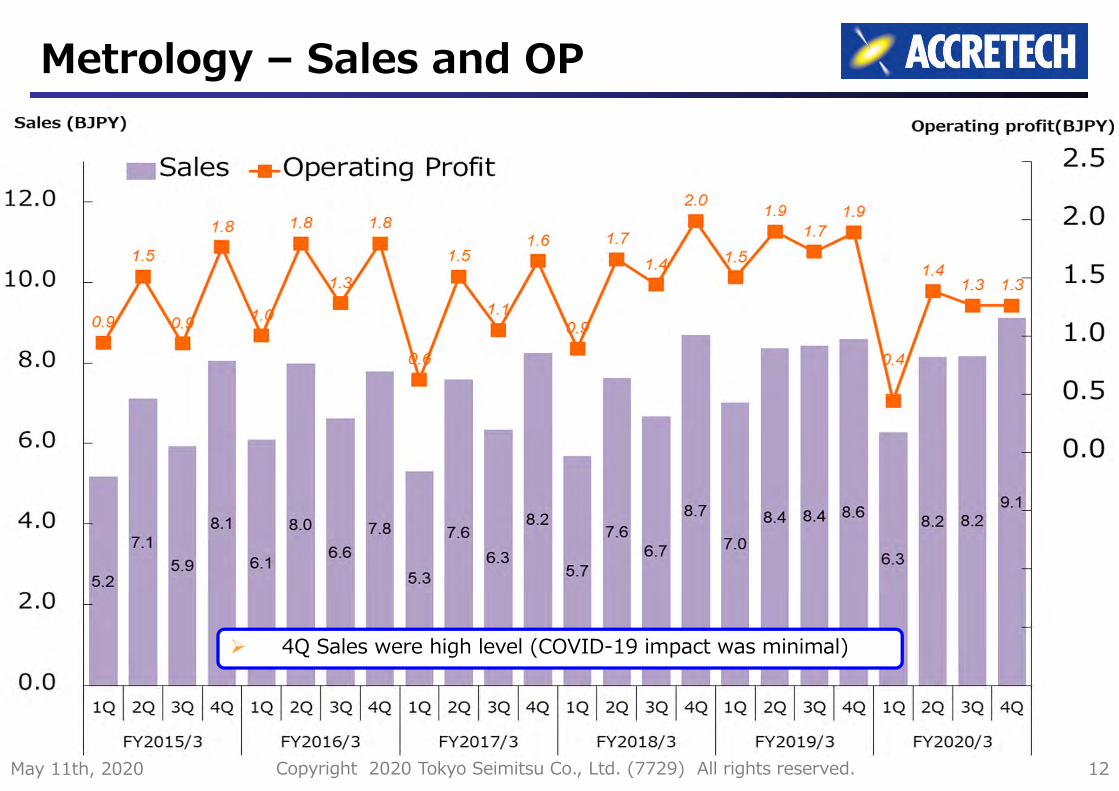
Metrology – Sales and OP
4Q Sales were high level (COVID-19 impact was minimal)
Copyright 2020 Tokyo Seimitsu Co., Ltd. (7729) All rights reserved.May 11th, 2020 12

Metrology – Orders and Backlog
4Q booking was below estimate due to stagnant demands
Copyright 2020 Tokyo Seimitsu Co., Ltd. (7729) All rights reserved.May 11th, 2020 13
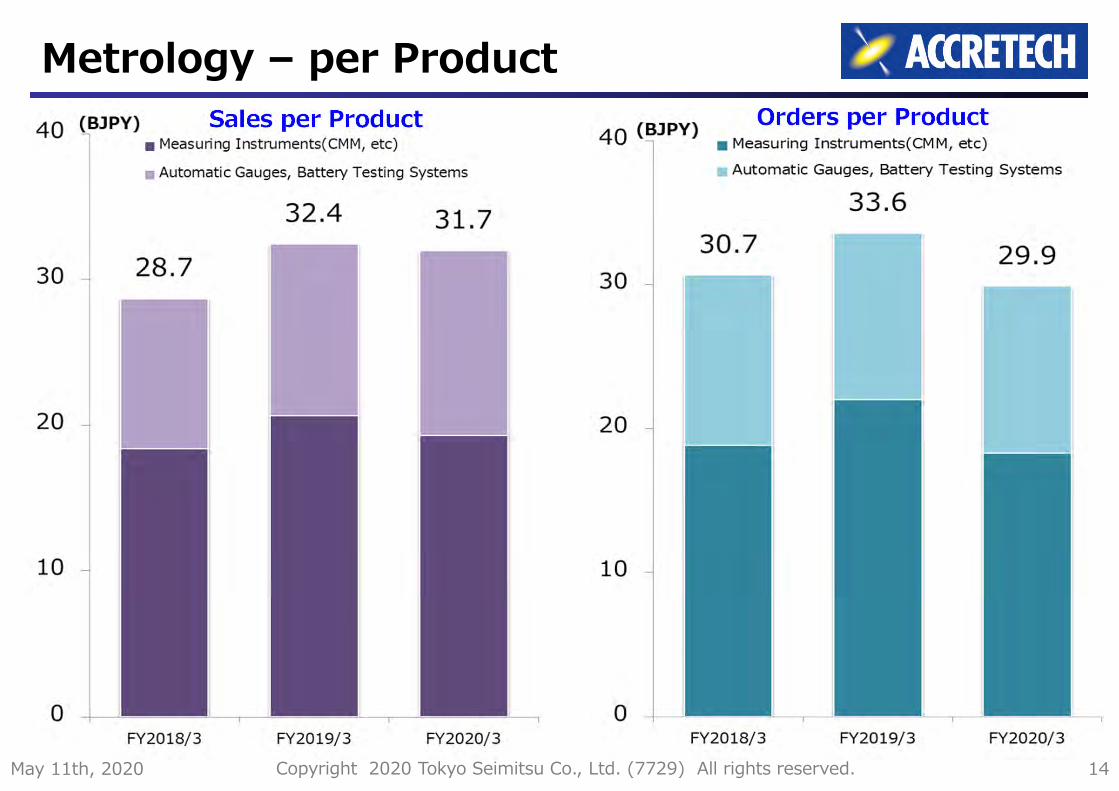
Metrology – per ProductSales per Product Orders per Product
Copyright 2020 Tokyo Seimitsu Co., Ltd. (7729) All rights reserved.May 11th, 2020 14
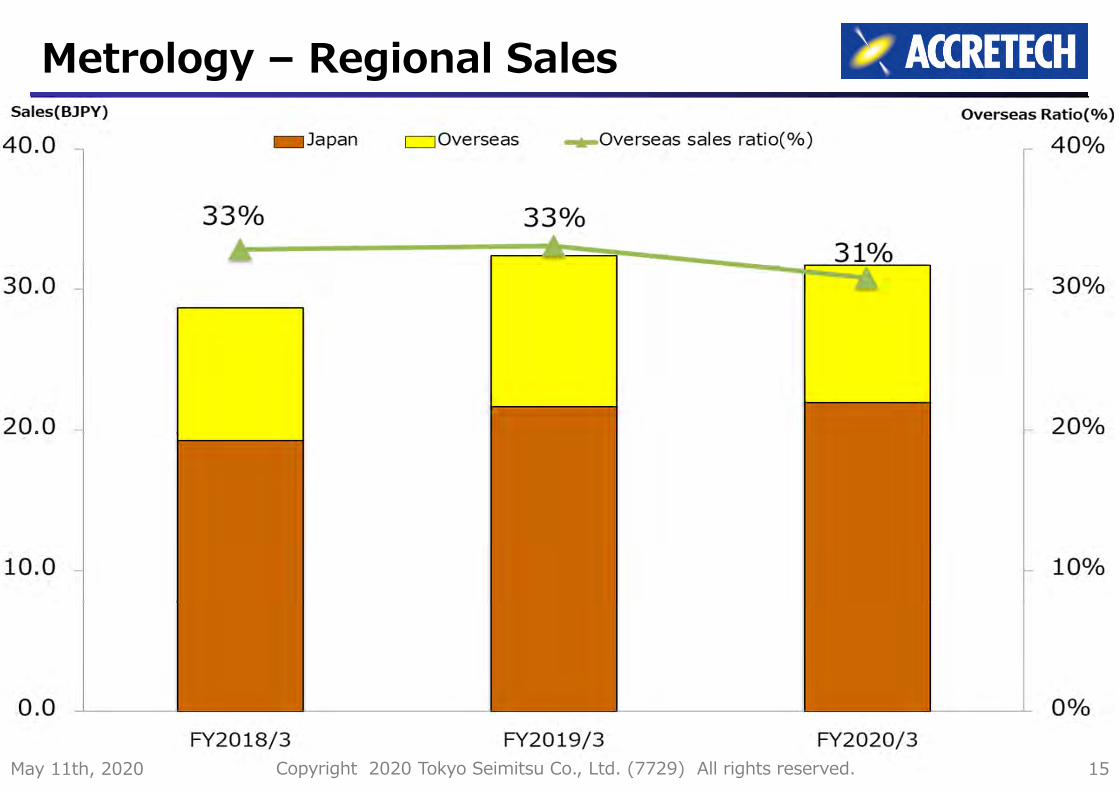
Metrology – Regional Sales
Copyright 2020 Tokyo Seimitsu Co., Ltd. (7729) All rights reserved.May 11th, 2020 15
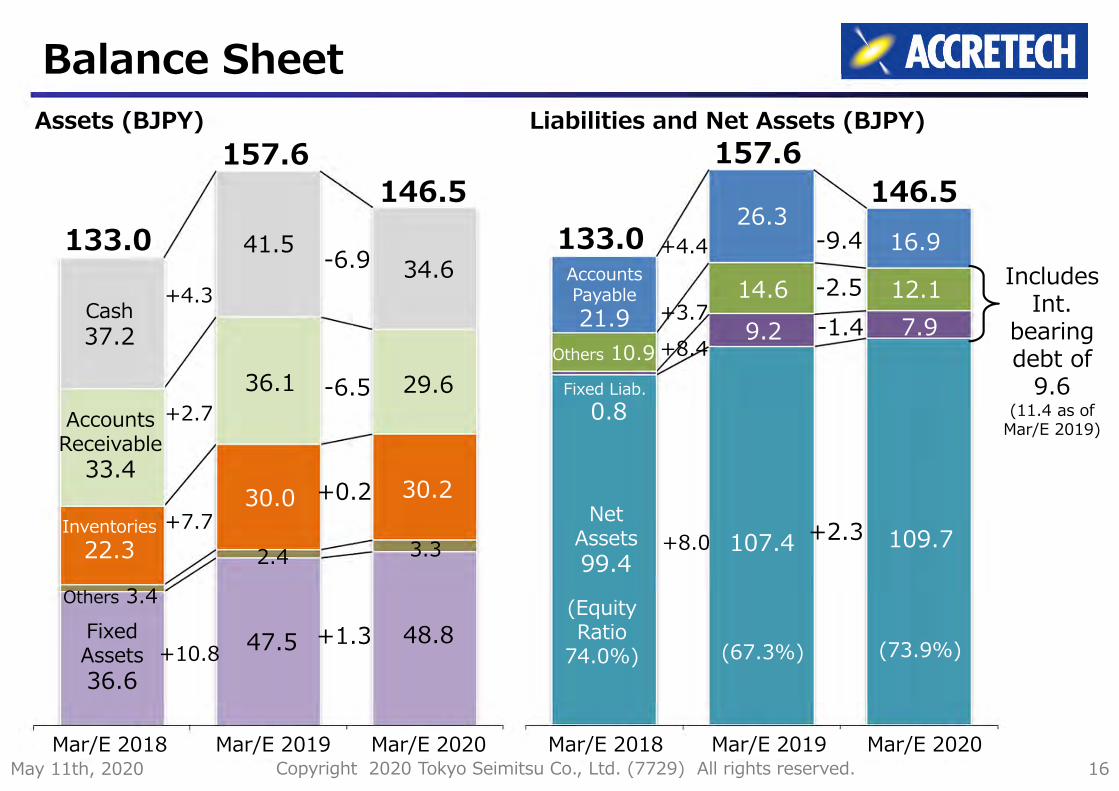
Balance SheetAssets (BJPY)
Includes Int.
bearing debt of
9.6(11.4 as of
Mar/E 2019)
-6.9
-6.5
+0.2
+1.3
-9.4
-2.5
+2.3
-1.4
3.3
7.9
109.7
146.5
34.6
29.6
30.2
48.8
146.516.9
12.1
(73.9%)
41.5
36.1
30.0
47.5
157.6
2.4
Mar/E 2020Mar/E 2018 Mar/E 2019
133.0
Cash37.2
Accounts Receivable
33.4
Inventories22.3
Others 3.4Fixed Assets36.6
+4.3
+2.7
+7.7
+10.8
Mar/E 2020Mar/E 2018 Mar/E 2019
Accounts Payable 21.9
Fixed Liab.0.8
Net Assets 99.4
Others 10.9
(EquityRatio
74.0%)
9.2
107.4
26.3
(67.3%)
14.6
+4.4
+3.7+8.4
+8.0
157.6
133.0
Liabilities and Net Assets (BJPY)
Copyright 2020 Tokyo Seimitsu Co., Ltd. (7729) All rights reserved.May 11th, 2020 16

Cash Flows(CF)
Operating+10.9
Adjustment+0.2
Free Cash Flow(FCF)+6.3
+12.9
-0.2
FCF-1.0
2017年度期首 期末
-6.1
FCF-0.2
-0.2
34.6
(BJPY)
FY2018/3 FY2019/3 FY2020/3Opening BalanceBalance Balance
Cash
Investing-4.6
Financing-3.2
-14.0
+5.4
37.141.3
+6.0
33.8
-6.4
Copyright 2020 Tokyo Seimitsu Co., Ltd. (7729) All rights reserved.May 11th, 2020 17
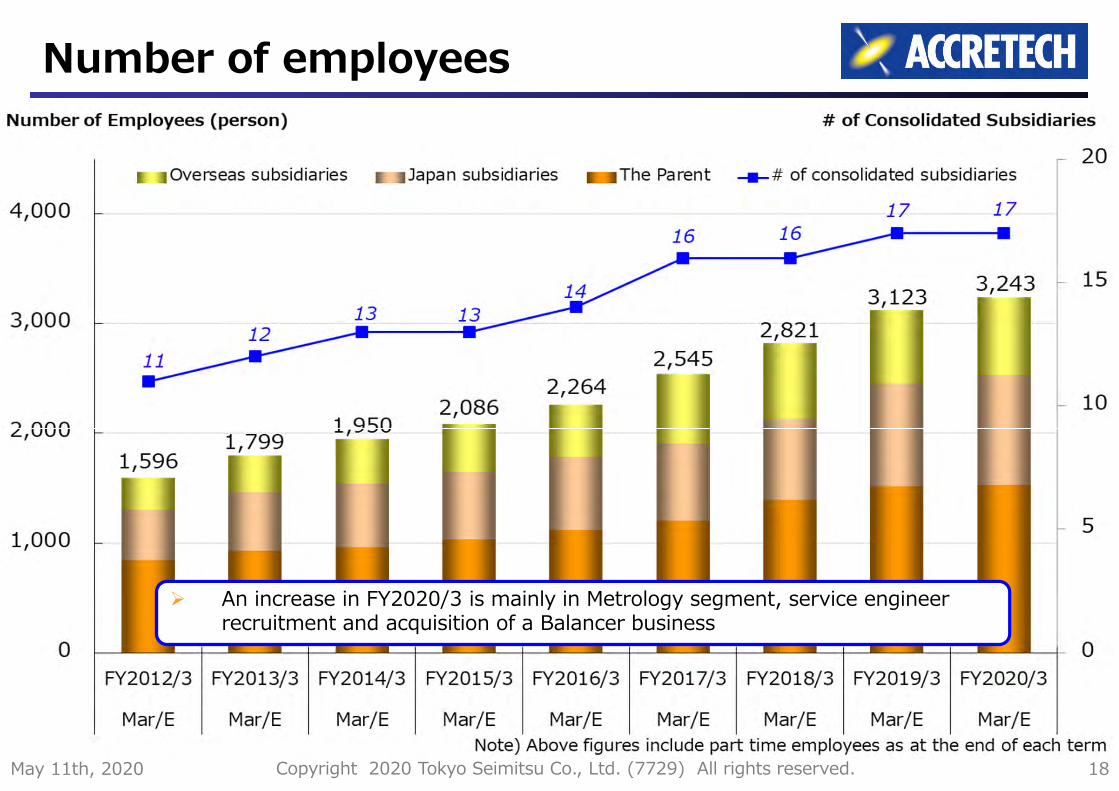
Number of employees
An increase in FY2020/3 is mainly in Metrology segment, service engineer recruitment and acquisition of a Balancer business
Copyright 2020 Tokyo Seimitsu Co., Ltd. (7729) All rights reserved.May 11th, 2020 18

Tokyo Seimitsu Co., Ltd.Earnings Call for FY2020/3
Agenda
Business results for FY2020/3 Summary for the 2nd year of mid-term business target Outlook and policy for the target Forecast for FY2021/3 Q&A
Copyright 2020 Tokyo Seimitsu Co., Ltd. (7729) All rights reserved.May 11th, 2020 19
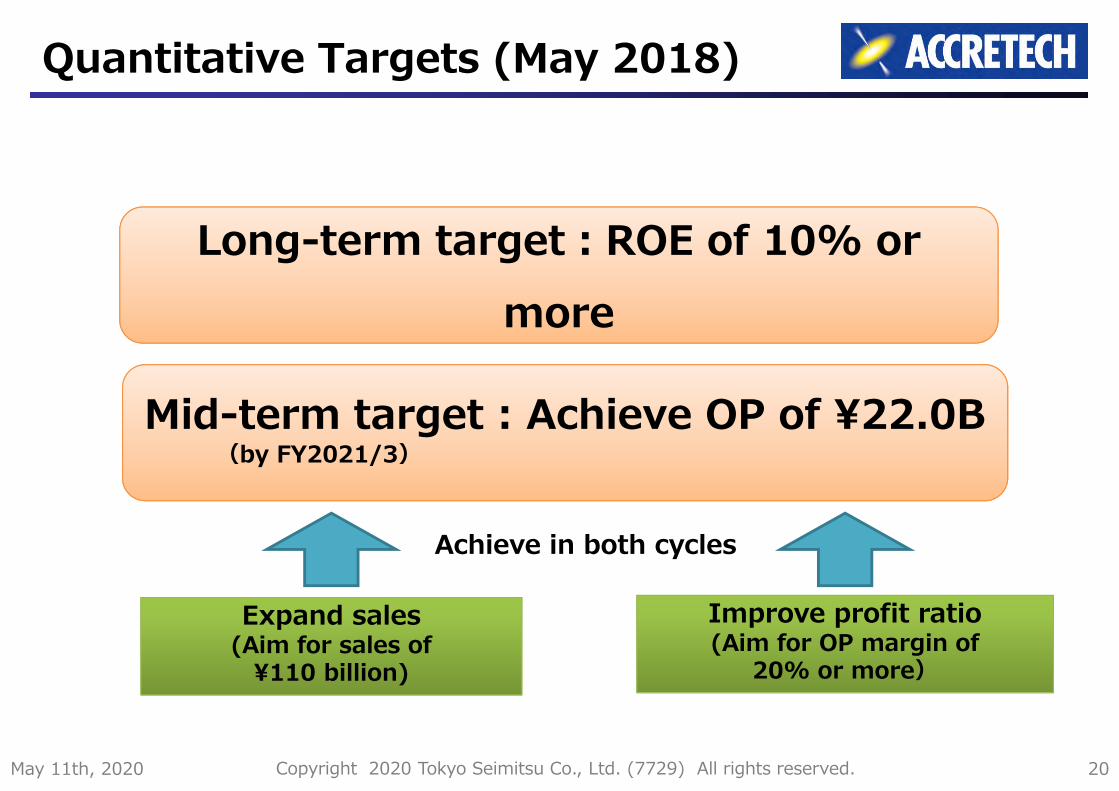
Quantitative Targets (May 2018)
Long-term target︓ROE of 10% or more
Mid-term target : Achieve OP of ¥22.0B (by FY2021/3)
Expand sales(Aim for sales of
¥110 billion)
Achieve in both cycles
Improve profit ratio(Aim for OP margin of
20% or more)
Copyright 2020 Tokyo Seimitsu Co., Ltd. (7729) All rights reserved.May 11th, 2020 20
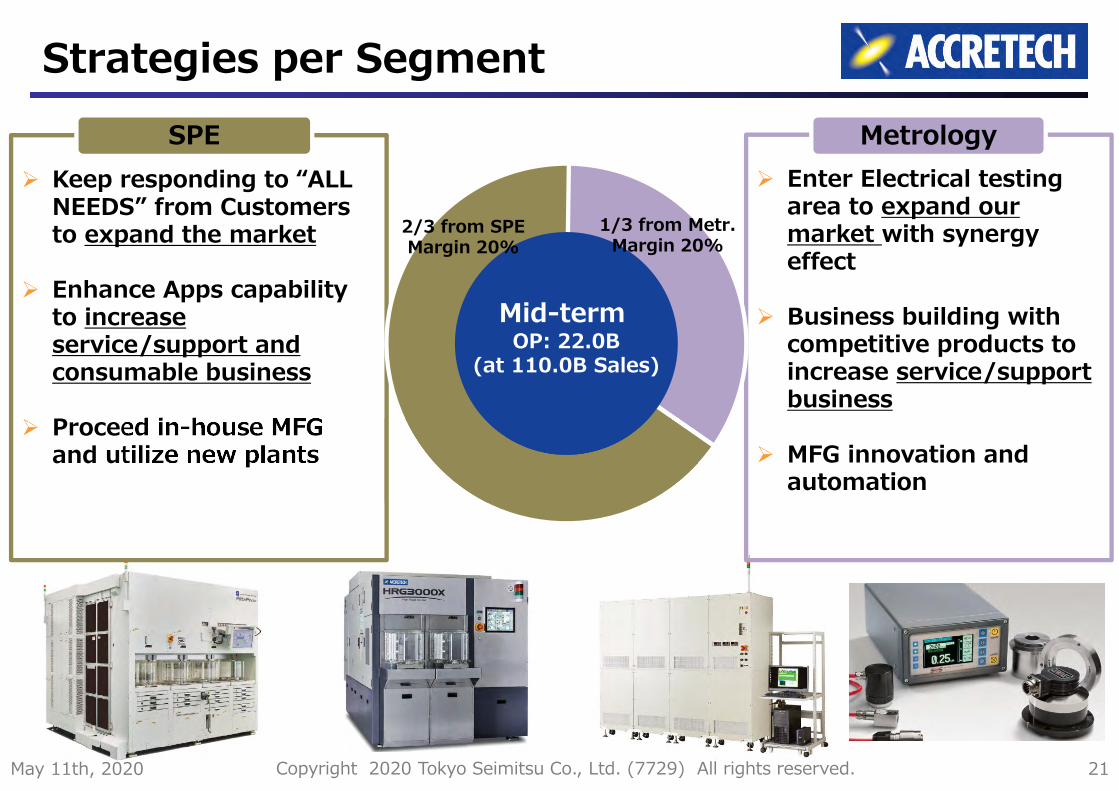
Strategies per Segment
Enter Electrical testing area to expand our market with synergy effect
Business building with competitive products to increase service/support business
MFG innovation and automation
Metrology Keep responding to “ALL
NEEDS” from Customers to expand the market
Enhance Apps capability to increase service/support and consumable business
Proceed in-house MFG and utilize new plants
SPE
Mid-termOP: 22.0B
(at 110.0B Sales)
2/3 from SPEMargin 20%
1/3 from Metr.Margin 20%
Copyright 2020 Tokyo Seimitsu Co., Ltd. (7729) All rights reserved.May 11th, 2020 21

Summary for the 2nd year
Executed the “Preparation” for future growth
Sales/Profit dropped YoY, but Bookings increased
Unveiled new High rigid grinder and Balancer products
Capacity increase in both business segments
ERP in operation, looking ahead of effectiveness improvement
Quantitative
Tech
Production
ProfitRatio
Copyright 2020 Tokyo Seimitsu Co., Ltd. (7729) All rights reserved.May 11th, 2020 22
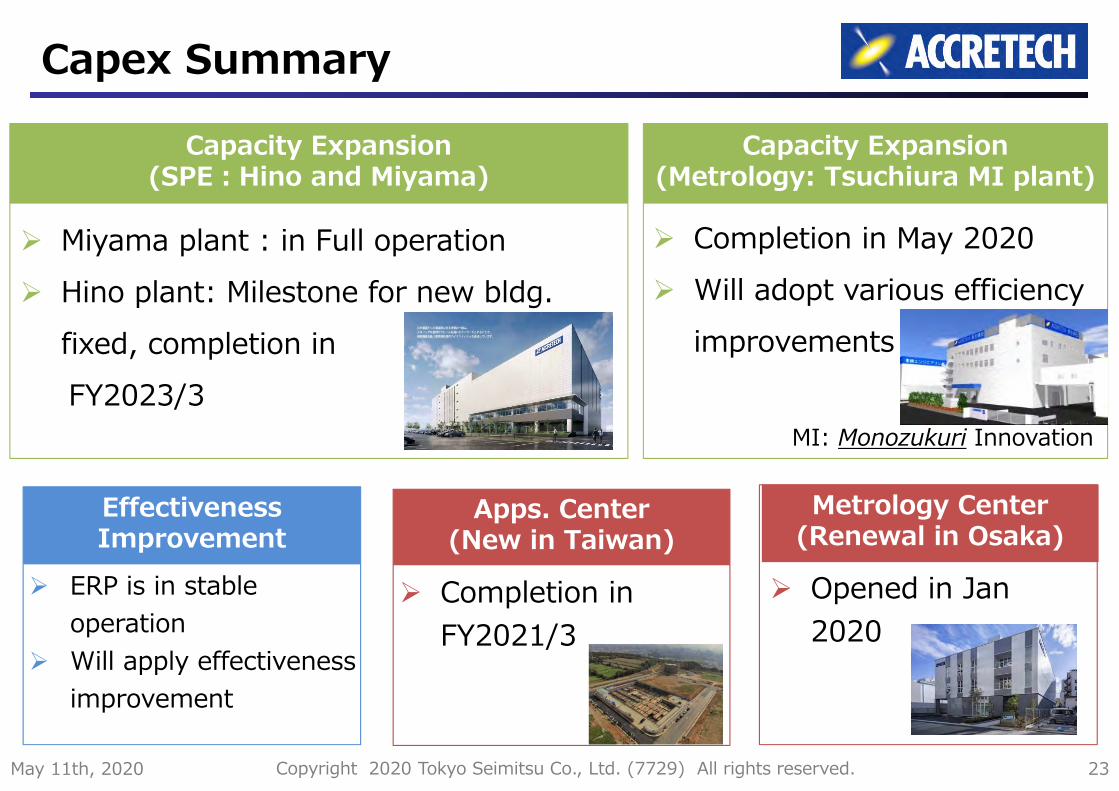
Capex Summary
Capacity Expansion(SPE︓Hino and Miyama)
EffectivenessImprovement
Miyama plant : in Full operation Hino plant: Milestone for new bldg.
fixed, completion in FY2023/3
Completion in May 2020 Will adopt various efficiency
improvements
ERP is in stable operation
Will apply effectiveness improvement
Apps. Center(New in Taiwan)
Completion in FY2021/3
Metrology Center(Renewal in Osaka)
Opened in Jan 2020
MI: Monozukuri Innovation
Capacity Expansion(Metrology: Tsuchiura MI plant)
Copyright 2020 Tokyo Seimitsu Co., Ltd. (7729) All rights reserved.May 11th, 2020 23

Tokyo Seimitsu Co., Ltd.Earnings Call for FY2020/3
Agenda
Business results for FY2020/3 Summary for the 2nd year of mid-term business target Outlook and policy for the target Forecast for FY2021/3 Q&A
Copyright 2020 Tokyo Seimitsu Co., Ltd. (7729) All rights reserved.May 11th, 2020 24

Outlook and policy for mid-term business target
Business conditions in FY2021/3 could vary enormously against against premises Overall︓Economic slowdown by COVID-19 outbreak SPE︓Big growth by 5G is cautiously optimistic Metrology︓Stagnant market and delay in recovery
There are various uncertainties like COVID-19 and US/China trade conflict, however, we are positioned for FY2021/3 as “the year of rapid progress”
Aim for targeting mid-term goals thanks to good semiconductor demand
Investment in both segments for growth will continue
Copyright 2020 Tokyo Seimitsu Co., Ltd. (7729) All rights reserved.May 11th, 2020 25

Corporate Philosophy
「WIN-WINの仕事で世界No.1の商品を創ろう」WIN-WIN relationships create the World’s No. 1 Products「WIN-WINの仕事で世界No.1の商品を創ろう」WIN-WIN relationships create the World’s No. 1 Products
Growing together with partners and customers by collaborating technology, knowledge and
information to create the world’s No.1 products.
Our motto depicting this philosophy;
Our corporate brand ;
Copyright 2020 Tokyo Seimitsu Co., Ltd. (7729) All rights reserved.May 11th, 2020 26

Conceptual Framework andBusiness Portfolio
Conceptual framework
• Strengths:• Precision positioning technology• In-house manufacturing
• Opportunities:• New semiconductor technologies
and devices
• Strengths:• Precision positioning technology• In-house manufacturing
• Opportunities:• New semiconductor technologies
and devices
SPE
• Strengths:• Precision, high-resolution
measuring technology • Reliability
• Opportunities:• New products and demand from
overseas
• Strengths:• Precision, high-resolution
measuring technology • Reliability
• Opportunities:• New products and demand from
overseas
Metrology
• Well-balanced business portfolio- Enables stable business performance
through offsetting demand fluctuations across variable sector trends
Business portfolio analysis
Increase in profit and enterprise
value
Investment for growth
Strong financial position
CSR and group governance
Copyright 2020 Tokyo Seimitsu Co., Ltd. (7729) All rights reserved.May 11th, 2020 27

Corporate strategyTechnology
Strengthen product competitiveness, Expand target markets
Production
Expand production capacity Effectiveness improvement
Profit ratio improvement
Promote information sharingSales expansion of service and consumables
For sustainable growth
Actively promote ESG activities to improve corporate value
Achievement of Mid-term goal
Copyright 2020 Tokyo Seimitsu Co., Ltd. (7729) All rights reserved.May 11th, 2020 28

R&D, Capex and Depreciation
R&D
Capex︓
Depreciation:
To strengthen and maintain competitiveness but R&D/Sales ratio to be less than 10%
To materialize the growth strategy, increase from over 20.0BJPY throughout this mid-term FY2021/3 Capex is mainly for Hino
plant and Apps center
Anticipate slight increase after FY2021/3
Copyright 2020 Tokyo Seimitsu Co., Ltd. (7729) All rights reserved.May 11th, 2020 29
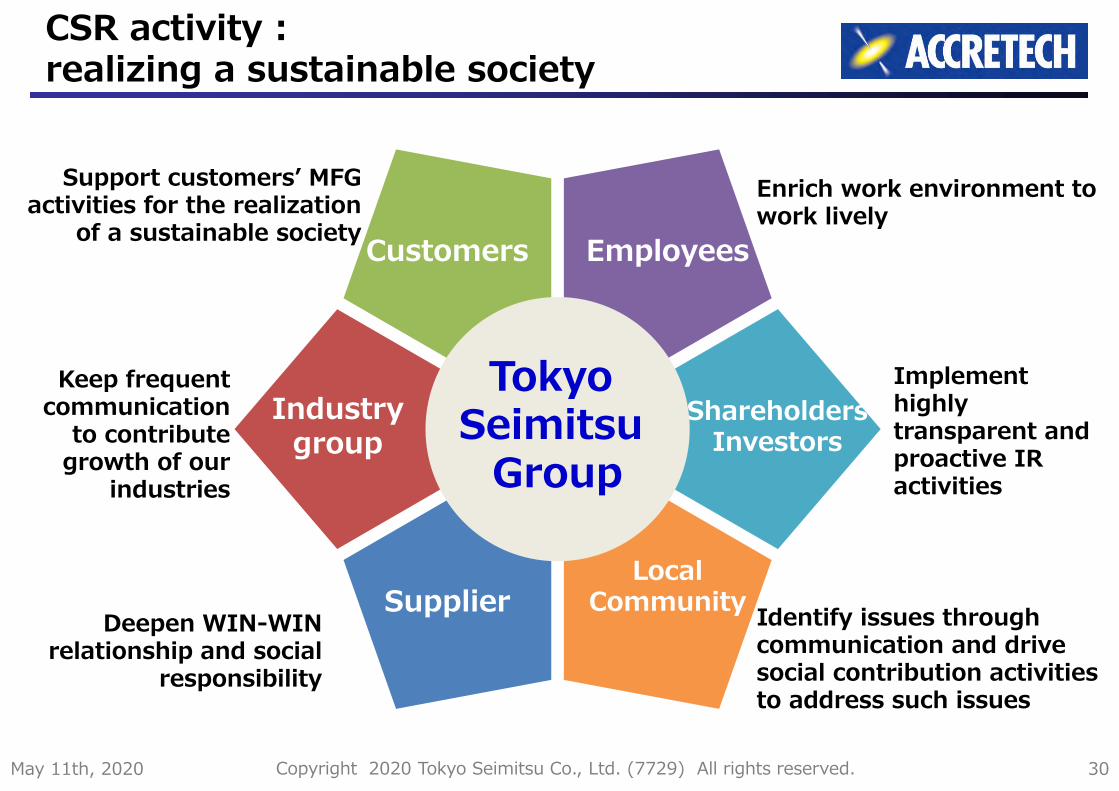
Enrich work environment to work lively
Support customers’ MFG activities for the realization
of a sustainable society
Deepen WIN-WIN relationship and social
responsibility
Identify issues through communication and drive social contribution activities to address such issues
Customers Employees
ShareholdersInvestors
Industrygroup
SupplierLocal
Community
Tokyo Seimitsu
Group
Implement highly transparent and proactive IR activities
CSR activity : realizing a sustainable society
Keep frequent communication
to contribute growth of our
industries
Copyright 2020 Tokyo Seimitsu Co., Ltd. (7729) All rights reserved.May 11th, 2020 30

ESG activities
• Eco-friendly products︓Considering LCA at product development
• Global warming prevention︓Utilize low-carbon power to reduce CO2 emissions
• Resource reduction : Reduce Water/Paper consumption, improve recycling ratio
Environment
• Improve working environments: Healthy Company Declaration
• Quality/Safety: QMS Managements, Safety trainings
• Supply chain : CSR activities among all stakeholders
Social
• Compliance: Enhance compliance systems
• Risk Management : Strengthen BCP (Business continuity plan)
Governance
LCA : Life Cycle Assessment
The group will promote these actions in FY2021/3 and beyondCopyright 2020 Tokyo Seimitsu Co., Ltd. (7729) All rights reserved.May 11th, 2020 31
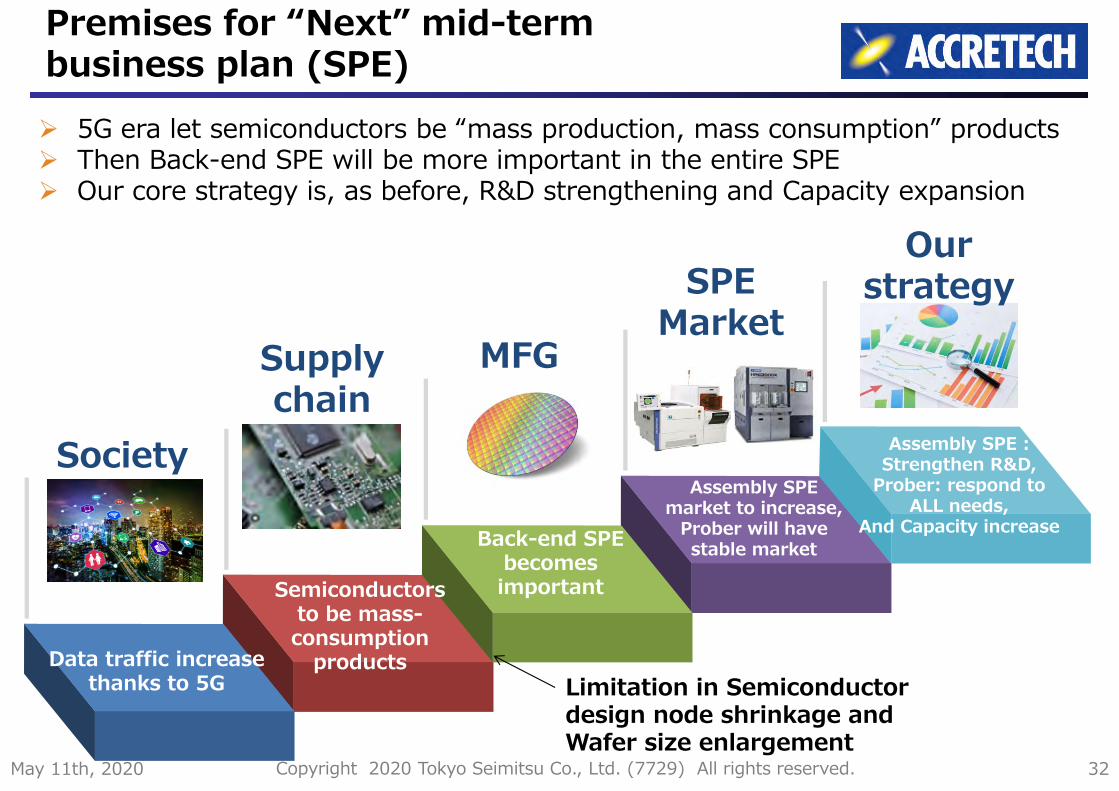
Society
Supply chain
MFG
SPE Market
Our strategy
5G era let semiconductors be “mass production, mass consumption” products Then Back-end SPE will be more important in the entire SPE Our core strategy is, as before, R&D strengthening and Capacity expansion
Premises for “Next” mid-term business plan (SPE)
Data traffic increase thanks to 5G
Semiconductors to be mass-consumption
products
Back-end SPEbecomes important
Assembly SPE market to increase,
Prober will have stable market
Assembly SPE : Strengthen R&D,
Prober: respond to ALL needs,
And Capacity increase
Limitation in Semiconductor design node shrinkage and Wafer size enlargement
Copyright 2020 Tokyo Seimitsu Co., Ltd. (7729) All rights reserved.May 11th, 2020 32

ICE measuring demand to be gradually decreased due to NEV increase Instead, IoT and NEV Battery/Motor measuring demand will rapidly grow Our core strategy is expanding product lineup & industries entered and
increasing overseas sales
Premises for “Next” mid-termbusiness plan (Metrology)
新規開拓市場
Overseas salesFocus on EU and emerging
country with expanding product portfolio
Existing Automobile marketSynergy effect by SBS Balancer
Stab
le I
ndus
try
Gro
win
g in
dust
ry
NEVバッテリ測定NEV Battery testingContinue R&D for Charge/
Discharge testing systems and realize profitable structure
Automobile Non-automobile
Automation demandStrengthen SW development
Aircraft/MedicalSearch for potential
customers
SemiconductorCommonly build-up new best measuring methods
Copyright 2020 Tokyo Seimitsu Co., Ltd. (7729) All rights reserved.May 11th, 2020 33
Tokyo Seimitsu Co., Ltd.Earnings Call for FY2020/3
Agenda
Business results for FY2020/3 Summary for the 2nd year of mid-term business target Outlook and policy for the target Forecast for FY2021/3 Q&A
Copyright 2020 Tokyo Seimitsu Co., Ltd. (7729) All rights reserved.May 11th, 2020 34

Premises of FY2021/3 Forecasts
• Firm 5G demands but carefully watch the situation• Proceed with planned R&D and Capex for uptrend
SPE
Metrology• Recovery in Manufacturing industry will be delayed• Focus on Semiconductor, NEV, and Medical industry
Overall• Too difficult to estimate 2H performance because it is uncertain when COVID-19 outbreak will be stamped out
Copyright 2020 Tokyo Seimitsu Co., Ltd. (7729) All rights reserved.May 11th, 2020 35

FY2021/3 ForecastConsolidated Results and forecasts (BJPY)
FY2020/3 FY2021/3
1H 2H FY 1H(f) YoY
Sales 42.0 45.9 87.9 47.0 +12%Operating profit(Margin)
5.6(13%)
6.7(15%)
12.3(14%)
7.6(16%)
+36%
Recurring profit 5.7 6.6 12.4 7.6 +32%Net profit 4.3 2.9 7.2 5.6 +31%Dividend per share 76 Yen Will be issued
Orders 22.9 34.3 57.2Sales 27.6 28.6 56.2 35.5 +29%
(SPE)
Orders 15.4 14.1 29.5Sales 14.4 17.3 31.7 11.5 -20%
(Metr.)
FY2021/3 Full Year Forecast, Annual dividend per share will be issued as soon as it becomes possible.
Per Segment
Copyright 2020 Tokyo Seimitsu Co., Ltd. (7729) All rights reserved.May 11th, 2020 36

SPE – Sales/Orders incl. Forecasts
Orders for FY2021/3 1H will remain high but down HoH
Copyright 2020 Tokyo Seimitsu Co., Ltd. (7729) All rights reserved.May 11th, 2020 37

Metrology – Sales/Orders incl. Forecasts
Estimate FY2021/3 booking to be 10% down HoH Expect recovery in FY2021/3 2H
Copyright 2020 Tokyo Seimitsu Co., Ltd. (7729) All rights reserved.May 11th, 2020 38

Tokyo Seimitsu Co., Ltd.Earnings Call for FY2020/3
Agenda
Business results for FY2020/3 Summary for the 2nd year of mid-term business target Outlook and policy for the target Forecast for FY2021/3 Q&A
Copyright 2020 Tokyo Seimitsu Co., Ltd. (7729) All rights reserved.May 11th, 2020 39

https://www.accretech.jp/https://ir.accretech.jp/ja/index.html
Copyright 2020 Tokyo Seimitsu Co., Ltd. (7729) All rights reserved.May 11th, 2020 40

Supplementary Data
Copyright 2020 Tokyo Seimitsu Co., Ltd. (7729) All rights reserved.May 11th, 2020 41

Segment Information
(BJPY)
Fiscal Year Quarter
FY2017/3 FY2018/3 FY2019/3 FY2020/3FY2019/3 FY2020/3
1Q 2Q 3Q 4Q 1Q 2Q 3Q 4Q
Orders
SPE 56.232 73.327 65.335 57.709 19.339 20.360 15.120 10.515 10.694 12.177 15.375 19.462
Metr. 27.254 30.651 33.573 29.866 8.859 8.621 8.880 7.212 7.974 7.446 7.086 7.359
Total 83.487 103.979 98.909 87.576 28.199 28.981 24.000 17.727 18.668 19.624 22.461 26.821
Backlog
SPE 17.647 31.452 27.670 29.182 37.969 35.333 35.152 27.670 26.689 22.991 24.303 29.182
Metr. 6.015 7.996 9.165 7.782 9.837 10.100 10.555 9.165 11.333 10.623 9.538 7.782
Total 23.663 39.448 36.836 36.965 47.806 45.434 45.707 36.836 38.022 33.615 33.842 36.965
Sales
SPE 50.291 59.523 69.117 56.198 12.822 22.996 15.301 17.996 11.676 15.874 14.063 14.583
Metr. 27.501 28.671 32.403 31.728 7.018 8.357 8.426 8.601 6.285 8.157 8.170 9.115
Total 77.792 88.194 101.520 87.927 19.841 31.353 23.727 26.598 17.962 24.031 22.233 23.698
OP
SPE 8.820 11.292 13.195 7.915 1.630 5.215 3.053 3.296 1.358 2.399 2.111 2.046
Metr. 4.839 5.990 7.025 4.366 1.503 1.901 1.727 1.893 0.443 1.387 1.265 1.270
Total 13.659 17.283 20.221 12.282 3.134 7.116 4.780 5.190 1.802 3.786 3.376 3.317
OP
Margin
SPE 17.5% 19.0% 19.1% 14.1% 12.7% 22.7% 20.0% 18.3% 11,6% 15.1% 15.0% 14.0%
Metr. 17.6% 20.9% 21.7% 13.8% 21.4% 22.8% 20.5% 22.0% 7.1% 17.0% 15.5% 13.9%
Total 17.6% 19.6% 19.9% 14.0% 15.8% 22.7% 20.1% 19.5% 10.0% 15.8% 15.2% 14.0%
Copyright 2020 Tokyo Seimitsu Co., Ltd. (7729) All rights reserved.May 11th, 2020 42

Statements of Income(BJPY)
Fiscal Year Quarter
FY2017/3 FY2018/3 FY2019/3 FY2020/3FY2019/3 FY2020/3
1Q 2Q 3Q 4Q 1Q 2Q 3Q 4Q
Net Sales 77.792 88.194 101.520 87.927 19.841 31.353 23.727 26.598 17.962 24.031 22.233 23.698
Cost of goods sold 48.152 53.818 60.430 53.452 11.933 18.926 13.614 15.954 10.862 14.687 13.357 14.544
Gross Profit on Sales 29.640 34.375 41.090 34.474 7.907 12.426 10.112 10.644 7.100 9.344 8.876 9.154
Selling, general and administrative expenses 15.981 17.092 20.869 22.192 4.773 5.309 5.331 5.454 5.297 5.557 5.499 5.387
Operating profit 13.659 17.283 20.221 12.282 3.134 7.116 4.780 5.190 1.802 3.786 3.376 3.317
Non-operating income 0.318 0.170 0.688 0.255 0.235 0.303 0.029 0.121 0.131 0.078 0.102 -0.057
Non-operating expenses 0.112 0.138 0.104 0.176 0.014 0.008 0.011 0.069 0.038 0.018 0.051 0.067
Recurring Profit 13.864 17.316 20.805 12.361 3.354 7.411 4.798 5.241 1.895 3.846 3.426 3.192
Extraordinary gains 0.583 0.004 0.058 0.057 0.002 - - 0.055 0.002 0.010 0.043 0.001
Extraordinary losses 0.032 0.002 0.419 1.712 - - - 0.419 - - 0.042 1.669
Profit before income taxes and minority interests 14.415 17.318 20.443 10.706 3.357 7.411 4.798 4.877 1.897 3.856 3.427 1.524
Total Income tax and others 4.464 4.542 5.719 3.598 0.790 2.056 1.290 1.582 0.505 1.009 1.153 0.930
Net Profit attributable to Owners of the Parent 9.909 12.717 14.665 7.157 2.551 5.340 3.484 3.288 1.402 2.859 2.281 0.614
Net Profit per Share(Yen) 239.32 306.41 352.92 171.92 61.43 128.52 83.84 79.12 33.70 68.69 54.80 14.73
Net Profit per Share(diluted) (Yen) 237.80 304.02 350.23 170.74 - - - - - - - -
Copyright 2020 Tokyo Seimitsu Co., Ltd. (7729) All rights reserved.May 11th, 2020 43

Balance Sheet(BJPY) FY2017/3 FY2018/3 FY2019/3 FY2020/3
CurrentAssets
Cash and cash equivalents 33.853 37.220 41.518 34.640
Accounts Receivable ※1 28.409 33.439 36.146 29.633
Inventories 17.313 22.325 29.995 30.152
Others 3.215 3.364 2.434 3.345
Total 82.792 96.349 110.094 97.771
Total Fixed Assets 31.670 36.645 47.478 48.777
Total Assets 114.463 132.995 157.573 146.549
Current
Liabilities
Accounts Payable※2 15.789 21.870 26.328 16.895
Others 10.781 10.936 14.620 12.121
Total 26.570 32.807 40.948 29.017
Total long-term liabilities 0.698 0.833 9.220 7.857
Total Liabilities 27.269 33.640 50.169 36.874
Total Net Assets 87.194 99.354 107.403 109.674
Total Liabilities and Net Assets 114.463 132.995 157.573 146.549
Total interest-bearing debt 1.332 1.351 11.415 9.641
Equity Ratio(%) 75.5% 74.0% 67.3% 73.9%
ROE(%) 12.0% 13.8% 14.4% 6.7%
※1: Incl. Electronically recorded monetary claims ※2: Incl. Electronically recorded obligations-operating
Copyright 2020 Tokyo Seimitsu Co., Ltd. (7729) All rights reserved.May 11th, 2020 44
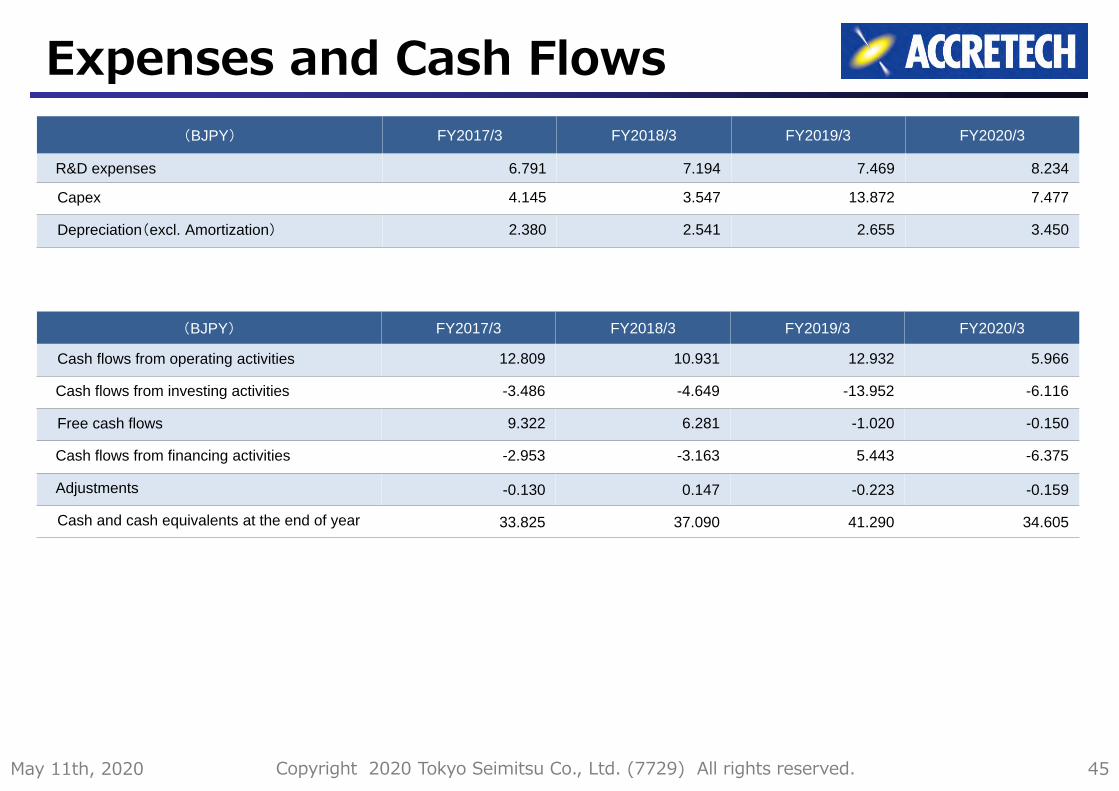
Expenses and Cash Flows(BJPY) FY2017/3 FY2018/3 FY2019/3 FY2020/3
R&D expenses 6.791 7.194 7.469 8.234
Capex 4.145 3.547 13.872 7.477
Depreciation(excl. Amortization) 2.380 2.541 2.655 3.450
(BJPY) FY2017/3 FY2018/3 FY2019/3 FY2020/3
Cash flows from operating activities 12.809 10.931 12.932 5.966
Cash flows from investing activities -3.486 -4.649 -13.952 -6.116
Free cash flows 9.322 6.281 -1.020 -0.150
Cash flows from financing activities -2.953 -3.163 5.443 -6.375
Adjustments -0.130 0.147 -0.223 -0.159
Cash and cash equivalents at the end of year 33.825 37.090 41.290 34.605
Copyright 2020 Tokyo Seimitsu Co., Ltd. (7729) All rights reserved.May 11th, 2020 45


