

Mécanisme de Soutien à la Gestion Intégrée Durable de l'Eau (SWIM- SM) Projet financé par l'Union européenne
TOOLBOX OF
GRAPHIC AND NUMERIC MODELS FOR ESTIMATING COSTS OF SEAWATER REVERSE OSMOSIS DESALINATION PROJECTS
JUNE 2013

Mécanisme de Soutien à la Gestion Intégrée Durable de l'Eau (SWIM- SM) Projet financé par l'Union européenne
TOOLBOX OFGRAPHIC AND NUMERIC MODELS FOR ESTIMATING COSTS OF SEAWATER REVERSE
OSMOSIS DESALINATION PROJECTS
2
Table of Contents
TABLE OF CONTENTS ...............................................................................................2
LIST OF ACRONYMS .................................................................................................4
1 EXECUTIVE SUMMARY ......................................................................................5
1.1 Introduction...................................................................................................................... 5
1.2 Intended Users ................................................................................................................. 5
1.3 Purpose............................................................................................................................. 5
1.4 Applicability ...................................................................................................................... 5
1.5 Limitation of the Use of the Toolbox ............................................................................... 5
2 PROJECT COST ESTIMATING OVERVIEW ............................................................6
2.1 Introduction...................................................................................................................... 6
2.2 Project Cost Definitions .................................................................................................... 6
2.3 Capital Costs ..................................................................................................................... 7
2.4 Operation and Maintenance Costs .................................................................................. 7
2.5 Cost of Water ................................................................................................................... 8
3 CAPITAL COSTS ..................................................................................................9
3.1 Desalination Costs – Economy of Scale .......................................................................... 11
3.2 Desalination Plant Site Requirements ............................................................................ 12
3.3 Capital Costs of Intakes .................................................................................................. 12
3.4 Intake Screen Costs ........................................................................................................ 16
3.5 Intake Pump Station Costs ............................................................................................. 20
3.7 Lamella and DAF Costs ................................................................................................... 21
3.8 Granular Media Filters (Anthracite & Sand)................................................................... 22
3.9 Membrane Pretreatment Filters .................................................................................... 23
3.10 Reverse Osmosis System ................................................................................................ 24
3.11 RO System Costs for Single Pass SWRO System for Mediterranean Water ................... 25

Mécanisme de Soutien à la Gestion Intégrée Durable de l'Eau (SWIM- SM) Projet financé par l'Union européenne
TOOLBOX OFGRAPHIC AND NUMERIC MODELS FOR ESTIMATING COSTS OF SEAWATER REVERSE
OSMOSIS DESALINATION PROJECTS
3
3.12 Post-treatment Construction Costs................................................................................ 28
3.13 Concentrate Disposal Costs ............................................................................................ 30
3.14 Other Construction Costs ............................................................................................... 31
3.15 Total Capital Costs .......................................................................................................... 33
4 ANNUAL O&M COSTS ...................................................................................... 34
5 COST OF WATER PRODUCTION ........................................................................ 36
6 COST-ESTIMATING METHODOLOGY ................................................................ 38
7 COST ESTIMATING EXAMPLE ........................................................................... 39

Mécanisme de Soutien à la Gestion Intégrée Durable de l'Eau (SWIM- SM) Projet financé par l'Union européenne
TOOLBOX OFGRAPHIC AND NUMERIC MODELS FOR ESTIMATING COSTS OF SEAWATER REVERSE
OSMOSIS DESALINATION PROJECTS
4
List of Acronyms
CRF Capital Recovery Factor
DAF Dissolved Air Flotation
H Depth
HDD Horizontal Directionally Drilled
HDPE High Density Polyethylene
MENA Middle East and North Africa
mg/L milligrams per liter
MM million
ML/d Mega liters per day
O&M Operation and Maintenance
Q flow
RO Reverse Osmosis
SWRO Seawater Reverse Osmosis
TDS Total Dissolved Solids
m³/day Cubic meters per day
US$ United States Dollars
Yr. Year

Mécanisme de Soutien à la Gestion Intégrée Durable de l'Eau (SWIM- SM) Projet financé par l'Union européenne
TOOLBOX OFGRAPHIC AND NUMERIC MODELS FOR ESTIMATING COSTS OF SEAWATER REVERSE
OSMOSIS DESALINATION PROJECTS
5
1 Executive summary
1.1 Introduction
The seawater desalination project toolbox consists of a compendium of capital cost curves (graphic cost
models) for all key components of desalination plants (intake, pretreatment, RO system, post
treatment) which can be used to prepare cost estimates of future desalination projects. The cost curves
are calibrated and validated against the actual capital expenditures for delivery of recent large seawater
membrane reverse osmosis desalination projects in the Middle East and North Africa (MENA) region.
The toolbox also includes methodology for cost estimating of seawater reverse osmosis desalination
plants and an example of the use of the methodology for preparation of desalination cost estimate.
1.2 Intended Users
The desalination toolbox is developed to be used by engineers, planners, decision-makers and cost
estimators involved in the development and implementation of desalination projects. The content of
the toolbox is catered to the needs of the MENA region.
1.3 Purpose
The purpose of this toolbox is to be used for preparation of budgetary cost estimates of seawater
reverse osmosis (SWRO) desalination projects developed in the MENA region.
1.4 Applicability
The toolbox is applicable for the cost estimating of medium and large size membrane seawater reverse
osmosis desalination projects of fresh water production capacity between 5,000 and 400,000 m³/day.
1.5 Limitation of the Use of the Toolbox
The use of this toolbox is limited to seawater reverse osmosis desalination projects only. The cost
models cannot be used for the calculation of the costs of thermal desalination plants or brackish water
desalination plants.
The applicability of the cost estimating models and methodology is limited to projects with fresh water
production capacity between 5,000 and 400,000 m³/day. Since the cost estimating curves are derived
from projects in the MENA Region, their use for projects outside of this region may not provide accurate
cost projections. The accuracy range of the models and associated cost estimates is - 15 to + 30 %.

Mécanisme de Soutien à la Gestion Intégrée Durable de l'Eau (SWIM- SM) Projet financé par l'Union européenne
TOOLBOX OFGRAPHIC AND NUMERIC MODELS FOR ESTIMATING COSTS OF SEAWATER REVERSE
OSMOSIS DESALINATION PROJECTS
6
2 PROJECT COST ESTIMATING OVERVIEW
2.1 Introduction
World’s oceans contain over 97.2 % of the planet’s water resources. Because of the high salinity of
ocean water and the significant costs associated with seawater desalination most of the global water
supply has traditionally come from fresh water sources – groundwater aquifers, rivers and lakes.
Changing climate patterns observed worldwide over the past decade combined with accelerating
population growth pressures and limited availability of new and inexpensive fresh water supplies are
shifting water industry’s attention to an emerging trend – seawater desalination.
Until recently, use of seawater desalination was limited to desert-climate dominated regions. Latest
technological advances and associated decrease in water production costs and energy demand have
expanded its use in coastal areas traditionally supplied with fresh water resources. At present,
desalination plants provide approximately 1 % of the world’s drinking water supply. Fresh water
production capacity from saline sources (brackish and seawater) has been increasing exponentially over
the past 15 years.
In 2010, more than 15,000 desalination plants worldwide produced a total of 65.2 million cubic meters
per day (m3/day) of fresh water from seawater and brackish water (IDA, 2011). Approximately 60 % of
the installed plant production capacity is attributed to reverse osmosis (RO) membrane desalination
plants and 34.8 % by thermal distillation facilities.
A clear recent trend in seawater desalination is the construction of larger capacity plants, which deliver
an increasingly greater portion of the fresh water supply of coastal cities around the globe. While most
of the large desalination plants built between year 2000 and 2005 were typically designed to supply only
5 to 10% of the drinking water of large coastal urban centers, today most regional or national
desalination project programs in countries such as Spain, Australia, Israel, Algeria and Singapore aim to
secure 20 to 25 % of their long-term drinking water needs with desalinated seawater.
Currently, reverse osmosis is the most commonly used desalination technology because for most saline
sources and applications, it yields fresh water at overall energy use and costs lower than these of other
traditional alternative desalination technologies. Therefore this toolbox focuses on the methods and
factors for determining all-inclusive costs for construction, operation and maintenance (O&M), and
overall fresh water production by seawater reverse osmosis (SWRO) desalination.
2.2 Project Cost Definitions
The key economic parameters of a seawater reverse osmosis desalination project are:
Capital costs; Operation and maintenance costs; Cost of water production.

Mécanisme de Soutien à la Gestion Intégrée Durable de l'Eau (SWIM- SM) Projet financé par l'Union européenne
TOOLBOX OFGRAPHIC AND NUMERIC MODELS FOR ESTIMATING COSTS OF SEAWATER REVERSE
OSMOSIS DESALINATION PROJECTS
7
2.3 Capital Costs
Capital costs include all expenditures associated with desalination project implementation: from the
time of conceptual development, through design, permitting, financing, construction, commissioning
and acceptance testing for continuous operation. Construction costs encompass all direct expenditures
needed to: build plant source water intake and concentrate discharge systems and all project-related
structures; procure and install all facility equipment, install and connect plan piping and service utilities;
and deliver desalinated water to final user/s. Because of their direct association with the construction of
physical facilities, construction costs are also referred to as “direct” or “hard” capital costs. Construction
costs are typically 50 to 85 % of the total capital costs.
The remaining 15 to 50 % of capital costs are often referred to as “indirect” of “soft” costs. These costs
are associated with all engineering, administrative, permitting, and funding efforts necessary to bring
the project to fruition; as well as expenditures needed to secure procure contractors for design,
construction and operation of the desalination project.
Total project capital costs are typically presented in monetary units (i.e., US$) and are estimated either
for the year when project construction is initiated or are referenced to the middle of the construction
period. Depending on the type, length and term of project funding, capital costs are often converted in
monetary units per year and referred to as amortized or annualized costs (US$/yr.). In addition, both
capital and construction costs are sometimes presented as expenditures per unit of desalination project
fresh water production capacity (i.e., US$/m³.day or US$/1,000 gallons).
2.4 Operation and Maintenance Costs
Operation and maintenance costs are all expenditures associated with: SWRO plant operations (power,
chemicals, labor, and replacement of consumables, such as membranes and cartridge filters); with
maintenance of plant equipment, buildings, grounds and utilities; and with compliance with all plant
operation and environmental permits, and other pertinent regulatory requirements. The operation and
maintenance costs associated with a given project are typically expressed as the all-inclusive operational
expenditures for a period of one year (i.e., US$/yr.) or as operational costs for the production of unit
volume of desalinated water (i.e., US$/m³).
Operation and maintenance costs may be divided into two main categories: fixed and variable. Fixed
O&M costs are annual expenditures that are not a function of the actual amount of fresh water
produced by the desalination plant. Such O&M expenditures include: labor costs (staff wages and fringe
benefits); costs for routine preventive equipment maintenance; environmental and performance
monitoring, operational insurance; administrative costs, and other miscellaneous overhead expenses.
Variable O&M costs are typically proportional to the actual volume of desalinated water produced by
the SWRO plant and include expenditures for: power; chemicals; replacement of RO membranes and
cartridge filters, and for waste disposal. Typically variable costs are 50 to 85 % of the total annual O&M
costs, while the fixed costs are 15 to 50 % of these expenditures.

Mécanisme de Soutien à la Gestion Intégrée Durable de l'Eau (SWIM- SM) Projet financé par l'Union européenne
TOOLBOX OFGRAPHIC AND NUMERIC MODELS FOR ESTIMATING COSTS OF SEAWATER REVERSE
OSMOSIS DESALINATION PROJECTS
8
2.5 Cost of Water
Cost of water is an economic parameter that incorporates all project capital and annual O&M
expenditures associated with water production, and is typically presented as monetary units per unit
volume of desalinated water (i.e., US$/m³). The total cost of fresh water production (cost of water) is
calculated by dividing the sum of the amortized (annualized) capital costs (i.e., US$/yr.) and the annual
O&M costs (i.e., US$/yr) by the total annual desalination plant fresh water production volume (m³/yr).
For a typical SWRO plant, the amortized capital costs and the O&M costs are usually in a range of 40 to
60 % of the total cost of water, each.
Although, the ratio between the key cost components varies from project to project, the “largest pieces
of the cost pie” are usually the plant construction expenditures (i.e., the direct capital costs), power, and
the other O&M costs (i.e., maintenance, chemicals, membranes, etc.). The indirect capital costs, which
mainly include expenditures for project engineering, development and finance, are also a significant
portion (typically 10 to 20 %) of the water production costs.

Mécanisme de Soutien à la Gestion Intégrée Durable de l'Eau (SWIM- SM) Projet financé par l'Union européenne
TOOLBOX OFGRAPHIC AND NUMERIC MODELS FOR ESTIMATING COSTS OF SEAWATER REVERSE
OSMOSIS DESALINATION PROJECTS
9
3 CAPITAL COSTS
Project capital costs can be divided into two broad categories: (1) construction costs (sometimes also
referred to as “direct capital costs” or “hard project costs”) and (2) other project related capital costs
(engineering, development, financing, and contingencies), which are often referred to as “indirect
capital costs” or “soft project costs”. A typical breakdown of the project capital costs for low-complexity
and high-complexity desalination projects is presented in Table 1.
Table 1 SWRO Project Capital Cost Breakdown
Cost Item
Percentage of Total Capital Cost (%)
Low-Complexity
Project
High-Complexity
Project
Direct Capital (Construction) Costs
1. Site Preparation, Roads and Parking 1.5 – 2.0
0.5 – 1.0
2. Intake 4.5 – 6.0
3.0 – 5.0
3. Pretreatment 8.5 – 9.5 6.0 – 8.0
4. RO System Equipment 38.0 – 44.0 30.5 – 36.0
5. Post-Treatment 1.5 – 2.5 1.0 – 2.0
6. Concentrate Disposal 3.0 – 4.0 1.5 – 3.0
7. Waste and Solids Handling 2.0 – 2.5 1.0 – 1.5
8. Electrical & Instrumentation Systems 2.5 – 3.5 1.5 – 2.5
9. Auxiliary and Service Equipment and Utilities 2.5 – 3.0 1.0 – 2.0
10. Buildings 4.5 – 5.5 3.0 – 5.0
11. Start Up, Commissioning and Acceptance Testing 1.5 – 2.5 1.0 – 2.0
Subtotal Direct (Construction) Costs
(% of Total Capital Costs)
70.0 – 85.0
50.0 – 68.0
Table 1 (Continued) SWRO Project Capital Cost Breakdown
Cost Item
Percentage of Total Capital Cost (%)
Low-Complexity Project
High-Complexity Project
Project Engineering Services
1. Preliminary Engineering
0.5 - 1.0 0.5 – 1.5
2. Pilot Testing 0.0 - 0.5 1.0 – 1.5

Mécanisme de Soutien à la Gestion Intégrée Durable de l'Eau (SWIM- SM) Projet financé par l'Union européenne
TOOLBOX OFGRAPHIC AND NUMERIC MODELS FOR ESTIMATING COSTS OF SEAWATER REVERSE
OSMOSIS DESALINATION PROJECTS
10
3. Detailed Design
3.5 - 4.5 5.0 – 6.0
4. Construction Management and Oversight
1.0 – 2.0 2.5 – 3.5
Subtotal Engineering Services
5.0 – 8.0
9.0 – 12.5
Project Development
1. Administration, Contracting and Management
1.0 – 1.5 2.0 – 3.0
2. Environmental Permitting (Licensing) 0.5 – 3.5 4.5 – 5.0
3. Legal Services
0.5 – 1.0 1.5 – 2.0
Subtotal Project Development
2.0 – 6.0
8.0 – 10.0
Project Financing Costs
1. Interest During Construction
0.5 - 2.5 1.0 – 4.5
2. Debt Service Reserve
2.0 – 5.5 4.5 – 8.5
3. Other Financing Costs 0.5 – 1.0 3.5 – 4.5
Subtotal Project Financing
3.0 – 9.0
9.0 – 17.5
Contingency
5.0 – 7.0
6.0 – 10.0
Subtotal Indirect Capital Costs (% of Total Capital Costs)
15.0 – 30.0
32.0 – 50.0
Total Capital Costs
100 %
100 %

Mécanisme de Soutien à la Gestion Intégrée Durable de l'Eau (SWIM- SM) Projet financé par l'Union européenne
TOOLBOX OFGRAPHIC AND NUMERIC MODELS FOR ESTIMATING COSTS OF SEAWATER REVERSE
OSMOSIS DESALINATION PROJECTS
11
3.1 Desalination Costs – Economy of Scale
The cost of water production is a function of desalination plant capacity (see Figure 1)
Figure 1 – Desalination Plant Economy of Scale

Mécanisme de Soutien à la Gestion Intégrée Durable de l'Eau (SWIM- SM) Projet financé par l'Union européenne
TOOLBOX OFGRAPHIC AND NUMERIC MODELS FOR ESTIMATING COSTS OF SEAWATER REVERSE
OSMOSIS DESALINATION PROJECTS
12
3.2 Desalination Plant Site Requirements
Desalination plant site costs are proportional to the size of the site and the unit cost of land. Table 2
provides guidance on the size of the site needed for a given desalination project as a function of its
production capacity. The larger the plant site the higher the cost and land requirements.
Table 2 - Seawater Desalination Plant Land Requirements
Plant Capacity (m³/day)
Typical Plant Site Land Requirements
m² acres
1,000 800 – 1,600 0.2 to 0.4
5,000 2,000 – 3,200 0.5 to 0.8
10,000 6,100 – 8,100 1.5 to 2.0
20,000 10,100 – 14,200 2.5 to 3.5
40,000 18,200 – 24,300 4.5 to 6.0
100,000 26,300 – 34,400 6.5 to 8.5
200,000 36,400 – 48,600 9.0 to 12.0
300,000 45,200 – 60,000 11.5 to 15.0 Note: Land Requirements Based on Conventional Plant Layout. Compact Plants May Require Less Land.
3.3 Capital Costs of Intakes
Intake costs are a function of the plant size and the type of intake. Offshore open intakes (see Figure 2)
are most commonly used in medium and large desalination projects.
Figure 2 – Open Ocean Intake

Mécanisme de Soutien à la Gestion Intégrée Durable de l'Eau (SWIM- SM) Projet financé par l'Union européenne
TOOLBOX OFGRAPHIC AND NUMERIC MODELS FOR ESTIMATING COSTS OF SEAWATER REVERSE
OSMOSIS DESALINATION PROJECTS
13
Figure 3 presents the cost curve for offshore intakes constructed as concrete tunnels and high density
polyethylene (HDPE) pipe. The figure incorporates costs for the two most commonly used types of
offshore intakes – concrete tunnels and HDPE pipe. For a given size of intake, the figures allow to
determine the unit cost of the intake per meter of intake pipe/tunnel. The total intake cost is calculated
by multiplying the unit cost of the intake and the actual length of the intake pipe/tunnel.
Figure 3 – Costs of Offshore Open Intakes

Mécanisme de Soutien à la Gestion Intégrée Durable de l'Eau (SWIM- SM) Projet financé par l'Union européenne
TOOLBOX OFGRAPHIC AND NUMERIC MODELS FOR ESTIMATING COSTS OF SEAWATER REVERSE
OSMOSIS DESALINATION PROJECTS
14
Figure 4 depicts onshore intake costs. On-shore intakes are used at a number of seawater desalination
plants in the MENA region. This graph presents the construction cost of onshore intakes as a function of
the intake seawater collection capacity. As described in previous sections of this toolbox, this cost graph
was developed based on the cost of actual onshore intakes of desalination and power plants in the
MENA region.
Figure 4 – Costs of Onshore Open Intakes

Mécanisme de Soutien à la Gestion Intégrée Durable de l'Eau (SWIM- SM) Projet financé par l'Union européenne
TOOLBOX OFGRAPHIC AND NUMERIC MODELS FOR ESTIMATING COSTS OF SEAWATER REVERSE
OSMOSIS DESALINATION PROJECTS
15
Table 3 provides cost functions that can be used for the estimating of the construction costs of vertical
well intakes. Table 4 summarizes costs of various types of intakes.
Table 3 Construction Costs of Vertical Intake Wells
Intake Well Production
Capacity (m3/day)
Construction Costs in 2012 US$
as a Function of Well Intake Flow, Q (m3/day)
and Well Depth, H (m)
1,000 - 2,000 40 Q + 700 H + 25,000
2,000 - 4,500 50 Q + 850 H + 50,000
4,500 – 6,500 65 Q + 1,100 H + 80,000
6,500 – 10,000 76 Q + 2,000 H + 150,000
10,000 – 15,000 85 Q + 2,100 H + 190,000
15,000 – 30,000 90 Q + 3,300 H + 260,000
Table 4 Comparison of Production and Costs of Various Types of Wells
Mécanisme de Soutien à la Gestion Intégrée Durable de l'Eau (SWIM- SM) Projet financé par l'Union européenne
TOOLBOX OFGRAPHIC AND NUMERIC MODELS FOR ESTIMATING COSTS OF SEAWATER REVERSE
OSMOSIS DESALINATION PROJECTS
16
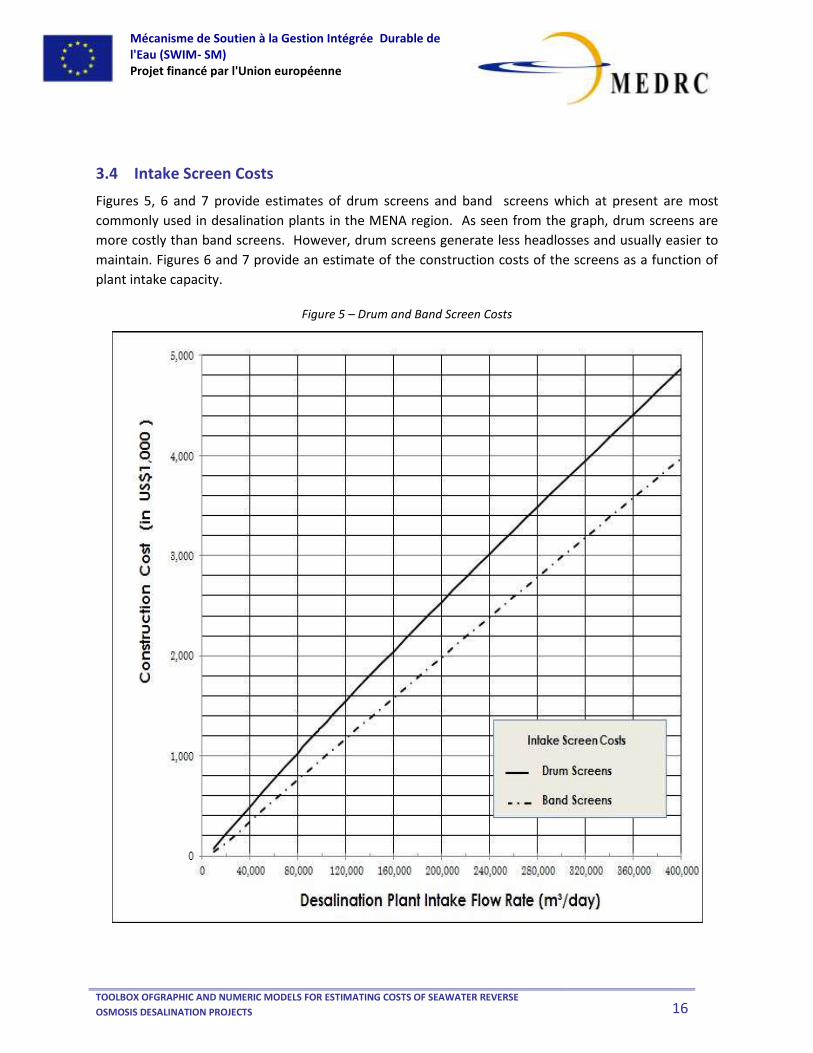
3.4 Intake Screen Costs
Figures 5, 6 and 7 provide estimates of drum screens and band screens which at present are most
commonly used in desalination plants in the MENA region. As seen from the graph, drum screens are
more costly than band screens. However, drum screens generate less headlosses and usually easier to
maintain. Figures 6 and 7 provide an estimate of the construction costs of the screens as a function of
plant intake capacity.
Figure 5 – Drum and Band Screen Costs

Mécanisme de Soutien à la Gestion Intégrée Durable de l'Eau (SWIM- SM) Projet financé par l'Union européenne
TOOLBOX OFGRAPHIC AND NUMERIC MODELS FOR ESTIMATING COSTS OF SEAWATER REVERSE
OSMOSIS DESALINATION PROJECTS
17
Figure 6 – Wedgewire Screen Costs
Wedgewire Screen
Cost

Mécanisme de Soutien à la Gestion Intégrée Durable de l'Eau (SWIM- SM) Projet financé par l'Union européenne
TOOLBOX OFGRAPHIC AND NUMERIC MODELS FOR ESTIMATING COSTS OF SEAWATER REVERSE
OSMOSIS DESALINATION PROJECTS
18
Figure 7 – Cartridge Filter Costs
Cartridge Filtration
System Cost

Mécanisme de Soutien à la Gestion Intégrée Durable de l'Eau (SWIM- SM) Projet financé par l'Union européenne
TOOLBOX OFGRAPHIC AND NUMERIC MODELS FOR ESTIMATING COSTS OF SEAWATER REVERSE
OSMOSIS DESALINATION PROJECTS
19
Figure 8 - Microscreens

Mécanisme de Soutien à la Gestion Intégrée Durable de l'Eau (SWIM- SM) Projet financé par l'Union européenne
TOOLBOX OFGRAPHIC AND NUMERIC MODELS FOR ESTIMATING COSTS OF SEAWATER REVERSE
OSMOSIS DESALINATION PROJECTS
20
3.5 Intake Pump Station Costs
Figure 8 depicts intake pump station costs. These costs are presented for both dry and wet well
configurations.
Figure 9 – Intake Pump Station Costs

Mécanisme de Soutien à la Gestion Intégrée Durable de l'Eau (SWIM- SM) Projet financé par l'Union européenne
TOOLBOX OFGRAPHIC AND NUMERIC MODELS FOR ESTIMATING COSTS OF SEAWATER REVERSE
OSMOSIS DESALINATION PROJECTS
21
3.7 Lamella and DAF Costs
Costs for lamella settlers and dissolved air flotation clarifiers are presented on Figure 10.
Figure 10 – Costs of Lamella and DAF Clarifiers

Mécanisme de Soutien à la Gestion Intégrée Durable de l'Eau (SWIM- SM) Projet financé par l'Union européenne
TOOLBOX OFGRAPHIC AND NUMERIC MODELS FOR ESTIMATING COSTS OF SEAWATER REVERSE
OSMOSIS DESALINATION PROJECTS
22
3.8 Granular Media Filters (Anthracite & Sand)
Figure 11 depicts the costs of dual media filters (sand and anthracite). The figure contains the costs of
both gravity and pressure filters.
Figure 11 – Costs of Dual Media Filters

Mécanisme de Soutien à la Gestion Intégrée Durable de l'Eau (SWIM- SM) Projet financé par l'Union européenne
TOOLBOX OFGRAPHIC AND NUMERIC MODELS FOR ESTIMATING COSTS OF SEAWATER REVERSE
OSMOSIS DESALINATION PROJECTS
23
3.9 Membrane Pretreatment Filters
Figure 12 shows the costs of membrane pretreatment filters.
Figure 12 – Membrane Pretreatment Filters

Mécanisme de Soutien à la Gestion Intégrée Durable de l'Eau (SWIM- SM) Projet financé par l'Union européenne
TOOLBOX OFGRAPHIC AND NUMERIC MODELS FOR ESTIMATING COSTS OF SEAWATER REVERSE
OSMOSIS DESALINATION PROJECTS
24
3.10 Reverse Osmosis System
Table 5 summarizes the costs of key components of the reverse osmosis systems of seawater
desalination plants.
Table 5 Construction Costs of Key Membrane RO System Components
Item Construction Cost (US$/item or as indicated)
8-inch Brackish RO Membrane Elements
US$250 – US$350/element
8-inch SWRO Membrane Elements US$400 – US$600/element
16-inch SWRO Membrane Elements US$2,800 – US$3,300/element
Brackish RO Pressure Vessels for 8-inch Elements
US$1,000 – US$1,300/vessel
SWRO Pressure Vessels for 8-inch Elements
US$1,300 – US$1,800/vessel
SWRO Pressure Vessels for 16-inch Elements
US$3,600 – US$5,000/vessel
RO Train Piping US$250,000 – US$750,000/RO Train
RO Train Support Frame US$150,000 – US$550,000/RO Train
RO Train Instrumentation and Controls
US$30,000 – US$150,000/RO Train
High Pressure Pumps US$150,000 – US$2,400,000/RO Train

Mécanisme de Soutien à la Gestion Intégrée Durable de l'Eau (SWIM- SM) Projet financé par l'Union européenne
TOOLBOX OFGRAPHIC AND NUMERIC MODELS FOR ESTIMATING COSTS OF SEAWATER REVERSE
OSMOSIS DESALINATION PROJECTS
25
3.11 RO System Costs for Single Pass SWRO System for Mediterranean Water
The graph shown below (Figure 13) is used as a baseline graph for all cost estiates. The costs of SWRO
systems which treat different water are adjusted upwards with the coefficents shown in Table 6. In
table 6, SWRO systems treating Mediterranean water are considered to have a unit cost of 1.
Figure 13 – Cost of Single pass SWRO System for Mediteranean Water

Mécanisme de Soutien à la Gestion Intégrée Durable de l'Eau (SWIM- SM) Projet financé par l'Union européenne
TOOLBOX OFGRAPHIC AND NUMERIC MODELS FOR ESTIMATING COSTS OF SEAWATER REVERSE
OSMOSIS DESALINATION PROJECTS
26
Because of their higher salinity, SWRO systems processing water other than Mediterranean will be
higher and are derved from the RO system cost of the Mediterranean water for a give project muptilied
with the factor in Table 6.
Table 7 can be used to adjuist costs of the RO systems which have more than one pass and are designed
to produce water quality better than drinking water.
Table 6 – Adjustment Coefficients for Conversion of Cost of Water for Mediterranean Project to Other Locations
Table 7 – Adjustment Coefficients for Conversion of Cost of Water for Mediterranean Project with Single Pass RO to
RO Systems

Mécanisme de Soutien à la Gestion Intégrée Durable de l'Eau (SWIM- SM) Projet financé par l'Union européenne
TOOLBOX OFGRAPHIC AND NUMERIC MODELS FOR ESTIMATING COSTS OF SEAWATER REVERSE
OSMOSIS DESALINATION PROJECTS
27
Figure 14 provides example of the calculation of the SWRO system costs for water qualities other than
Mediterranean water.
Figure 14 – Example of RO System Costs
Mécanisme de Soutien à la Gestion Intégrée Durable de l'Eau (SWIM- SM) Projet financé par l'Union européenne
TOOLBOX OFGRAPHIC AND NUMERIC MODELS FOR ESTIMATING COSTS OF SEAWATER REVERSE
OSMOSIS DESALINATION PROJECTS
28
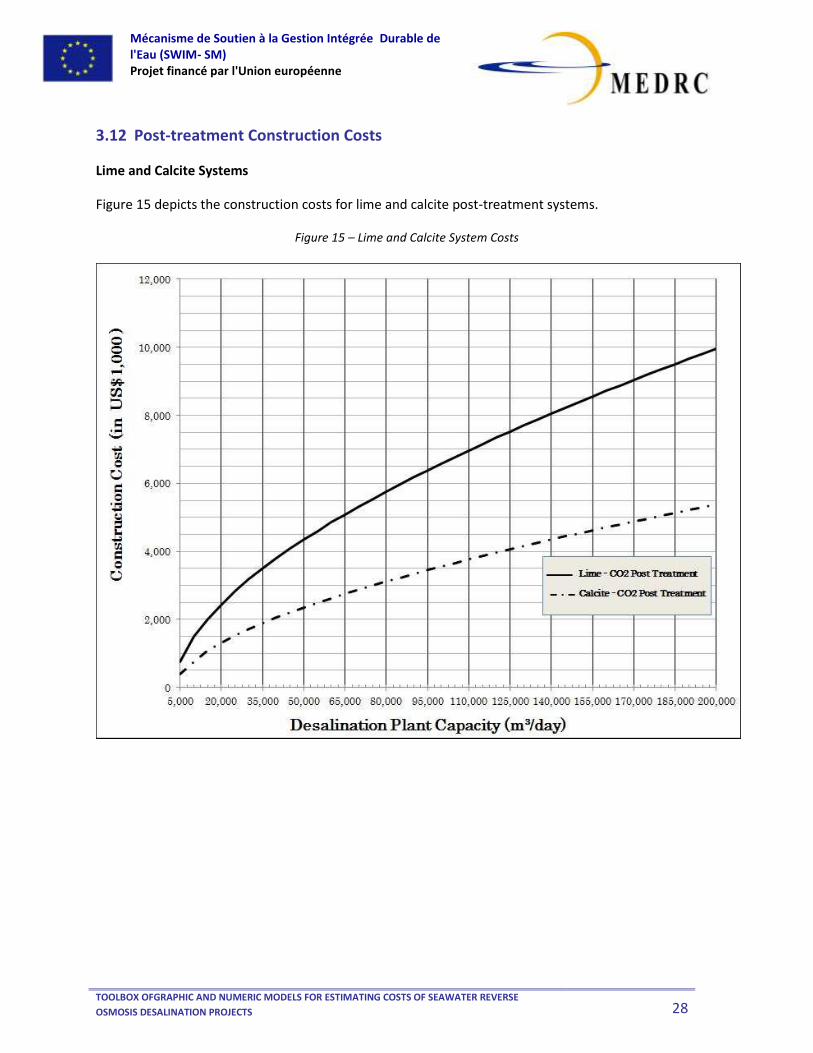
3.12 Post-treatment Construction Costs
Lime and Calcite Systems
Figure 15 depicts the construction costs for lime and calcite post-treatment systems.
Figure 15 – Lime and Calcite System Costs

Mécanisme de Soutien à la Gestion Intégrée Durable de l'Eau (SWIM- SM) Projet financé par l'Union européenne
TOOLBOX OFGRAPHIC AND NUMERIC MODELS FOR ESTIMATING COSTS OF SEAWATER REVERSE
OSMOSIS DESALINATION PROJECTS
29
Disinfection System
Figure 16 illustrates cost of water disinfection as a function of plant capacity.
Figure 16 – Disinfection System Costs

Mécanisme de Soutien à la Gestion Intégrée Durable de l'Eau (SWIM- SM) Projet financé par l'Union européenne
TOOLBOX OFGRAPHIC AND NUMERIC MODELS FOR ESTIMATING COSTS OF SEAWATER REVERSE
OSMOSIS DESALINATION PROJECTS
30
3.13 Concentrate Disposal Costs
Figure 17 depicts construction costs for near and offshore concentrate disposal.
Near vs. Offshore Discharge
Figure 17 – Near and Offshore Concentrate Disposal Costs

Mécanisme de Soutien à la Gestion Intégrée Durable de l'Eau (SWIM- SM) Projet financé par l'Union européenne
TOOLBOX OFGRAPHIC AND NUMERIC MODELS FOR ESTIMATING COSTS OF SEAWATER REVERSE
OSMOSIS DESALINATION PROJECTS
31
3.14 Other Construction Costs
Other construction costs are summarized on Figure 18. This figure illustrates the calculation of such
costs for a 40,000 m³/day plant. Table 9 illustrates direct capital costs for 40,000 m³/day project. Table
10 provides recommended cost ranges for indirect construction costs. This table also contains example
of such costs for 40,000 m³/day plant.
Figure 18 – Other Construction Costs

Mécanisme de Soutien à la Gestion Intégrée Durable de l'Eau (SWIM- SM) Projet financé par l'Union européenne
TOOLBOX OFGRAPHIC AND NUMERIC MODELS FOR ESTIMATING COSTS OF SEAWATER REVERSE
OSMOSIS DESALINATION PROJECTS
32
Table 9 – Direct Cost Summary of 40 MLD SWRO Project Treating Mediterranean Water with Single Pass RO System
Table 10 – Indirect Cost Summary of 40 MLD SWRO Project Treating Mediterranean Water with Single Pass RO
System

Mécanisme de Soutien à la Gestion Intégrée Durable de l'Eau (SWIM- SM) Projet financé par l'Union européenne
TOOLBOX OFGRAPHIC AND NUMERIC MODELS FOR ESTIMATING COSTS OF SEAWATER REVERSE
OSMOSIS DESALINATION PROJECTS
33
3.15 Total Capital Costs
Total capital costs are estimated as a sum of direct and indirect capital costs. In order to determine the
annualized total capital costs these costs are divided by a capital recovery factor (CRF) as illustrated on
Figure 19.
Figure 19 – Total Capital Costs
Mécanisme de Soutien à la Gestion Intégrée Durable de l'Eau (SWIM- SM) Projet financé par l'Union européenne
TOOLBOX OFGRAPHIC AND NUMERIC MODELS FOR ESTIMATING COSTS OF SEAWATER REVERSE
OSMOSIS DESALINATION PROJECTS
34
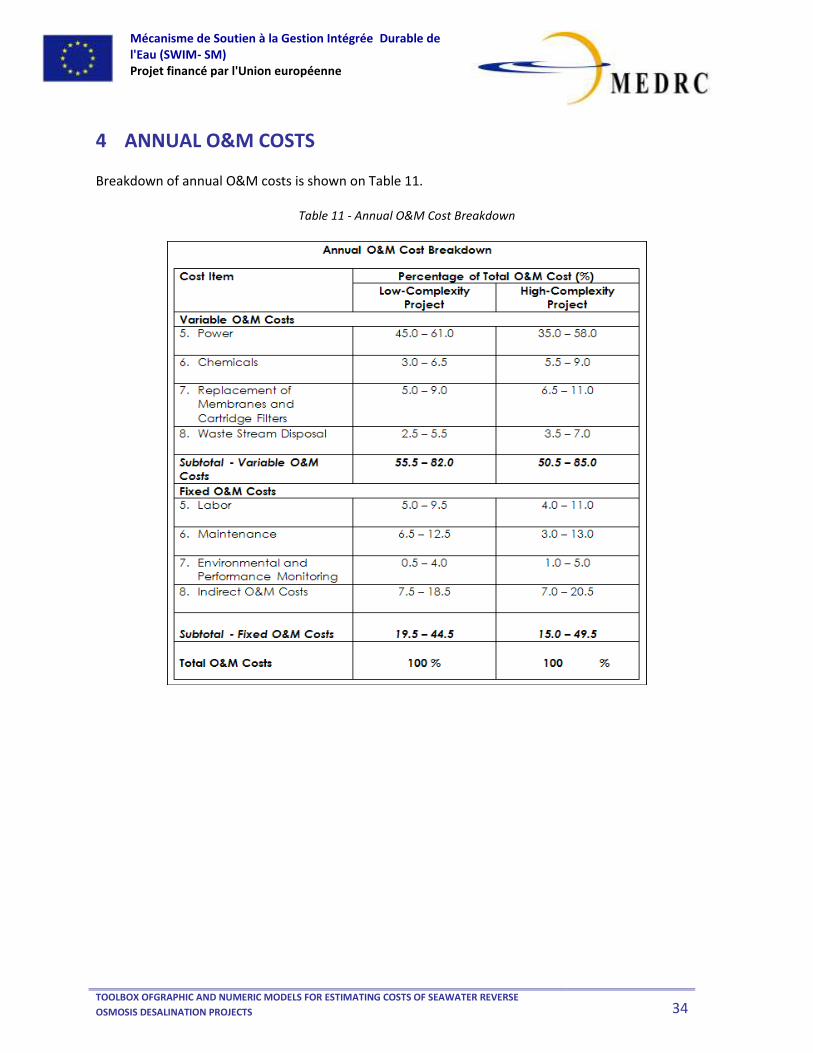
4 ANNUAL O&M COSTS
Breakdown of annual O&M costs is shown on Table 11.
Table 11 - Annual O&M Cost Breakdown

Mécanisme de Soutien à la Gestion Intégrée Durable de l'Eau (SWIM- SM) Projet financé par l'Union européenne
TOOLBOX OFGRAPHIC AND NUMERIC MODELS FOR ESTIMATING COSTS OF SEAWATER REVERSE
OSMOSIS DESALINATION PROJECTS
35
Table 12 indicates energy use for desalination plants of difference seawater source.
Table 12 – Energy Use as a Function of the Source of Seawater
Direct and indirect O&M cost components are defined in Table 13. This table shows typical range for
each cost component estimated as a function of the plant size.
Table 13 – Unit O&M Costs and Example of Cost Estimate for 40 MLD Plant

Mécanisme de Soutien à la Gestion Intégrée Durable de l'Eau (SWIM- SM) Projet financé par l'Union européenne
TOOLBOX OFGRAPHIC AND NUMERIC MODELS FOR ESTIMATING COSTS OF SEAWATER REVERSE
OSMOSIS DESALINATION PROJECTS
36
5 COST OF WATER PRODUCTION
As illustrated on Table 14, the total cost of water production consists of variable and fixed water
production costs. This table shows the size of the individual cost components for an example of 40,000
m3/day plant.
Table 14 – Cost of Water Breakdown
Variable components in this table are the same as the variable components of the O&M costs. The fixed
components of the cost of water are the sum of the fixed O&M costs and the capital recovery costs.

Mécanisme de Soutien à la Gestion Intégrée Durable de l'Eau (SWIM- SM) Projet financé par l'Union européenne
TOOLBOX OFGRAPHIC AND NUMERIC MODELS FOR ESTIMATING COSTS OF SEAWATER REVERSE
OSMOSIS DESALINATION PROJECTS
37
Tables 15 and 16 provide costs of recent desalination projects in the MENA region.
Table 15 – Cost of Water – Recent Projects In North Africa & the Mediterranean
Table 16 – Cost of Water – Recent Projects Red Sea and Arabian Gulf

Mécanisme de Soutien à la Gestion Intégrée Durable de l'Eau (SWIM- SM) Projet financé par l'Union européenne
TOOLBOX OFGRAPHIC AND NUMERIC MODELS FOR ESTIMATING COSTS OF SEAWATER REVERSE
OSMOSIS DESALINATION PROJECTS
38
6 COST-ESTIMATING METHODOLOGY
Cost estimating curves presented in sections 3, 4 and 5 of this document are used for the development
of the desalination costs of a given project. Cost estimating for a given project is typically completed
following the sequence below:
1. Determine project production capacity, source water quality and product water quality
2. Determine plant recovery and intake capacity
3. Establish the type of intake and outfall – for the selected intake and outfall type determine the
costs of the intake using Figures 3 and 4 or Tables 3 or 4 for open ocean intakes or well intakes
respectively.
4. Determine the type of source water screening facility and using Figures 5, 6 or 8 determine the
screening system costs depending on the type of screen.
5. Determine the cost of the plant intake pump station using Figure 9.
6. Determine the type of pretreatment needed based on the source water quality and use Figures
7, 8, 10, 11 and 12 to estimate construction costs for the pretreatment systems.
7. Define the type of RO system – single pass, partial two pass or full two pass RO system.
8. Using Figure 13 determine the construction cost of single pass SWRO system treating
Mediterranean water;
9. If the source water is not Mediterranean, than use Table 6 to adjust the costs determined from
Figure 13.
10. If the system is not a single pass RO system, than use Table 7 to adjust the costs estimated from
Figure 13.
11. Determine post-treatment costs using Figures 15 and 16.
12. Use Figure 17 to determine the cost of the desalination plant discharge.
13. Calculate other construction costs using the unit costs indicated on Figure 18.
14. Calculate the total direct capital (construction) cost as a sum of all costs listed above.
15. Calculate project indirect capital costs using Table 10.
16. Calculate total capital costs as a sum of the direct and indirect capital costs.
17. Determine annual O&M costs based on the unit cost ranges recommended in Table 13. Cost of
power is determined based on the estimated plant power use and the unit cost of water.
18. Determine cost of water production as a sum of the O&M costs and the capital recovery cost.
As shown on Figure 19, the capital recovery cost is calculated based on the payment term for
the loan for the project and the interest rate of the loan.

Mécanisme de Soutien à la Gestion Intégrée Durable de l'Eau (SWIM- SM) Projet financé par l'Union européenne
TOOLBOX OFGRAPHIC AND NUMERIC MODELS FOR ESTIMATING COSTS OF SEAWATER REVERSE
OSMOSIS DESALINATION PROJECTS
39
7 COST ESTIMATING EXAMPLE
The use of the cost estimating methodology described above is illustrated for the cost analysis of the
64,000 m3/day Palm Jumeirah SWRO project in Dubai, United Arab Emirates. Schematic of the plant is
shown on Figure 19.
Figure 20 – Palm Jumeirah SWRO Plant Schematic

Mécanisme de Soutien à la Gestion Intégrée Durable de l'Eau (SWIM- SM) Projet financé par l'Union européenne
TOOLBOX OFGRAPHIC AND NUMERIC MODELS FOR ESTIMATING COSTS OF SEAWATER REVERSE
OSMOSIS DESALINATION PROJECTS
40
Table 17 shows plant key statistics.
Table 17 – Project Data
The plant cost estimate is determined using the steps described in the previous section:
1. Determine project production capacity, source water quality and product water quality –
production capacity is 64,000 m³/day and source water quality is determined based on the
plant’s shallow open intake.
2. Determine plant recovery and intake capacity – based on data from the plant design plant
recovery is 40 % and the intake size is 176,000 m³/day.
3. Establish the type of intake and outfall – for the selected intake and outfall type determine the
costs of the intake using Figures 3 and 4 or Tables 3 or 4 for open ocean intakes or well intakes
respectively. The plant has onshore open intake as per Table 17 – using Figure 4, the cost of this
intake is US$8 million.
4. Determine the type of source water screening facility and using Figures 5 or 6 determine the
screening system costs depending on the type of screen. The plant has band screen – from
Figure 5 the cost of the band screen is: US$1.7 million.
5. Determine the cost of the plant intake pump station using Figure 9. From Figure 9 the cost of
the intake pump station is US$2.4 million. The total intake construction cost is US$8 million +
US$1.7 million + US$2.4 million = US$12.1 million.
6. Determine the type of pretreatment needed based on the source water quality and use Figures
7, 8, 10, 11 and 12 to estimate construction costs for the pretreatment systems. Based on the
project description the pretreatment includes microscreens and membrane pretreatment. From
Figure 8, Microscreen cost is estimated at US$1.63 million. From Figure 12, the cost of the

Mécanisme de Soutien à la Gestion Intégrée Durable de l'Eau (SWIM- SM) Projet financé par l'Union européenne
TOOLBOX OFGRAPHIC AND NUMERIC MODELS FOR ESTIMATING COSTS OF SEAWATER REVERSE
OSMOSIS DESALINATION PROJECTS
41
membrane pretreatment system is estimated at US$18 million. The total cost of pretreatment is
US$1.63 + US$18 million = US$19.63 million.
7. Define the type of RO system – single pass, partial two pass or full two pass RO system. From
project key statistics (Table 17) the RO system is two pass RO system.
8. Using Figure 13 determine the construction cost of single pass SWRO system treating
Mediterranean water; Based on this figure the baseline cost is US$49.00 million.
9. If the source water is not Mediterranean, than use Table 6 to adjust the costs determined from
Figure 13. Since the source water is Arabian Gulf water, the cost above has to be adjusted using
Table 6 – the cost of water penalty is 16 %.
10. If the system is not a single pass RO system, than use Table 7 to adjust the costs estimated from
Figure 13. Using Table 7, the cost has to be increased with 1.33 – i.e., the total cost of water will
be: 49 million x 1.16 x 1.33 = US$75.6 million.
11. Determine post-treatment costs using Figures 15 and 16. Calcite contactor cost is US$2.6
million (Figure 15). The hypochlorite disinfection system is US$1.0 million.
12. Use Figure 17 to determine the cost of the desalination plant discharge. Based on the type and
discharge volume shown in Table 17, the discharge cost is estimated at US$17.1 million.
13. Calculate other construction costs using the unit costs indicated on Figure 18. Such cost
estimate is shown on Figure 21 below.
Figure 21 – Other Construction Costs

Mécanisme de Soutien à la Gestion Intégrée Durable de l'Eau (SWIM- SM) Projet financé par l'Union européenne
TOOLBOX OFGRAPHIC AND NUMERIC MODELS FOR ESTIMATING COSTS OF SEAWATER REVERSE
OSMOSIS DESALINATION PROJECTS
42
1. Calculate the total direct capital (construction) cost as a sum of all costs listed above. Such costs
are presented in Table 18.
Table 18 – Summary of Direct Capital Costs
2. Calculate project indirect capital costs using Table 10. Table 19 shows indirect costs.
Table 19 – Indirect Capital Costs

Mécanisme de Soutien à la Gestion Intégrée Durable de l'Eau (SWIM- SM) Projet financé par l'Union européenne
TOOLBOX OFGRAPHIC AND NUMERIC MODELS FOR ESTIMATING COSTS OF SEAWATER REVERSE
OSMOSIS DESALINATION PROJECTS
43
3. Calculate total capital costs as a sum of the direct and indirect capital costs. Such costs are as
shown on Figure 22 below.
Figure 22 – Total Capital Costs
4. Determine annual O&M costs based on the unit cost ranges recommended in Table 13. Cost of
power is determined based on the estimated plant power use and the unit cost of water. Table
20 shows plant O&M cost estimate.
Table 20 – O&M Costs

Mécanisme de Soutien à la Gestion Intégrée Durable de l'Eau (SWIM- SM) Projet financé par l'Union européenne
TOOLBOX OFGRAPHIC AND NUMERIC MODELS FOR ESTIMATING COSTS OF SEAWATER REVERSE
OSMOSIS DESALINATION PROJECTS
44
5. Determine cost of water production as a sum of the O&M costs and the capital recovery cost.
As shown on Figure 19, the capital recovery cost is calculated based on the payment term for
the loan for the project and the interest rate of the loan. Table 21 presents the plant cost of
water.
Table 21 – Cost of Water Estimate


