

1 | Solar PV | Top Ten Trends for 2015
Top Solar Power Industry Trends
for 2015
Top Ten Trends for 2015 | Solar PV | 2
While 2014 undoubtedly remained a challenging time for the solar industry, it did mark an inflection point in the market’s development. Volume demand grew at a double-digit pace again, largely thanks to policy in China and Japan. Yet conditions remained extremely tough for suppliers. The supplier base consolidated further though mergers, acquisitions and bankruptcies, as companies struggled with debt-laden balance sheets and a rapid shift in their customer base away from their traditional markets.
All of the signs point to a strengthening recovery of the solar industry in 2015 even if the recovery itself remains incredibly fragile. Policy support will continue to be key, and demand still will be highly concentrated in a handful of countries, presenting significant risk. Nonetheless, the rapid price declines seen by the industry has opened up solar to an enormous number of countries around the world, with several new business models emerging in the post-FiT world. More than 40 countries globally will install at least 100 megawatts of new solar PV capacity in 2015, signaling the true entry of solar into traditional energy generation.
IHS Technology continues to track and analyze the solar industry closely. Our 20-strong analyst team, which recently welcomed our Solarbuzz colleagues through an IHS acquisition, aims to continue to be at the forefront, providing the very best market intelligence in order for our clients to thrive in this growth industry. We hope you find these takeaways—thoughtfully produced on a range of compelling topics—useful in planning for the year ahead. Please feel free to get in touch to discuss any of the issues raised in this white paper or to find out more on how we can help you.
Our Top 10 predictions for 2015 are:
1. Global solar PV demand to grow by up to 25 percent in 2015
2. CPV to see accelerated growth in 2015
3. Distributed PV in China to fall behind expectations, but continues to grow
4. Grid-connected PV energy storage installations to triple in 2015
5. Emerging markets mature – Chile follows South Africa to reach 1 GW of installed PV capacity
6. Monocrystalline technology to increase market share in 2015
7. Systems up to 100 kilowatts to account for 30 percent of global installations in 2015
8. Q2 halt to UK utility-scale PV triggers new wave of consolidation among European EPCs
9. Three-phase string inverters to account for one-third of global solar inverter revenue in 2015
10. California in 2015 will become global leader in solar power penetration
Thank you,
The IHS Technology Solar [email protected]
For more information on this white paper, refer to the Power & Energy industry of IHS Technology, encompassing solar research on demand and the supply chain.
3 | Solar PV | Top Ten Trends for 2015
ONE
The solar industry in 2014 was characterized by double-digit installation growth, moderate revenue expansion, a return to almost respectable margins, the restarting of capital investment and further M&A activity and consolidation in the supplier base. In many ways, 2015 will be very similar, we expect, with this fragile industry entering a healthier phase.
This time last year, IHS predicted that 2014 PV installations would reach the 40- to 45-gigawatt (GW) level, and our last analysis released in September agreed with the higher end, estimating installations of 45.3 GW this year. Reviewing the predictions from IHS last year by country, it appears we were remarkably accurate—even though IHS had underestimated the U.K. (largely because the ROC scheme was called to a halt early and drove a short-term spike), and had overestimated Germany.
The year 2014 saw dramatic shifts in the demand landscape, with China installing more than the whole of Europe. Other changes were somewhat predictable: high growth in Japan due to overly generous incentives; continued expansion in the under-penetrated U.S. market; and a slow yet steady build in demand in emerging regions that operate under very different dynamics and drivers than the typical feed-in tariff markets of yesteryear.
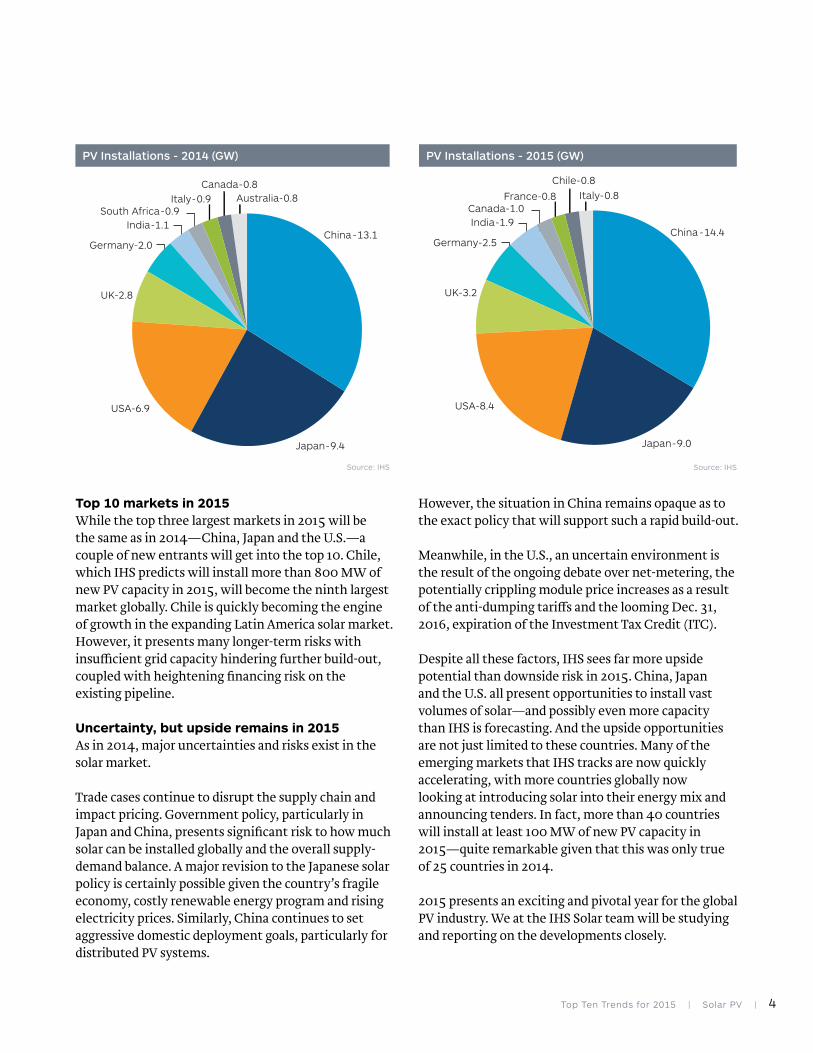
In 2015, IHS again predicts that installation demand will grow at a double-digit rate of 16 to 25 percent and installations in the range of 53 to 57 GW. The drivers of growth will remain largely unchanged from 2014. Geographically, the largest markets again will be China, Japan and the United States, while the largest contributors in terms of absolute growth will be China, the U.S. and India. The underlying driver of growth will be the ongoing cost reduction of solar.
The continued focus among countries on diversifying their energy mix away from imported oil and fossil fuels also will remain the same.
Although grid parity continues to be mentioned, it will still remain a very minor driver of growth in 2015. IHS expects that in 2015, slightly more than 1 GW of the total 53 GW installed globally will be truly unsubsidized. The largest bulk of solar installations in 2015, in fact, will remain driven by feed-in tariffs, despite the demise of many of those mature markets such as Germany that pioneered this approach. In fact, even in 2018, IHS predicts that only 6 percent of total global solar installations will be done without any incentives at all. Given the pace of price declines witnessed in the solar industry and the widespread hype regarding grid-parity, this is remarkably low.
Global solar PV demand to grow by up to 25 percent in 2015Ash Sharma, Senior Director, Solar Research
Top Ten Trends for 2015 | Solar PV | 4
Top 10 markets in 2015While the top three largest markets in 2015 will be the same as in 2014—China, Japan and the U.S.—a couple of new entrants will get into the top 10. Chile, which IHS predicts will install more than 800 MW of new PV capacity in 2015, will become the ninth largest market globally. Chile is quickly becoming the engine of growth in the expanding Latin America solar market. However, it presents many longer-term risks with insufficient grid capacity hindering further build-out, coupled with heightening financing risk on the existing pipeline.
Uncertainty, but upside remains in 2015 As in 2014, major uncertainties and risks exist in the solar market.
Trade cases continue to disrupt the supply chain and impact pricing. Government policy, particularly in Japan and China, presents significant risk to how much solar can be installed globally and the overall supply-demand balance. A major revision to the Japanese solar policy is certainly possible given the country’s fragile economy, costly renewable energy program and rising electricity prices. Similarly, China continues to set aggressive domestic deployment goals, particularly for distributed PV systems.
However, the situation in China remains opaque as to the exact policy that will support such a rapid build-out.
Meanwhile, in the U.S., an uncertain environment is the result of the ongoing debate over net-metering, the potentially crippling module price increases as a result of the anti-dumping tariffs and the looming Dec. 31, 2016, expiration of the Investment Tax Credit (ITC).
Despite all these factors, IHS sees far more upside potential than downside risk in 2015. China, Japan and the U.S. all present opportunities to install vast volumes of solar—and possibly even more capacity than IHS is forecasting. And the upside opportunities are not just limited to these countries. Many of the emerging markets that IHS tracks are now quickly accelerating, with more countries globally now looking at introducing solar into their energy mix and announcing tenders. In fact, more than 40 countries will install at least 100 MW of new PV capacity in 2015—quite remarkable given that this was only true of 25 countries in 2014.
2015 presents an exciting and pivotal year for the global PV industry. We at the IHS Solar team will be studying and reporting on the developments closely.
PV Insta
Source: IHS
PV Installations - 2014 (GW)
i
China-13.1
Canada-0.8Australia-0.8
Japan-9.4
USA-6.9
UK-2.8
Germany-2.0
India-1.1South Africa-0.9
Italy-0.9
PV Insta
Source: IHS
PV Installations - 2015 (GW)
i
China-14.4
Chile-0.8Italy-0.8
Japan-9.0
USA-8.4
UK-3.2
Germany-2.5
India-1.9Canada-1.0
France-0.8
5 | Solar PV | Top Ten Trends for 2015
TWOCPV to see accelerated growth in 2015
Concentrated Photovoltaic Solar (CPV) installations are projected to rise to almost 800 MW in 2020, up from roughly 100 MW in 2012. Installations of both High-Concentration Photovoltaic (HCPV) and Low-Concentration Photovoltaic (LCPV) systems will expand at double-digit percentages every year through 2020.
Starting in 2015, IHS predicts accelerated growth with the market expanding by 37 percent to reach approximately 250 MW of new installations. This compares with 32 percent growth and 137 MW installed in 2013.
The largest CPV installations in 2015 are estimated to account for about 80 to 90 MW in China and Southeast Asia, approximately 60 MW in the combined territory of the United States and Central America, and 50 MW in Southern Europe.
Because banks and other project financial institutions are wary of the risks associated with deploying solar energy technologies, it is still quite difficult to obtain funding for CPV. The decision to finance a project is based on a number of parameters, including on-sun experience, proof of reliability of operation and long-term warranties.
The CPV industry has endured many difficult years of research and development with only a handful of large projects installed in the past few years. There are many small test sites for CPV systems—up to 500 kW in size—which are necessary to validate the performance of the systems in any given region and to increase the “bankability” of the supplier.
Nonetheless, CPV suppliers are primarily targeting utility-scale installations at hundreds of megawatts to increase their cost-competitiveness, which will bring the CPV market to the edge of a breakthrough.
Several important factors, including efficiency improvements, cost competitiveness and proven reliability of the technology, will contribute to the increased demand.
Efficiency is a key element One vital factor for CPV to generate low-cost energy, disregarding the upfront costs of the system, is efficiency.
In 2013 the Fraunhofer Institute for Solar Energy Systems ISE, Soitec, CEA-Leti and the Helmholtz Center Berlin jointly announced a new record efficiency of 44.7 percent for a four-junction solar cell, which measured at a
concentration of 297 suns. More recently in November 2014 the French-German partners have achieved a new world record of 46.0% efficiency for their four-junction cell at a concentration of 508 suns.
In May 2014, Semprius announced its first four-junction solar cell, which uses a micro-transfer printing process that was developed in conjunction with Frederick Seitz Materials Research Laboratory at the University of Illinois and researchers at solar cell manufacturer Solar Junction.
The cell efficiency of HCPV systems, currently at 40 to 42 percent at Standard Test Conditions (STC), will reach almost 50 percent by 2020. Such cells, used with concentrating optics, will yield commercial-system efficiencies approaching 40 percent, compared to the less than 35 percent conversion rates typical at present.
Consistent improvements in technology and gradually decreased costs will drive HCPV systems to superior cost efficiency, making HCPV an increasingly viable rival to conventional solar-generating solutions.
Installation costs and levelized cost of electricity The growth of the PV market
Karl Melkonyan, Analyst, Solar Demand
Top Ten Trends for 2015 | Solar PV | 6
has been driven primarily by governments through incentives and subsidies to reach renewable energy targets. In recent years, these subsidies have been scaled back as PV installations have grown rapidly, because lower decreased system costs actually served to render the original schemes attractive and costly to support for 20 years or more.
While the upfront cost of a system, expressed in terms of price per watt, is a key consideration, the total cost of the electricity produced over the lifetime of the system, expressed as price per kilowatt-hour (kWh), is the determining factor for potential investors and system owners.
The potential system owner is only likely to choose CPV over PV if CPV can offer a greater return on investment.
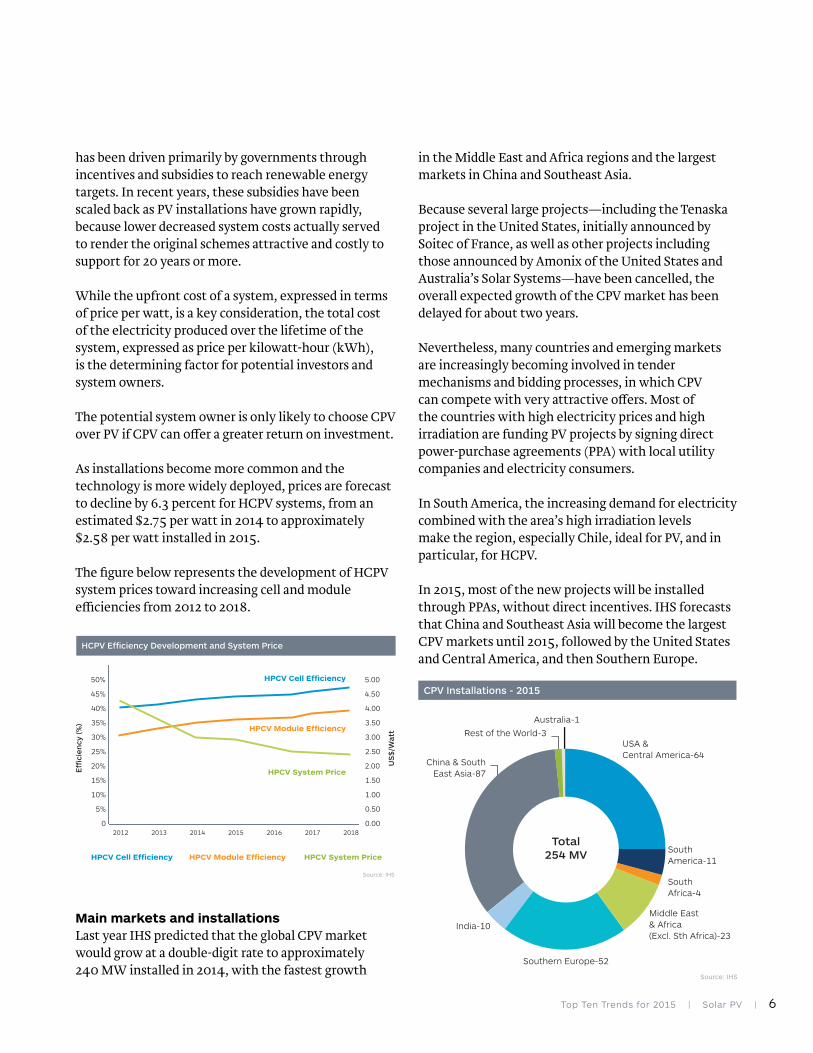
As installations become more common and the technology is more widely deployed, prices are forecast to decline by 6.3 percent for HCPV systems, from an estimated $2.75 per watt in 2014 to approximately $2.58 per watt installed in 2015.
The figure below represents the development of HCPV system prices toward increasing cell and module efficiencies from 2012 to 2018.
Main markets and installationsLast year IHS predicted that the global CPV market would grow at a double-digit rate to approximately 240 MW installed in 2014, with the fastest growth
in the Middle East and Africa regions and the largest markets in China and Southeast Asia.
Because several large projects—including the Tenaska project in the United States, initially announced by Soitec of France, as well as other projects including those announced by Amonix of the United States and Australia’s Solar Systems—have been cancelled, the overall expected growth of the CPV market has been delayed for about two years.
Nevertheless, many countries and emerging markets are increasingly becoming involved in tender mechanisms and bidding processes, in which CPV can compete with very attractive offers. Most of the countries with high electricity prices and high irradiation are funding PV projects by signing direct power-purchase agreements (PPA) with local utility companies and electricity consumers.
In South America, the increasing demand for electricity combined with the area’s high irradiation levels make the region, especially Chile, ideal for PV, and in particular, for HCPV.
In 2015, most of the new projects will be installed through PPAs, without direct incentives. IHS forecasts that China and Southeast Asia will become the largest CPV markets until 2015, followed by the United States and Central America, and then Southern Europe.
HCPV Efficiency Development and System Price
Source: IHS
0
5%
10%
15%
20%
25%
30%
35%
40%
50%
45%
2015201420132012
Effi
cien
cy (%
)
0.00
0.50
1.00
1.50
2.00
2.50
3.00
3.50
4.00
5.00
4.50
US
$/W
att
2016 2017 2018
HPCV Cell Efficiency
HPCV Cell Efficiency
HPCV Module Efficiency
HPCV Module Efficiency
HPCV System Price
HPCV System Price
PV Insta
Source: IHS
CPV Installations - 2015
i
USA & Central America-64
Southern Europe-52
South America-11
South Africa-4
Middle East & Africa(Excl. Sth Africa)-23
India-10
China & South East Asia-87
Rest of the World-3
Australia-1
Total254 MV
7 | Solar PV | Top Ten Trends for 2015
THREEDistributed PV in China to fall behind expectations, but continues to grow
During the Asia-Pacific Economic Cooperation conference in Beijing in November 2014 that drew 21 world leaders to the city, haze was temporarily absent from the Chinese capital city for about 10 days. The Chinese invented a new word to describe the blue sky during this period—APEC blue, for the short-term pollution-free status of the city’s heavens as a result of temporary administrative measures, including the shutdown of heavily polluting factories and restriction on the use of automobiles. Such measures had been in place before, enacted during the Beijing Olympics in 2008.
President Xi Jinping has expressed his keen wish to keep the skies blue over Beijing even when there are no international conferences or events, demonstrating the importance of the using carbon-free technologies in China.
Xi’s administration has been supportive of carbon-free technologies including both wind and solar power systems. However, since China’s initial model of rolling out some of the largest utility-scale PV plants in the world has been limited—by the country’s grid capacity on the one hand, and on the other by the location of prime areas for solar generation ranged against the largest cities with the greatest demand for power—China has pinned great hopes on the development of distributed PV. DPV systems are smaller, generally rooftop systems that typically provide at least some of the power they produce to the buildings on which they are located. China has been promoting DPV since 2012 as a new format of PV deployment in China.
In November 2013, IHS forecast 4.1 GW of DPV projected to be installed in China in 2014, which has turned out to be very close to actual installations for
this year. As 2015 approaches, IHS will venture to make another forecast for China’s DPV development next year.
Will the Chinese PV market remain the world’s largest in 2015? IHS believes that China’s position as the largest PV market in the world will continue from 2015 to 2017. The latest announcement from the government is the 13th Five-Year Plan (2016-2020) for solar development, which targets 100 GW of accumulative installations by 2020.
With 12.5 GW of installations forecast in 2014, cumulative installations at the end of this year will reach approximately 30 GW. This leaves China a substantial 70 GW to complete in six years if it is to meet its target. Given China’s history of exceeding targets, IHS forecasts that actual installations will exceed this amount.
How much will DPV account for China’s total PV installation? DPV has seen a slow start in China, as the industry has struggled to develop suitable business models to drive adoption and after experiencing a lack of suitable rooftop resources. China was forced to lower its 8 GW target for DPV in 2014 to 4 GW, and further down to less than 4 GW by the end of 2014.
By November 2014, the most successful deployment of DPV was found in Zhejiang province on the eastern seaboard, with over 1 GW of DPV installed. In particular, the city of Jiaxing has been successful, attributed by China’s National Energy Administration (NEA) to the combination of high subsidies from provincial and municipal governments alike, and also
Frank Xie, Senior Analyst, Solar Demand & Supply Chain
Top Ten Trends for 2015 | Solar PV | 8
by the government-led DPV development platform. However, most other cities have not been able to replicate Jiaxing’s accomplishment.
IHS sees DPV in China improving from 2015 for the following reasons:
• Commercial and industrial electricity prices continue to rise, whereas the electricity price of DPV continues to fall. Generating your own electricity from solar is becoming more financially compelling for businesses
• Local governments in China are beginning to realize the value of DPV in reducing carbon emissions and in driving greener electricity consumption—hence, more supportive policies for DPV are being issued
• Business models that promote the deployment of DPV continue to emerge and develop, enabling more end users to benefit financially from the new types of solar systems
From 2015 to 2017, DPV in China is very much likely to adopt various models, depending on the characteristics of each region.
On a national level, investors are now given the security of being able to switch to a feed-in tariff incentive model if the distributed PV inventive scheme does not turn out to be profitable. In this case, the system owner can apply to be switched onto the national FiT scheme, which offers a high price-per-kWh for electricity exported.
IHS has also noted increased interest in owning DPV systems, and companies such as SF Holdings, which has been active in buying ground-mount PV systems, are also starting to own DPV systems. This increased appetite for investing in DPV systems will further boost the DPV market. Some solar developers in China have already begun to test the possibilities of promoting third-party ownership and a solar leasing model in China. While this model, which has transformed markets like the United States, could have a hugely positive impact on the Chinese market, it has had very little impact to date.
Overall, IHS foresees many challenges ahead for China’s ambitious plans for DPV, and growth is likely to fall in light of the nation’s aggressive targets. Even so, the market is clearly beginning to build momentum, and policies and business models are helping to accelerate growth. IHS foresees that DPV installations in China will reach 4.7 GW in 2015, an increase of nearly 20 percent from 2014.
9 | Solar PV | Top Ten Trends for 2015
FOUR
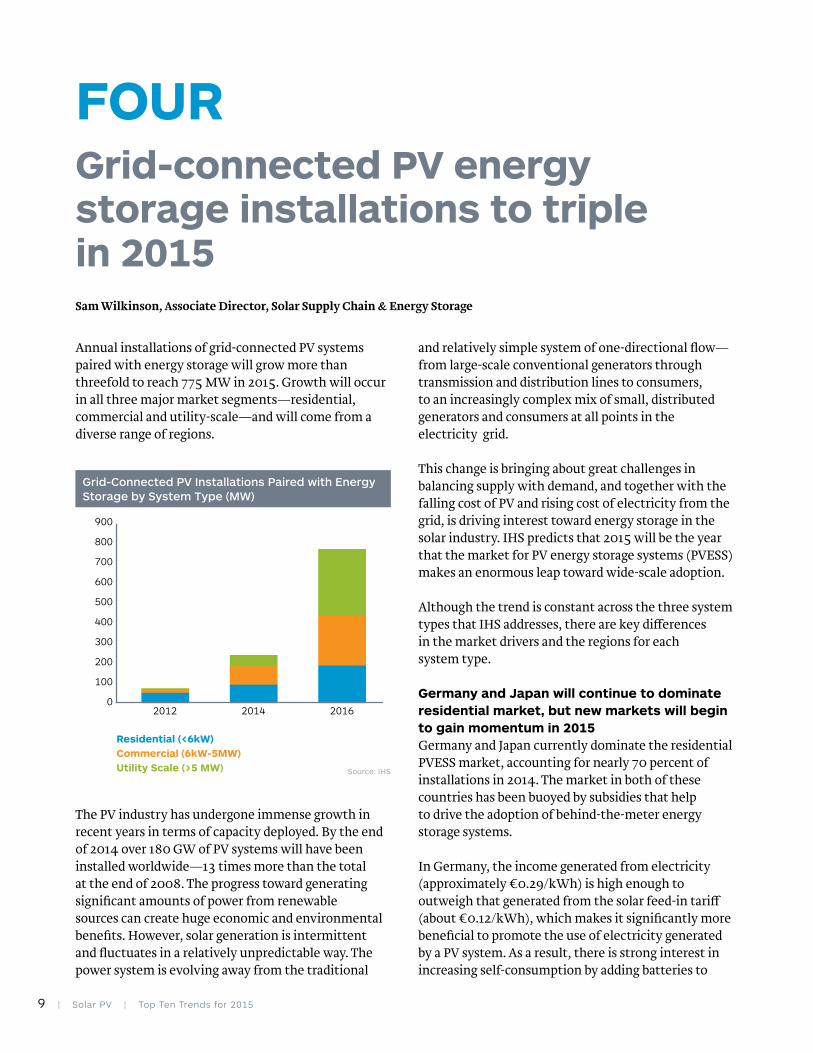
Annual installations of grid-connected PV systems paired with energy storage will grow more than threefold to reach 775 MW in 2015. Growth will occur in all three major market segments—residential, commercial and utility-scale—and will come from a diverse range of regions.
The PV industry has undergone immense growth in recent years in terms of capacity deployed. By the end of 2014 over 180 GW of PV systems will have been installed worldwide—13 times more than the total at the end of 2008. The progress toward generating significant amounts of power from renewable sources can create huge economic and environmental benefits. However, solar generation is intermittent and fluctuates in a relatively unpredictable way. The power system is evolving away from the traditional
and relatively simple system of one-directional flow—from large-scale conventional generators through transmission and distribution lines to consumers, to an increasingly complex mix of small, distributed generators and consumers at all points in the electricity grid.
This change is bringing about great challenges in balancing supply with demand, and together with the falling cost of PV and rising cost of electricity from the grid, is driving interest toward energy storage in the solar industry. IHS predicts that 2015 will be the year that the market for PV energy storage systems (PVESS) makes an enormous leap toward wide-scale adoption.
Although the trend is constant across the three system types that IHS addresses, there are key differences in the market drivers and the regions for each system type.
Germany and Japan will continue to dominate residential market, but new markets will begin to gain momentum in 2015Germany and Japan currently dominate the residential PVESS market, accounting for nearly 70 percent of installations in 2014. The market in both of these countries has been buoyed by subsidies that help to drive the adoption of behind-the-meter energy storage systems.
In Germany, the income generated from electricity (approximately €0.29/kWh) is high enough to outweigh that generated from the solar feed-in tariff (about €0.12/kWh), which makes it significantly more beneficial to promote the use of electricity generated by a PV system. As a result, there is strong interest in increasing self-consumption by adding batteries to
Grid-connected PV energy storage installations to triple in 2015Sam Wilkinson, Associate Director, Solar Supply Chain & Energy Storage
Grid-Connected PV Installations Paired with Energy Storage by System Type (MW)
Source: IHS
0
100
200
300
400
500
600
700
800
900
2016 2014 2012
Residential (<6kW)Commercial (6kW-5MW)Utility Scale (>5 MW)

Top Ten Trends for 2015 | Solar PV | 10
systems. The energy storage subsidy that was launched in 2013 helps to cover some of these upfront costs.
In response to the frequent blackouts caused by the shortage of electricity following the closure of its nuclear power stations, Japan has also launched a subsidy to promote the installation of lithium-ion (Li-ion) batteries in residential and commercial buildings. Batteries installed alongside PV systems provide backup and take advantage of the variance between peak and off-peak electricity prices by charging during off-peak times.
In 2015, the combined influence of Germany and Japan is forecast to fall to less than 60 percent as other markets begin to gain momentum. In particular, the U.K., Australia and countries in North America are predicted to start deploying residential energy storage in more significant volumes—predicted to exceed 10 MW.
Major opportunity will be present for commercial PV energy storage in the USWhile the same incentives will help Germany and Japan continue to play huge roles in the commercial PV energy storage market, the United States has a significant opportunity in this sector. Strong interest has been generated in the region as a result of so-called peak demand charges that make up a large proportion of electricity bills in the commercial sector. These charges are based on peak usage in kW, based on 15- or 30-minute intervals used during the billing period. The potential savings, combined with incentives offered
by the Self-Generation Incentive Program (SGIP – California only) and tax credits, can make solar and energy storage an extremely attractive proposition to commercial-rate payers in the United States.
Companies like Green Charge Networks, Stem and Coda Energy are also helping to drive this market by offering their systems to end-users with no upfront cost. They own the storage, site it at the customer’s building and pass on a proportion of the savings generated, creating an extremely compelling proposition.
This business model will be the primary driver that helps the North America market grow by over 200 percent to achieve nearly 80 MW of commercial PV energy storage installations in 2015.
Regulations to improve renewable integration will greatly accelerate utility-scale market in 2015Besides adding energy storage to behind-the-meter PV systems, there is a growing interest in pairing storage with utility-scale PV systems to assist their integration into the grid. Particularly in areas with high levels of renewable penetration, or on island grids, the impact of fluctuations on the output of large PV systems can pose significant challenges to the grid’s stability.
As a result, a number of regions including Puerto Rico and Hawaii have begun to introduce ramp-rate restrictions, which establish a minimum and a maximum rate
at which the output of renewable generators (including PV systems) can change. Adding energy storage to the grid-connection of their plants can control the outputs to meet these restrictions—by charging the battery when the output is increasing too quickly, and by discharging the battery when the output is reducing too quickly.
Initially the introduction of such legislation stalled markets in Puerto Rico. But developers have now had adequate time to digest the impacts of the new requirements and have renegotiated Power Purchase Agreements and system designs to accommodate them.
IHS predicts that utility-scale PV energy storage installations will grow quickly in 2015 to over 350 MW from the 50 MW in 2014. The main drivers of this sizable growth will be Hawaii and Puerto Rico, but other regions where utility-scale solar integration is becoming a growing concern will also contribute.
In 2014 a 9 MW system was installed on the island of La Reunion to help minimize the impact of the growing amount of renewables on the grid. Similar systems have also been deployed in China and Japan.
11 | Solar PV | Top Ten Trends for 2015
FIVE
IHS predicts that Chile will be the next emerging market after South Africa to reach the milestone of 1 GW in installed photovoltaic (PV) solar capacity. Besides Chile, other new emerging markets poised for rapid growth in 2015 are Jordan, the Philippines and Honduras. Conversely, great uncertainty still surrounds Mexico, Brazil and Turkey.
South Africa enters 2015 with 1 GW installed capacity and ends period of rapid growthThis year South Africa installed more than 800 MW of capacity that had been awarded in the two first rounds of tenders held previously in 2011 and 2012. The addition of large projects in the fourth quarter of 2014 means total installations will have surpassed 1 GW, leaving 739 MW of tendered capacity to be installed in 2015 and 2016. Given that the 486 MW awarded in round 3 had not reached financial close in November 2014, IHS does not expect South Africa to install more than 400 MW of utility-scale PV in 2015, leading to a 40 percent drop in new additions compared to 2014. Depending on the outcome of the fourth tender round, which closes at the end of 2014, the market should pick up again in 2017, IHS expects. By then, IHS also anticipates the strong growth of commercial PV installations to provide power for industries and commerce.
Chile kicks off 2015 with more than 600 MW under constructionChile will start 2015 with more than 600 MW in installed capacity and with an equal share under construction, IHS is forecasting. By the end of next year, Chile will have 1.4 GW of PV capacity installed, of which 90 percent will be in utility-scale projects—primarily those larger than 20 MW. The projects will have offtake agreements with mines and industries,
or take upon itself the risk of selling power on the merchant market. The reason for the rush to install is the competition for grid access. After 2015, the grid infrastructure will greatly limit new projects, as the most attractive grid-access points will be saturated. Installations are then projected to decline by 40 percent in 2016, and not until the end of the decade will the grid be ready to handle larger chunks of utility-scale PV.
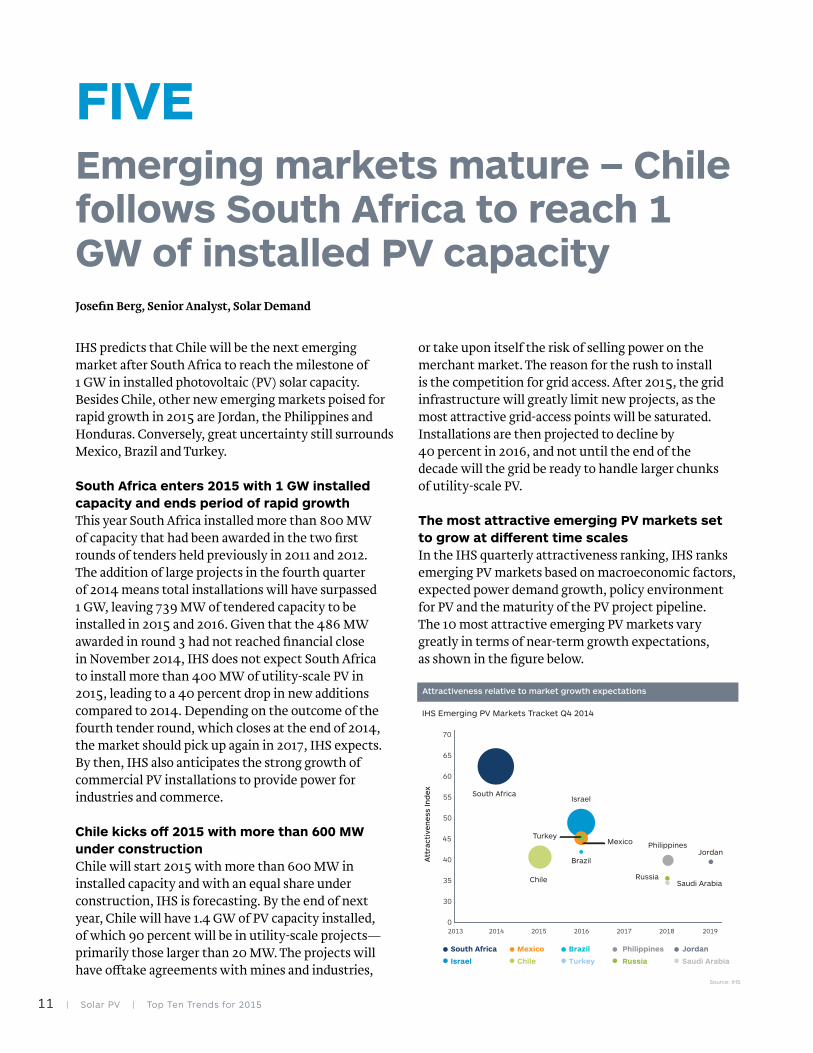
The most attractive emerging PV markets set to grow at different time scalesIn the IHS quarterly attractiveness ranking, IHS ranks emerging PV markets based on macroeconomic factors, expected power demand growth, policy environment for PV and the maturity of the PV project pipeline. The 10 most attractive emerging PV markets vary greatly in terms of near-term growth expectations, as shown in the figure below.
Emerging markets mature – Chile follows South Africa to reach 1 GW of installed PV capacityJosefin Berg, Senior Analyst, Solar Demand
South Africa
Chile
Israel
Philippines
RussiaSaudi Arabia
JordanBrazil
TurkeyMexico
Attractiveness relative to market growth expectations
Source: IHS
0
30
35
40
45
50
55
60
65
70
2015 20142013
Att
ract
iven
ess
Ind
ex
2016 2017 2018 2019
IHS Emerging PV Markets Tracket Q4 2014
Brazil
Turkey
Mexico
Chile
South Africa
Israel
Jordan
Saudi Arabia
Philippines
Russia
Top Ten Trends for 2015 | Solar PV | 12
Mexico, Brazil and Turkey are predicted to ramp up growth in 2015 to each reach 1 GW of installed capacity by the end of 2016 or early 2017. However, their growth is contingent upon several factors.
Mexico has a healthy pipeline of utility-scale PV projects, but financing remains hard to come by until further details emerge on the ongoing energy reform. The commercial and residential segments drive Mexico’s growth for the present, but utility-scale projects will need to advance for the country to reach 1 GW in installed capacity.
In Brazil the electricity regulatory agency ANEEL just awarded 890 MW in the first nationwide PV tender, with 123 MW previously awarded in the Pernambuco state tender. How quickly these projects will be built will also depend on financing and the ramp-up of local manufacturing in order to conform to local content rules for advantageous financing. In Pernambuco, the projects are pending offtake agreements, as the local regulator has failed to find a power company to purchase the generated power. If such issues are not solved promptly, Brazil’s growth will be pushed back to 2016.
As for Turkey, the progress of license projects will determine near- and medium-term growth. The first 13 MW of license projects were awarded in May 2014 but have not advanced further due to administrative issues. More licenses should be awarded in early 2015, but the time frame to construction remains unclear. Meanwhile, IHS expects the unlicensed segment to ramp up quickly in 2015 to represent 200 MW of additions.
Jordan, the Philippines, and Honduras set to deploy PV in 2015Not yet gigawatt markets but poised for growth, Jordan, the Philippines and Honduras are building concrete, large projects in 2015.
In Jordan, desperate for new power-generation capacity, the 170 MW of PV plants awarded in the first direct proposal round have reached financial close and will be built in 2015. The second round of the direct proposal scheme is closing by the end of 2014, which means that further projects will not be built until the end of
2016 or 2017. The sub-5 MW segment is also growing under the net-metering scheme, but installed capacity is unlikely to surpass 1 GW in the medium term, as the small size of the Jordanian power market caps the total potential.
In the Philippines, looming power shortages in 2015 have put renewables on the agenda, and the current feed-in-tariff will be granted for up to 500 MW if installed by March 2015. Up to 200 MW of projects are aiming to meet that deadline. Greater interest from large power companies, such as Aboitiz Power’s collaboration with SunEdison to target 300 MW, is a sign of near- and medium-term PV growth potential.
Meanwhile for Honduras, the ongoing construction of 173 MW places the country in the spotlight for 2015, as Honduras does not yet host any significant PV capacity. An additional 430 MW pipeline of projects with secured PPAs has built up momentum for further deployment. The access to finance will filter out the most speculative projects in the pipeline, which leads IHS to expect that Honduras will have installed 400 MW of photovoltaic capacity by 2017.
13 | Solar PV | Top Ten Trends for 2015
SIX
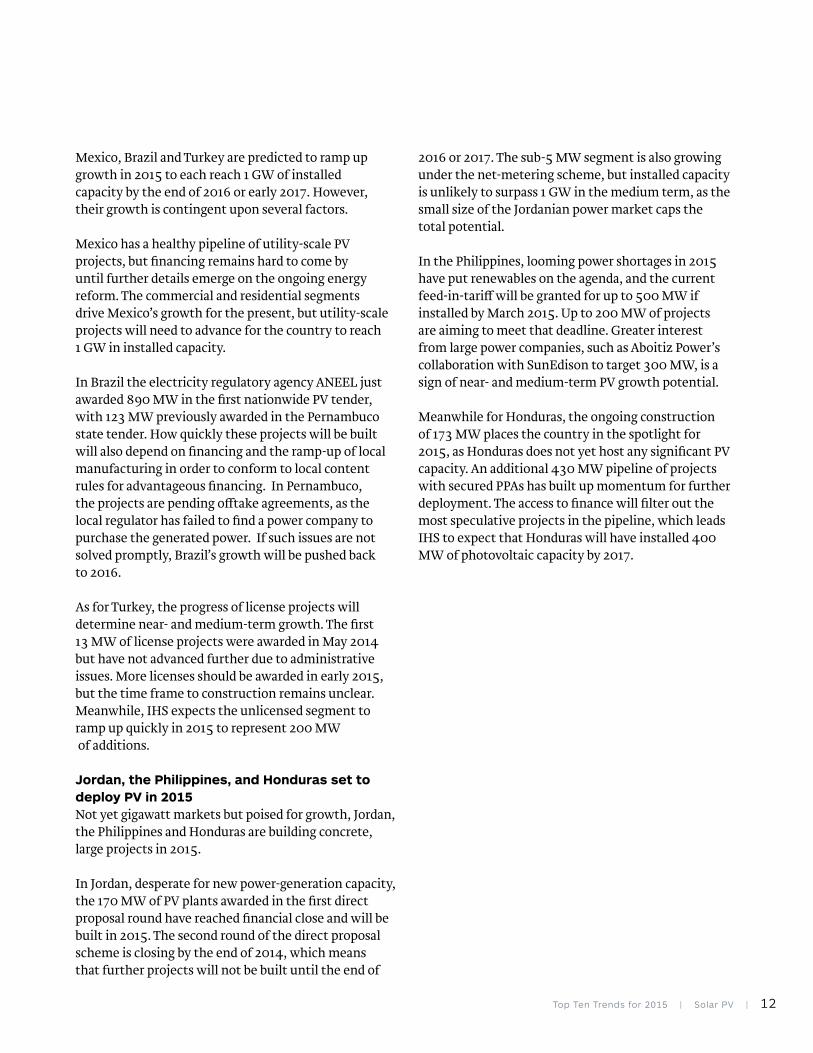
Competition between monocrystalline and multicrystalline technology has been heating up in the global PV business. The technological battle has mainly been driven by the strong development of the residential rooftop segment in Japan and by recent increased demand for high-efficiency products. As a result of its greater solar efficiency, monocrystalline technology has gained market share this year.
Monocrystalline vs. multicrystalline Because the technological barriers are higher for monocrystalline compared to multicrystalline technology, it’s easier for manufacturers to achieve rapid expansion on multicrystalline technology once the downstream market booms.
For many years, multicrystalline was the technology of choice to serve high-volume photovoltaic
markets because it offered, in most applications, an advantageous cost ratio in price per watt on the system level. GCL, the largest wafer producer, has expanded multicrystalline wafer capacity significantly during the past few years, rising from 3.5 GW in 2010 to 10 GW in 2013. The five largest monocrystalline wafer producers—Longi, Zhonghuan, Comtec, Jinglong and Solargiga—accounted for more than 85 percent of global monocrystalline wafer production in 2013, but only represented 10 percent of global wafer production in 2013.
Multicrystalline technology dominated the market, accounting for 80 percent of production in 2013. But monocrystalline technology has since started to show a trend of gaining market share.
The promise of monocrystallineIncreased efficiency in both the global supply chain and manufacturing operations will drive decreased costs on a dollar-per-watt basis for monocrystalline in the future.
A standard monocrystalline cell has a 2 percent higher efficiency on average than multicrystalline, not to mention the N-Type monocrystalline cell that can reach 24 percent. Current average production cost is $0.38/W for monocrystalline cells and $0.34 per watt for multicrystalline cells. Average selling prices are at $0.44 per watt for monocrystalline and $0.38 per watt for multicrystalline cells. Thus, the average margin for monocrystalline cells is 5.7 percent higher than for multicrystalline.
On the other hand, a monocrystalline module has an average power output that is 4 to 8 percent higher than a multicrystalline module of the same size and a lower balance-of-system (BoS) cost.
Monocrystalline technology to increase market share in 2015Jessica Jin, Analyst, Solar Supply Chain
Crystalline Cell Production Mono vs. Multi
Source: IHS
0
10%
20%
30%
40%
50%
60%
70%
80%
90%
100%
2015 2014 2013
MulticrystallineMonocrystalline
Top Ten Trends for 2015 | Solar PV | 14
The advantages of monocrystalline prevail for distributed systems, especially on rooftops. Current demand for monocrystalline modules mainly comes from rooftop systems in countries like Japan and the United States to fulfill the requirement of higher output per construction area. In 2014 total rooftop systems installations in Japan and the United States exceeded 10 GW, and are forecast to increase to over 11 GW in 2015.
Monocrystalline capacity expansion Monocrystalline wafer companies robustly expanded production capacity in 2014 and are expected to increase again in 2015. Monocrystalline wafer capacity is currently at 14.1 GW, representing 23.5 percent of total capacity. IHS forecasts this number to increase to 24.4 percent in 2015, with monocrystalline wafer capacity of 16.6 GW.
In the cell sector, Taiwanese manufacturers are gradually shifting their focus from multicrystalline to monocrystalline to capitalize on the technological advantages. Tier-one Taiwanese cell makers are adding monocrystalline cell capacity this year.
Neo Solar Power (NSP) has an annual monocrystalline cell capacity of approximately 600 MW with n-type monocrystalline cells at 20.5 percent efficiency for bifacial module products. Gintech is adding monocrystalline cell capacity close to 500 MW, which will represent 30 percent of its total cell capacity.
Taiwanese cell capacity will reach approximately 28 percent monocrystalline by the end of 2014, and is forecast to increase to 35 percent in 2015.
Obstacles for monocrystalline The market is still dominated by multicrystalline at approximately 75 percent of global production. With more than 70 percent of module capacity in China, Chinese module suppliers prefer to promote multicrystalline in order to consume their own cell capacities, which represent 55 percent of global capacity.
In contrast to distributed systems, utility-scale systems, representing 45 percent of the global market, are dominated by multicrystalline. Thus, there is no
motivation for Chinese module suppliers to move to monocrystalline in the near future.
Although monocrystalline will not threaten multicrystalline domination in the near future, it will steadily gain share, benefiting from growth on rooftop installations as well as increasing demand for higher-efficiency products. IHS forecasts the monocrystalline share of global cell production will increase to 27 percent in 2015, up from 24 percent in 2014.
15 | Solar PV | Top Ten Trends for 2015
SEVEN
IHS expects distributed photovoltaic (DPV) systems—i.e., those sized 100 kilowatts (kW) or smaller—to account for 30 percent of global installations in 2015, with 15.7 GW projected, up from 13.2 GW in 2014. The largest market for these installations in 2015 will be Japan, with DPV accounting for nearly 70 percent of installations, IHS predicts. The U.S. is also forecast to install more than 2.2 GW of DPV in 2015, as net-metering and third-party ownership models continue to drive this market.
Distributed PV has been driven by FiTs and incentivesDPV in Europe has been driven by government incentives, and some of the first major markets to develop did so through residential and small-commercial installations. Feed-in tariffs (FiT) were introduced in several major markets, including Germany, Italy and the U.K. The German FiT in 2010 offered between €0.31-39/kilowatt hour (kWh) for systems up to 100 kW, and installations reached more than 7 GW. Systems up to 100 kW accounted for 60 percent of installations, compared to a predicted 50 percent in 2015.
The FiT in the U.K. was introduced at a very high rate, offering up to £0.43/kWh (€0.54/kWh) as a generation tariff, with an additional rate for exported electricity. Many free-solar companies were established, offering free PV installations for households by leasing the rooftop, with the companies receiving the FiT and the household receiving free electricity. But FiT rates were reduced dramatically in 2012, and many of these companies went out of business. There are now three main drivers for PV up to 100 kW: private installations, social housing schemes and new-build housing.
Financing is offered through installers or distributors, or home improvement loans are used.
In the U.S., third-party ownership and leasing models have helped the DPV market to develop. There is a personal tax credit and a corporate tax credit available, but the majority of installations in the U.S. are completed through large installers that take care of all the financing. As a result, in most cases the corporate tax credit will be claimed through the installer, with large installers able to offer much lower system prices through monetizing the tax credits and through large supply contracts. PV systems are owned by the companies, and consumers pay an agreed PPA price for the electricity consumed. Companies such as SolarCity are leading the way in offering this model of financing for commercial PV systems.
In India there has been very little DPV installed to date. Several states have introduced net-metering schemes, but the main driver for PV remains the National Solar Mission (NSM), which mostly supports utility-scales systems. Several incentives schemes and pilot installation schemes have been introduced for smaller systems, and some small projects have gone ahead.
Meanwhile in China, little DPV has been installed. The official definition of DPV by the government has been changed so that it covers anything under 20 MW. This means that even though IHS predicts DPV in China will grow in 2015, the majority of this will be over 1 MW and categorized as large-commercial and utility-scale systems.
Systems up to 100 kilowatts to account for 30 percent of global installations in 2015Lauren Cook, Analyst, Solar Demand & Supply Chain
Top Ten Trends for 2015 | Solar PV | 16
Solar leasing is becoming an important driver for DPVWith fewer countries now introducing FiTs for DPV and many countries focusing on the development of utility-scale PV, IHS expects more companies to offer financing for DPV, with leasing emerging as an attractive option.
The United States has lead the way for solar leasing, with large companies such as SolarCity and SunRun dominating the market for systems 100 kW and smaller. So far these companies have had limited success outside of North America, but there is potential for the leasing model to be applied in other markets by different companies.
Solar leasing works well in markets where electricity prices are high or likely to increase and where the incentives available for individuals have been limited. The idea has also gained attention in markets where incentives have been reduced for residential and commercial systems alike. In Germany and the U.K., returns on investment remain relatively attractive for PV, although many people are not aware of this, and solar leasing is becoming more popular as it requires less upfront investment.
Development of DPV in new markets is expected to be slow in 2015DPV is gaining increasing focus in the emerging markets, and India has gained attention recently with several state-level schemes announced. While potential for residential PV in India remains limited due to the types of housing and rooftops available, there is an opportunity for commercial systems up to 100 kW, especially as electricity prices increase and electricity security becomes an issue. In particular, solar leasing has the potential to be successful here in the commercial rooftop sector given the higher electricity prices for such properties. A power purchase agreement (PPA) would guarantee electricity prices and energy security for the company, while also allowing savings over the period of the PPA without any upfront costs. Overall, the potential exists for DPV in India, but the latest changes to the NSM remain focused on utility-scale systems. As a result, IHS expects systems under 100 kW to remain in 2015 a small proportion of total installations.
The Chinese government is shifting focus from utility-scale installations to DPV, but its definition includes systems up to 20 MW. There have been some moves by regional governments and PV companies to develop smaller installations, but the DPV market in China is still in the early stages of development and no clear market leaders have emerged. Electricity prices vary greatly by region and by type of consumer, and some flexibility would be needed for a national solar leasing option to be made available. Financing and an understanding of the incentives available can be very complicated, and companies already involved in the market will have a significant advantage. Rooftop ownership is an issue for developing the DPV market in China, especially in the residential sector as large blocks of apartments are common. If a company finds a way to overcome this issue and offer a PV solution for these buildings, a huge boost could be provided to the industry.
In general, huge potential is in store for DPV in both established and emerging markets around the world. Even so, demand next year for DPV will continue to come mostly from established markets, especially for financing models such as solar leasing. These models could work in emerging markets in the future, and the low up-front costs and energy security will help to drive growth. But government policies remain focused on utility-scale systems for the moment and do not help to overcome the issues of rooftop ownership or financing seen in these markets.
17 | Solar PV | Top Ten Trends for 2015
EIGHT
The clock is running down for integrators of large-sized solar systems in Europe, with the expiration of a U.K. incentive program bringing an end to a boom in utility-scale installations and triggering a flurry on consolidation.
The U.K. in 2015 will dominate the utility-scale photovoltaics (PV) landscape in Europe by installing 1.4 gigawatts (GW) of ground-mount systems, primarily under the renewable obligation certificates (ROC) scheme. Although this is a decline of 500 megawatts (MW) from the 1.9 GW worth of utility-scale PV installed in 2014, no other European market is standing up to challenge Britain.
Seizing the opportunity, system integrators from waning European markets have flocked to address U.K. investors’ need for experienced engineering, procurement and construction (EPC) contractors. In the first quarter of 2015, before the ROC scheme expires in April, the sector will be furiously mounting panels and connecting inverters.
On April 1, 2015, the majority of these integrators will have to seek new sources of revenue to stay in business.
EPCs are scouting for new opportunities in EuropeSince the collapse of the Spanish PV market in 2009, the volatility of European PV markets has forced integrators to scout for new opportunities. From Spain to Italy, France, Romania and the U.K., successful companies have entered new markets—and then exited quickly when policy makers have pulled the brakes. Meanwhile, less successful companies have faced insolvency and bankruptcy, sometimes followed by acquisitions, leading to consolidation of the system integrator landscape. In 2015, as the U.K. utility-scale market is set to shrivel in the second quarter, installers of large PV systems will not have any new high-growth market in Europe to go to. Tenders in markets such as Britain, France and Germany will only benefit a select few.
IHS expects the abrupt shift in the U.K. utility-scale market to lead to a new wave of consolidation among European system integrators.
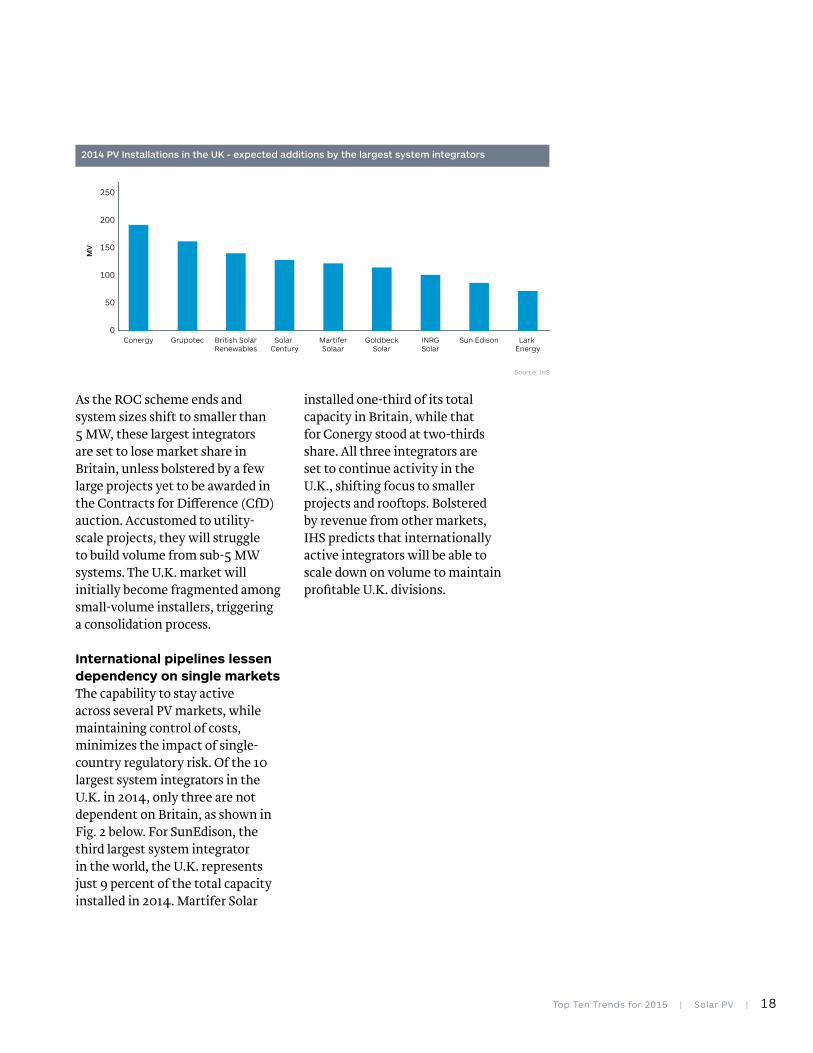
For 2015 the largest EPC companies in the U.K. will be roughly the same as in 2014, as shown in Fig. 1 below. This year Conergy surged in Britain by acquiring the U.K. portfolio of fellow German system integrator Wirsol. Other German companies ranking among the top 10 in 2014 are Goldbeck and the Vogt group. Grupotec, at the No. 2 spot, is the most prominent of the Spanish integrators active in the British market. Martifer Solar and SunEdison are other non-U.K. companies that pursue U.K. portfolios. Four of the top 10 integrators in the U.K. are local: British Solar, Solarcentury, INRG Solar and Lark Energy. In 2015, companies such as German Greenfield Solar and Spanish Bester Generation could enter the ranks of the top 10 integrators in Britain, if their development partners advance on announced pipelines.
Q2 halt to UK utility-scale PV triggers new wave of consolidation among European EPCsJosefin Berg, Senior Analyst, Solar Demand
Top Ten Trends for 2015 | Solar PV | 18
As the ROC scheme ends and system sizes shift to smaller than 5 MW, these largest integrators are set to lose market share in Britain, unless bolstered by a few large projects yet to be awarded in the Contracts for Difference (CfD) auction. Accustomed to utility-scale projects, they will struggle to build volume from sub-5 MW systems. The U.K. market will initially become fragmented among small-volume installers, triggering a consolidation process.
International pipelines lessen dependency on single marketsThe capability to stay active across several PV markets, while maintaining control of costs, minimizes the impact of single-country regulatory risk. Of the 10 largest system integrators in the U.K. in 2014, only three are not dependent on Britain, as shown in Fig. 2 below. For SunEdison, the third largest system integrator in the world, the U.K. represents just 9 percent of the total capacity installed in 2014. Martifer Solar
installed one-third of its total capacity in Britain, while that for Conergy stood at two-thirds share. All three integrators are set to continue activity in the U.K., shifting focus to smaller projects and rooftops. Bolstered by revenue from other markets, IHS predicts that internationally active integrators will be able to scale down on volume to maintain profitable U.K. divisions.
2014 PV Installations in the UK - expected additions by the largest system integrators
Source: IHS
0
50
100
150
200
250
British SolarRenewables
GrupotecConergy
MV
Solar Century
MartiferSolaar
GoldbeckSolar
INRGSolar
Sun Edison Lark Energy
19 | Solar PV | Top Ten Trends for 2015
NINE
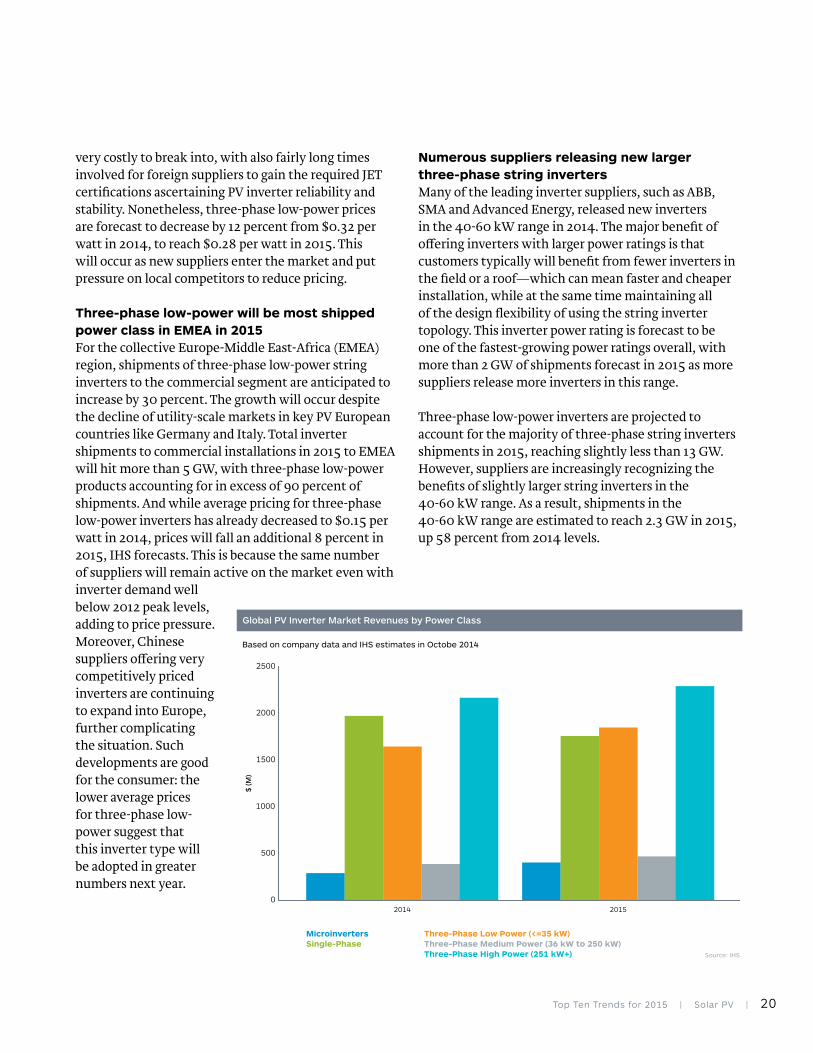
Driven by attractive prices in key PV markets, global revenue for three-phase string inverters is forecast in 2015 to reach more than $2.2 billion, equivalent to one-third of worldwide revenue for the overall market for inverters.
The low prices will allow three-phase string inverters—defined by IHS as inverters with a capacity less than 60 kilowatts (kW)—to increase their penetration rate in both commercial and utility-scale installations.
Estimated shipments next year of three-phase string inverters will exceed 15 GW, up 31 percent from 2014. A surge is expected in important markets like China and Japan, whose combined shipments will account for 7.6 GW of the total.
Large historical shipments of three-phase string inverters in the United States and China imply a bright future for string inverter adoption.For many years, string inverters, rather than large central inverters, have been utilized for major commercial or utility-scale installations in key PV European markets such as Germany and Italy. However, the devices are just starting to be adopted in non-European territories like the United States and China.
In the United States, leading European suppliers including ABB, SMA and Fronius have entered the space, promoting the adoption of three-phase string inverters for commercial rooftop applications. The European influx has had a knock-on effect on local suppliers like Advanced Energy and Solectria, expanding their portfolios to provide three-phase string inverters by either of two means: through acquiring a competitor with a strong presence in the area, or by
partnering with an original equipment manufacturer (OEM) supplier.
In China, the transition to three-phase string technology in place of central inverters has been rapid. In one year alone, shipments of three-phase low-power inverters—inverters possessing less than, or equal, to 35 kW in capacity—climbed from 200 MW in 2013 to more than 3 GW the following year. Despite only recently entering the inverter market, Huawei has been a big advocate of three-phase products, particularly as China moves toward a more distributed photovoltaic (DPV) model instead of ground-mount utility-scale installations. As a result of the surge in shipments to China, pricing in the country for three-phase low-power inverters has decreased by more than 30 percent in 2014. This development, in turn, has enabled three-phase inverters to become very competitive in pricing with large central inverters.
Booming small commercial market in Japan adds to global demand for three-phase string invertersFor Japan, more than 5 GW worth of inverters will be shipped next year to systems smaller than 50 kW in that country. Although many local suppliers are shipping multiple single-phase inverters into the segment for systems smaller than 50 kW, three-phase low-power inverter will account for 2 GW out of the total 5 GW in shipments for 2015, as suppliers release new inverters in this power class. But in contrast to China, three-phase low-power inverter prices in Japan are up four times those of China, given the domination of the Japanese market by local suppliers and Japan’s strong preference for local brands. Because of this, some Western suppliers are hesitant to invest in the Japanese market, a relatively closed space that can be
Three-phase string inverters to account for one-third of global solar inverter revenue in 2015Cormac Gilligan, Senior Analyst, Inverters & BoS
Top Ten Trends for 2015 | Solar PV | 20
very costly to break into, with also fairly long times involved for foreign suppliers to gain the required JET certifications ascertaining PV inverter reliability and stability. Nonetheless, three-phase low-power prices are forecast to decrease by 12 percent from $0.32 per watt in 2014, to reach $0.28 per watt in 2015. This will occur as new suppliers enter the market and put pressure on local competitors to reduce pricing.
Three-phase low-power will be most shipped power class in EMEA in 2015For the collective Europe-Middle East-Africa (EMEA) region, shipments of three-phase low-power string inverters to the commercial segment are anticipated to increase by 30 percent. The growth will occur despite the decline of utility-scale markets in key PV European countries like Germany and Italy. Total inverter shipments to commercial installations in 2015 to EMEA will hit more than 5 GW, with three-phase low-power products accounting for in excess of 90 percent of shipments. And while average pricing for three-phase low-power inverters has already decreased to $0.15 per watt in 2014, prices will fall an additional 8 percent in 2015, IHS forecasts. This is because the same number of suppliers will remain active on the market even with inverter demand well below 2012 peak levels, adding to price pressure. Moreover, Chinese suppliers offering very competitively priced inverters are continuing to expand into Europe, further complicating the situation. Such developments are good for the consumer: the lower average prices for three-phase low-power suggest that this inverter type will be adopted in greater numbers next year.
Numerous suppliers releasing new larger three-phase string inverters Many of the leading inverter suppliers, such as ABB, SMA and Advanced Energy, released new inverters in the 40-60 kW range in 2014. The major benefit of offering inverters with larger power ratings is that customers typically will benefit from fewer inverters in the field or a roof—which can mean faster and cheaper installation, while at the same time maintaining all of the design flexibility of using the string inverter topology. This inverter power rating is forecast to be one of the fastest-growing power ratings overall, with more than 2 GW of shipments forecast in 2015 as more suppliers release more inverters in this range.
Three-phase low-power inverters are projected to account for the majority of three-phase string inverters shipments in 2015, reaching slightly less than 13 GW. However, suppliers are increasingly recognizing the benefits of slightly larger string inverters in the 40-60 kW range. As a result, shipments in the 40-60 kW range are estimated to reach 2.3 GW in 2015, up 58 percent from 2014 levels.
Global PV Inverter Market Revenues by Power Class
Source: IHS
0
500
1000
1500
2000
2500
2014
$ (M
)
Based on company data and IHS estimates in Octobe 2014
2015
Microinverters Single-Phase
Three-Phase Low Power (<=35 kW) Three-Phase Medium Power (36 kW to 250 kW)Three-Phase High Power (251 kW+)
21 | Solar PV | Top Ten Trends for 2015
TEN
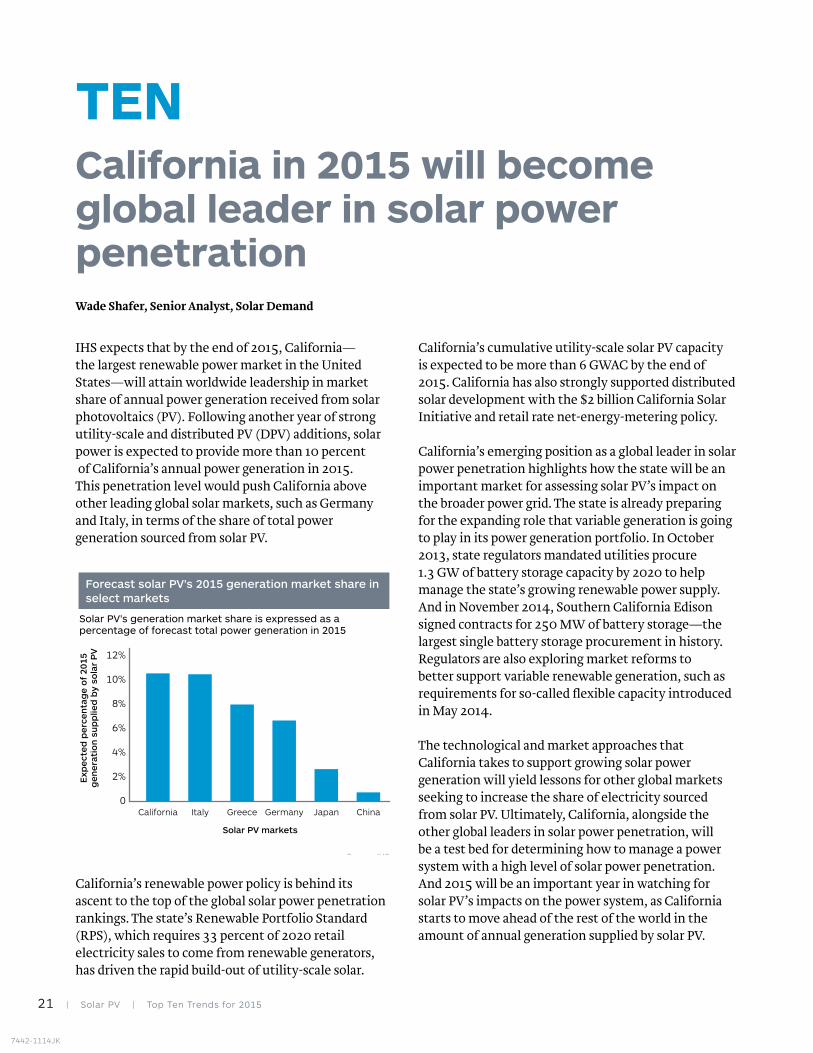
IHS expects that by the end of 2015, California—the largest renewable power market in the United States—will attain worldwide leadership in market share of annual power generation received from solar photovoltaics (PV). Following another year of strong utility-scale and distributed PV (DPV) additions, solar power is expected to provide more than 10 percent of California’s annual power generation in 2015. This penetration level would push California above other leading global solar markets, such as Germany and Italy, in terms of the share of total power generation sourced from solar PV.
California’s renewable power policy is behind its ascent to the top of the global solar power penetration rankings. The state’s Renewable Portfolio Standard (RPS), which requires 33 percent of 2020 retail electricity sales to come from renewable generators, has driven the rapid build-out of utility-scale solar.
California’s cumulative utility-scale solar PV capacity is expected to be more than 6 GWAC by the end of 2015. California has also strongly supported distributed solar development with the $2 billion California Solar Initiative and retail rate net-energy-metering policy.
California’s emerging position as a global leader in solar power penetration highlights how the state will be an important market for assessing solar PV’s impact on the broader power grid. The state is already preparing for the expanding role that variable generation is going to play in its power generation portfolio. In October 2013, state regulators mandated utilities procure 1.3 GW of battery storage capacity by 2020 to help manage the state’s growing renewable power supply. And in November 2014, Southern California Edison signed contracts for 250 MW of battery storage—the largest single battery storage procurement in history. Regulators are also exploring market reforms to better support variable renewable generation, such as requirements for so-called flexible capacity introduced in May 2014.
The technological and market approaches that California takes to support growing solar power generation will yield lessons for other global markets seeking to increase the share of electricity sourced from solar PV. Ultimately, California, alongside the other global leaders in solar power penetration, will be a test bed for determining how to manage a power system with a high level of solar power penetration. And 2015 will be an important year in watching for solar PV’s impacts on the power system, as California starts to move ahead of the rest of the world in the amount of annual generation supplied by solar PV.
California in 2015 will become global leader in solar power penetrationWade Shafer, Senior Analyst, Solar Demand
Source: IHS
0
2%
4%
6%
8%
10%
12%
Exp
ecte
d p
erce
nta
ge
of
2015
gen
erat
ion
su
pp
lied
by
sola
r P
V
Solar PV markets
GreeceItalyCalifornia Germany Japan China
Solar PV’s generation market share is expressed as a percentage of forecast total power generation in 2015
Forecast solar PV’s 2015 generation market share in select markets
7442-1114JK


