

TOURISM BUSINESSES IN AUSTRALIA
June 2011 to June 2015
TOURISM BUSINESSESIN AUSTRALIA

ACKNOWLEDGMENTS
Tourism Businesses in Australia, June 2011 to June 2015 is the fourth report in a series that estimates the number of businesses
in the Australian tourism industry. The methodology was developed by Tourism Research Australia with data derived from ABS’
publication ‘Count of Australian Businesses Entries and Exits’ (ABS Cat. No. 8165.0).
Tourism Research Australia
Australian Trade and Investment Commission (Austrade)
25 National Circuit, Forrest ACT 2603
Email: [email protected]
Web: www.tra.gov.au
Publication date: July 2016
This work is licensed under a Creative Commons Attribution 3.0 Australia licence. To the extent that copyright subsists in third party
quotes and diagrams it remains with the original owner and permission may be required to reuse the material.
This work should be attributed as Tourism Businesses in Australia, June 2011 to June 2015, Tourism Research Australia, Canberra
Inquiries regarding the licence and any use of work by Tourism Research Australia are welcome at [email protected]
Cover image: Guided walk, Moss Garden, Carnarvon Gorge National Park, QLD, Image courtesy of Tourism Australia/ Amber Toms.

CONTENTS
1. INTRODUCTION ..................................................................................1
2. KEY FINDINGS ....................................................................................3
3. AUSTRALIA’S BUSINESSES (TOURISM & NON-TOURISM) ......................4
4. STATE AND TERRITORY TOURISM BUSINESSES ....................................5
5. THE INDUSTRIES THAT MAKE UP TOURISM .........................................9
6. HOW ARE TOURISM BUSINESSES PERFORMING? ...............................11
7. CONCLUSION ....................................................................................12
8. METHODOLOGY ................................................................................13
9. REFERENCES ....................................................................................14

iv
TABLES
TABLE 1: TOTAL CHANGE IN TOURISM BUSINESS COUNTS,
JUNE 2015 ON JUNE 2011 ........................................................................4
TABLE 2: INDUSTRIES WITH THE MOST TOURISM BUSINESSES .................9
TABLE 3: BUSINESS COUNTS BY EMPLOYMENT SIZE IN
TOURISM INDUSTRIES, JUNE 2015..........................................................10
FIGURES
FIGURE 1: TOURISM AND NON-TOURISM BUSINESSES BY SIZE,
CHANGE JUNE 2015 COMPARED TO JUNE 2011 ........................4
FIGURE 2: TOURISM BUSINESSES BY STATE AND TERRITORY,
JUNE 2015 ...............................................................................5
FIGURE 3: PERCENTAGE CHANGE IN TOURISM BUSINESSES
BY STATE AND TERRITORY, JUNE 2015 COMPARED
TO JUNE 2011 ..........................................................................6
FIGURE 4: STATE-WIDE DISTRIBUTION OF VISITORS AND TOURISM
BUSINESSES INCLUDING AVERAGE SPEND PER VISITOR,
2014–15 ..................................................................................8
FIGURE 5: PERCENTAGE SHARE OF BUSINESSES AND GROSS
REVENUE BY SIZE, 2014–15 ...................................................11

TOURISM BUSINESSES IN AUSTRALIA TOURISM RESEARCH AUSTRALIA1
1. INTRODUCTION
This report examines the stability and health of Australia’s
tourism industry through changes in the number of businesses
within the industry. It also includes business counts by:
employment size
small – includes non-employing (or self-employed),
micro (1 to 4 employees), and small (5 to 19
employees)
medium (employing 20 to 199 persons)
large (employing 200 or more persons)
industry type
location (state, territory and tourism region)
financial performance.
The stock of all actively trading businesses in Australia is
reported, from June 2011 through to June 2015. Business
counts are sourced and derived from the Australian Bureau
of Statistics’ (ABS) Business Register (ABSBR) (unpublished
data) (ABS 2016a). The ABS also releases the publication
Counts of Australian Businesses, including Entries and Exits,
June 2011 to June 2015 (ABS Cat. No. 8165.0).

2
TRA.GOV.AU
TOURISM BUSINESSES IN AUSTRALIA: JUNE 2015
OF THE TOTAL
2.1 MILLION BUSINESSES IN AUSTRALIA
273,512TOURISM BUSINESSES IN AUSTRALIA
13%}
QLDREGIONAL: 19,915 (39%)
CAPITAL CITIES: 31,361 (61%)ALL AREAS: 51,276
ACTREGIONAL: 0 (N/A)
CAPITAL CITY: 3,629 (100%)ALL AREAS: 3,629
TASREGIONAL: 3,010 (52%)CAPITAL CITY: 2,808 (48%)ALL AREAS: 5,818
VICREGIONAL: 22,989 (32%)CAPITAL CITY: 49,680 (68%)ALL AREAS: 72,669
SAREGIONAL: 6,011 (33%)CAPITAL CITY: 12,050 (67%)ALL AREAS: 18,061
WAREGIONAL: 5,355 (20%)CAPITAL CITY: 20,811 (80%)ALL AREAS: 26,166
NTREGIONAL: 749 (36%)CAPITAL CITY: 1,317 (64%)ALL AREAS: 2,066
DISTRIBUTION OF TOURISM BUSINESSES
205,879 NON-EMPLOYING AND
MICRO BUSINESSES(0-4 PEOPLE)
53,076 SMALL BUSINESSES
(4-19 PEOPLE)
14,557 MEDIUM AND LARGE
BUSINESSES
(MORE THAN 20 PEOPLE)
6.2% 3.9% 7.5%
NSWREGIONAL: 33,763 (36%)
CAPITAL CITY: 59,867 (64%)ALL AREAS: 93,630
REGIONAL CAPITAL CITIES

TOURISM BUSINESSES IN AUSTRALIA TOURISM RESEARCH AUSTRALIA3
2. KEY FINDINGS
AUSTRALIA’S TOURISM BUSINESSES Tourism businesses made up 13 per cent (around
273,500) of the total 2.1 million businesses in Australia in
June 2015. Around 95 per cent of these businesses were
non-employing, micro (1 to 4 employees), or small (5 to 19
employees) businesses.
Tourism ranks second among all industries in Australia
in terms of number of businesses – the Construction
services industry comes in first, holding 16 per cent of total
businesses in Australia.
Despite only holding around a 5.0 per cent share of
total tourism businesses, Australia’s medium and large
businesses contributed two-thirds (66 per cent) of total
tourism revenue in Australia during 2014–15.
Between 2010–11 and 2014–15, visitor nights
and visitor spending in Australia grew by an
average annual rate of 3.8 per cent and
4.1 per cent, respectively.
BUSINESS NUMBERS With the exit rate of non-employing and micro businesses
(-6.2 per cent) exceeding the entry rate of new businesses
(+4.6 per cent) in June 2015 compared to June 2011,
there has been a net reduction in the number of
businesses operating in the industry.
Compared to June 2011, the number of tourism businesses
in June 2015 declined by around 11,000 (or 3.8 per cent).
This decline represented the majority (96 per cent) of the
total decline in businesses generally in Australia over the
same period.
The decline in tourism businesses was mainly influenced
by falling numbers in:
non-employing and micro (employing 0 to 4 persons)
businesses between June 2011 and June 2013 (down
6.6 per cent)
non-employing businesses between June 2013 and
June 2015 (down 1.3 per cent).
However, the decrease in the number of non-employing
businesses has been offset by a gradual increase in the
number of employing businesses. This was due to strong
growth in visitor nights and spending which motivated
tourism businesses to take on more employees.
BUSINESS DISTRIBUTION In June 2015, the majority (80 per cent) of tourism
businesses in Australia were located in three states: New
South Wales, Victoria and Queensland. The contribution of
these states to Australian Tourism Gross Domestic Product
(GDP) was 78 per cent in 2013−14.
Despite two-thirds of total tourism businesses being located
in capital cities, 45 cents in every visitor dollar was spent
in regional areas. This is due to a larger volume of visitors
in regional areas (especially domestic day and domestic
overnight visitors), and means that the smaller proportion
(34 per cent) of total businesses that are located in regional
areas hold a larger proportion of total visitor spending.
However, average visitor spend (for both international and
domestic visitors) is higher in capital city tourism regions for
most states and territories.
RECENT STRUCTURAL CHANGES TO TOURISM BUSINESSES The tourism industry is transitioning through a process of
structural consolidation, especially over the last two years.
During 2013–14 and 2014–15, around 1,500 non-employing
businesses exited the industry. At the same time, around
3,800 micro, small, medium and large businesses entered the
industry resulting in a net gain of around 2,300 businesses.
This repositioning of tourism businesses coincides with
additional visitor expenditure in Australia of around $4.9 billion
in 2014–15 (up 4.3 per cent) compared to 2013–14.
Image: NOOSA International Food & Wine Festival 2013 Image courtesy of John Montesi and Tourism Australia

4
3. AUSTRALIA’S BUSINESSES (TOURISM & NON-TOURISM)
FIGURE 1: TOURISM AND NON-TOURISM BUSINESSES BY SIZE, CHANGE JUNE 2015 COMPARED TO JUNE 2011
TOURISM
BUSINESSES
NON-TOURISM
BUSINESSES
NON-EMPLOYING
116,748
8.5%
1,167,867
0.9%
MICRO
(1-4 PEOPLE)
89,131
3.1%
495,613
1.2%
SMALL
(4-19 PEOPLE)
53,076
3.9%
144,088
2.4%
MEDIUM
(19-199 PEOPLE)
13,832
7.1%
37,163
2.1%
LARGE
(200+ PEOPLE)
725
16.9%
2,992
2.7%
ALL EMPLOYING
156,764
0.1%
679,856
1.5%
ALL BUSINESSES
273,512
3.8%
1,847,723
– 0
At June 2015, there were around 273,500 tourism businesses
operating in Australia. Of these, 57 per cent (or 156,800
businesses) were employing businesses, and 43 per cent (or
116,700 businesses) were non-employing businesses.
For the same period, tourism businesses were more likely than
non-tourism businesses to employ staff (57 per cent compared
to 37 per cent, respectively), which reflects the labour intensive
nature of the tourism industry (Figure 1).
The changing patterns within the tourism industry reflects
some movement away from non-employing tourism
businesses, towards employing tourism businesses (Figure 1).
This process is an indicator of improving business conditions.
Source: Derived using ABS Business Register (unpublished) data (ABS Cat. No. 8165.0).
Note: Tourism businesses in this table are unconfidentialised estimates obtained from the ABS.
Between June 2011 and June 2015, there was a reduction in
the number of trading businesses nationally (Table 1).
The declines were particularly significant for tourism
businesses, driven mainly by non-employing and micro
businesses:
Around 10,800 of the tourism businesses leaving the
industry were non employing, while around 2,900 were
micro businesses.
However, the decline in micro businesses was fully offset
by increases in the number of small, medium and large
tourism businesses.
There was a total loss of around 10,700 tourism businesses
between June 2011 and June 2015, which represented
around 96 per cent of the total decline in all Australian
businesses.
Declines, however, were less severe for non-tourism
businesses:
All of the non-tourism businesses that left the industry
(around 10,600) were non employing businesses, largely
offset by an increase in employing businesses (around
10,100).
There was a total loss of around 500 non-tourism
businesses between June 2011 and June 2015.
TABLE 1: TOTAL CHANGE IN TOURISM BUSINESS COUNTS, JUNE 2015 ON JUNE 2011
Tourism businesses
Non-tourism businesses
Non-employing businesses
10,826 10,582
Employing businesses
Micro 2,868 5,871
Small 1,974 3,378
Medium 915 778
Large 105 78
Total employing 126 10,105
Total
10,700 477
Source: Derived by TRA using ABS Business Register (unpublished) data (ABS Cat. No. 8165.0).

TOURISM BUSINESSES IN AUSTRALIA TOURISM RESEARCH AUSTRALIA5
4. STATE AND TERRITORY TOURISM BUSINESSES
In June 2015, tourism businesses at state and territory level
were distributed as follows:
Around 80 per cent of total tourism businesses in Australia
were located in New South Wales (34 per cent, or 93,300
businesses); Victoria (27 per cent, or 72,800 businesses);
and Queensland (19.1 per cent, or 52,200 businesses).
Western Australia and South Australia shared 15.9 per cent
of total tourism businesses – Western Australia,
9.6 per cent (26,200 businesses); and South Australia,
6.4 per cent (17,400 businesses).
The remaining 4.2 per cent of total tourism businesses
were represented by Tasmania, 2.1 per cent (5,700
businesses); the Australian Capital Territory, 1.3 per cent
(3,600 businesses); and the Northern Territory, 0.8 per
cent (2,100 businesses).
More than half of tourism businesses in each state and territory
were employing businesses (Figure 2).
The largest proportion of employing businesses was in the
Northern Territory (64 per cent of total tourism businesses).
The lowest proportion of employing businesses was in
New South Wales, Victoria and South Australia (57 per cent
each).
FIGURE 2: TOURISM BUSINESSES BY STATE AND TERRITORY, JUNE 2015
0
10,000
20,000
30,000
40,000
50,000
60,000
70,000
80,000
90,000
100,000
NSW VIC QLD WA SA TAS ACT NTN
UM
BER
OF B
USI
NES
SES
(‘000
)
Employing Non-employing
93,292
72,818
52,241
26,21117,381
5,695 3,594 2,131
Source: Derived by TRA using ABS Business Register (unpublished) data (ABS Cat. No. 8165.0).
Image: Sydney, NSW Image courtesy of Anson Smart and Tourism Australia

6
Non-employing and micro businesses are generally the first to react to changes in economic conditions, simply due to their size and basic management structures. A downturn in economic conditions can lead to restructure or even business closure, as these entities do not have the ability to restructure according to the changes in demand and supply forces.
FIGURE 3: PERCENTAGE CHANGE IN TOURISM BUSINESSES BY STATE AND TERRITORY, JUNE 2015 COMPARED TO JUNE 2011
-20
-15
-10
-5
0
5
10
15
20
NT
SA
-12
-10
-8
-6
-4
-2
0
2
4VIC
-10
-5
0
5
10
15
QLD
-15
-10
-5
0
5
NSW
-10
-5
0
5
10
ACT
-15
-10
-5
0
5
10
15
NON-EMPLOYING
MICRO
SMALL
MEDIUM AND LARGE
WA
-10
-5
0
5
10
15
TAS
-15
-10
-5
0
5
10
Source: Derived by TRA using ABS Business Register (unpublished) data (ABS Cat. No. 8165.0).
When economic conditions improve, however, these businesses tend to take on more employees and consequently become larger entities. All states/territories – except the ACT – reported declines in tourism businesses across both non-employing and micro categories, while in the ACT, growth occurred in all categories of employing businesses (Figure 3).

TOURISM BUSINESSES IN AUSTRALIA TOURISM RESEARCH AUSTRALIA7
Most tourism businesses (66 per cent, or approximately
181,500 businesses) were located in capital cities and the
Gold Coast, with the following states having the highest capital
city concentration:
Western Australia – 80 per cent of tourism businesses were
located in Perth
Victoria – 68 per cent were located in Melbourne
South Australia – 67 per cent were located in Adelaide.
Tasmania was the only state where more than half
(52 per cent) of total tourism businesses were located in
regional areas.
Tourism is a demand-driven industry, defined by the nature
of the products that visitors consume during their trip to a
destination. However, non-visitors (e.g. residents) also consume
the same tourism products. This means that a tourism
business is more likely to benefit from a location that is shared
by both visitors and non-visitors (resident population). This is
quite clear from the results presented in Figure 4.
Despite the fact that around two-thirds of total tourism
businesses were located in capital cities (except for Tasmania),
a significant percentage of total day visitors (61 per cent) and
total overnight visitors (64 per cent) travelled to regional areas
in 2014–15. The higher volume of visitors to regional areas
led to a higher spend per tourism business than in capital city
tourism regions. However, average spend per international and
domestic visitor was higher in capital city tourism regions than
in regional areas for most states and territories:
Average spend per visitor was around 66 per cent and
38 per cent higher in capital cities than in regional areas for
both domestic overnight travellers and international visitors,
respectively.
Average spend per international visitor ranged from
3.9 per cent higher in Hobart and the South region to
149 per cent in Adelaide tourism region when compared to
their respective regional areas.
Similar to international visitor spend, average spend per
overnight visitor in all capital city tourism regions (except for
Queensland) was also much higher than their respective
regional areas, ranging from as low as 18 per cent in
Hobart and the Southern region to as high as 123 per cent
in Melbourne tourism region.
However, there were some exceptions to the usual pattern
of higher average spend in capital city tourism regions
and tourism business concentration. For example, in
Queensland and the Northern Territory, average spend
per international visitor was lower in the capital cities
than in regional areas by 2.6 per cent and 7.0 per cent,
respectively.
Another exception was Tasmania, where average spend
per international and overnight visitor was higher in capital
city tourism regions, but less than half (48 per cent) of total
tourism businesses were located in the capital city tourism
region.
Image: True North, The Kimberley, WA Image courtesy of Tourism Australia

8
TOURISM
BUSINESSES
SHARE %
DAY VISITORS OVERNIGHT INTERNATIONAL
Visitor
share
(%)
Average
expenditure
per visitor
Visitor
share
(%)
Average
expenditure
per visitor
Visitor
share
(%)
Average
expenditure
per visitor
NSW
Capital city $104 $712 $2,170 Regional
area $117 $497 $1,166
VIC
Capital city $113 $828 $2,412 Regional
area $96 $372 $1,005
QLD
Capital city $96 $713 $1,493Regional
area $37 $676 $1,532
SA
Capital city $112 $817 $1,920 Regional
area $96 $427 $770
WA
Capital city $101 $865 $2,489 Regional
area $122 $693 $1,442
TAS
Capital city $100 $804 $1,120 Regional
area $115 $682 $1,078
NT
Capital city $163 $1,449 $1,239 Regional
area $142 $944 $1,333
ACT
Capital city $176 $594 $2,017 Regional
area - - -
AUS
Capital city $108 $777 $2,981 Regional
area $108 $563 $1,792
CAPITAL CITY
REGIONAL AREA
Note: Pie charts denote share of visitors who visit capital and regional areas.
FIGURE 4: STATE-WIDE DISTRIBUTION OF VISITORS AND TOURISM BUSINESSES INCLUDING AVERAGE SPEND PER VISITOR, 2014-15
TOURISM BUSINESSES IN AUSTRALIA TOURISM RESEARCH AUSTRALIA9
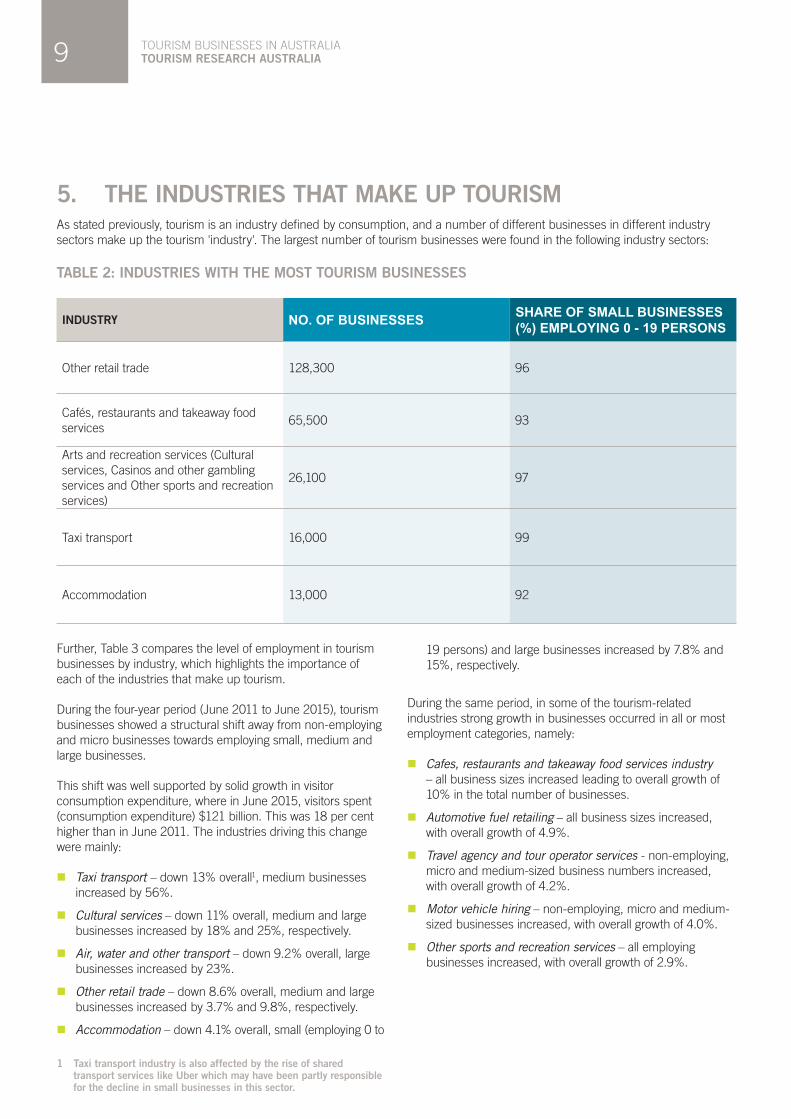
5. THE INDUSTRIES THAT MAKE UP TOURISMAs stated previously, tourism is an industry defined by consumption, and a number of different businesses in different industry
sectors make up the tourism 'industry'. The largest number of tourism businesses were found in the following industry sectors:
TABLE 2: INDUSTRIES WITH THE MOST TOURISM BUSINESSES
INDUSTRY NO. OF BUSINESSES SHARE OF SMALL BUSINESSES (%) EMPLOYING 0 - 19 PERSONS
Other retail trade 128,300 96
Cafés, restaurants and takeaway food
services65,500 93
Arts and recreation services (Cultural
services, Casinos and other gambling
services and Other sports and recreation
services)
26,100 97
Taxi transport 16,000 99
Accommodation 13,000 92
Further, Table 3 compares the level of employment in tourism
businesses by industry, which highlights the importance of
each of the industries that make up tourism.
During the four-year period (June 2011 to June 2015), tourism
businesses showed a structural shift away from non-employing
and micro businesses towards employing small, medium and
large businesses.
This shift was well supported by solid growth in visitor
consumption expenditure, where in June 2015, visitors spent
(consumption expenditure) $121 billion. This was 18 per cent
higher than in June 2011. The industries driving this change
were mainly:
Taxi transport – down 13% overall1, medium businesses
increased by 56%.
Cultural services – down 11% overall, medium and large
businesses increased by 18% and 25%, respectively.
Air, water and other transport – down 9.2% overall, large
businesses increased by 23%.
Other retail trade – down 8.6% overall, medium and large
businesses increased by 3.7% and 9.8%, respectively.
Accommodation – down 4.1% overall, small (employing 0 to
1 Taxi transport industry is also affected by the rise of shared transport services like Uber which may have been partly responsible for the decline in small businesses in this sector.
19 persons) and large businesses increased by 7.8% and
15%, respectively.
During the same period, in some of the tourism-related
industries strong growth in businesses occurred in all or most
employment categories, namely:
Cafes, restaurants and takeaway food services industry
– all business sizes increased leading to overall growth of
10% in the total number of businesses.
Automotive fuel retailing – all business sizes increased,
with overall growth of 4.9%.
Travel agency and tour operator services - non-employing,
micro and medium-sized business numbers increased,
with overall growth of 4.2%.
Motor vehicle hiring – non-employing, micro and medium-
sized businesses increased, with overall growth of 4.0%.
Other sports and recreation services – all employing
businesses increased, with overall growth of 2.9%.

10
TABLE 3: BUSINESS COUNTS BY EMPLOYMENT SIZE IN TOURISM-RELATED INDUSTRY SECTORS, JUNE 2015
Non- employing businesses
Employing businesses Total businesses
Total change on June 2011 (%)
Micro Small Medium LargeTotal
employing
'000 %
Accommodation 5.9 3.2 2.9 0.9 0.1 7.0 13.0 4.1
Cafés, restaurants
and takeaway food
services
15.7 26.6 18.8 4.2 0.2 49.8 65.5 9.9
Clubs, pubs,
taverns and bars2.1 1.9 3.1 1.9 0.1 7.0 9.1 0.1
Rail transport 0.0 0.0 0.0 0.0 0.0 0.0 0.0 0.0
Taxi transport 14.8 1.0 0.2 0.1 0.0 1.2 16.0 12.72
Air, water and
other transport4.7 1.9 0.7 0.3 0.1 3.0 7.7 9.6
Motor vehicle
hiring1.0 0.3 0.1 0.0 0.0 0.5 1.5 4.0
Travel agency
and tour operator
services
2.3 2.2 0.8 0.2 0.0 3.1 5.4 4.2
Cultural services 11.2 2.2 0.4 0.2 0.0 2.7 14.0 11.3
Casinos and other
gambling services0.5 0.7 0.2 0.0 0.0 0.9 1.4 8.6
Other sports and
recreation services5.1 3.4 1.7 0.6 0.0 5.7 10.8 2.9
Automotive fuel
retailing1.1 1.5 1.3 0.2 0.0 3.0 4.1 4.9
Other retail trade 54.2 45.2 23.3 5.3 0.3 74.1 128.3 8.6
Total tourism
industries118.7 90.0 53.4 14.0 0.8 158.1 273.5 3.8
2
2 Taxi transport industry is also affected by the rise of shared transport services like Uber which may have been partly responsible for the decline in small businesses in this sector.
Source: Derived by TRA using ABS Business Register (unpublished) data (ABS Cat. No. 8165.0).

TOURISM BUSINESSES IN AUSTRALIA TOURISM RESEARCH AUSTRALIA11
6. HOW ARE TOURISM BUSINESSES PERFORMING?Over the 2010–11 and 2014–15 period, the number of total
visitors increased at an average annual rate of 2.2 per cent,
while visitor nights grew by 3.8 per cent. A greater number of
domestic and international visitors resulted in tourism product
consumption increasing almost $18.7 billion, from $103 billion
to $121 billion. Tourism’s contribution to Australia’s GDP
increased 17.9 per cent (or $7.2 billion) during this period from
$40.3 billion in 2010–11 to $47.5 billion in 2014–15.
Tourism – like most other industries – was dominated by small
businesses in June 2015, while the remaining share was
distributed between medium and large businesses. However,
this small percentage of medium and large businesses
accounted for two-thirds (66 per cent) of total revenue
generated by tourism businesses (Figure 5)
FIGURE 5: PERCENTAGE SHARE OF BUSINESSES AND GROSS REVENUE BY SIZE, 2014-15
SHARE OF TOURISM
BUSINESSES
SHARE OF GROSS
REVENUE
34%
24%
42% SMALL BUSINESSES
MEDIUM BUSINESSES
LARGE BUSINESSES
95%5%
0.2%
Source: Derived by TRA using revenue data from the ABS publication, Australian Industry (ABS Cat. No. 8155.0) and ABS Business Register (unpublished) (ABS Cat. No. 8165.0).

12
7. CONCLUSIONWith the exit rate of non-employing and micro businesses
(-6.2 per cent) exceeding the entry rate of new businesses
(4.6 per cent) in June 2015 compared to June 2011, there has
been a net reduction in the number of businesses operating
in the industry. However, the most significant change is the
subsequent increase in the number of small, medium and
large businesses with a combined increase of 4.6 per cent
since 2011.
Over the years, strong growth in visitor numbers and the
related increase in visitor expenditure has encouraged micro
and non-employing entities to strengthen their business base
and employ more people. Consequently, the structure of the
tourism industry has evolved from micro and non-employing
business into small, medium and large businesses. This
structural transformation within the industry provides it with the
resilience and capacity required to support the volumes growth
in tourism that is currently happening and in the future. The
latest TRA forecasts expect that between 2014–15 and 2019–
20, international visitor expenditure will rise by 11 per cent to
reach $56 billion, and domestic visitor spend will rise by
5.5 per cent to reach $97 billion (TRA 2016).
The structural transformation within the industry has had some
positive outcomes, particularly for small businesses (employing
less than 19 persons), where revenue per business rose by
2.6 per cent annually on average between 2010–11 and
2014–15.
Despite only 34 per cent of all tourism businesses being
located outside of the capital cities, 45 cents in every tourism
dollar is spent in regional Australia. Although average spend
per visitor in regional areas is less than in capital cities in most
states and territories, the volume of visitors to the regional
areas was much higher when compared to the capital cities.
This highlights the importance of developing targeted strategies
to make regional areas more accessible to visitors, especially
the high spending international visitors. This is particularly
relevant in mining states where businesses are transitioning
from catering to the needs of the mining industries to those of
the tourism industry. Continued development of strategic policy
and investment initiatives (including those concerning tourism-
related infrastructure), is also required to support business
growth in regional Australia.
Image: NOOSA International Food & Wine Festival 2013 Image courtesy of John Montesi and Tourism Australia

13
8. METHODOLOGYThe methodology used in this report applies a narrower
definition of tourism industries in Australia than classified in the
ABS’ Tourism Satellite Account (TSA) (ABS 2016b). To avoid
an over representation of businesses in tourism, (TRA) does
not report on the tourism industries that contributed less than
5.0 per cent to the individual industry’s GVA. These industries
also contained large numbers of businesses:
1. Ownership of dwellings, consisting mainly of the many
small residential property owners in Australia. This
industry’s contribution to total GVA represents
2.7 per cent, and there were around 54,600 actively
trading businesses in June 2015.
2. Other road transport, consisting mainly of private freight
services. This industry has a reliance on tourism of 2.9
per cent, and there were around 48,800 actively trading
businesses in June 2015.
3. Education and training, which is more reliant on non-
tourists (Australian resident students or overseas students
who are undertaking a course for longer than one year)3.
This sector has a 4.8 per cent reliance on tourism. In
June 2015, there were around 23,700 actively trading
businesses.
3 This does not comply with international tourism standards (please refer to www.unwto.org)
Image: Sydney Hotels Image courtesy of Tourism Australia

TOURISM BUSINESSES IN AUSTRALIA TOURISM RESEARCH AUSTRALIA14
9. REFERENCESAustralian Bureau of Statistics 2016a, Count of Australian
Businesses, Including Entries and Exits, Catalogue No. 8165.0,
ABS, Canberra.
Australian Bureau of Statistics 2016b, Australian National
Accounts, Tourism Satellite Accounts 2014−15, Catalogue No.
5249.0, ABS, Canberra.
Australian Bureau of Statistics 2016c, Australian Industry,
Catalogue No. 8155.0, ABS, Canberra.
Tourism Research Australia 2016, Tourism Forecasts 2016,
Tourism Research Australia, Canberra.
United Nations Statistical Division, Statistical Office of the
European Communities, Organisation for Economic Co-
operation and Development, World Tourism Organization
(UNWTO), Tourism Satellite Account: Recommended
Methodological Framework, 2008, Luxemburg, Madrid, New
York, Paris: United Nations.
Image: Coral Bay, Ningaloo Marine Park Image courtesy of Tourism Australia

TO
UR
ISM
BU
SIN
ES
SE
S IN
AU
STR
ALIA
| June 2
01
1 to
June 2
01
5

i
APPENDIX A: GLOSSARYBUSINESS: A business is generally considered to be a person,
partnership, or corporation engaged in business or commerce.
BUSINESS CONSOLIDATION: Occurs when small businesses
grow in employment size and, as a result, change from one
business category to another based on employment size.
CAPITAL CITIES AND REGIONAL AREAS: Capital cities refer
to the eight capital cities of Australia plus the Gold Coast. Areas
other than these capital cities are considered regional areas.
CONFIDENTIALISATION: When publishing data which are
highly disaggregated (SA2 level), it is necessary to suppress
the data cells which contain very small counts to prevent the
potential identification of individual businesses. This process
is known as confidentialisation and can lead to data that differ
from the estimates once aggregated. For example, counts
at the tourism region level are the sum of counts at the SA2
level. Thus confidentialisation at the SA2 level could result in
different business counts to the actual number at the tourism
region level.
EMPLOYING BUSINESSES: Employing businesses are split
into four employment sizes - Micro (1-4 employees); Small (5-
19 employees); Medium (20-199 employees) and Large (200+
employees).
GROSS REVENUE: The value of output produced during a
period before paying for any expenses.
INDUSTRY CLASS: The Australian and New Zealand Standard
Industrial Classification (ANZSIC) structure comprises four
levels, of which industry class is the finest level. Activities
are narrowly defined within the industry class level, which is
identified by a four-digit code, e.g. Industry Class 1510, Pulp,
paper and paperboard manufacturing. Usually, an activity is
primarily defined to one class. However, some activities may be
primary to more than one class.
INDUSTRY DIVISION: The structure of ANZSIC comprises four
levels, of which industry division is the broadest level. The main
purpose of the industry division level is to provide a limited
number of categories which give a broad overall picture of the
economy. There are 19 divisions within ANZSIC.
INDUSTRY SUBDIVISION: This is the broadest level category
within each industry division of ANZSIC and is identified by
a two-digit code, e.g. Industry Subdivision 14, Wood product
manufacturing. Industry subdivisions are built up from industry
groups which, in turn, are built up from industry classes.
NON-EMPLOYING BUSINESSES: Non-employing businesses
are the businesses in the Australian Taxation Office Maintained
Population (ATOMP) that have not remitted Business Activity
Statement (BAS) data for their Income Tax Withdrawal (ITW)
role for five consecutive quarters prior to the reference period.
Such businesses include self-employed people such as
taxi drivers and takeaway or grocery shop owners who do
not employ people other than themselves, but possess an
Australian Business Number (ABN).
TOURISM BUSINESS: Business related to an industry
classified as a tourism industry in the National Tourism Satellite
Account (ABS Cat. No. 5249.0). Since it is difficult to allocate
a part of a business that serves tourists as opposed to non-
tourists, all businesses in a tourism industry are considered
tourism businesses.
TOURISM GROSS DOMESTIC PRODUCT (GDP): Tourism
Gross Value Added (GVA) plus net taxes on products that
are attributable to the tourism industry (tourism net taxes on
products).
TOURISM GROSS VALUE ADDED (GVA): The value of tourism
output at basic prices, less the value of the inputs used in
producing these tourism products.
VISITOR CONSUMPTION: The sum of money paid by visitors
to retailers in the process of buying tourism goods and services
plus value of the goods and services consumed by visitors but
paid by any other person on the visitor’s behalf. For example,
cost to a friend or family member when a visitor stays with
them; cost to the government for a visitor’s free entry to a
museum or art gallery.
VISITOR EXPENDITURE: The sum of money paid by visitors to
retailers in the process of buying tourism goods and services.


