

A high-throughput screen for teratogens using human
pluripotent stem cells
Journal: Toxicological Sciences
Manuscript ID: TOXSCI-13-0670.R1
Manuscript Type: Research Article
Date Submitted by the Author: 09-Oct-2013
Complete List of Authors: Kameoka, Sei; Hoffmann-La Roche, Non-Clinical Safety Babiarz, Josh ; Hoffmann-La Roche, Non-Clinical Safety Kolaja, Kyle; Hoffmann-La Roche, Non-Clinical Safety Chiao, Eric; Hoffmann-La Roche, Non-Clinical Safety
Key Words: In Vitro and Altenatives, alternatives to animal testing < In Vitro and Altenatives, embryonic stem cells < In Vitro and Altenatives,
Developmental/Teratology < Reproductive & Developmental Toxicology
Society of Toxicology Specialty Section Subject Area:
In Vitro and Alternative Methods [114]
Toxicological Sciences ToxSci Advance Access published October 23, 2013 at N
ational University of Singapore on N
ovember 30, 2013
http://toxsci.oxfordjournals.org/D
ownloaded from

Title Page
A high-throughput screen for teratogens using human pluripotent stem cells
Sei Kameoka, Joshua Babiarz, Kyle Kolaja, and Eric Chiao*.
*Early and Investigative Safety, Nonclinical Safety, Hoffmann-La Roche, Nutley, New Jersey
07110, USA
* To whom correspondence should be addressed. Express delivery address: Eric Chiao,
Biogen Idec, 14 Cambridge Center, Bld. 6, Cambridge, MA 02142
Page 1 of 34 Toxicological Sciences
123456789101112131415161718192021222324252627282930313233343536373839404142434445464748495051525354555657585960
at National U
niversity of Singapore on Novem
ber 30, 2013http://toxsci.oxfordjournals.org/
Dow
nloaded from

Abstract
There is need in the pharmaceutical and chemical industries for high-throughput human
cell-based assays for identifying hazardous chemicals, thereby reducing the overall reliance
on animal studies for predicting the risk of toxic responses in humans. Despite instances of
human-specific teratogens such as thalidomide, the use of human cell-teratogenicity assays
has just started to be explored. Herein, a human Pluripotent Stem cell Test (hPST) for
identifying teratogens is described, benchmarking the in vitro findings to traditional preclinical
toxicology teratogenicity studies and when available to teratogenic outcomes in humans.
The hPST method employs a 3-day monolayer directed differentiation of human embryonic
stem cells. The teratogenic risk of a compound is gauged by measuring the reduction in
nuclear translocation of the transcription factor SOX17 in mesendodermal cells. Decreased
nuclear SOX17 in the hPST model was strongly correlated with in vivo teratogenicity.
Specifically, 71 drug-like compounds with known in vivo effects, including thalidomide, were
examined in the hPST. A threshold of 5 µM demonstrated 94% accuracy (97% sensitivity
and 92% specificity). Furthermore, 15 environmental toxicants with physicochemical
properties distinct from small molecule pharmaceutical agents were examined and a
similarly strong concordance with teratogenicity outcomes from in vivo studies was observed.
Finally, to assess the suitability of the hPST for high-throughput screens, a small library of
300 kinase inhibitors was tested, demonstrating the hPST platform’s utility for interrogating
teratogenic mechanisms and drug safety prediction. Thus, the hPST assay is a robust
predictor of teratogenicity and appears to be an improvement over existing in vitro models.
Page 2 of 34Toxicological Sciences
123456789101112131415161718192021222324252627282930313233343536373839404142434445464748495051525354555657585960
at National U
niversity of Singapore on Novem
ber 30, 2013http://toxsci.oxfordjournals.org/
Dow
nloaded from

Keywords
teratogenicity, developmental toxicity, pluripotent stem cell, thalidomide, SOX17, high
throughput screening.
Introduction
The disruption of embryonic development leading to malformation of a developing
offspring is a devastating adverse drug response. Currently, due in part to a lack of robust
alternative methods, the FDA requires several animal studies to assess the risk of
reproductive and embryo-fetal developmental harm prior to the approval of a new drug that
would be exposed to women of child bearing potential (Bailey et al., 2009). However,
reproductive toxicology studies are often conducted late in the drug development process
where unexpected positive results are most costly. Furthermore, the animal studies do not
obviate concerns related to teratogens that are uniquely harmful to human fetal development,
but not the animal species tested (Shuey and Kim, 2011). Beyond the realm of drug
development, recent EU regulations have mandated toxicity testing for high production
volume chemicals and eventually lower production volume chemicals. Some estimate that in
order to fully comply with these regulations, at least 30,000 compounds would need to be
tested at an overwhelming and likely unrealized cost of more than 1 billion euros (Hartung
and Rovida, 2009). Therefore, new high-throughput alternatives are needed in a number of
fields that can be used to aid in selecting the safest compounds for further development or
prioritizing the highest risk chemicals for follow-up investigation (Basketter et al., 2012).
A method for assessing a compound’s teratogenic risk using mouse embryonic stem
(mES) cells was pioneered by the laboratory of Hans Spielman (Seiler and Spielmann, 2011;
Spielmann et al., 1997). This method, which was one of the first applications of pluripotent
stem cells in toxicology, is referred to as the mouse Embryonic Stem Cell Test, or mEST.
The mEST entails the spontaneous embryoid body differentiation for ten days after which
beating cardiomyocytes can be observed. The teratogenic risk is assessed by use of a
statistical prediction model that compares the concentrations of drug that exhibit 50%
inhibition of beating embryoid bodies, 50% cytotoxicity of the mouse ES cells and the
concentration inducing cytotoxicity in a mouse differentiated fibroblast line tested in parallel
(Seiler and Spielmann, 2011). This original method, while landmark in its application of stem
cell differentiation to infer developmental toxicity, has limitations such as the relatively long
length of the assay, the labor-intensive methods required for the differentiating the cells, the
qualitative nature of scoring “beating” embryoid bodies, and moderate accuracy of the
statistical prediction model (Marx-Stoelting et al., 2009).
Since the original publication describing the mEST, many independent labs have
sought to improve the in vitro method for assessing teratogenic risk. Most efforts focused on
Page 3 of 34 Toxicological Sciences
123456789101112131415161718192021222324252627282930313233343536373839404142434445464748495051525354555657585960
at National U
niversity of Singapore on Novem
ber 30, 2013http://toxsci.oxfordjournals.org/
Dow
nloaded from
increasing the assay complexity, perhaps based on the assumption that a more complex in
vitro system would improve the predictivity of the assay by reflecting additional aspects of
the biological complexity of human gestation. For example, attempts to improve the mouse
EST have included employing toxicogenomic analysis to the standard cardiomyocyte
differentiation protocol (Hewitt et al., 2010; Pennings et al., 2011; van Dartel et al., 2010),
transcriptional profiling of 12 genes (Panzica-Kelly et al., 2013), adding additional
differentiated cell types such as endothelial cells or bone cells to the assay (Buesen et al.,
2009; Festag et al., 2007; zur Nieden et al., 2010). Although some of these methods have
increased the predictivity, improvements have often been at the expense of assay
throughput.
The efforts to develop a human pluripotent stem cell (hPSC) based teratogenicity
screen (referred to as the hPST) described herein began with the optimization of a three day,
chemically defined, directed differentiation of a monolayer of hPSCs in a 96-well plate format.
In contrast to some of the previous studies mentioned above, the hPST employs a
seemingly counter-intuitive approach: shortening the stem cell differentiation duration by 3
fold and quantitating protein expression of a single lineage marker, SOX17, as the primary
endpoint. In order to gauge utility of the hPST for addressing the needs of both the
pharmaceutical and the chemical industries, 71 drug-like compounds with known in vivo
effects and 15 environmental toxicants were tested with hPST system. Finally, a small
molecule library of 300 kinase inhibitors was tested to assess the suitability of the hPST in a
high-throughput screening setting. Together, these data suggest the hPST assay can be a
robust predictor of teratogenicity and appears to be an improvement over existing in vitro
models.
Page 4 of 34Toxicological Sciences
123456789101112131415161718192021222324252627282930313233343536373839404142434445464748495051525354555657585960
at National U
niversity of Singapore on Novem
ber 30, 2013http://toxsci.oxfordjournals.org/
Dow
nloaded from

MATERIALS and METHODS.
Cell culture.
All cell culture was performed at 37oC, 5% CO2. Absence of mycoplasma contamination was
routinely confirmed by MycoAlert Detection Kit (#LT07-118, Lonza). Human ES cell lines H9
(from WiCell) and LSJ-1 (obtained from Stanford University) were thawed in mTeSR1
medium (#05850, StemCell Technologies) with 5 µM Y-27632 dihydrochloride (#1254,
Tocris). 3 million cells were plated in a 100mm cell culture dish (#430293, Corning) pre-
coated with ES cell-qualified Matrigel (#354277, BD Bioscience). Y-27632 was included only
during seeding and removed within 24 hours after seeding. mTeSR media was changed
every 1 or 2 days. Cells were routinely passed by Dispase (#07923, StemCell Technologies).
Cells typically reached near-confluence within 5-6 days.
Directed mesendoderm differentiation.
For all 96 well plate manipulations, liquid handling was performed by CyBi-Well 96-well
Channel Simultaneous Pipettor with 250 DW tips. For differentiation of H9 cells, when cells
were about 50% confluent they were dissociated by Accutase (#07920 Stemcell
Technologies) and seeded on Matrigel-coated Black/Clear-bottom 96 well plates (#353948,
BD Biosciences) in mTeSR1 with 5 µM Y-27632 at a density of 10,000 cells/well. Y-27632
was added only during seeding. Media was changed every day. When cells reach ~40%
confluency in the 96-well format (usually between 36-72 hours after seeding), the plates
were washed with 100 µl/well PBS four times (each wash was done by shaking the plate at
650rpm for 3 min by Eppendorf MixMate) and cultured for 24 hours in differentiation media I
containing Advanced RPMI Medium 1640 (#12633-012, Invitrogen), 2mM L-Glutamine
(#25030-081, Invitrogen), 80ng/ml human Activin A (#338-AC-050, R&D Systems), 20ng/ml
human Wnt3a (#5036-WN-010, R&D Systems), 80 units/ml-0.08 mg/ml Penicillin-
Streptomycin (P0781, Sigma) with testing compound dissolved in a DMSO final
concentration of 1%. At 24 hours, cells were washed with PBS two times, and cultured in
differentiation media II containing Advanced RPMI Medium 1640, 2mM L-Glutamine, human
80ng/ml Activin A, 0.1% FBS (#10438-026, Invitrogen) and Penicillin-Streptomycin with
testing compound. At 72 hours from the seeding (48 hours from addition of differentiation
media II), cells were washed with PBS three times at 650 rpm (Eppendorf MixMate), fixed
with 4% Formaldehyde Solution (#28908, Thermo) for 15 minutes, washed with PBS once,
and then kept in immunofluorescence blocking solution containing PBS with 10% donkey
serum (#S30-100ML, Millipore), 2% Sheep serum (#S22-100ml, Millipore) 0.2% Triton X-100
(#T8787, Sigma), 1% BSA (#A9576-50ML, Sigma) for 1-2 days at 4oC.
Page 5 of 34 Toxicological Sciences
123456789101112131415161718192021222324252627282930313233343536373839404142434445464748495051525354555657585960
at National U
niversity of Singapore on Novem
ber 30, 2013http://toxsci.oxfordjournals.org/
Dow
nloaded from
For differentiation of LSJ-1, all procedures were performed in the above described manner
with the exceptions that the concentration of Activin A was 40 ng/ml for both 0h and 24h time
point, and that Wnt3a was 0.2ng/ml.
hPST Assay quality control.
Obtaining a robust, consistent differentiation (40-50% of cell population showing SOX17+
nuclei at Day 3) is critical. A suboptimal level of differentiation ( > 70% or < 20% SOX17+
cells) results in technical challenges including higher signal/noise ratio for image analysis
and/or variable IC50 values. Differentiation conditions can vary depending on the pluripotent
stem cell line, sub-line, passage number, and/or experimental batch of cells. Thus it is critical
to optimize and control factors such as seeding density, growth factors concentration, and
differentiation length to effectively establish the optimal conditions for each experiment.
Cell morphology and confluency was checked every day by microscopy or Cellavista
microplate analyzer (Roche Applied Science) during preparation and differentiation phases
of the experiment and plates with a growth rate that showed 50% more or less than normal
doubling time was not used for further analysis. Normal doubling time was the rate observed
when the particular line of cell stock was made. All plates had at least 6 wells of controls
treated with 5 µM SB-431542 (Fig. 1D) and 2 columns (12 wells) of vehicle control treated
with 1% DMSO. All plates included serial dilutions of two reference compounds (usually
imatinib and thalidomide). Any plate which does not comply with the following criteria was
not used for analysis. (1) Average of SOX17+/DAPI+ (%) in 12 wells of DMSO control is
between 25 and 60%, and standard deviation is less than 10%. (2) Imatinib SOX17-IC50 is
between 5 and 20 µM. (3) Thalidomide SOX17-IC50 is less than 5 µM. Once fully optimized
and quality controlled frozen stocks were established, failure rate for a 96-well plate was less
that 20%.
Immunofluorescence.
For the hPST, cells were incubated with human SOX17 NL557 affinity purified goat
polyclonal antibody (#NL1924R, R&D Systems) diluted 1:20 in blocking solution for 3 hours
at 4oC with shaking at 600 rpm for 1 min every hour. The antibody solution was filtered
through 0.22 µm filter (#SLGP033RS, Millipore) before use to remove precipitate which can
interfere with image analysis. After 3 hours, plates were washed twice with blocking solution,
and twice with PBS containing 0.1% Triton X-100 (each wash performed at 650rpm for 5 min
(Eppendorf MixMate), and then 35 µl/well of SlowFade Gold antifade reagent with DAPI
(#S36938, Invitrogen) was added and stored at 4oC.
For other immunofluorescence assays, the following antibodies were used at the described
dilution: T-brachyury, NL557-conjugated, 1:20 (#AF2085R, R&D Systems); OCT4, 1:100
Page 6 of 34Toxicological Sciences
123456789101112131415161718192021222324252627282930313233343536373839404142434445464748495051525354555657585960
at National U
niversity of Singapore on Novem
ber 30, 2013http://toxsci.oxfordjournals.org/
Dow
nloaded from
(#ab19857, Abcam); NANOG, 1:10 (AF1997, R&D Systems); SOX2, 1:20, NL493-
conjugated (#NL20181G, R&D Systems); EOMES, 3ug/ml (#AF6166, R&D Systems);
FOXA2, 1:400 (#ab40874, abcam); Alexa 488 Donkey Anti-Sheep IgG, 1:500 (#A-11015,
Invitrogen); Alexa 488 Donkey Anti-rabbit IgG, 1:500 (#A-21206, Invitrogen); Alexa 488
Donkey Anti-goat IgG, 1:500 (#A-11055, Invitrogen). All primary antibodies were incubated
for 2-3 hours at 4oC and secondary antibodies were incubated for 1.5 hours at 4oC.
Microscopy and image data analysis.
Microscopy was performed using a Zeiss Axio Observer Z1 fluorescence imaging system
with Hamamatsu ORCA-ER digital camera C4742-80. To define the background level, 6
wells on each plate were treated with 5 µM SB-431542 which inhibits mesendoderm
differentiation by 100% without affecting DAPI+ cell number, and the average of the 6 wells
was used as the background level for that particular plate. The adjusted value (Raw -
Background) was used to determine IC50. High Content platform measurements were
performed by Thermo Scientific Cellomics ArrayScan VTI HCS Reader. The number of
SOX17+ nuclei was counted with 549 nm channel using 4 fields per well. For DAPI and
Alexa488 measurement, 386 nm and 485 nm channel were used respectively. Curve fit
analysis and IC50 determinations were performed by GraphPad Prism.
RNA isolation and quantitative RT-PCR.
RNA was isolated by TaqMan Gene Expression Cells-to-CT Kit (#AM1728, Invitrogen). Real
Time quantitative RT-PCR was performed on TaqMan OpenArray RT PCR custom plates
(#4456262, Life Technologies) and assessed with OpenArray NT Cycler (Life Technologies,
Grand Island, NY) . Ct values of the genes of interest were normalized to the housekeeping
gene peptidylprolyl isomerase A (cyclophilin A or PPIA).
Compounds.
All compounds were stored in a DMSO stock solution, and dissolved in media immediately
before each experiment. Compounds with known poor solubility and/or whose cLogP > 5
were not selected for the study. All compounds used for hPST were internally synthesized at
Hoffmann-LaRoche except following compounds: 6-Amino-nicotinamide (L06692, Alfa-
Aesar), All-trans Retinoic Acid (554720, Calbiochem), Caffeine (27600, Sigma), CH5424802
(CT-CH542, ChemieTek), Chlorophacinone (45390,Sigma), Clopyralid (36758,Sigma),
Crizotinib (4368/10, R & D Systems), Cyproconazol (46068,Sigma), Diniconazole
(46049,Sigma), Dinoseb (45453,Sigma), Diquat dibromide (45422,Sigma), Dorsomorphin
(P5549, Sigma), Esomeprazole (E7906, Sigma), Fluazinam (34095,Sigma), Flusilazole
Page 7 of 34 Toxicological Sciences
123456789101112131415161718192021222324252627282930313233343536373839404142434445464748495051525354555657585960
at National U
niversity of Singapore on Novem
ber 30, 2013http://toxsci.oxfordjournals.org/
Dow
nloaded from

(45753,Sigma), Hexaconazole (34348,Sigma), Hexazinone (36129,Sigma), Imazamox
(34227,Sigma), Imazapyr (37877,Sigma), KH CB19 (4262/1, R & D Systems),
Methyldopa (1426002, US Pharmacopeia/USPC), o-Phenylphenol (45529,Sigma), Penicillin
(P7794, Sigma), Saccharin (S6047, Sigma), Streptomycin (S9137, Sigma), Thiacloprid
(37905,Sigma), TG003 (4336/50, R & D Systems), Triclopyr (32016,Sigma).
Page 8 of 34Toxicological Sciences
123456789101112131415161718192021222324252627282930313233343536373839404142434445464748495051525354555657585960
at National U
niversity of Singapore on Novem
ber 30, 2013http://toxsci.oxfordjournals.org/
Dow
nloaded from

Results
Optimizing a three day monolayer differentiation for rapid compound screening
Mesendoderm differentiation occurs at the beginning of gastrulation, one of the first
steps of germ layer specification and organogenesis (Murry and Keller, 2008). As in many
established directed differentiation methods (Kroon et al., 2008; Murry and Keller, 2008),
differentiation is driven by a combination of recombinant growth factors: the Nodal pathway
was activated by the addition of Activin A and the Wnt pathway by Wnt3a.
Directed differentiation was monitored using immunostaining for well-established
endoderm markers SOX17 and FOXA2, mesoderm markers EOMES and T-brachyury, and
pluripotency markers (OCT4, SOX2, and NANOG) (Fig. 1A, B, C, E, Fig. S1, Table S1). On
Day 0 before differentiation, ~100% of cells were pluripotent cells and thus positive for OCT4,
SOX2, NANOG, while no expression of SOX17, T-brachyury, EOMES were detected.
Following the initiation of directed differentiation, pluripotency markers gradually decreased,
with about 30% of cells showing SOX2 and OCT4 on day 3, while SOX17, FOXA2, T-
brachyury, and EOMES expression increased. Simultaneous staining experiments revealed
that a majority (>90%) of SOX17+ cells at day 3 were also positive for EOMES (Fig. 1C,
Table S1) and T-brachyury (Data not shown), suggesting that this cell population is
mesendoderm rather than strictly definitive endoderm. SOX17 was selected as the marker of
mesendoderm differentiation status for the hPST assay because of the highest signal-to-
noise ratio for this analyte, which could be attributed to the antibody specificity to SOX17 as
well as the specificity of the SOX17 nuclear translocation event. Thus, the predictive value of
SOX17 nuclear translocation for assessing teratogenic risk was estimated by examining the
effects of known teratogens on mesendoderm formation, using the differentiation protocol
depicted in Figure 2A.
hPST screening assay performance with 71 pharmaceutical compound validation set
For the initial experiment, 71 small molecule pharmaceutical-like compounds were
tested using the human ES cell line H9. All 71 compounds had existing in vivo data that
interrogated the compound’s teratogenic potential. 37 compounds were commercially
available and 34 compounds were in-house compounds. The 34 in-house compounds all
have been tested in GLP preclinical Segment 2 teratogenicity studies. For these molecules,
a compound was considered positive for teratogenic risk if the observed finding in the animal
study concluded either: (1) the concentration of compound that demonstrated overt embryo
toxicity was lower than the concentration that resulted in maternal toxicity or (2) fetal visceral
dysmorphogenesis (beyond minor skeletal defects or delays in ossification) were observed.
Page 9 of 34 Toxicological Sciences
123456789101112131415161718192021222324252627282930313233343536373839404142434445464748495051525354555657585960
at National U
niversity of Singapore on Novem
ber 30, 2013http://toxsci.oxfordjournals.org/
Dow
nloaded from

Of the 37 commercially available compounds, 20 were classified based on their FDA labels,
5 from the ECVAM mEST training set classification, and 12 based on in vivo assessments of
their teratogenic risk as found in published literature. For compounds where FDA labeling
was available, if the FDA pregnancy category indicated on the drug product label was either:
C (animals studies demonstrated an adverse effect on the fetus, no conclusive human
studies), D (positive evidence of human fetal risk, but the benefit outweighs the risk) or X
(positive evidence of human fetal risk, not for use in pregnant women) the compounds were
considered positive. Compounds were deemed negative for teratogenic risk if the FDA
labeling was either A (animal and well controlled studies in humans failed to demonstrate
risk of fetal harm) or B (animals studies failed to demonstrate teratogenic risk, no adequate
studies have been completed in pregnant women). A complete list of these compounds
along with their FDA pregnancy category labeling or in vivo effects is provided in Table 1
and the more detailed Table S4 that also contains the literature references used.
The 71 pharmaceutical compounds with in vivo preclinical data were tested for their
ability to disrupt the directed differentiation of human ES cell line H9. Initially, the
combination of three markers that delineate mesendoderm, SOX17, EOMES, and T-
brachyury, were examined by immunostaining, followed by quantification via fluorescence
microscopy. However it was determined that SOX17 alone provided sufficient predictive
value (Table S5, S6). Thus, subsequent experiments relied solely on SOX17 nuclear
staining. The interpolated concentration of test compound that resulted in 50% inhibition of
the measured lineage marker relative to DMSO control (IC50) was calculated for each test
compound (Fig. 2C). In addition, the concentration where a 50% reduction in cell number to
control for cytotoxicity and cytostasis was determined using DAPI staining (TC50). The
compound-specific IC50 and TC50 values were plotted to enable the assessment of the in
vivo/in vitro assay correlation (Fig. 3). Using an IC50 of 30 µM as the sole class threshold
results in 94% accuracy (97% sensitivity and 92% specificity) for predicting the risk of
teratogenicity (Fig. 3, Table 1, 2). Depending on the test compound, the IC50 may reflect
either a compound-specific reduction of differentiation as measured by SOX17 protein
without a reduction in cell number, such as that observed following thalidomide treatment
(Fig. 2B), or a reduction in the number of adherent cells due to either cell death or
detachment, such as that observed following diethylstilbestrol treatment (Table 1,
Compounds R13 and R22, respectively). Using the number of adherent viable cells alone, as
judged by TC-50, as the teratogenicity predictor, results in reduced accuracy (83%) and
misclassifies compounds such as thalidomide and retinoic acid, highlighting the importance
of measuring a differentiation end point like SOX17 nuclear translocation. To test whether
these observations were cell line specific, a second human embryonic stem cell line, LSJ-1
Page 10 of 34Toxicological Sciences
123456789101112131415161718192021222324252627282930313233343536373839404142434445464748495051525354555657585960
at National U
niversity of Singapore on Novem
ber 30, 2013http://toxsci.oxfordjournals.org/
Dow
nloaded from

from Stanford University, was used to test a subset consisting of 18 compounds from the
validation set, resulting in similar concordance (Fig. S3, Table S2).
Molecular analysis of disruptions in signaling pathways following thalidimide and miansarin
treatment
To test the hypothesis that the observed predictivity of the hPST reflected underlying
changes in drug–specific effects relevant to the in vivo effects, changes in the major
signaling pathways that guide fetal development were examine by qPCR following treatment
with two compounds that impair different aspects of fetal development. The potent
teratogenic effects of thalidomide resulting in phocomelia (limb shortening and loss) were
attributed to inhibitory effects on vasculogenesis (Melchert and List, 2007). Mianserin has
been reported to alter neural development in a whole mouse embryo culture model with
15/21 of embryos treated with 10uM for 48hrs exhibiting neural tube defects, forebrain/nasal
prominence hypoplasia, defects in maxillary and mandibular arches and eye lens
invagination (Lauder et al., 2000).
Following the treatment of cells with either 5 µM thalidomide or mianserin, (Fig. 4A)
the changes in mRNA expression panel of 600 signal transduction genes were determined.
Analysis of the largest fold decreases in expression were consistent with drug-specific
effects (Fig. 4B). Specifically, thalidomide treatment resulted in decreases in the expression
of FZD8 and WNT5B, two gene involved in limb development and VEGFA which is involved
in vascular development. In contrast, treatment with mianserin changed genes affecting
neural development such as GSC and ID2. These findings support the hypothesis that
measuring the disruption of the single lineage marker SOX17 can reflect a broad range of
drug-specific effects that alter signaling pathways important for proper embryonic
development.
Examination of non-pharmaceutical chemicals
Next, the performance of the hPST assay was tested with environmental
contaminants including insecticides, herbicides, fungicides, and rodenticides. Due to the lack
of discrete standards similar to the FDA pregnancy categories for assessing teratogenic risk
of pharmaceuticals, compound with Lowest Effect Level for developmental effects (dLEL) <
50 mg/kg were regarded as “positives” and dLEL > 200 mg/kg as “negatives.” Similar
arbitrarily determined thresholds were used in previous development toxicity study of
pesticides (Kleinstreuer et al., 2011a). To avoid inconsistency across studies using different
route of administration, the dLEL was determined from oral dose studies only. By these
Page 11 of 34 Toxicological Sciences
123456789101112131415161718192021222324252627282930313233343536373839404142434445464748495051525354555657585960
at National U
niversity of Singapore on Novem
ber 30, 2013http://toxsci.oxfordjournals.org/
Dow
nloaded from
criteria, 15 test compounds were identified representing diverse chemical structures,
functions, and molecular weights (170 - 465Da); 6 compounds with low risk for teratogenicity,
and 9 compounds considered potential teratogens (Table 3). Using the threshold of 35 µM
SOX17-IC50, hPST predicted 13 out of 15 pesticides correctly, for an overall accuracy of
87% (Table 4).
Proof-of concept HTS of a 300 compound kinase inhibitor library
To assess the feasibility of using the hPST as high-throughput screening platform
and to identify putative pathways whose perturbation may increase the risks of teratogenic
effects, a library of ~300 kinase inhibitors was screened (Fig. 5). 302 small chemical kinase
inhibitors with targets covering a majority of the human kinome were tested at single
concentration of 5 µM (Fig. S4). The standard deviation from 20 DMSO controls was 5.1%
for DAPI+ cell number (Fig. 5A) and 7.3% for SOX17+ cell number corresponding to Z-
factors of .79 and .77, respectively, supporting the robustness of the hPST assay in high-
throughput setting (Zhang et al., 1999).
Compounds that selectively reduced SOX17 in the absence of cytotoxicity were
selected for further examination. As a secondary screen, 10 compounds that that did not
reduce DAPI+ cells (ie: were not cytotoxic at the concentration tested) yet decreased
SOX17+ cells more than 90% (red column Fig. 5B) were tested in the independent LSJ-1
cell line. Following a broad dose response curve determination (1 -100 µM), 5 out of the 10
compounds identified in the primary screen exhibited a clear SOX17 IC50 value below the
DAPI TC50 value in the secondary screen, demonstrating qualitatively similar effects
between the two independent cell lines (Fig. 5C).
Analysis of Kinase target of inhibitors that promote mesendoderm differentiation
Because compounds that increase the efficiency and robustness of directed
differentiation of hPSCs towards endoderm-derived tissues such as liver and pancreas could
be of value to regenerative medicine applications, the top hits from the kinase library that
increased SOX17 expression were also examined further (Borowiak et al., 2009; Zhang et
al., 2012; Zhu et al., 2009). Among the 302 compounds tested, 6 compounds (R41 to R46)
increased the number of SOX17+ cells by more than 60% (7 times the standard deviation of
the DMSO controls) in both H9 and LSJ-1 cells (Table 5). Based on the DiscoveRx
KinomeScan in vitro assay, all 6 compounds are predicted to be relatively selective kinase
inhibitors, inhibiting between 1 to 15 kinases (data not shown). Analysis of the specific
kinase targets that increased the number of SOX17+ cells at Day 3 was performed. Because
some kinases were more frequently targeted by library compounds than others (for example,
Page 12 of 34Toxicological Sciences
123456789101112131415161718192021222324252627282930313233343536373839404142434445464748495051525354555657585960
at National U
niversity of Singapore on Novem
ber 30, 2013http://toxsci.oxfordjournals.org/
Dow
nloaded from

GAK is targeted by 116 compounds while TBK1 is targeted by only one compound), a
likelihood of candidate being a true target was estimated by the ratio of the number of
compounds that inhibited the kinase observed to the frequency in the library or
hypergeometric distribution (Table 6). Phosphoinositide 3-kinase (PI3K), Cdc-like Kinase 4
(CLK4) and Anaplastic lymphoma kinase (ALK) were enriched in the set of compounds that
increased SOX17+ cells during the primary screen. Consistent with this result, PI3K
inhibitors have been shown to increase endoderm differentiation in a previous study
(McLean et al., 2007).
ALK and CLK4 inhibition was further tested with additional specific kinase inhibitors.
CLK1-4 are expressed in wide range of cell types including ES cells, embryoid bodies,
blastocysts, and endoderm-derived organs, while ALK was detected in embryoid bodies but
not in ES cells (data not shown and NCBI EST profile). None of the 8 additional ALK
inhibitors tested increased SOX17+ cells significantly (Fig. 6A), suggesting that ALK is
unlikely the sole target mediating the increase observed in the primary screen. However, all
four CLK4 inhibitors tested, TG003 (Muraki et al., 2004), KH CB19 (Fedorov et al., 2011),
and internal compounds R57 and R58 increased SOX17+ cells by at least 50% (7 times SD
of DMSO control), which was more than a positive control LY294002 (Fig. 6B). CLK4,
appears to be the primary target mediating the increased SOX17+ cells since TG003 and
KH CB19 lack CLK3 and CLK2 inhibitor activity respectively (Anastassiadis et al., 2011;
Fedorov et al, 2011) and R59, which inhibits CLK1,2,3 but not CLK4, did not increase
SOX17+ cells (Fig. 6B, Table S7). Together, these data are consistent with the hypothesis
that within the hPST differentiation protocol, the inhibition of CLK4 promotes the
differentiation towards SOX17+ cells. Further work would be required to determine if CLK4
inhibition could be an effective means for more efficiently generating endoderm tissues.
Discussion Human cell based assays are needed to improve drug safety. Teratogenic risk
assessment is an area where human cell based assays may be of particular value. Another
human pluripotent based cell assay was recently described using metabolomics as the
discriminating variable (Kleinstreuer et al., 2011b). In this study, H9 human ES cells were
treated with compounds for three days in mTESR culture media that is designed to maintain
the ES cells in a pluripotent state. With this method, a total of 34 compounds were examined
resulting roughly 70-80% prediction of reproductive toxicity.
Several other groups have employed transcriptomic analysis of differentiating human
ES cells as a means to predict teratogenicity. Mayshar, et al. and Meganathan et al both
Page 13 of 34 Toxicological Sciences
123456789101112131415161718192021222324252627282930313233343536373839404142434445464748495051525354555657585960
at National U
niversity of Singapore on Novem
ber 30, 2013http://toxsci.oxfordjournals.org/
Dow
nloaded from

performed transcriptome profiling of human ES cells spontaneously differentiated in
embryoid bodies in the presence of human teratogens (Mayshar et al., 2011; Meganathan
et al., 2012). Both groups found treatment specific transcriptional changes, supporting the
feasibility of the human ES cell system for detecting human teratogen-specific effects.
However, these studies were limited to a small number of compounds and did not identify a
single profile capable of distinguishing a broad panel of teratogens. Recently, a European
research consortium, ESNATS, aimed at developing human ES cell systems for testing
developmental neurotoxicity and reproductive toxicity, reported their comparison of four
protocols using the H9 human ES cell line (Krug et al., 2013). One of the protocols was a
standard 14 day embryoid body differentiation and the other three protocols were directed
differentiations towards neural lineages. For these studies, the ESNATS groups examined
the transcriptomes following treatments with either valproic acid or methyl mercury. Although
each treatment group gave rise to unique global transcriptional changes, analysis of the
transcription factor binding sites revealed a large overlap between the two treatment groups,
suggesting common master transcription regulators may play an important role in the
observed compound-specific responses.
The hPST system described here employed a directed differentiation of human ES
cells towards the first stage of organogenesis and examines the expression of a single
critical transcription factor that guides early embryonic developmental decisions. The use of
SOX17 protein was chosen primarily for pragmatic purposes as the anti-SOX17 antibody
exhibited the highest signal-to-noise ratio (5 to 10 fold) and lowest inter-experimental (both
plate-to-plate and day-to-day) variance. In our hands, the expression levels of T-brachyury
varied greatly among cell populations within a single well and the fluorescence intensity of
EOMES and FOXA2 was lower due to lower level of proteins and/or lower avidity of antibody.
Similar compound dependent changes in other transcription factors essential to the
maintenance of pluripotency (NANOG, OCT4, SOX2) and early germ layer specification (T-
brachyury, EOMES) were observed in the hPST context (data not shown). Therefore, we
hypothesize that interrogation of the compound effects during the very first 72 hours of
differentiation via single cell quantification of a key regulator of early germ layer specification
may be more important than the specific use of SOX17. Furthermore, it may be that
examination of protein expression instead of mRNA regulation adds to the sensitivity of the
assay since we have observed that the detection of mRNA changes often lags behind
changes observed in protein levels. For instance, upon differentiation, loss of OCT4 protein
can be observed prior to changes in OCT4 mRNA (data not shown).
Given the complexity and duration of human gestation, it may be a surprise that such
a short assay would have predictivity for a broad selection of known teratogens. This may be
explained by the broad transcriptional competence of undifferentiated pluripotent cells. As
Page 14 of 34Toxicological Sciences
123456789101112131415161718192021222324252627282930313233343536373839404142434445464748495051525354555657585960
at National U
niversity of Singapore on Novem
ber 30, 2013http://toxsci.oxfordjournals.org/
Dow
nloaded from
differentiation and development proceeds, lineage specification is accompanied by
restriction of the transcriptional competence of tissue specific genes (Fig. S5). Thus,
examining the very first stages of differentiation allows the interrogation the broadest milieu
of signaling pathways. In contrast, an assay based on examining many separate terminally
differentiated lineages may compound the cumulative false detection rate and decrease the
assays throughput.
Based on the findings with the 71 compounds tested, the hPST high predictivity did
not rely on knowledge of the in vivo exposure of the drugs in question. For high-throughput
safety screens to be effectively employed early in the drug development process, precise
knowledge of in vivo potency or in utero exposure levels cannot be a requirement. Clearly,
determining the fetal exposures (either total or extrapolated free fraction) in vivo is not a
routine or straightforward task. Nevertheless, if true or calculated exposure levels are
available, an additional risk assessment evaluation can occur by estimating safety margins
for individual compounds in question on a case-by-case basis.
The abbreviated duration of the hPST combined with analysis of the single lineage
marker increases the theoretical throughput while maintaining sufficient predictive value for
ultimate goal of prioritizing compounds and chemicals for further drug development or safety
assessments. One potential use for the hPST may be to help prioritize which production
volume chemicals or environmental contaminants to prioritize for assessment in definitive
reproductive toxicity animal studies. For instance, these compounds could be rapidly
screened a single concentration such as 5 µM and compounds that showed no cytotoxicity
yet selectively decreased SOX17 by greater than 50% versus DMSO controls could be
prioritized for further study. Such chemicals may pose greatest risk of selective
developmental toxicity in the absence of overt maternal toxicity, similar to thalidomide.
Although the quantitation SOX17 protein nuclear localization as the single endpoint
of the hPST assay is straightforward, achieving robust and reproducible baseline
differentiation conditions was not trivial. This required extensive optimization of growth factor
treatments and large master banks of quality controlled cryopreserved cells. This may be
due to stochastic factors involved in human ES cell differentiation or inherent passage-to-
passage and line-to-line variability. Nevertheless, with protocol optimizations, adaptation of
this method to other human pluripotent cell lines, including induced pluripotent stem cell lines
should be possible. When adapting the assay to the LSJ-1 cell line, we observed that the
concentration of WNT3A added needed reduced to 0.1 ng/ml. If LSJ-1 cells were treated
with WNT3A concentrations used for H9 differentiation (20 ng/ml), the SOX17 was often
expressed in 100% of the cells and the assay no longer provided an adequate level of
sensitivity. Thus critical assay components such as concentrations and duration of growth
factor treatments to generate mesendoderm must be carefully determined. To assist in the
Page 15 of 34 Toxicological Sciences
123456789101112131415161718192021222324252627282930313233343536373839404142434445464748495051525354555657585960
at National U
niversity of Singapore on Novem
ber 30, 2013http://toxsci.oxfordjournals.org/
Dow
nloaded from

assay quality control, we typically used thalidomide, SB-431542, and imatinib as reference
compounds for a monitor of sensitivity. Although 40-60% differentiation was chosen as the
starting point for these studies, since the method relies on comparing the ratio of
mesendoderm formation in drug treated samples versus control samples, the exact percent
mesendoderm cells should not be critical as long as the efficiency is consistent from well to
well. In order to best judge the broader applicability of the hPST system described herein, it
will be important for other groups to reproduce these findings in independent laboratory
settings.
In general, human cell based assays can improve safety evaluation. Teratogenicity
assessment is an area where human cell based assays have not been implemented in
earnest. The data presented herein demonstrate that the hPST can serve as a valuable tool
to screen compounds for teratogenic risk, generate novel, testable hypotheses aimed at
investigating the molecular mechanisms driving teratogenicity and to identify new possible
targets capable of modulating the mesendoderm developmental pathway.
Acknowledgements
We would like to thank Claudia McGinnis and Nicole Clemann for their helpful discussions
and Thomas Weiser and Thomas Singer for their support during this work.
Page 16 of 34Toxicological Sciences
123456789101112131415161718192021222324252627282930313233343536373839404142434445464748495051525354555657585960
at National U
niversity of Singapore on Novem
ber 30, 2013http://toxsci.oxfordjournals.org/
Dow
nloaded from
Supplementary Data description.
Figure S1: Expression of pluripotent and endoderm markers. Figure S2: Example of “dense” and “sparse” region observed in differentiation day 3 of H9 cells. Figure S3: Dose-dependent effect of thalidomide on mesendoderm formation in H9 and LSJ-1 cells. Figure S4: Characterization of Kinase Inhibitor Library. Figure S5: Lineage restriction/specification hypothesis Table S1: Population analysis of H9 cells by 3 pluripotent and 4 mesendoderm markers during 3 day differentiation. Table S2: Concordance of the hPST result determined in H9 cells and LSJ-1 cells. Table S3: CAS# and references for 15 environmental toxicants. Table S4: Full table for hPST result of 71 drugs including CAS# and references. Table S5: Addition of EOMES markers does not increase sensitivity. Table S6: Analysis of SOX17+ and EOMES+ cells by double immuno-staining. Table S7: Kinase inhibition profile of CLK4 inhibitors.
Page 17 of 34 Toxicological Sciences
123456789101112131415161718192021222324252627282930313233343536373839404142434445464748495051525354555657585960
at National U
niversity of Singapore on Novem
ber 30, 2013http://toxsci.oxfordjournals.org/
Dow
nloaded from
References
Anastassiadis, T., Deacon, S. W., Devarajan, K., Ma, H. and Peterson, J. R. (2011). Comprehensive
assay of kinase catalytic activity reveals features of kinase inhibitor selectivity. Nat Biotechnol 29292929(11), 1039-45.
Bailey, G. P., Wise, L. D., Buschmann, J., Hurtt, M. and Fisher, J. E. (2009). Pre- and postnatal
developmental toxicity study design for pharmaceuticals. Birth Defects Research Part B: Developmental and Reproductive Toxicology 86868686(6), 437-445.
Basketter, D. A., Clewell, H., Kimber, I., Rossi, A., Blaauboer, B., Burrier, R., Daneshian, M., Eskes,
C., Goldberg, A., Hasiwa, N., et al. (2012). A roadmap for the development of alternative (non-
animal) methods for systemic toxicity testing - t4 report*. ALTEX 29292929(1), 3-91.
Basma, H., Soto-Gutierrez, A., Yannam, G. R., Liu, L., Ito, R., Yamamoto, T., Ellis, E., Carson, S. D.,
Sato, S., Chen, Y., et al. (2009). Differentiation and transplantation of human embryonic stem
cell-derived hepatocytes. Gastroenterology 136136136136(3), 990-9.
Borowiak, M., Maehr, R., Chen, S., Chen, A. E., Tang, W., Fox, J. L., Schreiber, S. L. and Melton, D. A.
(2009). Small molecules efficiently direct endodermal differentiation of mouse and human
embryonic stem cells. Cell Stem Cell 4444(4), 348-58.
Buesen, R., Genschow, E., Slawik, B., Visan, A., Spielmann, H., Luch, A. and Seiler, A. (2009).
Embryonic stem cell test remastered: comparison between the validated EST and the new
molecular FACS-EST for assessing developmental toxicity in vitro. Toxicol Sci 108108108108(2), 389-400.
Fedorov, O., Huber, K., Eisenreich, A., Filippakopoulos, P., King, O., Bullock, A. N., Szklarczyk, D.,
Jensen, L. J., Fabbro, D., Trappe, J., et al. (2011). Specific CLK inhibitors from a novel chemotype
for regulation of alternative splicing. Chemistry & biology 18181818(1), 67-76.
Festag, M., Viertel, B., Steinberg, P. and Sehner, C. (2007). An in vitro embryotoxicity assay based
on the disturbance of the differentiation of murine embryonic stem cells into endothelial cells. II.
Testing of compounds. Toxicology in Vitro 21212121(8), 1631-1640.
Hartung, T. and Rovida, C. (2009). Chemical regulators have overreached. Nature 460460460460(7259),
1080-1.
Hewitt, M., Ellison, C. M., Enoch, S. J., Madden, J. C. and Cronin, M. T. D. (2010). Integrating
(Q)SAR models, expert systems and read-across approaches for the prediction of developmental
toxicity. Reproductive Toxicology 30303030(1), 147-160.
Kleinstreuer, N. C., Smith, A. M., West, P. R., Conard, K. R., Fontaine, B. R., Weir-Hauptman, A. M.,
Palmer, J. A., Knudsen, T. B., Dix, D. J., Donley, E. L., et al. (2011a). Identifying developmental
toxicity pathways for a subset of ToxCast chemicals using human embryonic stem cells and
metabolomics. Toxicology and applied pharmacology 257257257257(1), 111-21.
Kleinstreuer, N. C., Smith, A. M., West, P. R., Conard, K. R., Fontaine, B. R., Weir-Hauptman, A. M.,
Palmer, J. A., Knudsen, T. B., Dix, D. J., Donley, E. L., et al. (2011b). Identifying developmental
toxicity pathways for a subset of ToxCast chemicals using human embryonic stem cells and
metabolomics. Toxicol Appl Pharmacol 257257257257(1), 111-21.
Kroon, E., Martinson, L. A., Kadoya, K., Bang, A. G., Kelly, O. G., Eliazer, S., Young, H., Richardson,
M., Smart, N. G., Cunningham, J., et al. (2008). Pancreatic endoderm derived from human
embryonic stem cells generates glucose-responsive insulin-secreting cells in vivo. Nature biotechnology 26262626(4), 443-52.
Krug, A. K., Kolde, R., Gaspar, J. A., Rempel, E., Balmer, N. V., Meganathan, K., Vojnits, K., Baquie,
M., Waldmann, T., Ensenat-Waser, R., et al. (2013). Human embryonic stem cell-derived test
systems for developmental neurotoxicity: a transcriptomics approach. Archives of toxicology
87878787(1), 123-43.
Lauder, J. M., Wilkie, M. B., Wu, C. and Singh, S. (2000). Expression of 5-HT(2A), 5-HT(2B) and 5-
HT(2C) receptors in the mouse embryo. International journal of developmental neuroscience : the official journal of the International Society for Developmental Neuroscience 18181818(7), 653-62.
Page 18 of 34Toxicological Sciences
123456789101112131415161718192021222324252627282930313233343536373839404142434445464748495051525354555657585960
at National U
niversity of Singapore on Novem
ber 30, 2013http://toxsci.oxfordjournals.org/
Dow
nloaded from

Marx-Stoelting, P., Adriaens, E., Ahr, H. J., Bremer, S., Garthoff, B., Gelbke, H. P., Piersma, A.,
Pellizzer, C., Reuter, U., Rogiers, V., et al. (2009). A review of the implementation of the
embryonic stem cell test (EST). The report and recommendations of an ECVAM/ReProTect
Workshop. Altern Lab Anim 37373737(3), 313-28.
Mayshar, Y., Yanuka, O. and Benvenisty, N. (2011). Teratogen screening using transcriptome
profiling of differentiating human embryonic stem cells. Journal of cellular and molecular medicine 15151515(6), 1393-401.
McLean, A. B., D'Amour, K. A., Jones, K. L., Krishnamoorthy, M., Kulik, M. J., Reynolds, D. M.,
Sheppard, A. M., Liu, H., Xu, Y., Baetge, E. E., et al. (2007). Activin a efficiently specifies definitive
endoderm from human embryonic stem cells only when phosphatidylinositol 3-kinase signaling
is suppressed. Stem Cells 25252525(1), 29-38.
Meganathan, K., Jagtap, S., Wagh, V., Winkler, J., Gaspar, J. A., Hildebrand, D., Trusch, M., Lehmann,
K., Hescheler, J., Schluter, H., et al. (2012). Identification of thalidomide-specific transcriptomics
and proteomics signatures during differentiation of human embryonic stem cells. PloS one 7777(8),
e44228.
Melchert, M. and List, A. (2007). The thalidomide saga. The international journal of biochemistry & cell biology 39393939(7-8), 1489-99.
Muraki, M., Ohkawara, B., Hosoya, T., Onogi, H., Koizumi, J., Koizumi, T., Sumi, K., Yomoda, J.,
Murray, M. V., Kimura, H., et al. (2004). Manipulation of alternative splicing by a newly
developed inhibitor of Clks. J Biol Chem 279279279279(23), 24246-54.
Murry, C. E. and Keller, G. (2008). Differentiation of embryonic stem cells to clinically relevant
populations: lessons from embryonic development. Cell 132132132132(4), 661-80.
Panzica-Kelly, J. M., Brannen, K. C., Ma, Y., Zhang, C. X., Flint, O. P., Lehman-McKeeman, L. D. and
Augustine-Rauch, K. A. (2013). Establishment of a molecular embryonic stem cell
developmental toxicity assay. Toxicological sciences : an official journal of the Society of Toxicology 131131131131(2), 447-57.
Pennings, J. L. A., van Dartel, D. A. M., Robinson, J. F., Pronk, T. E. and Piersma, A. H. (2011). Gene
set assembly for quantitative prediction of developmental toxicity in the embryonic stem cell
test. Toxicology 284284284284(1-3), 63-71.
Seiler, A. E. and Spielmann, H. (2011). The validated embryonic stem cell test to predict
embryotoxicity in vitro. Nat Protoc 6666(7), 961-78.
Shuey, D. and Kim, J. H. (2011). Overview: developmental toxicology-new directions. Birth Defects Res B Dev Reprod Toxicol. Spielmann, H., Pohl, I., Doring, M. and Liebsch, M. (1997). The embryonic stem cell test (EST), an
in vitro embryotoxicity test using two permanent mouse cell lines: 3T3 fibroblasts and
embryonic stem cells. In vitro Toxicology 10101010, 119-127.
van Dartel, D. A. M., Pennings, J. L. A., de la Fonteyne, L. J. J., van Herwijnen, M. H., van Delft, J. H.,
van Schooten, F. J. and Piersma, A. H. (2010). Monitoring Developmental Toxicity in the
Embryonic Stem Cell Test Using Differential Gene Expression of Differentiation-Related Genes.
Toxicological Sciences 116116116116(1), 130-139.
Zhang, J. H., Chung, T. D. and Oldenburg, K. R. (1999). A Simple Statistical Parameter for Use in
Evaluation and Validation of High Throughput Screening Assays. Journal of biomolecular screening 4444(2), 67-73.
Zhang, Y., Li, W., Laurent, T. and Ding, S. (2012). Small molecules, big roles -- the chemical
manipulation of stem cell fate and somatic cell reprogramming. J Cell Sci 125125125125(Pt 23), 5609-20.
Zhu, S., Wurdak, H., Wang, J., Lyssiotis, C. A., Peters, E. C., Cho, C. Y., Wu, X. and Schultz, P. G.
(2009). A small molecule primes embryonic stem cells for differentiation. Cell Stem Cell 4444(5),
416-26.
zur Nieden, N. I., Davis, L. A. and Rancourt, D. E. (2010). Comparing three novel endpoints for
developmental osteotoxicity in the embryonic stem cell test. Toxicology and Applied Pharmacology 247247247247(2), 91-97.
Page 19 of 34 Toxicological Sciences
123456789101112131415161718192021222324252627282930313233343536373839404142434445464748495051525354555657585960
at National U
niversity of Singapore on Novem
ber 30, 2013http://toxsci.oxfordjournals.org/
Dow
nloaded from
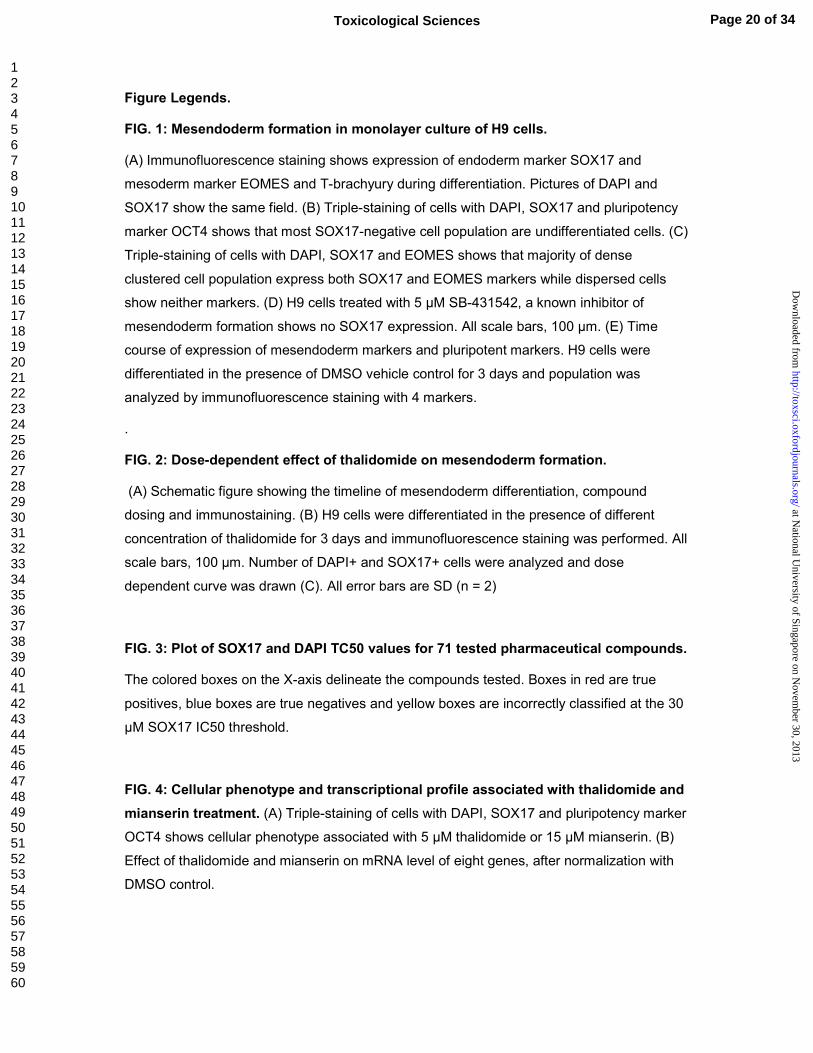
Figure Legends.
FIG. 1: Mesendoderm formation in monolayer culture of H9 cells.
(A) Immunofluorescence staining shows expression of endoderm marker SOX17 and
mesoderm marker EOMES and T-brachyury during differentiation. Pictures of DAPI and
SOX17 show the same field. (B) Triple-staining of cells with DAPI, SOX17 and pluripotency
marker OCT4 shows that most SOX17-negative cell population are undifferentiated cells. (C)
Triple-staining of cells with DAPI, SOX17 and EOMES shows that majority of dense
clustered cell population express both SOX17 and EOMES markers while dispersed cells
show neither markers. (D) H9 cells treated with 5 µM SB-431542, a known inhibitor of
mesendoderm formation shows no SOX17 expression. All scale bars, 100 µm. (E) Time
course of expression of mesendoderm markers and pluripotent markers. H9 cells were
differentiated in the presence of DMSO vehicle control for 3 days and population was
analyzed by immunofluorescence staining with 4 markers.
.
FIG. 2: Dose-dependent effect of thalidomide on mesendoderm formation.
(A) Schematic figure showing the timeline of mesendoderm differentiation, compound
dosing and immunostaining. (B) H9 cells were differentiated in the presence of different
concentration of thalidomide for 3 days and immunofluorescence staining was performed. All
scale bars, 100 µm. Number of DAPI+ and SOX17+ cells were analyzed and dose
dependent curve was drawn (C). All error bars are SD (n = 2)
FIG. 3: Plot of SOX17 and DAPI TC50 values for 71 tested pharmaceutical compounds.
The colored boxes on the X-axis delineate the compounds tested. Boxes in red are true
positives, blue boxes are true negatives and yellow boxes are incorrectly classified at the 30
µM SOX17 IC50 threshold.
FIG. 4: Cellular phenotype and transcriptional profile associated with thalidomide and
mianserin treatment. (A) Triple-staining of cells with DAPI, SOX17 and pluripotency marker
OCT4 shows cellular phenotype associated with 5 µM thalidomide or 15 µM mianserin. (B)
Effect of thalidomide and mianserin on mRNA level of eight genes, after normalization with
DMSO control.
Page 20 of 34Toxicological Sciences
123456789101112131415161718192021222324252627282930313233343536373839404142434445464748495051525354555657585960
at National U
niversity of Singapore on Novem
ber 30, 2013http://toxsci.oxfordjournals.org/
Dow
nloaded from

FIG. 5: Screen of 300 Kinase inhibitor library.
H9 cells were differentiated in the presence of library compounds (n = 302) at 5 µM
according to the standard hPST protocol. (A) SD of DMSO control (n = 20) was 5.1% for
DAPI+ cells, and Z-factor was 0.79. Dotted lines indicate 3 x SD of DMSO controls. (B).
Frequency histogram of SOX17 expression for compounds that did not exhibit cytotoxicity as
judged by a reduction in DAPI per well. SD of DMSO control (n = 20) was 7.3% for SOX17+
cells, and Z-factor was 0.77. Dotted lines indicate 3 x SD of DMSO controls. 10 compounds
which decreased SOX17+ cells more than 90% (red column) were further analyzed by
secondary dose (1 -100 µM) experiment performed in duplicates using LSJ-1 cells (C).
FIG. 6: Effect of ALK and CLK4 inhibitors on mesendoderm differentiation. LSJ-1 cells
were differentiated in the presence of compound at 1.5 or 5 µM according to the standard
hPST protocol. Number of SOX17+ cells were quantitated at differentiation day 3, and
average of duplicates were shown. Bars = SD. DMSO vehicle control and LY-294002 serve
as negative and positive control respectively. (A) CH5424802, Crizotinib, R51 to R56 are all
ALK inhibitors. (B) +, -, w signs in the table show the presence of inhibition, lack of inhibition,
and weak inhibition of each kinase respectively.
Page 21 of 34 Toxicological Sciences
123456789101112131415161718192021222324252627282930313233343536373839404142434445464748495051525354555657585960
at National U
niversity of Singapore on Novem
ber 30, 2013http://toxsci.oxfordjournals.org/
Dow
nloaded from

Table 1: Summary of IC50, TC50 determined by human pluripotent stem cell test (hPST) and known animal toxicity of 71 pharmaceutical compounds.
Compounds
hPST
Compound Source
a
FDA Label
Segment 2 Findings
Species Examined
c
Test outcome
SOX17 IC50 (µM)
DAPI TC50 (µM)
Visceral Dysmorpho -genesis?
ET < MT
b
Actinomycin D Positive <0.01 <0.01 ECVAM
FDA Label D
All-trans Retinoic Acid
Positive 0.07 33 ECVAM
Cytarabine Positive 0.08 0.19 ECVAM
FDA Label D Y Y M
SB-431542 Positive 0.08 69 Literature Z
R1 Positive <0.1 5.0 Roche Y Rt
R2 Positive <0.1 <0.1 Roche Y N Rt
R3 Positive <0.1 <0.1 Roche Y Y Rt, Rb
Isotretinoin Positive 0.2 140 FDA Label X
Bromodeoxyuridine Positive 0.2 3.4 ECVAM
R4 Positive 0.2 0.3 Roche Y N Rt
Doxorubicin Positive 0.3 <0.3 FDA Label D
Dorsomorphin Positive 0.3 2.4 Literature Z
Thalidomide Positive 0.5 >200 FDA Label X
5-Fluorouracil Positive 0.6 0.7 FDA Label D
Dasatinib Positive <1 <1 FDA Label D
Sorafenib Positive <2 <2 FDA Label D
Valproic Acid Positive 2.6 3.3 FDA Label D
Sunitinib Positive 2.8 3.6 FDA Label D
Ziprasidone Positive 2.8 5.1 FDA Label C Y Y Rt, Rb
Mianserin Positive 3.4 60 Literature Y M
Vandetanib Positive 3.5 4.4 FDA Label D
Diethylstilbestrol Positive 4.4 4.4 FDA Label X
Tegaserod False
Positive 4.6 4.5 FDA Label B
R5 Positive <5 5.9 Roche Y N Rt
R6 Positive <5 78.0 Roche N Y Rt
R7 False
Positive 5.3 5.6 Roche N N Rt
6-aminonicotinamide
Positive 7.0 8.0 Literature Y N Rt
Ritanserin Positive 7.3 27 Literature Y M
R8 Positive 9.6 9.4 Roche Y (Rt, C) N Rt, Rb, C
R9 Positive 9.6 9.6 Roche N Y (Rb Only)
Rt, Rb
Gefitinib Positive 10 10 FDA Label D
R10 Positive 10 12 Roche Y (Rb Only) N Rt, Rb
R11 Positive 10.4 9.7 Roche Y (Rb Only) N Rt, Rb
Imatinib Positive 11 22 FDA Label D
R12 False
Positive 12 23 Roche N N Rt, Rb
R13 Positive 12 30 Roche Y (Rt Only) N Rt, Rb
R14 Positive 26 >200 Roche Y N Rb
Esomeprazole Negative 32 101 FDA Label B
Page 22 of 34Toxicological Sciences
123456789101112131415161718192021222324252627282930313233343536373839404142434445464748495051525354555657585960
at National U
niversity of Singapore on Novem
ber 30, 2013http://toxsci.oxfordjournals.org/
Dow
nloaded from

R15 Negative 33 33 Roche N N Rt, Rb
R16 Negative 33 45 Roche N N Rt, Rb
Folate Negative 39 84 FDA Label Ad H
R17 Negative 47 46 Roche N N Rt, Rb
R18 False
Negative 47 72 Roche Y Y Rt, Rb
R19 Negative 65 >200 Roche N N Rt, Rb
R20 Negative 68 55 Roche N N Rt
R21 Negative 76 80 Roche N N Rt, Rb
R22 Negative >80 >80 Roche N N Rt, Rb, C
R23 Negative >80 >80 Roche N N Rb
R24 Negative >80 >80 Roche N N Rt, Rb
R25 Negative >80 >80 Roche N N Rt, Rb
R26 Negative >80 >80 Roche N N Rt, C
R27 Negative >80 >80 Roche N N Rt, Rb
R28 Negative >80 >80 Roche N N Rt
R29 Negative >80 >80 Roche N N Rt, Rb
R30 Negative >80 >80 Roche N N Rt
Catechin Negative 97 200.0 Literature N N Rt
R31 Negative 124 200.0 Roche N N Rt, Rb
Lisuride Negative 137 122 Literature N N Rt
R32 Negative 160 171 Roche N N Rt, C
Niacin Negative >200 >200 FDA Label A
Aspirin Negative >200 >200 Literature H
Ibuprofen Negative >200 >200 Literature N N Rt
Aciclovir Negative >200 >200 FDA Label B
R33 Negative >200 >200 Roche N N Rt
Ketanserin Negative >200 >200 Literature N M
R34 Negative >200 >200 Roche N N Rt, Rb
Streptomycin Negative >200 >200 Literature H
Methyldopa Negative 272 462 FDA Label B
Saccharin Negative >400 >400 ECVAM
Caffeine Negative >400 >400 ECVAM
Penicillin Negative >400 >400 ECVAM
Note. 71 compounds, 37 commercially available compounds and 34 in-house compounds that had been tested in animal Segment 2 teratogenicity studies were examined. FDA label: A (animal and well controlled studies in humans failed to demonstrate risk of fetal harm); B (animals studies failed to demonstrate teratogenic risk, no adequate studies have been completed in pregnant women). C (animals studies demonstrated an adverse effect on the fetus, no conclusive human studies); D (positive evidence of human fetal risk, but the benefit outweighs the risk); X (positive evidence of human fetal risk, not for use in pregnant women). The full table including references and CAS# is found in Table S4. aECVAM indicates compound used European Centre for the Validation of Alternative Methods study. bAbbreviation: ET < MT (Embryotoxicity is smaller than maternal toxicity); Y (Yes); N (No) cAbbreviation: M (mouse), Rb (rabbit), Rt (rat), C (cynomolgus monkey), H (human), Z (zebrafish) dC when Recommended Dietary Allowance (RDA) is exceeded
Page 23 of 34 Toxicological Sciences
123456789101112131415161718192021222324252627282930313233343536373839404142434445464748495051525354555657585960
at National U
niversity of Singapore on Novem
ber 30, 2013http://toxsci.oxfordjournals.org/
Dow
nloaded from

Table 2: Summary of human pluripotent stem cell test (hPST) of 71 pharmaceutical compounds.
Pharmaceuticals
30 µM Cut-off True FALSE
Test outcome
Positive True positive False positive
Positive predictive value
34 3 0.92
Negative False negative
True negative
Negative predictive value
1 33 0.97
Sensitivity Specificity Accuracy
0.97 0.92 0.94
Page 24 of 34Toxicological Sciences
123456789101112131415161718192021222324252627282930313233343536373839404142434445464748495051525354555657585960
at National U
niversity of Singapore on Novem
ber 30, 2013http://toxsci.oxfordjournals.org/
Dow
nloaded from

Table 3: Summary of human pluripotent stem cell test (hPST) result and known animal toxicity of 15 environmental toxicants.
Compound
name
Compound
class
hPST
IC50, TC50
(µM)
Rat
( mg/kg)
Rabbit
( mg/kg) Rat
Phenoty
pe
Rabbit
Phenotype
hPST
classfi-
cation
In vivo
classifi-
cation
Concordanc
e
DAPI SOX1
7 mLEL dLEL
mL
EL dLEL
Chlorophaci
none
Rodenticid
e
2 < 1.5 0.1 0.01 0.02 0.02 KD DF Pos Pos Correct
Fluazinam Fungicide < 1.5 < 1.5 250 50 4 12 SB, KD IO, DS Pos Pos Correct
Diquat
dibromide
Herbicide 4 4.4 4 40 3 1 IO, KD,
SD
IO, SB, LD Pos Pos Correct
Dinoseb Herbicide 9.1 7.5 10 10 ND 10 IO BD, DD, SD Pos Pos Correct
Diniconazole Fungicide 13.4 10.5 20 1 ND ND IO, SB,
KD
ND Pos Pos Correct
Hexaconazol
e
Fungicide 34.3 31.9 250 2.5 100 50 IO, SB WD Pos Pos Correct
Flusilazole Fungicide >
100
33.5 50 0.4 35 35 KD WD Pos Pos Correct
Clopyralid Herbicide >
100
>
100
250 >
250
250 250 None BD Neg Neg Correct
Imazamox Herbicide >
100
>
100
1000 >
1000
600 > 900 None None Neg Neg Correct
Imazapyr Herbicide >
100
>
100
1000 >
1000
>
400
> 400 None None Neg Neg Correct
o-
Phenylpheno
l
Fungicide >
100
>
100
700 >
700
100 > 250 None None Neg Neg Correct
Triclopyr Herbicide >
100
>
100
50 200 ND ND IO ND Neg Neg Correct
Hexazinone Herbicide >
100
>
100
400 900 125 > 125 None None Neg Neg Correct
Thiacloprid Insecticide >
100
>
100
50 10 10 10 IO, SB,
MB, KD
IO, SB Neg Pos False
negative
Cyproconaz
ol
Fungicide >
100
>
100
12 12 50 10 IO, SB,
SD, BD
SD Neg Pos False
negative
Page 25 of 34 Toxicological Sciences
123456789101112131415161718192021222324252627282930313233343536373839404142434445464748495051525354555657585960
at National U
niversity of Singapore on Novem
ber 30, 2013http://toxsci.oxfordjournals.org/
Dow
nloaded from
Note: Compounds are classified as “Pos(itive)” when both rat and rabbit dLEL are less than 50 mg/kg, “Neg(ative)” when they are more than 200 mg/kg. For Triclopyr and Diniconazole, only rat dLEL was used as no rabbit data was available. For all compounds, dLEL obtained from orally administered dose study were used. Compounds are predicted to be “Pos” by hPST when SOX17 IC50 is less than 35 µM. Developmentally toxic phenotype observed at less than 300 mg/kg dose are shown. Phenotype abbreviation: Supernumerary bone (SB), Incomplete ossification (IO), Misshapen bone (MB), Other skeletal defects (SD), Weight decrease (Basma et al.), Kidney defects (KD), Dead fetus (DF), Liver defects (LD), Brain defects (BD), Diaphragmatic defects (DD), Not determined (ND). CAS # and references are included in Table S3.
Page 26 of 34Toxicological Sciences
123456789101112131415161718192021222324252627282930313233343536373839404142434445464748495051525354555657585960
at National U
niversity of Singapore on Novem
ber 30, 2013http://toxsci.oxfordjournals.org/
Dow
nloaded from

Table 4: Summary of human pluripotent stem cell test (hPST) of 15 environmental toxicants.
Environmental Toxicants
35 µM Cut-off True FALSE
Test outcome
Positive True positive False positive
Positive predictive value
7 0 1.00
Negative False negative
True negative
Negative predictive value
2 6 0.75
Sensitivity Specificiy Accuracy
0.78 1.00 0.87
Table 5: Effect of 6 compounds on number of SOX17+ cells in H9 and LSJ-1.
Number of SOX17+ cells compared to DMSO control (%)
H9 LSJ-1
R41 211 733
R42 201 756
R43 192 689
R44 190 811
R45 179 278
R46 163 767
Page 27 of 34 Toxicological Sciences
123456789101112131415161718192021222324252627282930313233343536373839404142434445464748495051525354555657585960
at National U
niversity of Singapore on Novem
ber 30, 2013http://toxsci.oxfordjournals.org/
Dow
nloaded from

Table 6: List of kinase targets which were found enriched in the 6 compound which increased the number of SOX17+ cells.
Rank Kinase Freq
in library1
Obs2 Obs/Freq
1 PI3K 283 63 0.214
2 CLK4 22 3 0.136
3 ALK 17 2 0.118
4 AURKA 9 1 0.111
5 PIM2 21 2 0.095
6 STK4 11 1 0.091
7 AXL 25 2 0.080
8 LTK 14 1 0.071
9 PHKG2 14 1 0.071
10 MAP4K4 15 1 0.067
11 CSNK1D 32 2 0.063
12 CSNK1A1L 17 1 0.059
13 MERTK 18 1 0.056
14 CLK1 44 2 0.045
15 STK3 45 2 0.044
16 VEGFR2 25 1 0.040
17 TNIK 26 1 0.038
18 FLT3 55 2 0.036
19 CLK2 58 2 0.034
20 FLT1 29 1 0.034
Note:
1the number of compounds in the entire library which inhibit a particular kinase more than
95% at 10µM concentration determined by KINOMEscan assay .
2 Observed number of compound which inhibited a particular kinase more than 95% at 10µM in
the 6 compounds.
3For PI3K, the sum of 6 subunits (PIK3C2B, PIK3C2G, PIK3CA , PIK3CB, PIK3CD, PIK3CG) was
shown.
Page 28 of 34Toxicological Sciences
123456789101112131415161718192021222324252627282930313233343536373839404142434445464748495051525354555657585960
at National U
niversity of Singapore on Novem
ber 30, 2013http://toxsci.oxfordjournals.org/
Dow
nloaded from

FIG. 1: Mesendoderm formation in monolayer culture of H9 cells. (A) Immunofluorescence staining shows expression of endoderm marker SOX17 and mesoderm marker
EOMES and T-brachyury during differentiation. Pictures of DAPI and SOX17 show the same field. (B) Triple-
staining of cells with DAPI, SOX17 and pluripotency marker OCT4 shows that most SOX17-negative cell population are undifferentiated cells. (C) Triple-staining of cells with DAPI, SOX17 and EOMES shows that majority of dense clustered cell population express both SOX17 and EOMES markers while dispersed cells
show neither markers. (D) H9 cells treated with 5 µM SB-431542, a known inhibitor of mesendoderm formation shows no SOX17 expression. All scale bars, 100 µm. (E) Time course of expression of
mesendoderm markers and pluripotent markers. H9 cells were differentiated in the presence of DMSO vehicle control for 3 days and population was analyzed by immunofluorescence staining with 4 markers.
179x274mm (300 x 300 DPI)
Page 29 of 34 Toxicological Sciences
123456789101112131415161718192021222324252627282930313233343536373839404142434445464748495051525354555657585960
at National U
niversity of Singapore on Novem
ber 30, 2013http://toxsci.oxfordjournals.org/
Dow
nloaded from

FIG. 2: Dose-dependent effect of thalidomide on mesendoderm formation. (A) Schematic figure showing the timeline of mesendoderm differentiation, compound dosing and
immunostaining. (B) H9 cells were differentiated in the presence of different concentration of thalidomide for
3 days and immunofluorescence staining was performed. All scale bars, 100 µm. Number of DAPI+ and SOX17+ cells were analyzed and dose dependent curve was drawn (C). All error bars are SD (n = 2)
189x263mm (300 x 300 DPI)
Page 30 of 34Toxicological Sciences
123456789101112131415161718192021222324252627282930313233343536373839404142434445464748495051525354555657585960
at National U
niversity of Singapore on Novem
ber 30, 2013http://toxsci.oxfordjournals.org/
Dow
nloaded from

FIG. 3: Plot of SOX17 and DAPI TC50 values for 71 tested pharmaceutical compounds. The colored boxes on the X-axis delineate the compounds tested. Boxes in red are true positives, blue boxes
are true negatives and yellow boxes are incorrectly classified at the 30 µM SOX17 IC50 threshold.
194x140mm (300 x 300 DPI)
Page 31 of 34 Toxicological Sciences
123456789101112131415161718192021222324252627282930313233343536373839404142434445464748495051525354555657585960
at National U
niversity of Singapore on Novem
ber 30, 2013http://toxsci.oxfordjournals.org/
Dow
nloaded from

FIG. 4: Cellular phenotype and transcriptional profile associated with thalidomide and mianserin treatment. (A) Triple-staining of cells with DAPI, SOX17 and pluripotency marker OCT4 shows cellular phenotype
associated with 5 µM thalidomide or 15 µM mianserin. (B) Effect of thalidomide and mianserin on mRNA level of eight genes, after normalization with DMSO control.
246x239mm (300 x 300 DPI)
Page 32 of 34Toxicological Sciences
123456789101112131415161718192021222324252627282930313233343536373839404142434445464748495051525354555657585960
at National U
niversity of Singapore on Novem
ber 30, 2013http://toxsci.oxfordjournals.org/
Dow
nloaded from
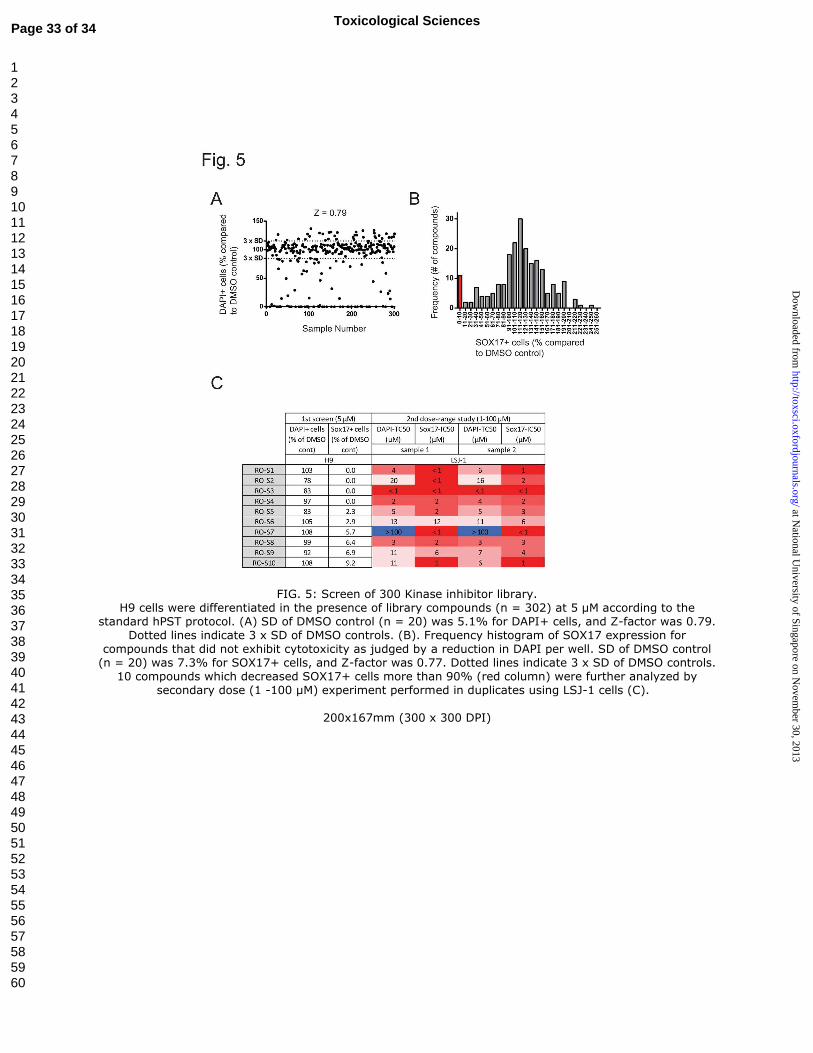
FIG. 5: Screen of 300 Kinase inhibitor library. H9 cells were differentiated in the presence of library compounds (n = 302) at 5 µM according to the
standard hPST protocol. (A) SD of DMSO control (n = 20) was 5.1% for DAPI+ cells, and Z-factor was 0.79. Dotted lines indicate 3 x SD of DMSO controls. (B). Frequency histogram of SOX17 expression for
compounds that did not exhibit cytotoxicity as judged by a reduction in DAPI per well. SD of DMSO control (n = 20) was 7.3% for SOX17+ cells, and Z-factor was 0.77. Dotted lines indicate 3 x SD of DMSO controls.
10 compounds which decreased SOX17+ cells more than 90% (red column) were further analyzed by secondary dose (1 -100 µM) experiment performed in duplicates using LSJ-1 cells (C).
200x167mm (300 x 300 DPI)
Page 33 of 34 Toxicological Sciences
123456789101112131415161718192021222324252627282930313233343536373839404142434445464748495051525354555657585960
at National U
niversity of Singapore on Novem
ber 30, 2013http://toxsci.oxfordjournals.org/
Dow
nloaded from

FIG. 6: Effect of ALK and CLK4 inhibitors on mesendoderm differentiation. LSJ-1 cells were differentiated in the presence of compound at 1.5 or 5 µM according to the standard hPST protocol. Number of SOX17+ cells were quantitated at differentiation day 3, and average of duplicates were shown. Bars = SD. DMSO vehicle
control and LY-294002 serve as negative and positive control respectively. (A) CH5424802, Crizotinib, R51 to R56 are all ALK inhibitors. (B) +, -, w signs in the table show the presence of inhibition, lack of inhibition,
and weak inhibition of each kinase respectively. 256x399mm (300 x 300 DPI)
Page 34 of 34Toxicological Sciences
123456789101112131415161718192021222324252627282930313233343536373839404142434445464748495051525354555657585960
at National U
niversity of Singapore on Novem
ber 30, 2013http://toxsci.oxfordjournals.org/
Dow
nloaded from


