16 July 2015
Outstanding
Customer
Experience
Transcom
Second quarter 2015 results presentation Johan Eriksson, President & CEO
Ulrik Englund, CFO
2
• Good progress against all our financial targets
- Revenue growth
- EBIT margin
- Net debt/EBITDA
• Profitability improvements in all regions
• Management changes
Key highlights Q2 2015

At a glance
1

4
• A global customer experience specialist…
• …employing 30,000 people…
• …representing more than 100 nationalities...
• …operating 54 contact centers, onshore, off-shore and near shore…
• …in 23 countries…
• …delivering services in 33 languages...
• ...to over 400 clients in various industry verticals…
• …generating €616.8 million revenue in 2014…
• …with a market cap of SEK 2.3 billion as at June 30, 2015. Listed on Nasdaq Stockholm (Mid Cap segment) under ticker TWW.
Transcom in numbers

Steady improvement towards our mid-term EBIT margin target of at least 5 percent
1.0%
1.5%
2.0%
2.5%
3.0%
3.5%
4.0%
4.5%
5.0%
Q2 2013 Q2 2014 Q2 2015
5
12-month rolling EBIT* margin development
* Excluding items affecting comparability
Mid-term target
• Targeted sales efforts
- Growth with existing
clients in new
geographies
- Broadening client base
• Efficiency improvements
driven by standardization
• Continuous focus on
underperforming areas

Our performance in Q2 2015
2
Q2 2014 Q2 2015
7
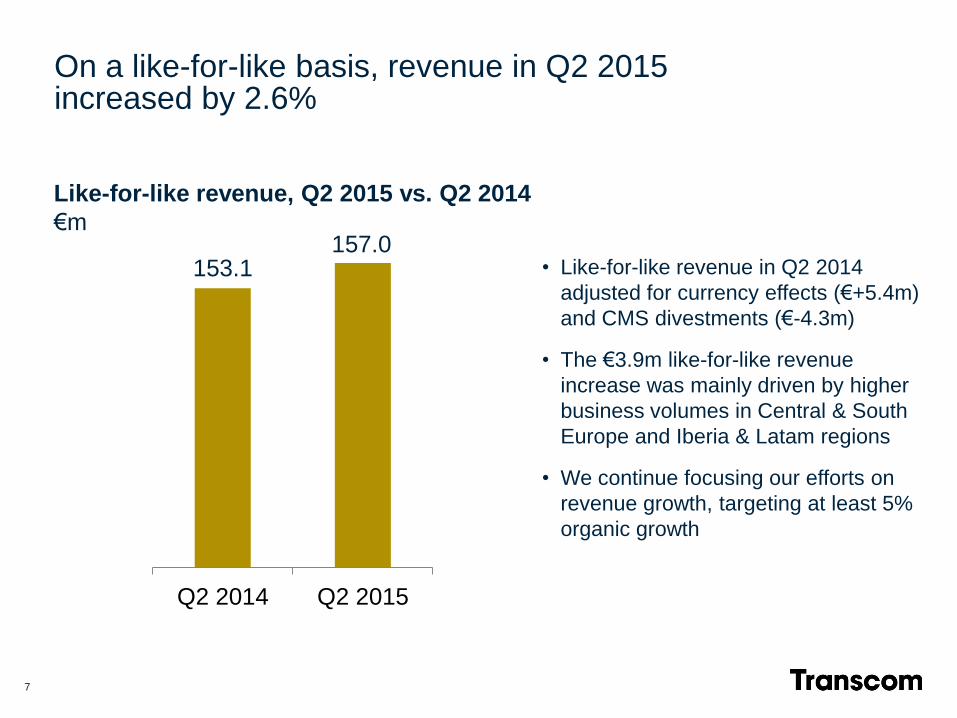
Like-for-like revenue, Q2 2015 vs. Q2 2014
€m 157.0
153.1 • Like-for-like revenue in Q2 2014
adjusted for currency effects (€+5.4m)
and CMS divestments (€-4.3m)
• The €3.9m like-for-like revenue
increase was mainly driven by higher
business volumes in Central & South
Europe and Iberia & Latam regions
• We continue focusing our efforts on
revenue growth, targeting at least 5%
organic growth
On a like-for-like basis, revenue in Q2 2015 increased by 2.6%
8
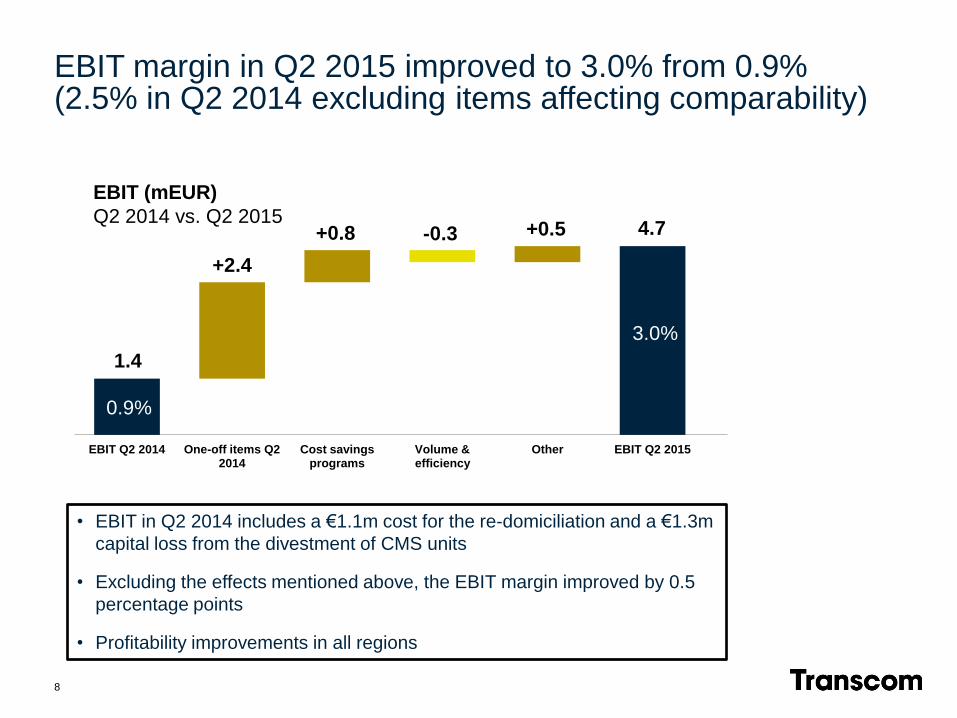
EBIT Q2 2014 One-off items Q2 2014
Cost savings programs
Volume & efficiency
Other EBIT Q2 2015
1.4
+2.4
+0.8 +0.5 -0.3
EBIT (mEUR)
Q2 2014 vs. Q2 2015 4.7
EBIT margin in Q2 2015 improved to 3.0% from 0.9% (2.5% in Q2 2014 excluding items affecting comparability)
• EBIT in Q2 2014 includes a €1.1m cost for the re-domiciliation and a €1.3m
capital loss from the divestment of CMS units
• Excluding the effects mentioned above, the EBIT margin improved by 0.5
percentage points
• Profitability improvements in all regions
0.9%
3.0%
9
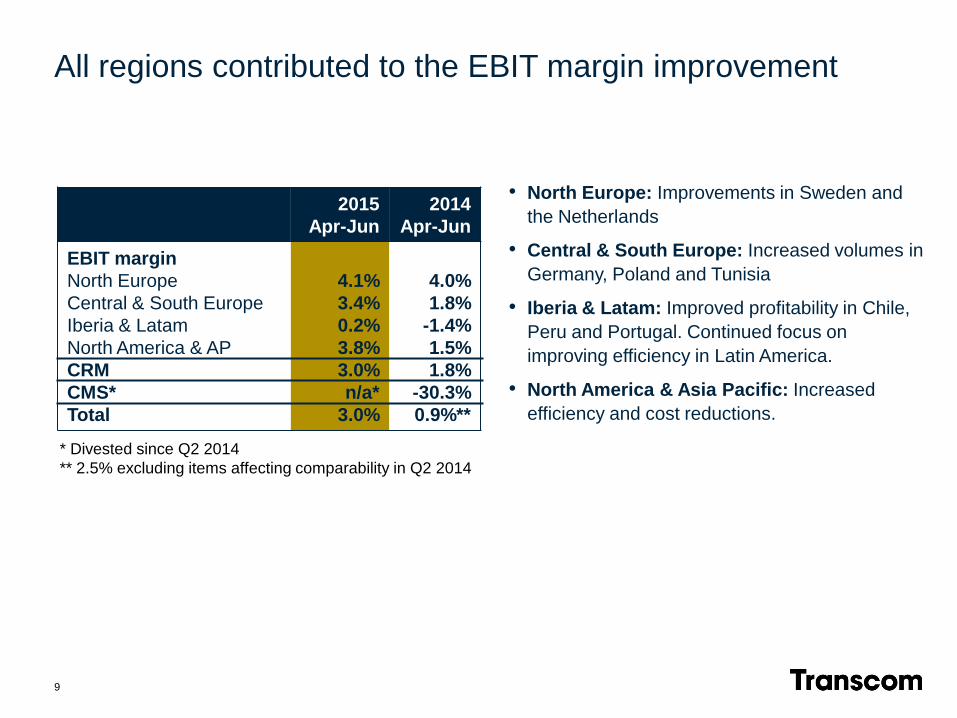
• North Europe: Improvements in Sweden and
the Netherlands
• Central & South Europe: Increased volumes in
Germany, Poland and Tunisia
• Iberia & Latam: Improved profitability in Chile,
Peru and Portugal. Continued focus on
improving efficiency in Latin America.
• North America & Asia Pacific: Increased
efficiency and cost reductions.
All regions contributed to the EBIT margin improvement
2015
Apr-Jun
2014
Apr-Jun
EBIT margin
North Europe
Central & South Europe
Iberia & Latam
North America & AP
CRM
CMS*
Total
4.1%
3.4%
0.2%
3.8%
3.0%
n/a*
3.0%
4.0%
1.8%
-1.4%
1.5%
1.8%
-30.3%
0.9%**
* Divested since Q2 2014
** 2.5% excluding items affecting comparability in Q2 2014

Trend vs.
Q2 2014
Q2 2015 vs. Q2 2014
Average seat utilization
ratio
Average Efficiency ratio
(billable over worked hours
Monthly staff attrition
88% vs. 87%
n/a – flat
n/a – flat
10
KPIs vs. previous year
Key drivers to reach mid-term profitability targets
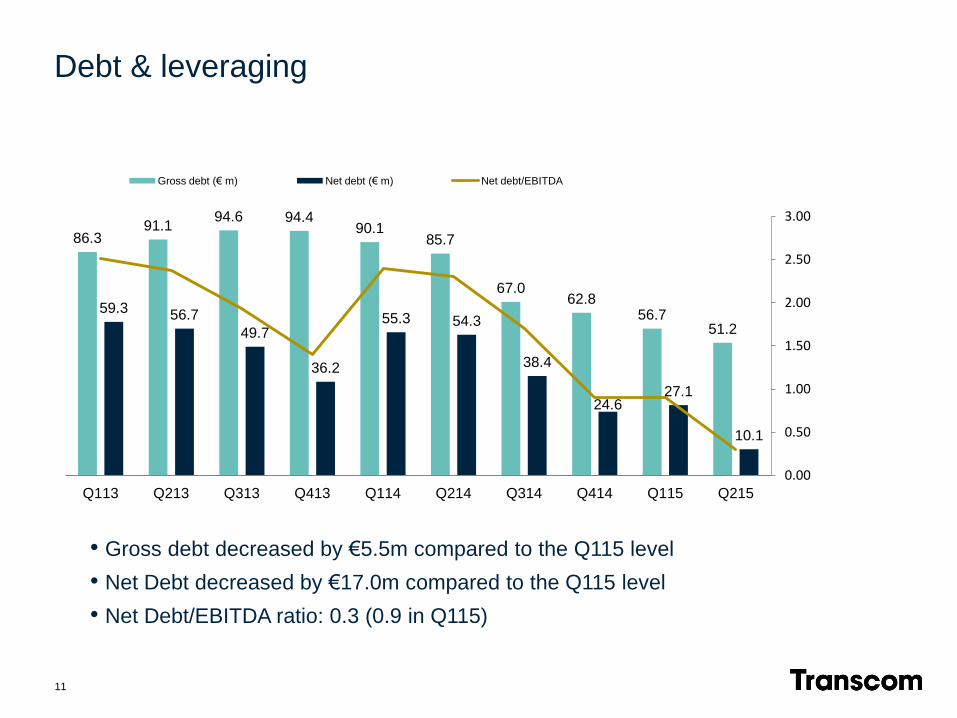
86.3 91.1
94.6 94.4 90.1
85.7
67.0 62.8
56.7 51.2
59.3 56.7
49.7
36.2
55.3 54.3
38.4
24.6 27.1
10.1
0.00
0.50
1.00
1.50
2.00
2.50
3.00
0.0
10.0
20.0
30.0
40.0
50.0
60.0
70.0
80.0
90.0
100.0
Q113 Q213 Q313 Q413 Q114 Q214 Q314 Q414 Q115 Q215
Gross debt (€ m) Net debt (€ m) Net debt/EBITDA
• Gross debt decreased by €5.5m compared to the Q115 level
• Net Debt decreased by €17.0m compared to the Q115 level
• Net Debt/EBITDA ratio: 0.3 (0.9 in Q115)
Debt & leveraging
11
3
Going forward – Transcom’s strategic direction

13
Transcom’s brand promise
Outstanding Customer
Experience, driving
revenue and brand
loyalty
”

Attractive market growth
14
• 5-6% annual growth in customer
management BPO in the next five years
• Fastest growth in emerging APAC and
Latam…
• …but the bulk of the industry increase will
be generated in mature markets, in
particular the United States
15
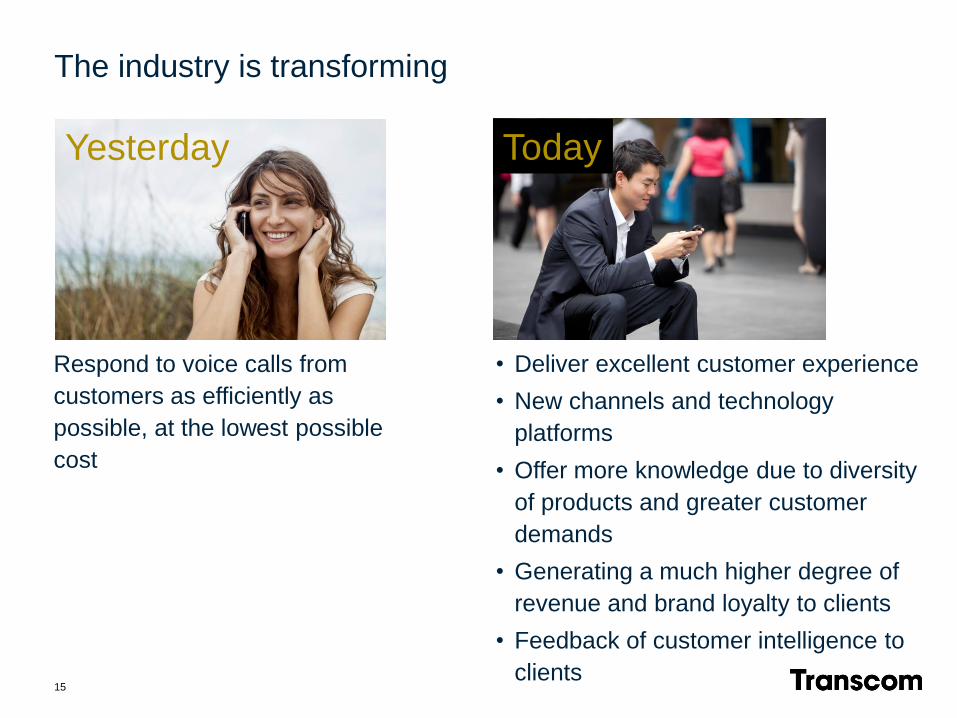
Respond to voice calls from
customers as efficiently as
possible, at the lowest possible
cost
The industry is transforming
Yesterday Today
• Deliver excellent customer experience
• New channels and technology
platforms
• Offer more knowledge due to diversity
of products and greater customer
demands
• Generating a much higher degree of
revenue and brand loyalty to clients
• Feedback of customer intelligence to
clients
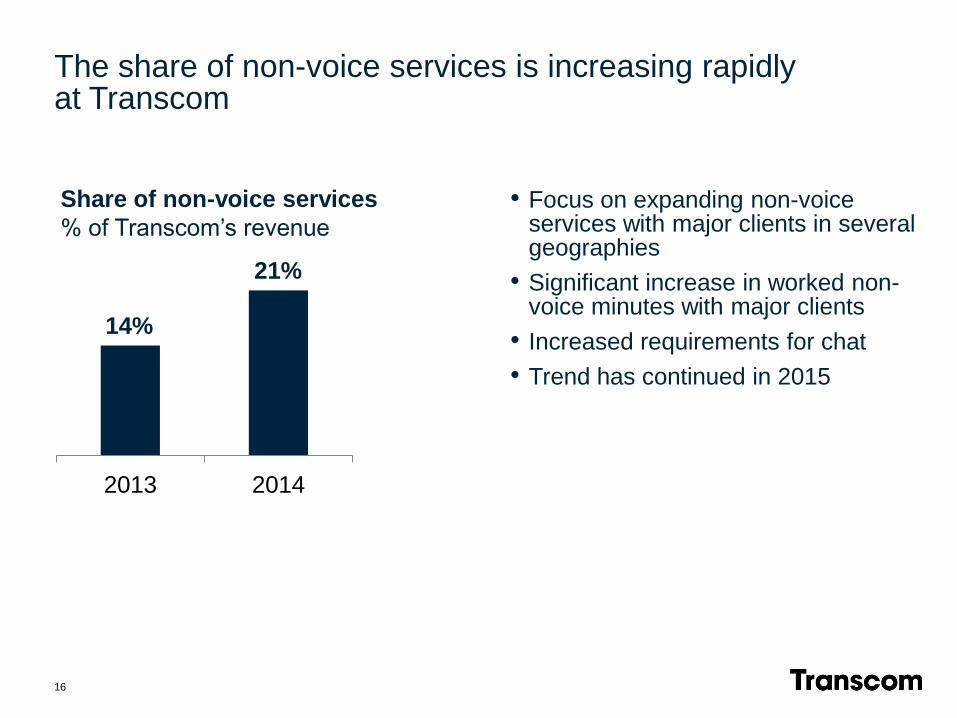
2013 2014
Share of non-voice services
% of Transcom’s revenue
16
The share of non-voice services is increasing rapidly at Transcom
• Focus on expanding non-voice services with major clients in several geographies
• Significant increase in worked non-voice minutes with major clients
• Increased requirements for chat
• Trend has continued in 2015
14%
21%
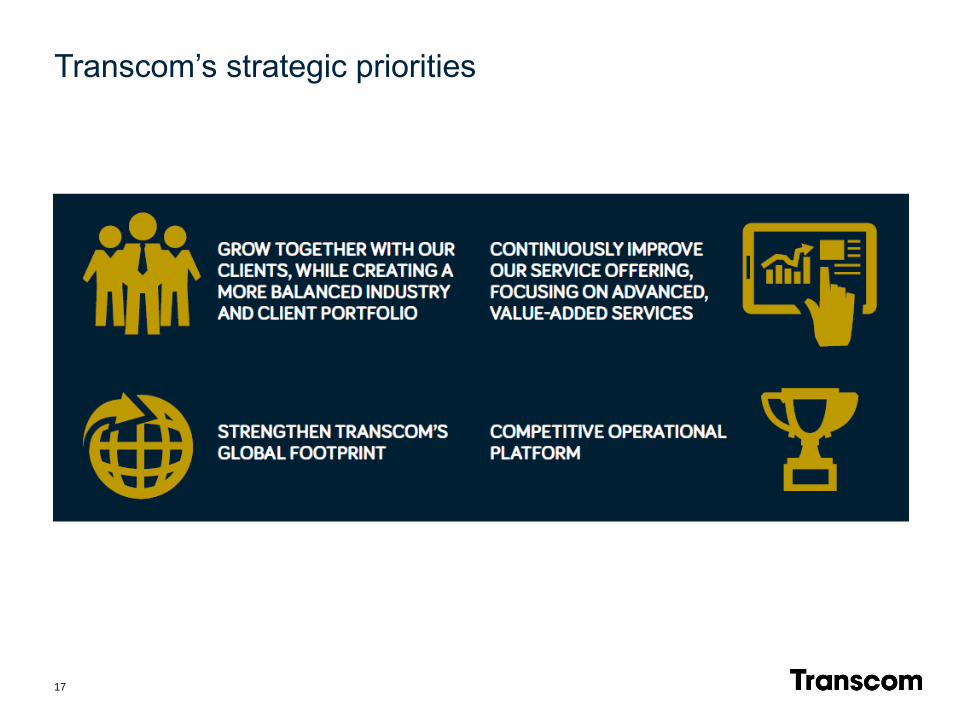
Transcom’s strategic priorities
17
18
www.transcom.com blog.transcom.com
Stay up-to-date on Transcom

Thank you! Questions?