

TransporT
The PoTenTial for innovaTion
ouTlook2010

The International Transport Forum is a strategic think tank for the transport sector. Each year, it brings together Ministers from over 50 countries, along with leading decision-makers and thinkers from the private sector, civil society and research, to address transport issues of strategic importance. An intergovernmental organisation linked to the OECD, the Forum's goal is to help shape the transport policy agenda, and ensure that it contributes to economic growth, environmental protection, social inclusion and the preservation of human life and wellbeing. The 2010 International Transport Forum, to be held on 26-28 May in Leipzig, Germany, will focus on Transport and Innovation: Unleashing the Potential. This document was produced as background for the 2010 International Transport Forum, on 26-28 May in Leipzig, Germany, on Transport and Innovation: Unleashing the Potential.
For more information please see www.internationaltransportfoum.org.
The views expressed in this document do not necessarily reflect those of the Member
Countries of the International Transport Forum.

Transport Outlook 2010: The Potential for Innovation — © OECD/ITF 2010 3
Table of Contents
Summary ..................................................................................................................................... 5 1. Introduction ........................................................................................................................ 7 2. Crisis, recovery and transport –a brief update ................................................................... 8 3. Innovation for low carbon transport: the key is technology ............................................ 13
3.1. Different energy sources and/or less demand? ......................................................... 13 3.2. The past development of car ownership and car use ................................................ 14 3.3. The future development of car use and CO2 emissions from transport ................... 19 4. Conclusion ......................................................................................................................... 28 References ................................................................................................................................ 29
Transport Outlook 2010: The Potential for Innovation — © OECD/ITF 2010 5
TRANSPORT OUTLOOK 2010
THE POTENTIAL FOR INNOVATION Summary This paper provides evidence on and discussion of recent developments in global
transport markets and analyzes what policies look most promising for stabilizing CO2‐
emissions from light‐duty vehicles. In the aftermath of the economic crisis, recovery is
uncertain and unevenly spread across the globe. This has potential impacts on global trade
patterns and commodity flows, and hence on key freight transport flows. For the
management of future greenhouse gas emissions from transport, our analysis strongly
suggests that technologies to improve fuel economy and ultimately transform the energy
basis of transport are the key, as there are very strong upward pressures on demand
volumes. This of course does not mean that demand management in transport is unjustified
or does not contribute at all to greenhouse gas abatement, but its potential is limited so that
technological improvement is at the core of climate change policy in the transport sector.

Transport Outlook 2010: The Potential for Innovation — © OECD/ITF 2010 7
1. Introduction The 2010 Transport Outlook provides evidence on and discussion of some key
developments in global transport markets. Just like the 2008 and 2009 editions, it is a “mini‐
Outlook”, focussing on issues of particular current interest instead of providing a
comprehensive overview of trends and developments in the transport sector. The 2009
Outlook focussed on the impacts of globalization and of the economic crisis on the transport
sector, pointing out how globalization and the unfolding of the crisis interacted and how this
impacted transport flows particularly strongly. In Section 2 we provide an update of this
diagnosis, showing that there is economic recovery but that it is uncertain and unevenly
spread across the globe. This uneven development has potential impacts on global trade
patterns and commodity flows, and hence on key freight transport flows.
Section 3 focuses on expected developments of CO2‐emissions from transport,
light‐duty vehicles in particular, asking how innovation through different policy approaches
can contribute to curbing the expected growth of these emissions. Our analysis strongly
suggests that technologies to improve fuel economy and ultimately transform the energy
basis of transport are the key to managing greenhouse gas emissions from transport, as
there are very strong upward pressures on demand volumes. This finding emphasizes the
importance of technological innovation in transport and design of the regulatory
environment to support innovation, and provides clear guidance on where the main policy
thrust should be. By no means do we argue that demand management in transport is
unjustified or does not contribute at all to greenhouse gas abatement, but we do see strong
arguments for emphasizing technological improvement as the core of climate change policy
in the transport sector. Policies to incentivize improvements of existing technology are part
of the answer and are relatively well understood. Policies to trigger transformation towards
new energy carriers for transport in the longer term are needed as well. These are much less
understood and take us into uncharted terrain.

8 Transport Outlook 2010: The Potential for Innovation — © OECD/ITF 2010
2. Crisis, recovery and transport – a brief update The 2009 Outlook discussed the impact of the economic crisis on transport as well
as its relation with, and possible effect on, trade and transport patterns, and its potential
effect on transport funding. One year later there is new information but not necessarily
enough to resolve uncertainty over future developments by very much. The following
paragraphs discuss some key points on global economic prospects.
There is a considerable degree of agreement among well‐known observers (IMF,
2010; OECD, 2010; Roubini Global Economics, 2010) over the key indicators and
expectations for the global economy, although assessments on the importance of downside
risks differ. Economic recovery has set in and it is better than expected. The IMF revised its
expectation for global growth upward to 4.25% for 2010. Recovery is slow in advanced
economies, notably in Europe, and remarkably fast in emerging economies, some of which
might better be called fast‐growing economies. By contrast, the growth potential in
advanced economies is limited and the output gap is large. Fiscal fragility and sovereign risk
are major concerns.
There are some concerns about the robustness of the rebound of growth in China.
China is strongly export‐reliant and its currency may be undervalued, and there are
mounting concerns about a risk of overheating and bubbles, especially in some segments of
the property market. Low interest rates in advanced economies and high growth in
emerging economies lead to resurgence of capital flows to the latter, allowing for
investment but potentially feeding bubbles. These developments suggest considerable
downside risk on the performance of the Chinese economy, with potentially severe
consequences for global economic development.
The 2008 shock has had a bigger impact on trade than earlier crises have. The
world trade index fell steeply and now seems headed back to pre‐crisis levels, see Figure 2.1.
Figure 2.2 shows how the trade intensity of global GDP grew rapidly over the past two
decades, an issue to which we return briefly below. One reason for the big impact on trade
is the geographical fragmentation of production processes. This fragmentation has been
facilitated by good and cheap transport, although it is not the only or even the main

Transport Outlook 2010: The Potential for Innovation — © OECD/ITF 2010 9
explanatory factor. Globalization of production has been facilitated by transport and it has
intensified the volatility of trade and of transport flows. Transport is therefore increasingly
exposed to macroeconomic risk.
Figure 2.1 CPB World trade volume index (2000=100), 1991/01 – 2010/02
Source: Netherlands Central Planning Bureau
Figure 2.2 CPB World trade volume and world GDP index (2000=100), 1991 ‐ 2008
Source: Calculated from Netherlands Central Planning Bureau and World Bank data

10 Transport Outlook 2010: The Potential for Innovation — © OECD/ITF 2010
The big negative shock on trade and subsequent recovery are reflected in transport
markets. As might be expected, with tepid pick‐up of demand and incomplete capacity
matching, there is continued pressure on margins in transport and logistics. Prices in early
2010 appear to be stabilizing at a lower level than before the crisis. Le Lloyd, 23/04/10,
shows data on the inverse movement of prices and capacity in road freight. The capacity
index rose to its highest level in Q1/09 (presumably reflecting the coming online of earlier
orders) and is approximately at the level of Q1‐Q3/08 in early 2010. Price indexes move in
the opposite direction, with the Q1‐Q3/08 index around 100, Q1/09 at 83, and Q3‐4/09 at
94.5 (see the evolution discussed in Capgemini – Transporeon, 2010). The Baltic Dry Index in
2009 and Q1/2010 (ca. 3000) is above the low of Q4/2008 (ca. 1000) but well below the
levels of 2007 and 2008 (ca. 8000). The trend is slightly upward.
Developments in aviation echo economic development patterns before, during and
after the crisis. Between 2000 and 2008, revenue‐passenger kilometres grew by 7% in North
America, by 29% in Europe, by 29% in Asia‐Pacific International markets, by 40% in Latin
America, by 184% in China and by 192% in India. In 2009, world international traffic fell by
3.9% and domestic traffic fell by 1.8%, but Asian and Middle Eastern traffic domestic traffic
grew strongly (+7.6% and +10.3% respectively). Year‐over‐year data on available seat‐
kilometres for February 2010 show a 1% decline in the USA, a drop of 2.6% in Western
Europe, and a growth of 15.9% in the emerging economies. Strong growth in, for example,
China does not mean that the potential has been exhausted. According to Zhang (2010), in
2008 there were less than 0.2 flights per inhabitant per year in China , compared to about
three in the US.
For global economic development in the longer run, the following ideas are worth
noting. There is wide consensus that China (as well as other heavily export‐oriented
economies) should strive for a growth strategy more geared towards domestic demand.
Policies go in that direction to some extent (e.g. infrastructure development) but economic
structures still embody very strong incentives for firms and households to save: there are
poor credit structures for private firms and there is a lack of insurance options for
households; a lingering effect of the 1998 currency crises is that there is substantial public

Transport Outlook 2010: The Potential for Innovation — © OECD/ITF 2010 11
saving to protect against currency risk. The consequence is that domestic demand remains
weaker than it could be, at least in the medium term. Weak domestic demand combined
with uncertain and tepid recovery in the economies to which China exports contribute to the
uncertainty over the longer term outlook for China.
More generally there is a need for rebalancing global growth, i.e. moving away from
the extreme surplus–deficit relations among countries that emerged in the decade before
the crisis. This is not what is happening, however, as imbalances are widening again and
there is no immediate reason why they should start contracting. Imbalances are a problem
to the extent they reflect structural and macroeconomic problems in certain economies
(exporting as well as importing) that are accommodated and possibly amplified by trade,
free‐flowing capital, and excessively easy credit. Fiscal fragility in advanced economies and
reverse conditions in major emerging economies constitute a potential for rebalancing in the
longer run, but the speed and the nature of the process depend on policy measures in the
countries involved.
Rebalancing would affect trade flows, making them less unidirectional and possibly
leading to weakening of the trade intensity of economic development compared to 1991 –
2008 (see Figure 2.2). Trade flows are correlated with freight transport flows (and with
business travel), so their future development may be slower and geographically more
dispersed than might be expected on the basis of the experience of the pre‐crisis decade.
Hence, to the extent infrastructure investment patterns are shaped by extrapolations of
recent pre‐crisis trends, these programs may need revision. At the very least, uncertainty
has increased, and public funds have become more scarce, and these factors may call
ambitious gateway and corridor expansion programs into question. The point is not that
these programs have necessarily become useless, but that the opportunity costs have
increased because of scarcer funds and because other transport projects may have become
relatively more attractive.
Rebalancing and less trade intensive growth could be expected to lead to slower
growth in some modes than put forward in scenarios conditioned on pre‐crisis evolutions.
We illustrate this for aviation. Over the last three decades, the sector has seen fast growth,

12 Transport Outlook 2010: The Potential for Innovation — © OECD/ITF 2010
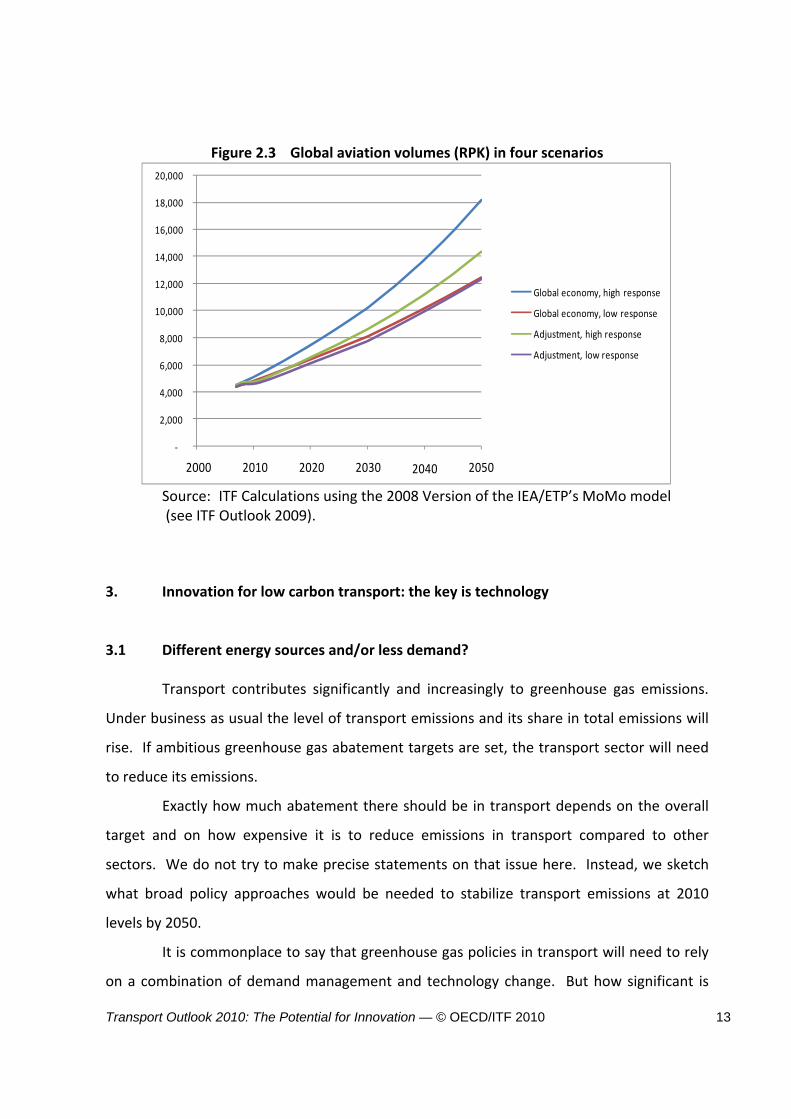
driven by higher incomes and deregulation among other factors. The 2009 ITF Outlook saw
the development of aviation as shown in figure 2.3 below. Two Global Economy scenarios
plot paths for growth before the economic crisis struck. These baseline scenarios both show
significantly lower volumes than industry forecasts. The Adjustment scenarios account for
the crisis and assume that globalization continues in a more moderate way after economic
recovery, resulting in slower growth. The Low Response variants assume the elasticity of
aviation demand with respect to global GDP is one (1% GDP growth results in 1% aviation
growth). The High Response variants assume that the elasticity of aviation demand is
considerably higher than one (and driven for example by deregulation).
The Adjustment Low Response plot may be the most plausible scenario. However, it
ignores the potential for growth in aviation demand from further deregulation in some
markets, particularly in northeast Asia, and adaptation to deregulation in others. The
Adjustment High Response scenario can be seen as an upper bound of what can be reached
with such policy efforts. How much more growth the sector can look forward to will depend
on innovation to reduce costs for airlines, airports and air traffic control and innovative
business models that create new markets in the way low cost carriers have achieved. It is
worth noting that even under more conservative assumptions passenger travel volumes
likely will triple over the next 40 years.
Transport Outlook 2010: The Potential for Innovation — © OECD/ITF 2010 13
Figure 2.3 Global aviation volumes (RPK) in four scenarios
‐
2,000
4,000
6,000
8,000
10,000
12,000
14,000
16,000
18,000
20,000
2,000 2,010 2,020 2,030 2,040 2,050
Global economy, high response
Global economy, low response
Adjustment, high response
Adjustment, low response
2000 2010 2020 2030 2040 2050
Source: ITF Calculations using the 2008 Version of the IEA/ETP’s MoMo model (see ITF Outlook 2009). 3. Innovation for low carbon transport: the key is technology 3.1 Different energy sources and/or less demand?
Transport contributes significantly and increasingly to greenhouse gas emissions.
Under business as usual the level of transport emissions and its share in total emissions will
rise. If ambitious greenhouse gas abatement targets are set, the transport sector will need
to reduce its emissions.
Exactly how much abatement there should be in transport depends on the overall
target and on how expensive it is to reduce emissions in transport compared to other
sectors. We do not try to make precise statements on that issue here. Instead, we sketch
what broad policy approaches would be needed to stabilize transport emissions at 2010
levels by 2050.
It is commonplace to say that greenhouse gas policies in transport will need to rely
on a combination of demand management and technology change. But how significant is

14 Transport Outlook 2010: The Potential for Innovation — © OECD/ITF 2010
each of these broad components? Even an imprecise answer to this question is important as
it helps determine policy priorities, not least for innovation. Should the focus be on
strengthening policy frameworks and institutions that shape the demand for transport, or
should the focus be on transforming the energy base for (moderately modified) current
transport patterns?
We conclude that the policy focus should be on transforming the energy base for
moderately modified transport patterns. The reasons are twofold. First, as will be
illustrated below, if development patterns in fast‐growing economies are anywhere near
expectations, then extremely constraining demand management policies would be needed
to stabilize CO2‐emissions. It is unlikely that such policies are possible, and it is unlikely that
they are desirable as the cost of attaining abatement targets might be very high. Second,
failure to attain targets holds major climate risks, so uncertainty on policy success should be
kept low. Technology oriented policies are in that sense preferable, as they provide a more
direct influence on transport emissions than demand management.
Concretely, the reference scenario used in the exercises discussed below is a
reasonable indication of where demand would like to go. Demand could be higher (the
response of transport demand to GDP growth in the reference scenario is quite moderate)
and it could be lower (energy supply is assumed to be highly elastic in the reference scenario
so that no major price increases are foreseen). Demand could also be lower if highly
effective demand management policies are put in place. There is a potential – and a
rationale – for such policies, with especially large prospective impacts on demand in regions
where urbanization is expected to increase quickly. But, though the economic case for such
policies exists regardless of climate change considerations, the impacts on aggregate
demand are not of the scale necessary to meet ambitious abatement targets.
3.2 The past development of car ownership and car use By and large – and at the risk of oversimplifying – Post World War choices on
strategic directions of transport policy in many countries have essentially been
accommodating, in the sense that consumers have not been constrained very strongly in

Transport Outlook 2010: The Potential for Innovation — © OECD/ITF 2010 15
their choices as their purchasing power increased over time. This accommodating policy
approach has been the most explicit in the USA, both in transport and in land use policies.
Europe has taxed fuels more heavily and had less degrees of freedom in the development of
transport networks, as their key structure was in place already. Japan has constrained car
ownership and use more strongly, and its spatial structure is more conducive to collective
transport modes.
Figures 3.1 and 3.2 provide a quick overview of the results of economic
development and past policy choices in transport for private passenger car transport. The
pattern is well‐known, with:
o High levels of car ownership and use throughout, both growing strongly with
GDP, first at an increasing and then a declining rate;
o Signs of levelling off of car ownership and use in advanced economies (we
return to interpretation below);
o Differences between countries and regions strongly correlated to the
differences sketched in the previous paragraph, where Japan in particular
displays a less car‐intensive growth pattern over time;
o Fast‐growing economies such as China (and India, represented in Figure 3.1
only) are still a long way from ownership and use levels in advanced
economies. The distance is so large that it is not obvious whether a country
like China will develop more in line with the US extreme, the intermediate
European cases, or the less car‐intensive Japanese case although a logarithmic
version of the charts, as well as evidence on current policies and on spatial
structure, suggest that the latter is least likely.

16 Transport Outlook 2010: The Potential for Innovation — © OECD/ITF 2010
Figure 3.1 Car ownership per 1000 Inhabitants
Source: Own calculations on Transportation Energy Data Book and World Bank online data. Note: Data for the US underestimated passenger vehicle ownership because of the large
share of trucks owned for personal use. Including personal use trucks would increase ownership rates to ca. 700 – 750 vehicles per 1000.
Figure 3.2 Passenger kilometre by car per year
Source: Own calculations on ITF and World Bank online data. Note: Data for the US underestimated passenger vehicle ownership because of the large
share of trucks owned for personal use. Including personal use trucks would increase use to more than 20 000 km/year at the highest income levels.

Transport Outlook 2010: The Potential for Innovation — © OECD/ITF 2010 17
Car use and, to a lesser extent, car ownership patterns in advanced economies
appear to be levelling off or even declining. It is at this stage uncertain what are the causes
of this phenomenon. Puentes and Tomer (2008) discuss evidence for the US and seem to
suggest the pattern reflects true saturation, i.e. even as total spending power increases,
spending on car transport would not increase as consumers derive no extra utility from it.
Crozet (2009) sees signs of zero growth in car transport in France, and points out that there
is substitution towards faster modes like high‐speed trains and air transport. This would
mean there is no saturation in transport in a broader sense, even if car travel may be
reaching peaks. It is important to point out that the levelling off is observed at times when
fuel prices were high and very uncertain, whereas GDP was low and very uncertain with
large downside risks. These factors also discourage travel, and consequently car travel may
pick up again when uncertainty is reduced at moderate price levels. The most recent
evidence for the US indicates that the downward trend has indeed been reversed (Young,
2010). Overall, it seems to us that assuming zero‐growth of car travel volumes in advanced
economies is a conservative assumption, i.e. it is plausible but it is more likely that travel will
be higher than that it will be lower, because assuming saturation for all income groups
seems an extreme assumption lacking very solid empirical support.
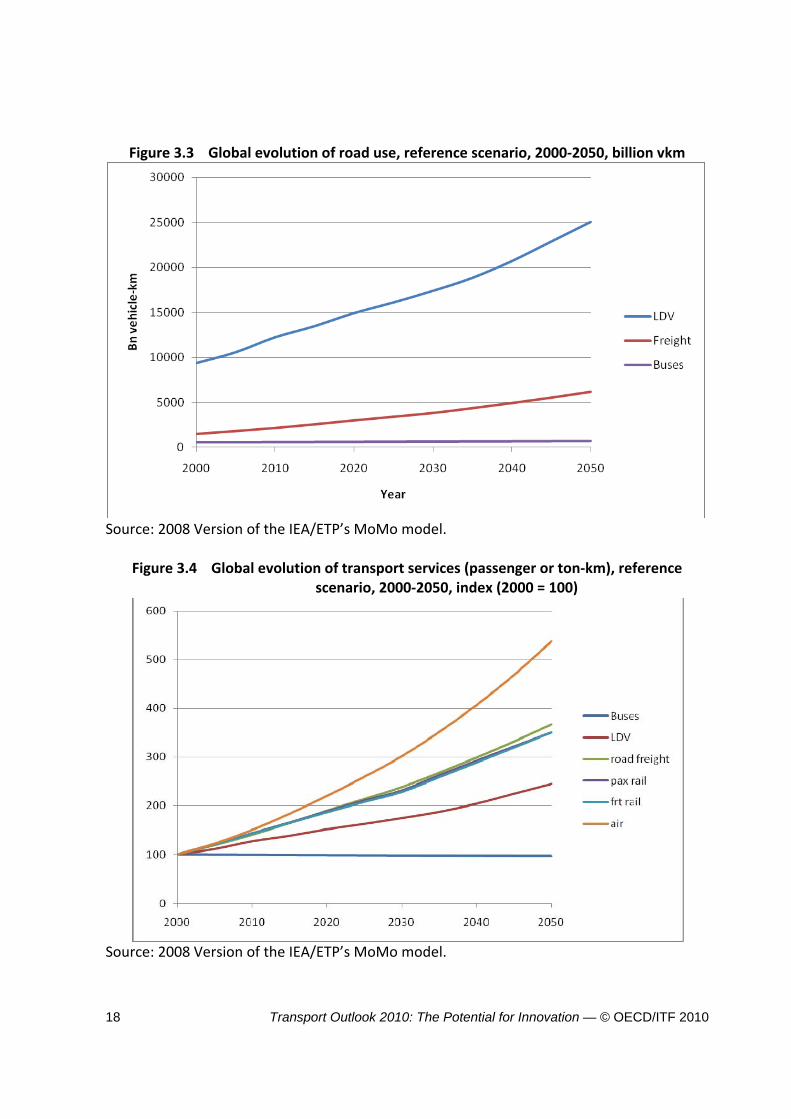
The future development of road use and transport services, as projected in the
MoMo‐model that serves as the basis for our assessment of the impacts of alternative policy
approaches, is depicted in Figures 3.3 and 3.4 respectively. Road use (Figure 3.3) , measured
in vehicle‐kilometres, is expected to grow strongly mainly because of fast growth of light‐
duty vehicle use and to a somewhat lesser extent the increased use of trucks. Figure 3.4
shows transport services, i.e. pkm or tkm, for a broader set of modes. Measured in this
dimension freight services (both road and rail) are expected to grow faster than road
passenger services. Moreover, air passenger output is expected to grow faster than road
passenger output, and is prospectively the fastest growing mode by far. Section 3.3 analyses
light‐duty‐vehicle use in more detail using the same model, asking how demand‐ and
technology oriented measures might contribute to the control of CO2‐emissions from that
mode and from transport in general.
18 Transport Outlook 2010: The Potential for Innovation — © OECD/ITF 2010
Figure 3.3 Global evolution of road use, reference scenario, 2000‐2050, billion vkm
Source: 2008 Version of the IEA/ETP’s MoMo model.
Figure 3.4 Global evolution of transport services (passenger or ton‐km), reference scenario, 2000‐2050, index (2000 = 100)
Source: 2008 Version of the IEA/ETP’s MoMo model.

Transport Outlook 2010: The Potential for Innovation — © OECD/ITF 2010 19
3.3 The future development of car use and CO2‐emissions from transport Figure 3.3 shows the evolution of global car travel volumes according to the 2008
version of the MoMo transport model. The reference case in Figure 3.3 is identical to the
MoMo ETP reference scenario of 2008 (since updated by ETP, but these updates are not
used here). We compare it to a range of alternative scenarios:
o Saturation OECD, Reference Rest of World (ROW) (high driving OECD): We
assume that all OECD countries are advanced economies and there is
saturation of car driving, i.e. even with higher incomes per capita ownership
and use stops growing as of 2010. According to the discussion of Section 3.2,
this is a plausible if unlikely scenario. The main lesson from this scenario is
that the difference with the reference case is minor, i.e. the reference case
already assumes little car traffic growth in the OECD. This highlights the
relevance of the alternative base cases of the 2008 Outlook, which pointed
out the possibility of stronger car traffic growth than assumed in the
reference case. We reproduce one of the 2008 scenarios in Figure 3.6.
o Saturation OECD, Reference ROW (low driving OECD): Here we assume
constant ownership rates as of 2010 and in addition a decline in average
annual use of a car. For example, average annual use declines by 15%
between 2010 and 2050 in OECD – North America. This decline could be
consistent with the Crozet‐type of saturation: ownership does not decline but
usage does, as there is a switch to faster modes for a number of trip
purposes. (This could lead to an increase of use of other modes compared to
the reference scenario, but since MoMo uses separate projections per mode
and we have no information on the size of the substitution effect, we have
not modelled this effect. The impact on CO2‐emissions might not be very
large given that part of the effect is absorbed by higher occupancy rates and
by the fact that per kilometre CO2‐emission may not differ in major ways
between modes.) In this scenario car travel grows a bit slower than in the
reference case, but the change is not large enough to modify the trend. Even

20 Transport Outlook 2010: The Potential for Innovation — © OECD/ITF 2010
fairly strong reductions of driving in advanced economies hence seem
incapable of drastically changing global driving volumes in the future.
o Arrest (high driving OECD): This is an extreme scenario, halting the
development of car transport at around 2010 levels worldwide (the dynamic
nature of the model triggers an increase of volumes up to around 2020, and
then volumes converge back to 2010 levels). The purpose of this scenario is
to reveal the impact of technological innovation, and shows that stabilising
car vkm results in a 17% reduction in CO2 emissions by 2050.
o China low: The former scenarios reflect the fact that evolutions in advanced
economies become of less importance in determining global transport
volumes as fast‐growing economies become richer. Because of its size and
the fact that it has embarked on a rapid development path faster than India,
developments in China are of particular interest. The “China low” scenario
assumes that the development of the car stock is half as large as in the
reference scenario. This could be interpreted as meaning that China would
develop more slowly than commonly assumed but here it is used to test
outcomes if China seeks, through policy, a much more moderate growth in car
ownership compared to patterns observed earlier in advanced economies.
The developments could reflect a “Japan‐style” pattern of transport
development. Strong policy would be needed both because Japan has strong
policies and its spatial structure is very different from China. This scenario is
not a very likely one in view of current developments and policies1. It makes a
big difference for global traffic volume growth, decelerating the trend but not
stabilising global volumes.
1 E.g. with China’s focus on automobile production to drive economic growth. Singapore could be
taken as a model for the type of policy approach that can steer travel volume growth. As discussed in ITF (2010), a coherent and strong set of policy measures is required to achieve that result, even with the strong spatial constraint of Singapore.
Transport Outlook 2010: The Potential for Innovation — © OECD/ITF 2010 21
The main message from Figure 3.5 is that even strong car usage reductions in
advanced economies contribute only weakly to moderating global car travel growth. This
does not mean lower demand is a bad thing, as it may reflect changing preferences or may
be induced by better transport policies. These should not, however, be the focus of
attempts to reduce global greenhouse gas emissions from transport because they are not
very effective.
Slower growth of car traffic in fast‐growing economies, in particular China, does
have quite substantial impacts on global car travel volumes. But whether moderating
growth to the extent assumed in some scenarios is desirable or even feasible is far from
obvious – and in our view unlikely. In fact, it is conceivable that traffic grows faster than is
assumed in the reference situation. This possibility was investigated in the 2008 Outlook,
and Figure 3.6 reproduces results on light‐duty vehicle travel from one scenario discussed
there. The “High driving non‐OECD” scenario assumes that vehicle use outside the OECD
would develop in line with GDP according to elasticities measured in OECD countries in the
recent past. The cumulative effect of this assumption is much faster growth of car use than
in the reference case. This scenario can be seen as an upper bound on the evolution of
global car use, while the “China low” scenarios is a lower bound. Uncertainty over a 40 year
horizon obviously is large, so that this informally constructed confidence interval is large as
well.
In sum, the reference scenario is a reasonable benchmark for the evolution of car
travel. This assessment helps gauge the relative importance of demand‐oriented policies
and technological change in managing CO2‐emissions from car transport.

22 Transport Outlook 2010: The Potential for Innovation — © OECD/ITF 2010
Figure 3.5 Global light duty vehicle travel, 1980 ‐ 2050
Source: ITF Calculations using the 2008 Version of the IEA/ETP’s MoMo model
Figure 3.6 Global light duty vehicle travel, 1980 ‐ 2050
Source: ITF Calculations using the 2008 Version of the IEA/ETP’s MoMo model

Transport Outlook 2010: The Potential for Innovation — © OECD/ITF 2010 23
Figure 3.7 shows the global car CO2‐emission patterns that correspond to the
scenarios of Figure 3.5. Comparing the patterns for “Arrest” in Figures 3.5 and 3.7 shows
that stable driving patterns translate into declining emissions from cars, because of
technological progress taking place under reference assumptions. Correspondingly, for all
other scenarios, changes in CO2‐emission levels are amplified compared to traffic volume
changes, because of the same technological change.
In addition to the scenarios of Figure 3.5, Figure 3.7 includes a scenario called
“Phase out SUVs”. In this scenario, the use of light trucks for passenger transport is
gradually phased out, and this leads to a CO2‐emission pattern that is nearly identical to the
scenario where car ownership in the advanced economies is constant as of 2010 and driving
declines. This is a very crude illustration that downsizing, a behavioural change presumably
less drastic than cutting driving by 15% over 40 years, performs quite well in terms of
reducing CO2‐emissions.
Figure 3.7 Global CO2 emissions from light duty vehicles, 2000 ‐ 2050
Source: ITF Calculations using the 2008 Version of the IEA/ETP’s MoMo model
Apart from the “Arrest” scenario, only the “China low” comes close to stabilising
global CO2‐emissions from car travel, although by 2050 emissions start increasing (because

24 Transport Outlook 2010: The Potential for Innovation — © OECD/ITF 2010
of the delayed effect of stock growth). Should India start developing more quickly than
assumed in the reference case, this will contribute further to the upward trend near the end
of the simulation period.
Figure 3.8 puts the scenarios for car travel in the context of total emissions from
transport vehicle use, making clear that even very drastic changes in car emissions (here
triggered by demand changes, but technology‐induced changes would produce the same
picture) are not enough to provoke strong changes in the upward trend of global emissions
from transport activity.
Figure 3.8 Global CO2 emissions from transport vehicles, 2000 ‐ 2050
Source: ITF Calculations using the 2008 Version of the IEA/ETP’s MoMo model
Figure 3.9 breaks down global emissions of CO2 by transport mode, for the
reference scenario. It shows that emissions from light‐duty vehicles continue to dominate
but that growth rates in road freight transport and in aviation are equally large. Abatement
efforts in road freight and aviation hence appear to be indispensable in controlling transport
emissions, although definitive statements on burden sharing should be guided by least‐cost
principles instead of emission volumes.

Transport Outlook 2010: The Potential for Innovation — © OECD/ITF 2010 25
In the reference scenario, emissions from car use are about 60% higher in 2050 than
in 2010. Demand management and/or phenomena of saturation could lead to slower
growth, leading to emission levels of say 4 000Mt in 2050 or 38% more than in 2010. While
such slower growth may change the case for the adoption of particular sets of technologies
in the future, it does not change the case for searching for alternative technologies to power
cars. It would not do so if slower growth were a certainty, and a fortiori it does not change
the case when the development of demand is highly uncertain and may just as well be
higher than the reference case.
Figure 3.9 Global CO2‐emissions by transport mode, reference scenario, 2000‐2050
Source: ITF Calculations using the 2008 Version of the IEA/ETP’s MoMo model

26 Transport Outlook 2010: The Potential for Innovation — © OECD/ITF 2010
Figure 3.10 Global CO2 emissions from light duty vehicles with better fuel economy, 2000 ‐ 2050
Source: ITF Calculations using the 2008 Version of the IEA/ETP’s MoMo model
Technology policies to reduce greenhouse gas emissions from light duty vehicles
improve vehicle fuel economy by boosting the performance of conventional technology or
by switching, wholly or partially, to alternative forms of energy. Figure 3.10 shows global
light duty vehicle emissions for the reference scenario and for a scenario where fuel
economy is improved so as to stabilize emissions at 2010 levels (see GFEI 2010 for a
discussion of the technological innovation potential); in addition, it shows what emissions
would result if such a technology boost were implemented and demand in China were to
develop much more slowly than expected in the reference scenario.
Under the assumptions on the development of demand of the reference scenario,
stabilizing global LDV emissions of CO2 requires that new vehicles reach a fuel economy level
of roughly 4l/100km (60m/g, 90gCO2/100km) in 2050. This is an improvement of 44%
compared to the reference scenario level of 2010. For comparison, average fuel economy
improved by about the same proportion (46%) between 1975 and 2010 (a slightly shorter
Transport Outlook 2010: The Potential for Innovation — © OECD/ITF 2010 27
period) according to MoMo data. Of course, further improvements are more difficult to
attain as the starting level is higher, so that the reference scenario puts forward an
improvement of only 12% (or little more than ¼ of what is needed to stabilize emissions).
Improving fuel economy by 44% instead of 12% is technologically possible, but
increases the cost and price of vehicles if other attributes do not change. Alternatively,
other attributes could be given up, e.g. by downsizing, a strategy that carries some costs in
terms of consumer surplus. It is often argued that consumers underestimate the benefits of
investing in better fuel economy, so that costs of improving it with greenhouse gas
abatement targets in mind turn out lower than might be expected. Nevertheless, it stands
to reason that improving environmental quality is costly in general. The important thing is to
keep the costs as low as possible. Carbon prices and fuel economy standards are needed to
accomplish this task (see ITF, 2010, for argumentation).
We have not made specific assumptions about how the fuel economy of light duty
vehicles can be improved. On that issue, it is worth noting that scenarios such as
“stabilization” can be misleading, in the sense that even with strong improvements of fuel
economy the global emissions of greenhouse gases will ultimately rise when demand rises
strongly enough. Higher demand in China, India or other emerging economies is likely to
result ultimately, although possibly after the model horizon of 2050. Radical innovation to
decarbonize transport avoids this problem, and the effects of such strategies (e.g. by
focussing on carbon‐free electricity) should be considered on post 2050 horizons.
Oversimplifying one could see the 2010 – 2050 period as one of incremental innovation
(with improvements to known technologies and their dissemination in the market as set out
for example in GFEI 2010) which helps to slow down the growth of emissions or stabilize
them. Beyond 2050 the effects of radical innovation then become visible, extending the
trend of mitigating emissions and leading to complete decoupling of road passenger
transport demand and greenhouse gas emission levels. Preparations for such radical
innovation need to start now if it is maintain a trend of stabilising overall emissions from
transport from 2050 onwards.

28 Transport Outlook 2010: The Potential for Innovation — © OECD/ITF 2010
4. Conclusion The economic recovery is uncertain and uneven. Uneven development has
potential impacts on trade patterns and hence on key freight transport flows. Increased
uncertainty and tighter financing conditions may require revisions to and reprioritization of
large scale investment strategies for transport infrastructure.
Innovation is the key to managing the growth of greenhouse gas emissions from
transport. Energy efficiency will need to increase rapidly to contain growth, as containing
demand may prove very hard even if it were desirable. Innovation, in the sense of better
technology and faster take‐up in markets, is required and will not take place without strong
and credible policy commitment. Improving fuel economy is essential, but in the long run
not enough, when instead the energy base of transport needs to change if emission levels
are to be kept low indefinitely. Here the policy challenge is massive

Transport Outlook 2010: The Potential for Innovation — © OECD/ITF 2010 29
References Capgemini – Transporeon, 2010, Transport Market Monitor Edition 2 (March 2010), Capgemini – Transporeon. Crozet Y., 2009, The prospects for interurban travel demand, ITF/OECD JTRC Discussion Paper 2009‐14. GFEI, 2010, Global Fuel Economy Initiative, Toward 50by50: An Assessment of Prospects and Progress http://internationaltransportforum.org/2010/Events.html IMF, 2010, World economic outlook 2010 – rebalancing growth, IMF, Washington DC. ITF, 2010, Implementing congestion charging – summary and conclusions, JTRC Discussion Paper 2010‐12. Le Lloyd, 2010, Les prix du fret du transport routier se stabilisent á un niveau plus bas, Le Lloyd 23/04/10. OECD, 2010, What is the economic outlook for OECD countries? An interim assessment, OECD, Paris. Puentes R. and A. Tomer, 2008, The road... less travelled: an analysis of vehicle miles travelled trends in the US, Brookings Institution – Metropolitan Infrastructure Initiative Series. Roubini Global Economics, 2010, Q2 2010 update – RGE global economic outlook, RGE. Young P., 2010, Upward trend in vehicle‐miles resumed during 2009, Transportation Trends in Focus, RITA – BTS, April 2010. Zhang A., 2010, China’s air transport market: Developments, challenges, and prospects, Presentation at the 4th Airneth Annual Conference, 15 April 2010.

www.internationaltransportforum.org


