
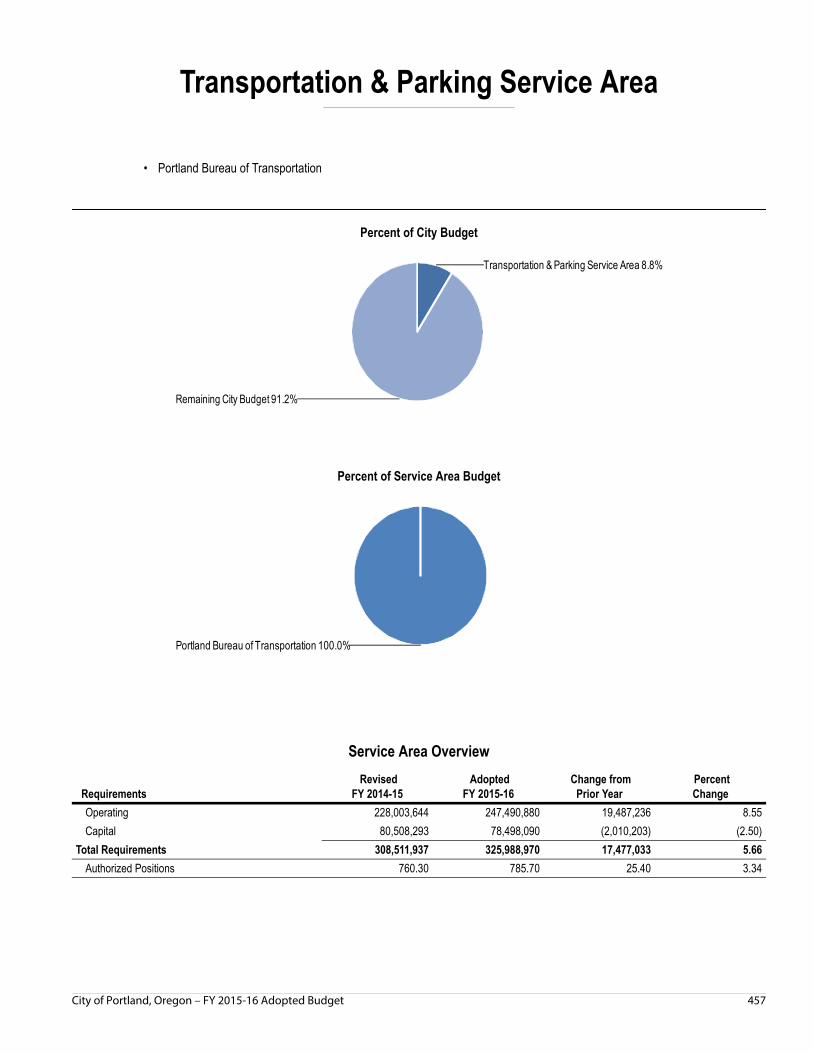
Transportation & Parking Service Area
Percent of City Budget
Percent of Service Area Budget
Service Area Overview
Requirements Revised
FY 2014-15 Adopted
FY 2015-16 Change from
Prior Year PercentChange
Operating 228,003,644 247,490,880 19,487,236 8.55
Capital 80,508,293 78,498,090 (2,010,203) (2.50)
Total Requirements 308,511,937 325,988,970 17,477,033 5.66
Authorized Positions 760.30 785.70 25.40 3.34
• Portland Bureau of Transportation
Transportation & Parking Service Area 8.8%
Remaining City Budget 91.2%
Portland Bureau of Transportation 100.0%
City of Portland, Oregon – FY 2015-16 Adopted Budget 457

Transportation & Parking Service Area
Service Area HighlightsDescription
The Transportation & Parking service area includes programs that plan, build, manage, maintain, and facilitate an effective and safe transportation system and provide access and mobility throughout the city. The service area consists of one bureau, the Portland Bureau of Transportation (PBOT).
Major Themes
Bureau of Transportation
The bureau's total FY 2015-16 Adopted Budget is $326.0 million. Of that amount, the Capital Improvement Plan for FY 2015-16 totals $78.5 million and includes funding for streetlight LED conversion, the Sellwood Bridge replacement match, parking machines, safety projects, and road rehabilitation.
Although PBOT's five-year (FY 2015-20) financial forecasts for Gas Tax and General Transportation Revenue are projected to be relatively flat, the bureau's operating fund is receiving a significantly higher amount of funding from the City's General Fund in FY 2015-16 than in prior years, including ongoing resources of almost $1.2 million for improving unpaved streets. Other significant one-time transfers from the General Fund include $4.7 million for safety improvements on 122nd Avenue to prepare the street for rapid bus service and $12.1 million for seven major maintenance projects. Another change results from the implementation of a parking meter district in northwest Portland in the fall of 2015 which will generate an estimated $3.0 million in new parking revenues annually.
However, with discretionary revenues projected to be relatively flat in coming years at a time when the City needs to invest more in maintaining the infrastructure, the current level of service continues to be insufficient to prevent transportation infrastructure from further deterioration. Efforts to address the lack of resources with new local revenue streams are pending the outcome of a potential Oregon State Transportation package during the 2015 legislative session.
With regards to fund reserves, the Portland Bureau of Transportation maintains a Transportation Reserve Fund (separate from the operating fund) but has been unable to fund it at the desired 10% level of discretionary revenues.
458 City of Portland, Oregon – FY 2015-16 Adopted Budget
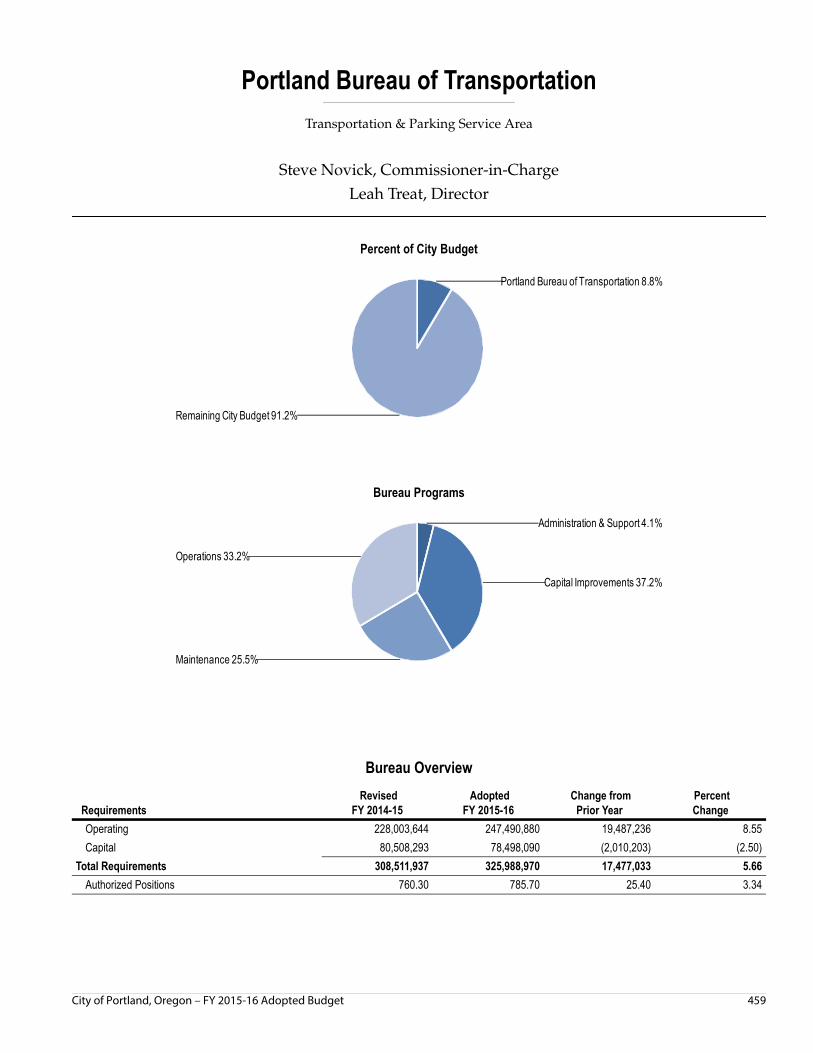
Portland Bureau of Transportation
Transportation & Parking Service Area
Steve Novick, Commissioner-in-ChargeLeah Treat, Director
Percent of City Budget
Bureau Programs
Bureau Overview
Requirements Revised
FY 2014-15 Adopted
FY 2015-16 Change from
Prior Year PercentChange
Operating 228,003,644 247,490,880 19,487,236 8.55
Capital 80,508,293 78,498,090 (2,010,203) (2.50)
Total Requirements 308,511,937 325,988,970 17,477,033 5.66
Authorized Positions 760.30 785.70 25.40 3.34
Portland Bureau of Transportation 8.8%
Remaining City Budget 91.2%
Administration & Support 4.1%
Capital Improvements 37.2%
Maintenance 25.5%
Operations 33.2%
City of Portland, Oregon – FY 2015-16 Adopted Budget 459
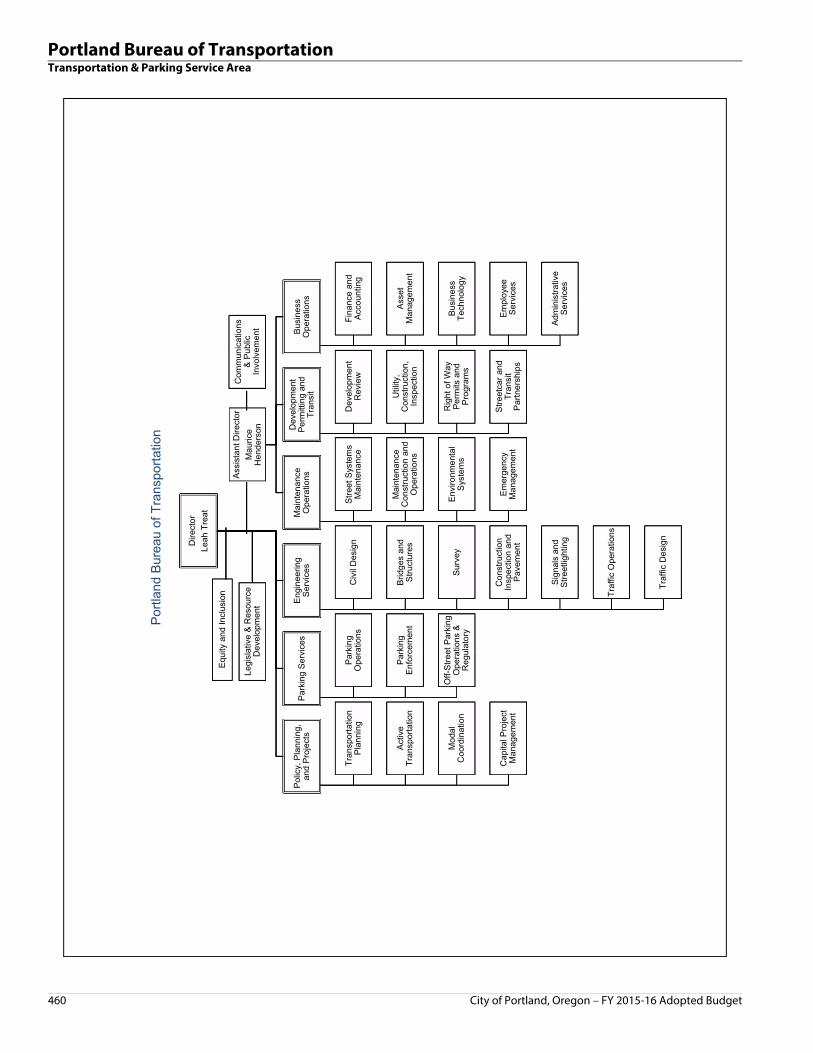
Portland Bureau of TransportationTransportation & Parking Service Area
Por
tland
Bur
eau
of T
rans
porta
tion
Dire
ctor
Leah
Tre
at
Pol
icy,
Pla
nnin
g,
and
Pro
ject
s
Tran
spor
tatio
nP
lann
ing
Act
ive
Tran
spor
tatio
n
Mod
alC
oord
inat
ion
Cap
ital P
roje
ct
Man
agem
ent
Par
king
Ser
vice
s
Par
king
Ope
ratio
ns
Par
king
Enf
orce
men
t
Off-
Stre
et P
arki
ng
Ope
ratio
ns &
R
egul
ator
y
Eng
inee
ring
Ser
vice
s
Civ
il D
esig
n
Brid
ges
and
Stru
ctur
es
Sur
vey
Con
stru
ctio
nIn
spec
tion
and
Pav
emen
t
Sig
nals
and
S
treet
light
ing
Traf
fic O
pera
tions
Traf
fic D
esig
n
Legi
slat
ive
& R
esou
rce
Dev
elop
men
t
Equ
ity a
nd In
clus
ion
Ass
ista
nt D
irect
orM
auric
eH
ende
rson
Mai
nten
ance
Ope
ratio
ns
Stre
et S
yste
ms
Mai
nten
ance
Mai
nten
ance
Con
stru
ctio
n an
d O
pera
tions
Env
ironm
enta
lS
yste
ms
Em
erge
ncy
Man
agem
ent
Dev
elop
men
tP
erm
ittin
g an
d Tr
ansi
t
Dev
elop
men
tR
evie
w
Util
ity,
Con
stru
ctio
n,In
spec
tion
Rig
ht o
f Way
P
erm
its a
nd
Pro
gram
s
Stre
etca
r and
Tr
ansi
tP
artn
ersh
ips
Bus
ines
sO
pera
tions
Fina
nce
and
Acc
ount
ing
Ass
etM
anag
emen
t
Bus
ines
sTe
chno
logy
Em
ploy
ee
Ser
vice
s
Adm
inis
trativ
e S
ervi
ces
Com
mun
icat
ions
& P
ublic
In
volv
emen
t
460 City of Portland, Oregon – FY 2015-16 Adopted Budget

Portland Bureau of TransportationTransportation & Parking Service Area
Bureau SummaryBureau Mission
The Portland Bureau of Transportation is the steward of the City's transportation system, and a community partner in shaping a livable city. We plan, build, manage and maintain an effective and safe transportation system that provides access and mobility.
Bureau OverviewPortland is a national leader in safe, effective, and sustainable transportation solutions. The transportation system is a nearly $10 billion investment in assets that facilitate the movement of people, goods, and services within Portland. The Portland Bureau of Transportation (PBOT) employs more than 750 people at the Portland Building and the 1900 Building in downtown, the maintenance facility in Lower Albina, the Streetcar office in Northwest Portland, and the Sunderland Recycling Facility in Northeast Portland.
The Portland Bureau of Transportation is organized into the following groups:
Office of the Director Policy, Planning, and Projects Parking Services Engineering Services Maintenance Operations Development Permitting and Transit Business Services
The bureau's budget is organized around four budget programs: Administration and Support Services, Capital Improvements, Maintenance, and Operations. There is not a one-to-one correlation between groups and budget programs as some organizational units support more than one program area.
Strategic Direction
Goals and Objectives In 2014, the bureau developed Portland Progress, the two-year work plan that represents a staff and City-driven blueprint for how PBOT can together work to build a better Portland.
Portland Progress action items are informed first by the multiple long-range plans that guide all City agencies: the Portland Plan, the Comprehensive Plan, Climate Action Plan, and specifically to this bureau, the Transportation System Plan. Portland Progress was further developed through input and meetings with partner agencies, stakeholders, and employee focus groups.
The plan contains 176 steps that are grouped into five themes serving the public. The sixth theme, Shoring Up the Foundation, focuses on the people of PBOT and improved internal operations.
City of Portland, Oregon – FY 2015-16 Adopted Budget 461

Portland Bureau of TransportationTransportation & Parking Service Area
The work plan's six major themes are:
Preserve What We Have Built And Operate It Well PBOT has identified the need to preserve investments with preventive maintenance and to plan and design new facilities with maintenance in mind.
Embrace Vision Zero This theme addresses the need to use street design, public education, and to work with partners in law enforcement and the State Legislature to create streets where everyone, from the youngest to the oldest and people of all physical abilities, can move safely.
Build A Future Where All Can Grow And Thrive Portland continues to expand and grow in both population, employment and visitors. The city will continue to grow, so PBOT will need to plan and anticipate the challenges of growth by improving connectivity, moving freight more efficiently and addressing inequities of the past that hinder the future.
Effectively Manage City Assets Approximately one-fifth of the land area of Portland is held in public rights of way. This theme will address the need to make the most of the City's street space by prioritizing among competing uses, supporting the role of streets as community places and better managing parking.
Contribute To The Health And Vitality Of Our People And Our Planet Healthy and connected neighborhoods are a fundamental goal of the Portland Plan. This theme aims to improve community health and livability when PBOT creates safe active transportation options and recycle and compost in daily operations. PBOT intends to push forward in addressing and responding to climate change.
Shoring Up The Foundation PBOT's internal workplan is a proactive strategy to restore, reenergize and refocus both PBOT as an institution as well as the individuals it is comprised of. The bureau will have a renewed commitment to training, better communication within the agency, and more effective ways of communicating services provided.
While some actions will require additional resources, the majority are achievable through realigning staff and enlisting the help of key partners. Portland Progress is intended to be a living document for use internally as well as in the community. The bureau commits to reporting on progress through an online performance dashboard and periodic updates.
Key Performance Measures
PBOT's FY 2015-16 Adopted Budget includes the following Key Performance Measures
Portland streets are safe for all users, measured as reducing total serious, incapacitating (i.e. broken bone or worse) traffic injuries and fatalities
Portland residents are physically active by walking and biking and taking transit, measured by commuter trips made by walking, biking, or transit
Streetlighting costs are reduced over the next five years due to LED conversion, measured by percent of City-owned and maintained lighting that comes from LED streetlights
Transportation assets are maintained, measured by lane miles of major rehab paving on existing streets
Transportation assets are maintained, measured by percent of City-owned bridges in non-distressed condition
Streetcar operations are efficient and effective, measured by streetcar ridership
462 City of Portland, Oregon – FY 2015-16 Adopted Budget

Portland Bureau of TransportationTransportation & Parking Service Area
Transportation Funding
Across the nation and in Portland, transportation funding has been inadequate to meet the needs of a growing urban population. The American Society of Civil Engineers gives the nation's transportation infrastructure a grade of D+. The Oregon Secretary of State has found that fuel-efficient vehicles are contributing to diminishing revenue available for transportation. Reports for the City dating as early as 1987 identify the need for more funding sources for transportation beyond taxes and user fees paid when people drive vehicles.
The bureau has achieved tremendous success in increasing transportation options for Portland residents. Work to provide safe routes for walking, biking and public transit use reflects citywide policy directives, which establish ambitious goals for reducing greenhouse gas emissions, improving community health, and strengthening the local economy. At the same time, these efforts have the potential to dramatically impact the bureau's primary sources of discretionary revenue. The state highway trust fund and parking revenues comprise the vast majority of discretionary funding for the bureau. The bureau's financial health depends significantly on the public's continued reliance on automobile travel.
This paradox creates a challenge for the bureau as it seeks to promote active transportation and use of public transit while also maintaining sustainable levels of funding to ensure the continued viability of Portland's transportation system.
Appropriately managing and responding to community expectations in light of the increasing inadequacy of revenue streams to meet even basic maintenance obligations remains a challenge.
The Mayor and Commissioner in charge of PBOT proposed the Portland Street Fund in November 2014 as a way to have residents and businesses invest in the transportation system. In early 2015, the Mayor announced the City would put its outreach efforts on hold, pending action by the State Legislature, which may increase revenue for transportation or expand the tools available for local governments to raise revenue for transportation. The bureau expects public outreach and council consideration of funding options to continue in the 2015-16 fiscal year.
Summary of Budget Decisions
Additions Maintenance and Safety Funding
Funded by $4,690,000 one-time General Fund support, this project will implement safety improvements on 122nd Ave, which is one of the city's High Crash corridors.
Major Maintenance and Infrastructure Replacement Projects
A number of paving, rockslide abatement, traffic signal reconstruction, street light electrical safety improvements, and bridge maintenance projects are funded by $12,065,800 of one-time General Fund support.
Out of the Mud / Improve Unpaved Streets
PBOT is receiving $1,174,619 in ongoing General Fund Support, offset by $114,843 of one-time General Fund Support, to develop and implement options for improving unpaved streets.
City of Portland, Oregon – FY 2015-16 Adopted Budget 463
Portland Bureau of TransportationTransportation & Parking Service Area
Youth Bus Pass
$960,000 in one-time General Fund resources are provided to fund one-third of the costs of the Youth Bus Pass program for high school students in the Portland Public School District, allowing about 12,600 students to ride free during the school year.
Portland's Community Needs
The Safe Routes to School program for middle school students - funded by $300,000 of one-time General Fund resources - will support education, in-school events, needs assessments, and youth engagement by working with community partners and leveraging existing programs.
SW Corridor Transit Project
$700,000 in one-time General Fund support is added through a Special Appropriation to continue the development of the Draft Environmental Impact Statement and Local Preferred Alternative for the SW Corridor Transit Project.
Streetcar Capital Improvements
$250,000 in one-time General Fund support is added to the bureau's budget to provide for streetcar capital enhancements and capital maintenance to improve transit reliability.
Burnside Pedestrian Bridge
$500,000 of existing resources are re-allocated for a study and preliminary engineering for the Wildwood Trail crossing.
Development Review
Funded by $216,660 in service charges and fees, two positions are added to respond to an increased volume of applications and to ensure the program can meet service goals.
Streetcar Operations
The bureau is adding a position, funded by $68,208 in service charges and fees, to provide fare inspection to manage anticipated increased ridership from closing the Streetcar loop.
Sewer Cleaning
Two positions are funded by $250,000 of interagency revenue to ensure that the City's 37,000 manholes are inspected once every 12 years.
LED Lights Replacement Project
Funded by $90,480 in bond proceeds, one position is added to compile, maintain, and track records and billings during the conversion of existing streetlights to energy efficient LED luminaires.
464 City of Portland, Oregon – FY 2015-16 Adopted Budget
Portland Bureau of TransportationTransportation & Parking Service Area
HSIP & Other Federal Funded Projects
Three new positions are funded by $259,452 of grant revenue to construct and install traffic signals and wiring as part of the Highway Safety Improvement Program.
PBOT's FY 2015-16 Adopted Budget includes some technical realignment packages that convert limited term positions to permanent positions or add new positions within current appropriations.
Budget Note Safety Improvements on 122nd Ave and Frequent Bus Service
TriMet has indicated that safety improvements are needed on 122nd Avenue before the agency can implement frequent bus service. PBOT is receiving $4.69 million in one-time General Fund resources in FY 2015-16 to begin those safety improvements. The bureau is directed to work with TriMet so that frequent bus service will begin soon after the improvements are completed.
Capital BudgetCapital Summary
Investing in Portland's transportation system is critical to keeping people and goods moving and the City remaining economically competitive. The work to update the twentieth-century system to the international standards required of a twenty-first century city is expensive and complex.
The Capital Improvement Program (CIP) is a five-year spending plan to modernize Portland's transportation system through strategic construction projects. It is updated annually as part of the overall budget process. At the core, the CIP is a list of projects, estimated costs and revenue sources. The five-year FY 2015-16 to 2019-20 Adopted CIP includes 54 projects at a total cost of $145 million.
CIP Highlights Some of the improvements laid out in the CIP will provide new facilities, such as sidewalks in East Portland (136th Ave, Safe Routes to School, and East Portland Access Transit) and the 20's Bikeway. Some projects and programs will re-build and improve obsolete infrastructure for continued, safe use, such as traffic signal replacements city-wide and pavement restoration. Other improvement projects support economic development by improving freight movement such as at NE Columbia and MLK Jr. Blvd, and access and crossing improvements in Old Town/ Chinatown and the Pearl District. Additionally, PBOT is a funding partner on regional projects designed to expand public transit with Portland-Milwaukie Light Rail and to replace the Sellwood Bridge.
The five-year FY 2015-16 to 2019-20 Adopted CIP strives to achieve the goals of City Council and to provide a diversity of transportation modes and alternatives for citizens. Funding from grants, contracts, developer fees and other external sources will provide the majority of funding, approximately 90% in FY 2015-16. PBOT's discretionary General Transportation (GTR) funding makes up the remaining 10%.
City of Portland, Oregon – FY 2015-16 Adopted Budget 465
Portland Bureau of TransportationTransportation & Parking Service Area
Major Issues PBOT's CIP has been developed to align with existing resources and honor funding commitments on key regional projects. The bureau will likely continue to operate in a fiscally-constrained environment due to higher-than-projected expenditures and lower-than-projected revenues, and bond repayment and debt service costs. Future federal and state grant dollars have been in decline, future federal funds are dependent on reauthorization of the Federal Transportation Act.
Over-reliance on grant dollars has created the perception of inequitable service distribution. Unlike discretionary GTR funding, grant dollars cannot be re-allocated to a different need or project location that may be a higher priority for PBOT, including maintenance.
GTR projections show little sign of improvement and PBOT estimates on average $9 million annually will be committed to Portland-Milwaukie Light Rail and new Sellwood Bridge debt service payment over the life of the debt.
The declining discretionary GTR has also reduced PBOT's ability build smaller pedestrian and bike improvements and safety projects (active transportation improvements). It is probable that in the out years the majority of the available discretionary funding will be needed to match grant funds.
Changes from Prior Year
The five-year FY 2015-16 to 2019-20 Adopted CIP includes 19 new projects. These projects are wide-ranging, from sidewalk, pedestrian, and bike safety improvements to freight efficiency that support business development and employment opportunities and access to businesses.
Council Goals and Priorities
The Portland Plan, adopted by Council in April 2012, includes strategies for developing a prosperous, educated, healthy and equitable city over the next 25 years. PBOT has implementation responsibilities as outlined in the five-year action plan.
Construction of the Eastside Streetcar was completed and operating service began in September 2012. This project brought the Streetcar from the west side across the Broadway Bridge to the Lloyd District and Central Eastside down to OMSI. As directed by Council, the bureau has developed a plan to "Close the Loop" and bring the Streetcar across Tilikum Crossing: Bridge of the People. The first phase of construction began in 2013 and the project is expected to open in conjunction with Portland-Milwaukie Light Rail in September 2015, realizing the goal of connecting the east and west sides of the Central City.
Criteria Most of the programs and projects within the FY 2015-16 Adopted CIP continue existing projects or bring projects to completion. Most new projects added to the CIP bring committed sources of funding.
The PBOT CIP includes sidewalks and greenways for safer and better access for walking, biking, and public transit, street improvements for main streets, local streets and freight routes, as well as regional transit projects. The goal is to provide transportation choices for residents, employees, visitors, and firms doing business in Portland, while making it more convenient to walk, bicycle, take transit, therefore avoiding the need to drive to meet daily needs.
466 City of Portland, Oregon – FY 2015-16 Adopted Budget
Portland Bureau of TransportationTransportation & Parking Service Area
Capital Planning and Budgeting
Capital Planning Process
Transportation capital project requests come from a variety of sources. The bureau receives requests for capital improvements from neighborhoods, businesses and individuals, and partner agencies. Projects are identified and developed through neighborhood plans and studies adopted by City Council, such as the East Portland In Motion Implementation Strategy. The bureau works with other public agencies and private organizations to develop projects that have shared transportation goals. All of these projects are compiled into the Transportation System Plan (TSP). Additionally, capital maintenance projects arise from PBOT's Asset Management programs, which derive spending priorities among asset classes based on a variety of criteria including the risk of failure and safety needs.
City Comprehensive Plan
The FY 2015-16 Adopted CIP for capital programs and projects are consistent with the priorities identified in the TSP, a 20-year planning document mandated by the State Transportation Planning Rule. The TSP meets State and regional planning requirements and addresses local transportation goals for cost-effective street, transit, freight, bicycle, and pedestrian improvements. The Transportation Element of the TSP is a part of the City's Comprehensive Plan.
The TSP contains nearly 300 City-led major transportation projects, which address capital improvements for all modes of transportation and are consistent with Metro's 2040 Growth Concept, the long term vision for the region. The TSP is the primary document for guiding transportation CIP investments. The TSP identifies major improvements and includes a list of significant projects. Many projects identified though plans may not be defined as "significant" or major projects, but are still important. For these projects the TSP also contains a set of nine Citywide Programs:
Pedestrian Network Completion Bikeway Network Completion Neighborhood Greenways High Crash Corridors Safe Routes to School Transit Priority Freight Priority Transportation System Management Transportation & Parking Demand Management
Financial Forecast Overview
The FY 2015-16 to 2019-20 Adopted CIP is supported by several funding sources, including bond proceeds, federal, state and local grants, and regional partnership agreements. The CIP is also supported by the State Highway Fund (motor fuels tax, vehicle titling and registration fees, and weight-mile tax imposed on trucks) and parking revenues, which together represent General Transportation Revenues (GTR).
City of Portland, Oregon – FY 2015-16 Adopted Budget 467

Portland Bureau of TransportationTransportation & Parking Service Area
GTR is PBOT's primary discretionary funding source. Over the years, the ongoing GTR in the CIP program has been reduced significantly from $9.4 million per year in FY 2011-12 to $2.5 million in FY 2015-16. The reduction in discretionary funding has significantly reduced PBOT's ability to fund road rehabilitation projects as well as safety projects such as sidewalks improvements, pedestrian safety improvements, bicycle projects, and signals and streetlight reconstruction. The remaining GTR in the CIP is used primarily to match federal and state grants and fund local capital maintenance projects.
The primary funding source for the PBOT CIP is federal and state grants. However, federal and state agencies are facing funding challenges. The State Highway Trust Fund faces declining income from the Gas Tax and debt service payments for the Oregon Transportation Investment Act. The Federal Highway Trust Fund is close to insolvency, which could affect future revenues if Congress does not identify a long term solution through reauthorization of the Federal Transportation Act.
As federal and state grant opportunities arise, PBOT staff review the grant criteria with partnering bureaus and consider potentially eligible projects from the TSP, modal plans, and other implementation plans or strategies adopted by Council. These potential projects are reviewed with bicycle, pedestrian, and freight advisory committees; senior management; and the larger community when warranted. Final selection of the projects for application is also contingent upon identifying local matching funds.
Asset Management and Replacement Plan
Asset Management is a system used to determine the proper repairs at the proper time for infrastructure. Certain assets have reserve funds that are used for major maintenance and capital replacement. Other infrastructure does not have reserve funds, but prioritization and strategic maintenance are applied to maximize the life of the asset. Condition monitoring is conducted on a number of assets. Knowing the condition of an asset allows the bureau to apply the right fix at the right time and to appropriately plan maintenance and operations dollar needs.
Public Facilities Plan Overview
The TSP serves as the Public Facilities Plan for transportation. This is noted in Goal 11.6 of the City's Comprehensive Plan. The TSP provides a framework for providing urban public facilities and services within Portland's Urban Services Boundary.
Capital Programs and Projects
Capital Program Descriptions
The PBOT CIP is organized and guided by the following five goals:
Improve transportation safety Maintain transportation assets Enhance public health and community livability Support economic vitality Operate efficiently and effectively
The FY 2015-16 Adopted CIP projects are described in detail in the Capital Improvement Plan Summaries in volume two of this budget document.
Funding Sources The PBOT CIP has a variety of funding sources outlined below:
468 City of Portland, Oregon – FY 2015-16 Adopted Budget
Portland Bureau of TransportationTransportation & Parking Service Area
Grants and Contracts
This category includes State and Federal grants as well as contracts with other local jurisdictions such as the Portland Development Commission (PDC), Port of Portland and TriMet. The Regional Flexible Funds, formerly known as the Metro Transportation Improvement Program, is the regional process for identifying which transportation projects and programs will receive federal funds. Municipalities in the Portland metropolitan area are allocated these funds based on criteria established by the Joint Policy Advisory Committee on Transportation and the Metro Council. PDC, through tax-increment financing, has been a partner in developing transportation-related projects in PBOT's CIP. Projects supported in part by PDC funds include the final phase of the Killingsworth Streetscape, Bond: Gibbs to River Pkwy and the Burnside & Pearl District.
Interagency Funding
These projects are funded by the City's General Fund and other City bureaus.
Local Improvement Districts (LID)
Property owners can join together to form an LID as a means of sharing in the cost of building needed transportation infrastructure. LIDs make local street improvements possible that promote public safety, community livability, and enhance property values.
LID projects often rely on public subsidies to make the project affordable for the benefiting property owners. However, there is no funding available to subsidize new LIDs. Without a new funding source, the LID program for local streets will likely be very limited to commercial or developer requested LIDs. LID funding for FY 2015-16 is $2.9 million, and $2.9 million over the next five years.
System Development Charges (SDC)
Developers pay fees to defray the cost of system improvements required for growth associated with new development. SDC funds are collected annually and accounted separately from other bureau program revenues. The funds are allocated to the CIP budget as qualifying projects are initiated.
The SDC program was adopted by City Council in 1997 and renewed in 2007. Strict criteria govern the projects that may use SDC funds. About $4.5 million of SDC funds will be spent on projects in this five-year CIP. SDC funds in particular are used as seed and match dollars to obtain much larger amounts in the form of grants, particularly from State and Federal sources. PBOT keeps abreast of Federal, State, and local grant funding opportunities that can fund PBOT's capital funding objectives.
General Transportation Revenue (GTR)
GTR is comprised of two sources: State Highway Fund (comprised of motor fuels tax, vehicle titling and registration fees, and weight-mile tax imposed on trucks) and the City's parking revenues. State Highway Trust Fund monies are constitutionally restricted for use on "construction of roads, streets, and roadside rest areas." The majority of GTR in the CIP is expected to be committed to match Federal, State and other grants and contracts in the out years.
City of Portland, Oregon – FY 2015-16 Adopted Budget 469
Portland Bureau of TransportationTransportation & Parking Service Area
The FY 2015-16 Adopted CIP has $4.5 million of discretionary GTR funding, including $1.8 million carryover from FY 2014-15 to complete construction of current projects. The remaining $2.7 million is used for capital maintenance projects such as signals and street lighting replacements, and to leverage state and federal grants.
General Fund Support
The FY 2015-16 Adopted CIP inlcudes $18.7 million one-time General Fund support for transportation projects. This includes safety improvements on High Crash Corridors, Major Maintenance and Infrastructure Replacement Projects, and Improving Unpaved Streets.
Other Local Funding
Other local funds such as permit fees, bond and miscellaneous service charges and fees comprise about $35.9 million of the five-year CIP. This includes the remaining match payment for Sellwood bridge project and the LED Lighting Efficiency project.
The Portland Development Commission (PDC), through tax-increment financing, has been a major partner in developing and funding transportation-related projects in PBOT's CIP. PDC funding is difficult to predict beyond the specific commitments already made to PBOT. As a result, PDC funding appears to be reduced significantly after FY 2015-16. PBOT is working with the PDC to improve forecasts of PDC funding for future projects.
Major Projects There are 19 new projects in the FY 2015-16 Adopted CIP. These are:
45th & California LID, SW Barbur Corridor Safety & Access to Transit Bond: Gibbs-River Pkwy, SW Columbia Blvd ITS, N/NE Columbia Blvd: Cully Blvd & Alderwood Rd, NE Connect Cully, NE Couch Ct: 3rd Ave-Couch St LID, NE Downtown I-405 Ped Safety Imp, SW East Portland Access to Employment Going to the Island Freight Improvements, N Halsey/Weidler: 103rd - 113th, NE Hwy Safety Improvement Prgm (HSIP) & Safety Ops CW Marine Drive Path: NE 112th Ave-185th Ave Sec. OR99W: SW 19th Ave to SW 26th - Barbur Blvd Demo, SW Powell-Division High Capacity Transit, SE South Rivergate Freight Project, N Southwest Portland in Motion, SW SW Corridor Transit Project, SW St. Johns Truck Strategy, Ph. II, N
Most of these projects are federally funded projects awarded during the grant processes discussed above.
470 City of Portland, Oregon – FY 2015-16 Adopted Budget
Portland Bureau of TransportationTransportation & Parking Service Area
Major transportation projects can span multiple fiscal years as the projects move from concept, through development, design and construction phases. In 2014 PBOT completed several major projects:
The Division Streetscape project from SE 11 to SE Cesar Chavez included pavement rehabilitation sidewalk improvements and traffic signals.
The 50's Bikeway project provided a new high quality family friendly bikeway from SE Woodstock to NE Sacramento including improved crossings of several major streets.
The North Williams Ave bikeway project re-purposed a travel lane into a buffered bike lane. The North Williams project is one the first times in the United States that a bike lane was expanded because it reached capacity, carrying over 4,000 bicycles a day.
PBOT continued to construct sidewalks in East Portland, building new sidewalk corridors on SE 136 and SE 122nd Aves.
Net Operating and Maintenance Costs
Some capital improvements in the FY 2015-16 Adopted CIP, particularly the preservation and rehabilitation programs, reduce long-term maintenance liabilities, as the assets being developed replace old, high-maintenance assets that will no longer require maintenance for several years. Other investments expand the system in response to the demands of growth. As the system expands, operating costs increase, further intensifying fiscal pressures on discretionary revenue. Existing resources are not adequate to maintain and operate the system in a sustainable manner. Capital maintenance backlogs grow annually under current funding levels.
City of Portland, Oregon – FY 2015-16 Adopted Budget 471
Portland Bureau of TransportationTransportation & Parking Service Area
Administration & Support Administration & SupportDescription The Administration & Support Program is primarily supported by the Office of the
Director and the Business Services Group.
Office of the Director
The Office of the Director provides leadership as well as overall policy, communications, and administrative services for the Bureau of Transportation. Portland has an international reputation as a well-planned city, with citizen involvement and livability at the forefront, ensuring that economic growth and the region's acclaimed high quality of life are sustained into the future.
The Office of the Director also helps operating programs integrate new technologies and new leading-edge methods into their business practices to maximize efficiency. PBOT carefully manages revenues and expenditures to ensure that citizens obtain the maximum benefit from every dollar invested in the City's transportation system.
The Office of the Director includes the following programs: Director and Assistant Director, Communications and Public Involvement, Legislative and Resource Development, Equity and Inclusion, and Central Interagency Services.
Business Services Group
The Business Services Group provides administrative, employee, finance, accounting, business technology, and asset management services for PBOT.
The Business Services Group includes the following programs; Administrative Services, Employee Services, Finance and Accounting, Business Technology, and Asset Management.
Goals In FY 2014-15, the bureau revealed Portland Progress, the two-year work plan with 176 ambitious and actionable steps. The work plan's six major themes are: Preserve What We Have Built And Operate It Well; Embrace Vision Zero; Build A Future Where All Can Grow And Thrive; Effectively Manage City Assets; Contribute To The Health And Vitality Of Our People And Our Planet; and, Shoring Up The Foundation.
Performance Expected accomplishments for the Office of the Director and the Business Services Group for FY 2015-16 include:
Provide leadership for the City's transportation system Provide communications, outreach, resource development, and equity support
services for transportation programs and projects Provide financial management for transportation services Provide asset management for transportation infrastructure Provide support services for transportation staff Implement action items from Portland Progress, PBOT's two-year work plan.
Changes to Services and Activities
The FY 2015-16 Adopted Budget includes technical realignments to convert limited term positions to permanent positions or add new positions within current appropriation levels.
472 City of Portland, Oregon – FY 2015-16 Adopted Budget
Portland Bureau of TransportationTransportation & Parking Service Area
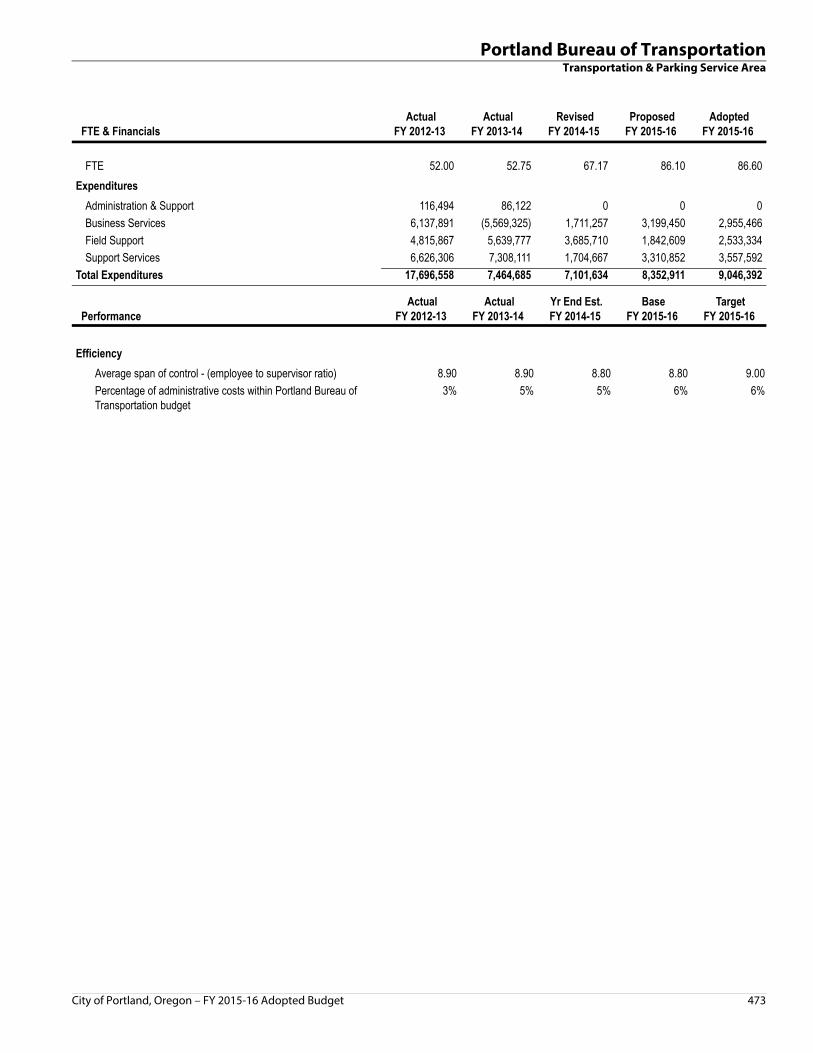
FTE & Financials Actual
FY 2012-13 Actual
FY 2013-14 Revised
FY 2014-15 ProposedFY 2015-16
AdoptedFY 2015-16
FTE 52.00 52.75 67.17 86.10 86.60
Expenditures
Administration & Support 116,494 86,122 0 0 0
Business Services 6,137,891 (5,569,325) 1,711,257 3,199,450 2,955,466
Field Support 4,815,867 5,639,777 3,685,710 1,842,609 2,533,334
Support Services 6,626,306 7,308,111 1,704,667 3,310,852 3,557,592
Total Expenditures 17,696,558 7,464,685 7,101,634 8,352,911 9,046,392
Performance Actual
FY 2012-13 Actual
FY 2013-14 Yr End Est.FY 2014-15
BaseFY 2015-16
TargetFY 2015-16
Efficiency
Average span of control - (employee to supervisor ratio) 8.90 8.90 8.80 8.80 9.00
Percentage of administrative costs within Portland Bureau of Transportation budget
3% 5% 5% 6% 6%
City of Portland, Oregon – FY 2015-16 Adopted Budget 473
Portland Bureau of TransportationTransportation & Parking Service Area
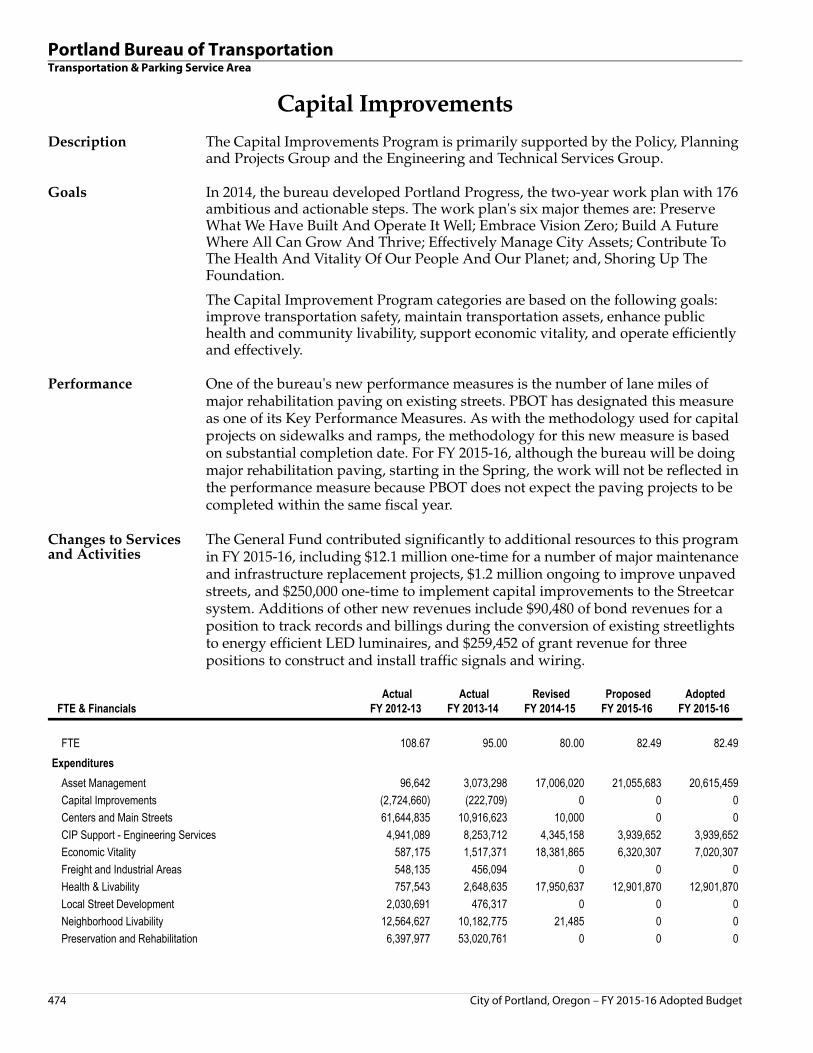
Capital Improvements Capital ImprovementsDescription The Capital Improvements Program is primarily supported by the Policy, Planning
and Projects Group and the Engineering and Technical Services Group.
Goals In 2014, the bureau developed Portland Progress, the two-year work plan with 176 ambitious and actionable steps. The work plan's six major themes are: Preserve What We Have Built And Operate It Well; Embrace Vision Zero; Build A Future Where All Can Grow And Thrive; Effectively Manage City Assets; Contribute To The Health And Vitality Of Our People And Our Planet; and, Shoring Up The Foundation.
The Capital Improvement Program categories are based on the following goals: improve transportation safety, maintain transportation assets, enhance public health and community livability, support economic vitality, and operate efficiently and effectively.
Performance One of the bureau's new performance measures is the number of lane miles of major rehabilitation paving on existing streets. PBOT has designated this measure as one of its Key Performance Measures. As with the methodology used for capital projects on sidewalks and ramps, the methodology for this new measure is based on substantial completion date. For FY 2015-16, although the bureau will be doing major rehabilitation paving, starting in the Spring, the work will not be reflected in the performance measure because PBOT does not expect the paving projects to be completed within the same fiscal year.
Changes to Services and Activities
The General Fund contributed significantly to additional resources to this program in FY 2015-16, including $12.1 million one-time for a number of major maintenance and infrastructure replacement projects, $1.2 million ongoing to improve unpaved streets, and $250,000 one-time to implement capital improvements to the Streetcar system. Additions of other new revenues include $90,480 of bond revenues for a position to track records and billings during the conversion of existing streetlights to energy efficient LED luminaires, and $259,452 of grant revenue for three positions to construct and install traffic signals and wiring.
FTE & Financials Actual
FY 2012-13 Actual
FY 2013-14 Revised
FY 2014-15 ProposedFY 2015-16
AdoptedFY 2015-16
FTE 108.67 95.00 80.00 82.49 82.49
Expenditures
Asset Management 96,642 3,073,298 17,006,020 21,055,683 20,615,459
Capital Improvements (2,724,660) (222,709) 0 0 0
Centers and Main Streets 61,644,835 10,916,623 10,000 0 0
CIP Support - Engineering Services 4,941,089 8,253,712 4,345,158 3,939,652 3,939,652
Economic Vitality 587,175 1,517,371 18,381,865 6,320,307 7,020,307
Freight and Industrial Areas 548,135 456,094 0 0 0
Health & Livability 757,543 2,648,635 17,950,637 12,901,870 12,901,870
Local Street Development 2,030,691 476,317 0 0 0
Neighborhood Livability 12,564,627 10,182,775 21,485 0 0
Preservation and Rehabilitation 6,397,977 53,020,761 0 0 0
474 City of Portland, Oregon – FY 2015-16 Adopted Budget
Portland Bureau of TransportationTransportation & Parking Service Area
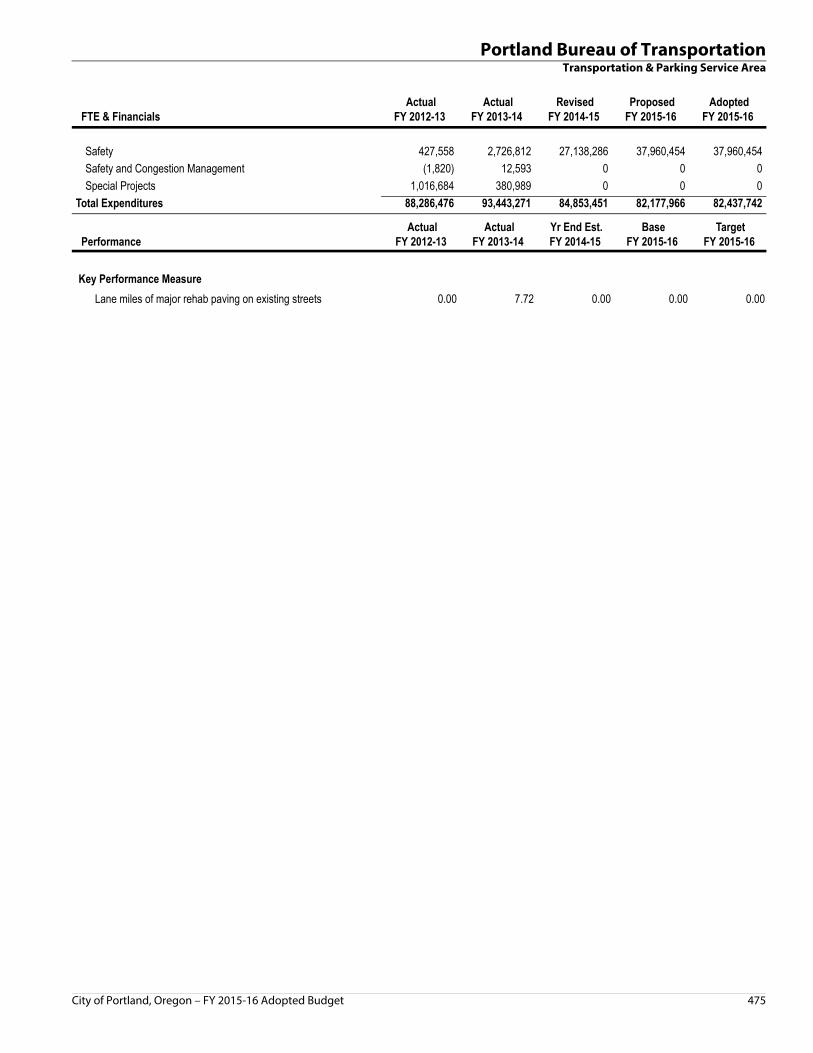
Safety 427,558 2,726,812 27,138,286 37,960,454 37,960,454
Safety and Congestion Management (1,820) 12,593 0 0 0
Special Projects 1,016,684 380,989 0 0 0
Total Expenditures 88,286,476 93,443,271 84,853,451 82,177,966 82,437,742
Performance Actual
FY 2012-13 Actual
FY 2013-14 Yr End Est.FY 2014-15
BaseFY 2015-16
TargetFY 2015-16
Key Performance Measure
Lane miles of major rehab paving on existing streets 0.00 7.72 0.00 0.00 0.00
FTE & Financials Actual
FY 2012-13 Actual
FY 2013-14 Revised
FY 2014-15 ProposedFY 2015-16
AdoptedFY 2015-16
City of Portland, Oregon – FY 2015-16 Adopted Budget 475
Portland Bureau of TransportationTransportation & Parking Service Area
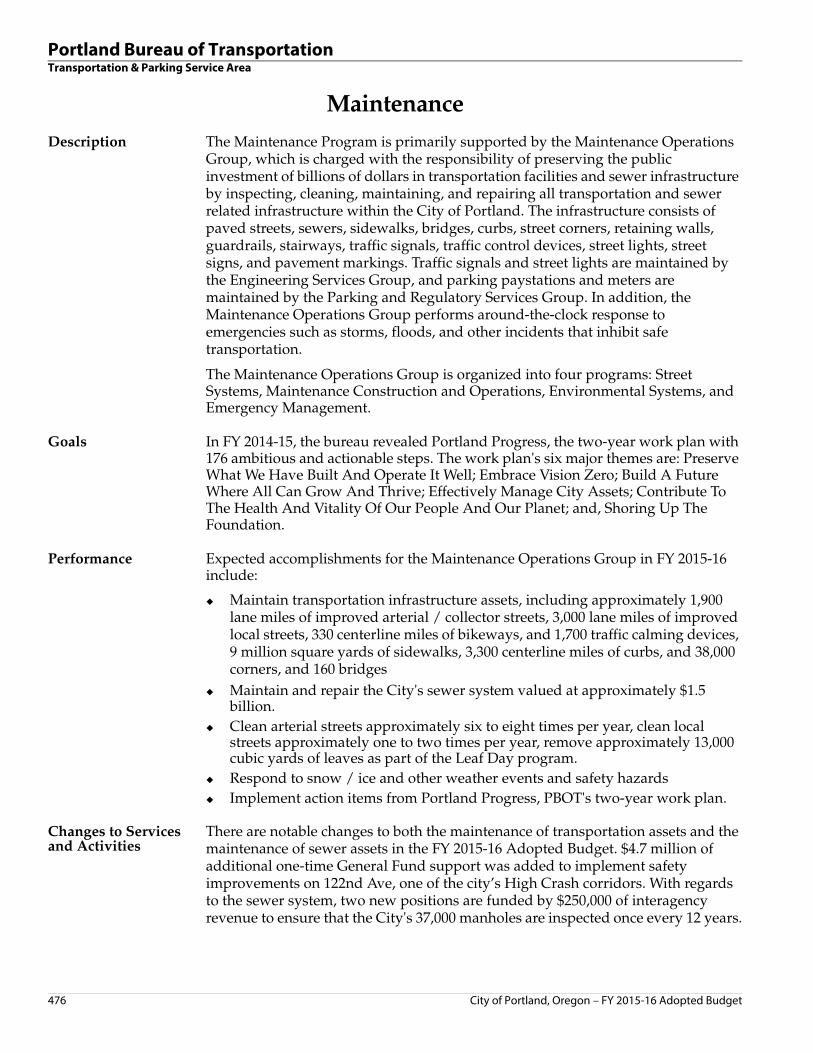
Maintenance MaintenanceDescription The Maintenance Program is primarily supported by the Maintenance Operations
Group, which is charged with the responsibility of preserving the public investment of billions of dollars in transportation facilities and sewer infrastructure by inspecting, cleaning, maintaining, and repairing all transportation and sewer related infrastructure within the City of Portland. The infrastructure consists of paved streets, sewers, sidewalks, bridges, curbs, street corners, retaining walls, guardrails, stairways, traffic signals, traffic control devices, street lights, street signs, and pavement markings. Traffic signals and street lights are maintained by the Engineering Services Group, and parking paystations and meters are maintained by the Parking and Regulatory Services Group. In addition, the Maintenance Operations Group performs around-the-clock response to emergencies such as storms, floods, and other incidents that inhibit safe transportation.
The Maintenance Operations Group is organized into four programs: Street Systems, Maintenance Construction and Operations, Environmental Systems, and Emergency Management.
Goals In FY 2014-15, the bureau revealed Portland Progress, the two-year work plan with 176 ambitious and actionable steps. The work plan's six major themes are: Preserve What We Have Built And Operate It Well; Embrace Vision Zero; Build A Future Where All Can Grow And Thrive; Effectively Manage City Assets; Contribute To The Health And Vitality Of Our People And Our Planet; and, Shoring Up The Foundation.
Performance Expected accomplishments for the Maintenance Operations Group in FY 2015-16 include:
Maintain transportation infrastructure assets, including approximately 1,900 lane miles of improved arterial / collector streets, 3,000 lane miles of improved local streets, 330 centerline miles of bikeways, and 1,700 traffic calming devices, 9 million square yards of sidewalks, 3,300 centerline miles of curbs, and 38,000 corners, and 160 bridges
Maintain and repair the City's sewer system valued at approximately $1.5 billion.
Clean arterial streets approximately six to eight times per year, clean local streets approximately one to two times per year, remove approximately 13,000 cubic yards of leaves as part of the Leaf Day program.
Respond to snow / ice and other weather events and safety hazards Implement action items from Portland Progress, PBOT's two-year work plan.
Changes to Services and Activities
There are notable changes to both the maintenance of transportation assets and the maintenance of sewer assets in the FY 2015-16 Adopted Budget. $4.7 million of additional one-time General Fund support was added to implement safety improvements on 122nd Ave, one of the city’s High Crash corridors. With regards to the sewer system, two new positions are funded by $250,000 of interagency revenue to ensure that the City's 37,000 manholes are inspected once every 12 years.
476 City of Portland, Oregon – FY 2015-16 Adopted Budget
Portland Bureau of TransportationTransportation & Parking Service Area
FTE & Financials Actual
FY 2012-13 Actual
FY 2013-14 Revised
FY 2014-15 ProposedFY 2015-16
AdoptedFY 2015-16
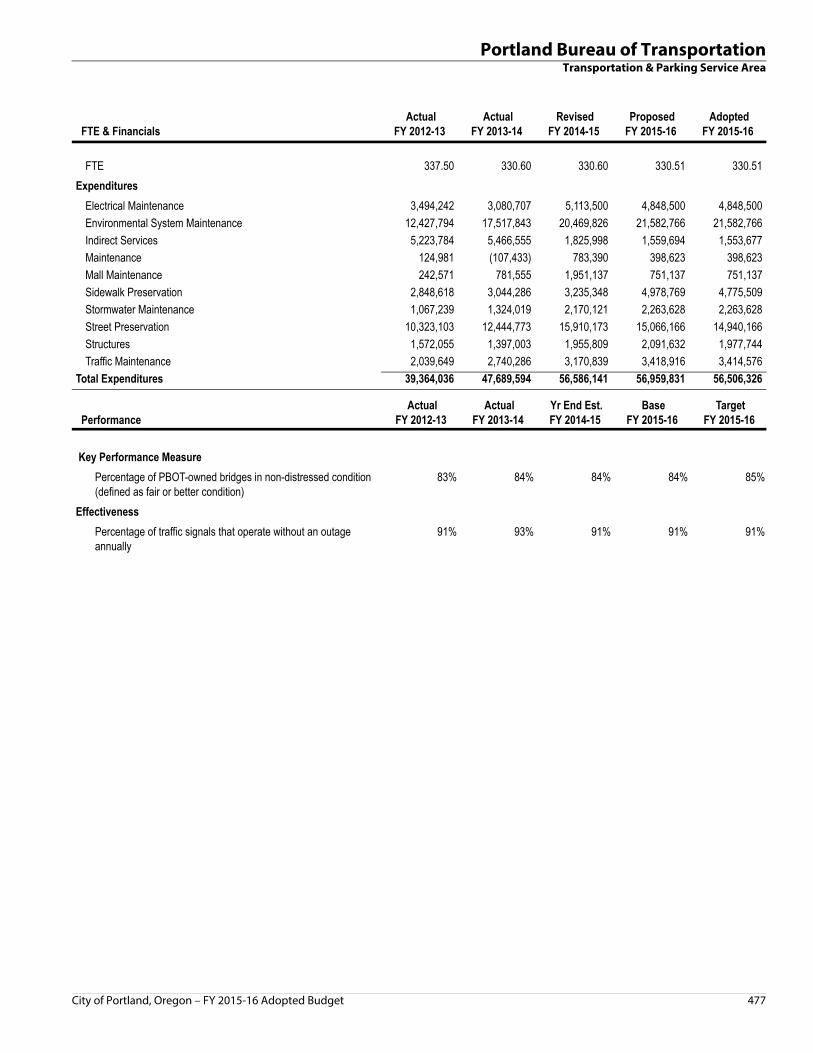
FTE 337.50 330.60 330.60 330.51 330.51
Expenditures
Electrical Maintenance 3,494,242 3,080,707 5,113,500 4,848,500 4,848,500
Environmental System Maintenance 12,427,794 17,517,843 20,469,826 21,582,766 21,582,766
Indirect Services 5,223,784 5,466,555 1,825,998 1,559,694 1,553,677
Maintenance 124,981 (107,433) 783,390 398,623 398,623
Mall Maintenance 242,571 781,555 1,951,137 751,137 751,137
Sidewalk Preservation 2,848,618 3,044,286 3,235,348 4,978,769 4,775,509
Stormwater Maintenance 1,067,239 1,324,019 2,170,121 2,263,628 2,263,628
Street Preservation 10,323,103 12,444,773 15,910,173 15,066,166 14,940,166
Structures 1,572,055 1,397,003 1,955,809 2,091,632 1,977,744
Traffic Maintenance 2,039,649 2,740,286 3,170,839 3,418,916 3,414,576
Total Expenditures 39,364,036 47,689,594 56,586,141 56,959,831 56,506,326
Performance Actual
FY 2012-13 Actual
FY 2013-14 Yr End Est.FY 2014-15
BaseFY 2015-16
TargetFY 2015-16
Key Performance Measure
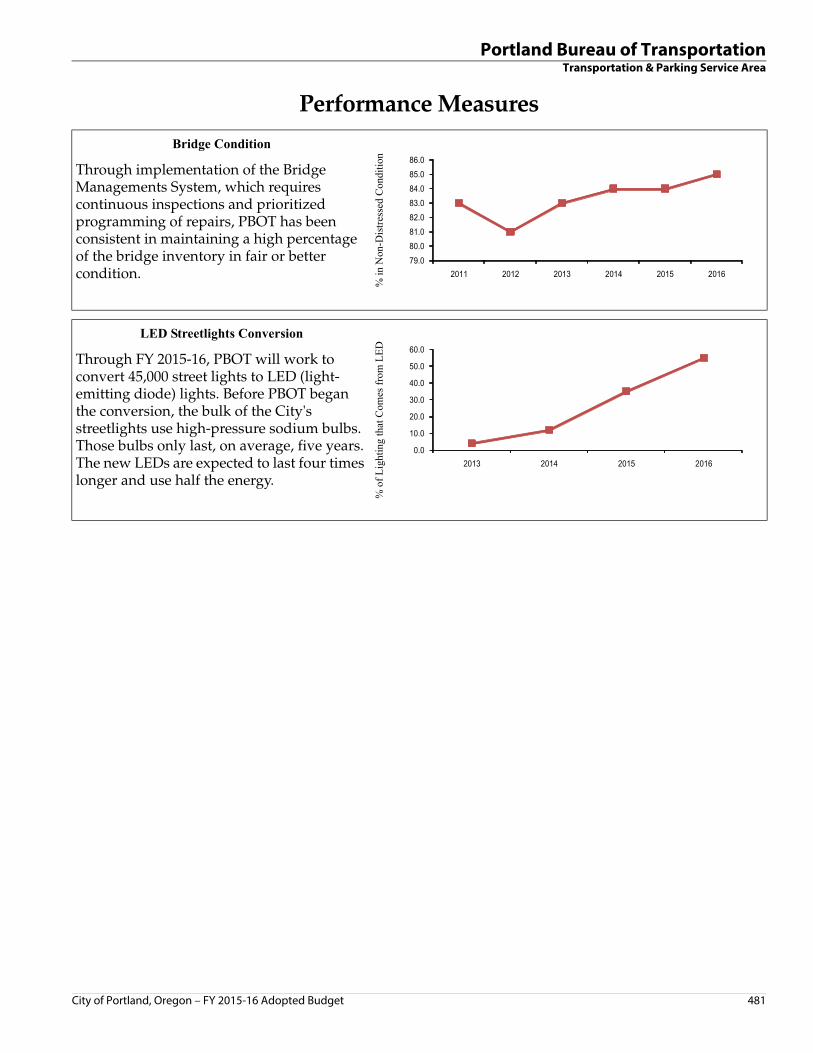
Percentage of PBOT-owned bridges in non-distressed condition (defined as fair or better condition)
83% 84% 84% 84% 85%
Effectiveness
Percentage of traffic signals that operate without an outage annually
91% 93% 91% 91% 91%
City of Portland, Oregon – FY 2015-16 Adopted Budget 477

Portland Bureau of TransportationTransportation & Parking Service Area
Operations OperationsDescription The Operations program is supported by the Policy, Planning, and Projects Group,
the Parking Services Group, the Development Permitting and Transit Group, and the Engineering Services Group.
The Policy Planning and Projects Group takes transportation ideas from long-range planning and policy realms, through project development, all the way to construction. The group includes five programs: Transportation Planning, Active Transportation, Modal Coordination, Capital Project Management, and Transportation Partnerships.
The Parking Services Group is responsible for managing on-street parking, managing the City's Smartpark garages, and providing regulation of private-for-hire vehicles and towing. This group has pioneered parking and regulatory services to improve parking and access. The group includes three programs: Parking Operations, Parking Enforcement, and Off-street Parking and Regulatory Operations.
The Development Permitting and Transit Group facilitates public and private development opportunities which lead to job creation, housing construction, and enhanced neighborhood livability. This group regulates the use of the right-of-way, including development review, utility permitting, right-of-way permitting, and right-of-way acquisitions. This group also oversees operation and maintenance of the Portland Streetcar and Portland Aerial Tram. This group includes four programs: Development Review; Utility, Construction, & Inspection; Right of way Programs and Permitting; and Streetcar & Transit Partnerships.
The Engineering Services Group provides technical support for transportation projects that enhance neighborhood access and livability, preserve and rehabilitate facilities, and support land use through improvements to the city street and structures system. Engineering and Technical Services provides technical support for capital projects, including structural and civil engineering, and construction inspection and survey services. This program also manages the City's Signal and Streetlighting systems. This group includes seven programs: Bridges and Structures; Civil Design; Construction, Inspection, and Pavement Management; Survey; Signals and Streetlighting; Traffic Operations; and Traffic Design.
Goals In FY 2014-15, the bureau revealed Portland Progress, the two-year work plan with 176 ambitious and actionable steps. The work plan's six major themes are: Preserve What We Have Built And Operate It Well, Embrace Vision Zero, Build A Future Where All Can Grow And Thrive, Effectively Manage City Assets, Contribute To The Health And Vitality Of Our People And Our Planet, and Shoring Up The Foundation.
Performance The Policy Planning and Projects Group works to: plan, design, or build approximately 50 capital projects; complete a Vision Zero Plan and begin implementation actions; provide Safe Routes to Schools Program for approximately 100 schools, reaching 36,000 students; provide SmartTrips Program reaching approximately 40,000 people; hold five Sunday Parkways events, including approximately 110,000 participants; complete the 2035 Transportation System Plan update, the Central City 2035 Plan, the Neighborhood Greenways Assessment
478 City of Portland, Oregon – FY 2015-16 Adopted Budget

Portland Bureau of TransportationTransportation & Parking Service Area
Report, the Citywide Parking Strategy, the Tryon-Stephens Headwaters Neighborhood Street Plan, the Growing Transit Communities plan; advance the Southwest Corridor Plan; identify and implement priority transportation actions in the Portland Climate Action Plan and the regional Climate Smart Communities plan; and Implement action items from Portland Progress, PBOT's two-year work plan.
The Parking Services Group works to: manage parking in the right of way, including approximately 1,700 parking paystations and 600 parking meters supporting 12 million transactions annually; issue approximately 30,000 Area Parking Permits; enforce parking regulations city-wide, responding to approximately 18,000 requests for parking enforcement and 16,000 complaints about abandoned vehicles; manage six City-owned parking garages, with 2 million transactions annually; regulate private-for-hire vehicles, issuing permits for approximately 1,200 private-for-hire vehicles and 1,500 drivers who provide for over 3 million rides annually; and implement action items from Portland Progress, PBOT's two-year work plan.
The Development Permitting and Transit Group works to: manage the use of the City's right-of-way, operate and maintain the Portland Streetcar, supporting approximately 4.8 million trips per year; operate the Portland Aerial Tram, supporting approximately 1.25 million trips per year; and implement action items from Portland Progress, PBOT's two-year work plan.
The Engineering Services Group works to: provide construction, inspections, and survey services for approximately 100 capital and permit projects; maintain the City's bridges and structures including approximately 160 bridges, 600 retaining walls, 200 stairways, 30 centerline miles of guardrails, and 5,000 feet of harbor wall; operate and maintain approximately 900 traffic signals, 300 traffic control devices, and 55,000 streetlights; process approximately 1,000 requests for traffic safety investigations and traffic control changes; and implement action items from Portland Progress, PBOT's two-year work plan.
Changes to Services and Activities
Additions of new revenue from the General Fund and from other sources contributed to changes in this program in FY 2015-16. Notable General Fund additions include $960,000 of one-time resources to fund one-third of the costs of the Youth Bus Pass program for high school students in the Portland Public School District, $300,000 one-time to expand the Safe Routes to School program to middle schools, and $700,000 one-time to continue development of the Draft Environmental Impact Statement and Local Preferred Alternative for the SW Corridor Transit Project. Three new positions funded by additional services charges and fees were added: 1) two funded by $216,660 to respond to an increased volume of applications, and 2) one funded by $68,208 to provide fare inspection to manage anticipated increased ridership from closing the Streetcar loop.
The budget also includes some technical realignments to convert limited term positions to permanent positions or add new positions within current appropriation levels.
City of Portland, Oregon – FY 2015-16 Adopted Budget 479

Portland Bureau of TransportationTransportation & Parking Service Area
FTE & Financials Actual
FY 2012-13 Actual
FY 2013-14 Revised
FY 2014-15 ProposedFY 2015-16
AdoptedFY 2015-16
FTE 247.00 255.83 282.53 285.10 286.10
Expenditures
Active Transportation 2,251,268 2,691,339 3,968,090 3,241,330 3,396,562
Development Services 3,169,507 4,897,492 5,984,895 6,894,999 6,979,767
Emergency Preparedness 483,022 1,620,966 202,464 204,544 204,544
Engineering Services 2,685,192 1,976,291 3,335,110 2,637,500 2,637,500
Indirect Services 623,485 632,656 0 0 0
Modal Coordination 0 0 0 312,600 312,600
Parking Enforcement 1,682,077 851,228 0 0 0
Parking Garage Operations 4,825,879 5,541,324 7,696,377 9,250,225 9,264,697
Parking Operations 1,415,294 80,773 0 0 0
Parking Program 7,166,314 9,800,852 14,680,105 15,405,100 15,615,920
Recycling Operations 767,096 534,161 1,088,784 1,139,746 1,079,026
Regulatory Operations 0 0 1,403,000 1,300,000 1,300,000
Street Cleaning 4,608,351 4,882,997 5,841,261 6,104,534 6,104,534
Street Lighting 6,627,541 6,686,075 6,853,856 7,010,439 7,010,439
Streetcar Operations 7,942,964 7,915,764 11,432,651 13,686,056 13,686,056
TR Partnership Contrib 254,832 300,000 1,000,000 960,000 960,000
Traffic Operations 1,927,194 1,662,365 2,252,035 2,312,600 2,101,780
Traffic Signals 1,672,554 1,648,625 1,038,200 1,052,800 1,052,800
Tram Operations 380,785 402,892 353,444 323,612 323,612
Transportation Options 1,031,962 690,874 0 0 0
Transportation Planning 613,557 1,104,096 2,665,250 2,343,359 1,643,359
Total Expenditures 50,128,874 53,920,770 69,795,522 74,179,444 73,673,196
Performance Actual
FY 2012-13 Actual
FY 2013-14 Yr End Est.FY 2014-15
BaseFY 2015-16
TargetFY 2015-16
Key Performance Measure
Total number of serious, incapacitating traffic injuries and fatalities citywide
265 NA 260 255 240
Percentage of trips made by people walking and bicycling, including to transit (calendar year)
24% NA 24% 24% 25%
Percentage of City-owned and maintained lighting that comes from LED streetlights
4% 12% 35% 53% 55%
Annual streetcar ridership NA 4,400,000 4,800,000 5,000,000 5,000,000
Effectiveness
Percentage of public works permits completed within Portland Bureau of Transportation's set of interim timelines from beginning to end of permitting process
96% 95% 95% 95% 95%
Number of on-street parking transactions per year 10,185,495 10,557,311 11,000,000 13,000,000 13,000,000
Percentage of Streetcar on-time performance NA 80% 80% 80% 80%
Efficiency
On-street parking expenses as a percentage of revenues 30% 31% 32% 32% 32%
Percentage of Streetcar fare revenue contribution to operating budget
NA 10% 10% 10% 10%
480 City of Portland, Oregon – FY 2015-16 Adopted Budget
Portland Bureau of TransportationTransportation & Parking Service Area
Performance Measures
Bridge Condition
Through implementation of the Bridge Managements System, which requires continuous inspections and prioritized programming of repairs, PBOT has been consistent in maintaining a high percentage of the bridge inventory in fair or better condition.
% in
Non
-Dis
tres
sed
Con
diti
on
LED Streetlights Conversion
Through FY 2015-16, PBOT will work to convert 45,000 street lights to LED (light-emitting diode) lights. Before PBOT began the conversion, the bulk of the City's streetlights use high-pressure sodium bulbs. Those bulbs only last, on average, five years. The new LEDs are expected to last four times longer and use half the energy.
% o
f L
ight
ing
that
Com
es f
rom
LE
D
79.0
80.0
81.0
82.0
83.0
84.0
85.0
86.0
2011 2012 2013 2014 2015 2016
0.0
10.0
20.0
30.0
40.0
50.0
60.0
2013 2014 2015 2016
City of Portland, Oregon – FY 2015-16 Adopted Budget 481
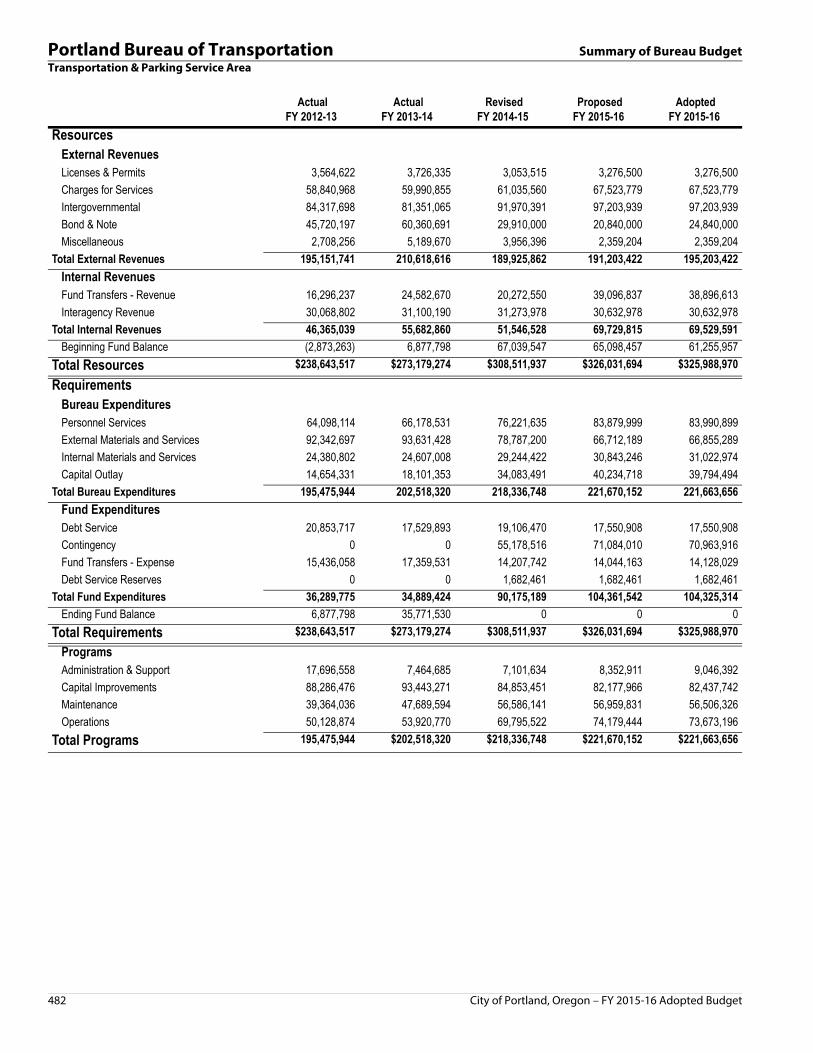
Portland Bureau of Transportation Summary of Bureau BudgetTransportation & Parking Service Area
Actual
FY 2012-13 Actual
FY 2013-14 Revised
FY 2014-15 ProposedFY 2015-16
AdoptedFY 2015-16
ResourcesExternal RevenuesLicenses & Permits 3,564,622 3,726,335 3,053,515 3,276,500 3,276,500
Charges for Services 58,840,968 59,990,855 61,035,560 67,523,779 67,523,779
Intergovernmental 84,317,698 81,351,065 91,970,391 97,203,939 97,203,939
Bond & Note 45,720,197 60,360,691 29,910,000 20,840,000 24,840,000
Miscellaneous 2,708,256 5,189,670 3,956,396 2,359,204 2,359,204
Total External Revenues 195,151,741 210,618,616 189,925,862 191,203,422 195,203,422
Internal RevenuesFund Transfers - Revenue 16,296,237 24,582,670 20,272,550 39,096,837 38,896,613
Interagency Revenue 30,068,802 31,100,190 31,273,978 30,632,978 30,632,978
Total Internal Revenues 46,365,039 55,682,860 51,546,528 69,729,815 69,529,591
Beginning Fund Balance (2,873,263) 6,877,798 67,039,547 65,098,457 61,255,957
Total Resources $238,643,517 $273,179,274 $308,511,937 $326,031,694 $325,988,970
RequirementsBureau ExpendituresPersonnel Services 64,098,114 66,178,531 76,221,635 83,879,999 83,990,899
External Materials and Services 92,342,697 93,631,428 78,787,200 66,712,189 66,855,289
Internal Materials and Services 24,380,802 24,607,008 29,244,422 30,843,246 31,022,974
Capital Outlay 14,654,331 18,101,353 34,083,491 40,234,718 39,794,494
Total Bureau Expenditures 195,475,944 202,518,320 218,336,748 221,670,152 221,663,656
Fund ExpendituresDebt Service 20,853,717 17,529,893 19,106,470 17,550,908 17,550,908
Contingency 0 0 55,178,516 71,084,010 70,963,916
Fund Transfers - Expense 15,436,058 17,359,531 14,207,742 14,044,163 14,128,029
Debt Service Reserves 0 0 1,682,461 1,682,461 1,682,461
Total Fund Expenditures 36,289,775 34,889,424 90,175,189 104,361,542 104,325,314
Ending Fund Balance 6,877,798 35,771,530 0 0 0
Total Requirements $238,643,517 $273,179,274 $308,511,937 $326,031,694 $325,988,970
ProgramsAdministration & Support 17,696,558 7,464,685 7,101,634 8,352,911 9,046,392
Capital Improvements 88,286,476 93,443,271 84,853,451 82,177,966 82,437,742
Maintenance 39,364,036 47,689,594 56,586,141 56,959,831 56,506,326
Operations 50,128,874 53,920,770 69,795,522 74,179,444 73,673,196
Total Programs 195,475,944 $202,518,320 $218,336,748 $221,670,152 $221,663,656
482 City of Portland, Oregon – FY 2015-16 Adopted Budget
CIP Summary Portland Bureau of TransportationTransportation & Parking Service Area
l
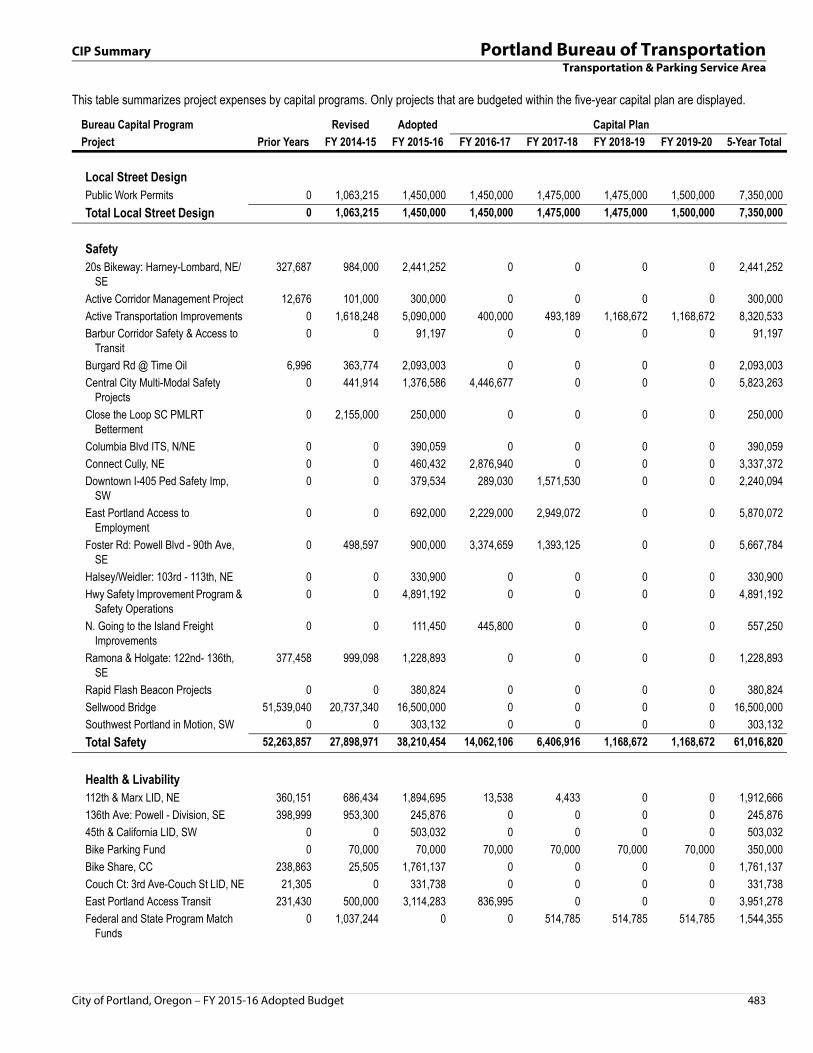
This table summarizes project expenses by capital programs. Only projects that are budgeted within the five-year capital plan are displayed.
Bureau Capital Program Revised Adopted Capital Plan
Project Prior Years FY 2014-15 FY 2015-16 FY 2016-17 FY 2017-18 FY 2018-19 FY 2019-20 5-Year Tota
Local Street Design Public Work Permits 0 1,063,215 1,450,000 1,450,000 1,475,000 1,475,000 1,500,000 7,350,000
Total Local Street Design 0 1,063,215 1,450,000 1,450,000 1,475,000 1,475,000 1,500,000 7,350,000
Safety 20s Bikeway: Harney-Lombard, NE/
SE327,687 984,000 2,441,252 0 0 0 0 2,441,252
Active Corridor Management Project 12,676 101,000 300,000 0 0 0 0 300,000
Active Transportation Improvements 0 1,618,248 5,090,000 400,000 493,189 1,168,672 1,168,672 8,320,533
Barbur Corridor Safety & Access to Transit
0 0 91,197 0 0 0 0 91,197
Burgard Rd @ Time Oil 6,996 363,774 2,093,003 0 0 0 0 2,093,003
Central City Multi-Modal Safety Projects
0 441,914 1,376,586 4,446,677 0 0 0 5,823,263
Close the Loop SC PMLRT Betterment
0 2,155,000 250,000 0 0 0 0 250,000
Columbia Blvd ITS, N/NE 0 0 390,059 0 0 0 0 390,059
Connect Cully, NE 0 0 460,432 2,876,940 0 0 0 3,337,372
Downtown I-405 Ped Safety Imp, SW
0 0 379,534 289,030 1,571,530 0 0 2,240,094
East Portland Access to Employment
0 0 692,000 2,229,000 2,949,072 0 0 5,870,072
Foster Rd: Powell Blvd - 90th Ave, SE
0 498,597 900,000 3,374,659 1,393,125 0 0 5,667,784
Halsey/Weidler: 103rd - 113th, NE 0 0 330,900 0 0 0 0 330,900
Hwy Safety Improvement Program & Safety Operations
0 0 4,891,192 0 0 0 0 4,891,192
N. Going to the Island Freight Improvements
0 0 111,450 445,800 0 0 0 557,250
Ramona & Holgate: 122nd- 136th, SE
377,458 999,098 1,228,893 0 0 0 0 1,228,893
Rapid Flash Beacon Projects 0 0 380,824 0 0 0 0 380,824
Sellwood Bridge 51,539,040 20,737,340 16,500,000 0 0 0 0 16,500,000
Southwest Portland in Motion, SW 0 0 303,132 0 0 0 0 303,132
Total Safety 52,263,857 27,898,971 38,210,454 14,062,106 6,406,916 1,168,672 1,168,672 61,016,820
Health & Livability 112th & Marx LID, NE 360,151 686,434 1,894,695 13,538 4,433 0 0 1,912,666
136th Ave: Powell - Division, SE 398,999 953,300 245,876 0 0 0 0 245,876
45th & California LID, SW 0 0 503,032 0 0 0 0 503,032
Bike Parking Fund 0 70,000 70,000 70,000 70,000 70,000 70,000 350,000
Bike Share, CC 238,863 25,505 1,761,137 0 0 0 0 1,761,137
Couch Ct: 3rd Ave-Couch St LID, NE 21,305 0 331,738 0 0 0 0 331,738
East Portland Access Transit 231,430 500,000 3,114,283 836,995 0 0 0 3,951,278
Federal and State Program Match Funds
0 1,037,244 0 0 514,785 514,785 514,785 1,544,355
City of Portland, Oregon – FY 2015-16 Adopted Budget 483

Portland Bureau of Transportation CIP SummaryTransportation & Parking Service Area
l
Killingsworth: Commercial-MLK, N/NE
732,837 1,003,502 496,032 0 0 0 0 496,032
LID Street Design 0 156,600 174,000 0 0 0 0 174,000
Marine Drive Path: NE 112th Ave-185th Ave Sec.
0 325,000 830,992 0 0 0 0 830,992
OR99W: SW 19th Ave to SW 26th - Barbur Blvd Demo
0 100,000 337,245 1,662,168 0 0 0 1,999,413
PDC Small Projects 0 200,000 200,000 0 0 0 0 200,000
Powell-Division High Capacity Transit
0 0 1,007,894 0 0 0 0 1,007,894
Pre-LID Street Design 0 30,000 30,000 30,000 30,000 30,000 30,000 150,000
Red Electric Trail, SW 44,305 275,485 454,946 1,437,654 0 0 0 1,892,600
Total Health & Livability 2,027,890 5,363,070 11,451,870 4,050,355 619,218 614,785 614,785 17,351,013
Asset Management Bridges/O-Passes 0 1,014,724 2,826,524 124,724 124,724 124,724 124,724 3,325,420
Lighting Efficiency Program, CW 396,967 7,500,000 4,500,000 4,500,000 3,603,033 0 0 12,603,033
Naito Pkwy: I-405 - Jefferson, SW 760 39,240 250,000 749,240 0 0 0 999,240
Road Rehabilitation Program (Paving Preservation), CW
0 2,169,290 9,949,776 0 0 0 0 9,949,776
Signal Communication 0 50,000 50,000 50,000 50,000 50,000 50,000 250,000
Signal Reconstruction 0 461,998 309,550 349,609 349,609 349,609 349,609 1,707,986
Street Light Replacement, CW 0 1,119,609 2,729,609 229,609 229,609 229,609 229,609 3,648,045
Total Asset Management 397,727 12,354,861 20,615,459 6,003,182 4,356,975 753,942 753,942 32,483,500
Economic Vitality Bond: Gibbs - River Pkwy, SW 0 0 260,000 2,140,000 4,400,000 2,400,000 0 9,200,000
Burnside & Pearl Dist Xing Improvement, W
430,263 1,903,029 412,314 0 0 0 0 412,314
Columbia Blvd/MLK Blvd 447,346 955,840 1,298,958 0 0 0 0 1,298,958
Columbia Blvd: Cully Blvd & Alderwood Rd, NE
0 0 528,083 4,999,676 0 0 0 5,527,759
Parking Machines 0 5,100,000 2,420,000 0 0 0 0 2,420,000
Portland to Milwaukie LRT, SE 6,700,973 1,083,273 316,752 0 0 0 0 316,752
South Rivergate Freight Project, N 0 0 0 3,590,772 0 0 0 3,590,772
St. Johns Truck Strategy, Ph. II, N 0 0 834,200 2,511,926 0 0 0 3,346,126
SW Corridor Transit 0 0 700,000 0 0 0 0 700,000
Total Economic Vitality 7,578,582 9,042,142 6,770,307 13,242,374 4,400,000 2,400,000 0 26,812,681
Total Requirements 62,268,056 55,722,259 78,498,090 38,808,017 17,258,109 6,412,399 4,037,399 145,014,014
This table summarizes project expenses by capital programs. Only projects that are budgeted within the five-year capital plan are displayed.
Bureau Capital Program Revised Adopted Capital Plan
Project Prior Years FY 2014-15 FY 2015-16 FY 2016-17 FY 2017-18 FY 2018-19 FY 2019-20 5-Year Tota
484 City of Portland, Oregon – FY 2015-16 Adopted Budget
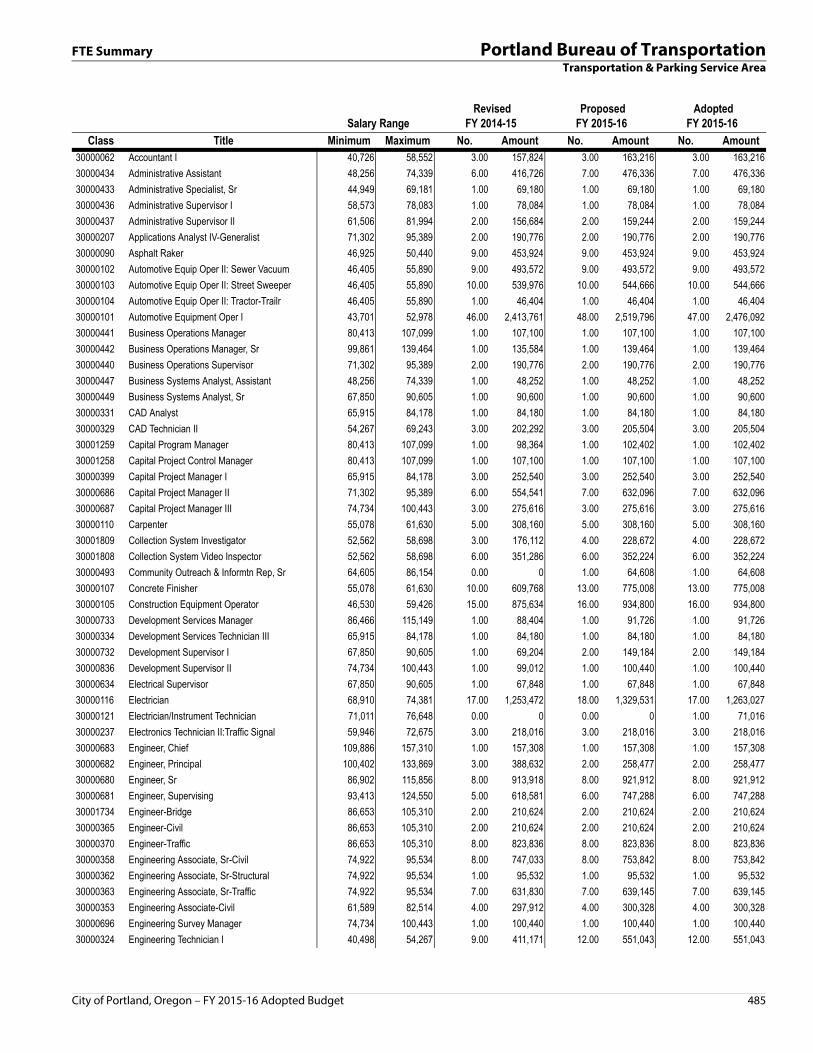
FTE Summary Portland Bureau of TransportationTransportation & Parking Service Area
Salary Range Revised
FY 2014-15 ProposedFY 2015-16
AdoptedFY 2015-16
Class Title Minimum Maximum No. Amount No. Amount No. Amount30000062 Accountant I 40,726 58,552 3.00 157,824 3.00 163,216 3.00 163,216
30000434 Administrative Assistant 48,256 74,339 6.00 416,726 7.00 476,336 7.00 476,336
30000433 Administrative Specialist, Sr 44,949 69,181 1.00 69,180 1.00 69,180 1.00 69,180
30000436 Administrative Supervisor I 58,573 78,083 1.00 78,084 1.00 78,084 1.00 78,084
30000437 Administrative Supervisor II 61,506 81,994 2.00 156,684 2.00 159,244 2.00 159,244
30000207 Applications Analyst IV-Generalist 71,302 95,389 2.00 190,776 2.00 190,776 2.00 190,776
30000090 Asphalt Raker 46,925 50,440 9.00 453,924 9.00 453,924 9.00 453,924
30000102 Automotive Equip Oper II: Sewer Vacuum 46,405 55,890 9.00 493,572 9.00 493,572 9.00 493,572
30000103 Automotive Equip Oper II: Street Sweeper 46,405 55,890 10.00 539,976 10.00 544,666 10.00 544,666
30000104 Automotive Equip Oper II: Tractor-Trailr 46,405 55,890 1.00 46,404 1.00 46,404 1.00 46,404
30000101 Automotive Equipment Oper I 43,701 52,978 46.00 2,413,761 48.00 2,519,796 47.00 2,476,092
30000441 Business Operations Manager 80,413 107,099 1.00 107,100 1.00 107,100 1.00 107,100
30000442 Business Operations Manager, Sr 99,861 139,464 1.00 135,584 1.00 139,464 1.00 139,464
30000440 Business Operations Supervisor 71,302 95,389 2.00 190,776 2.00 190,776 2.00 190,776
30000447 Business Systems Analyst, Assistant 48,256 74,339 1.00 48,252 1.00 48,252 1.00 48,252
30000449 Business Systems Analyst, Sr 67,850 90,605 1.00 90,600 1.00 90,600 1.00 90,600
30000331 CAD Analyst 65,915 84,178 1.00 84,180 1.00 84,180 1.00 84,180
30000329 CAD Technician II 54,267 69,243 3.00 202,292 3.00 205,504 3.00 205,504
30001259 Capital Program Manager 80,413 107,099 1.00 98,364 1.00 102,402 1.00 102,402
30001258 Capital Project Control Manager 80,413 107,099 1.00 107,100 1.00 107,100 1.00 107,100
30000399 Capital Project Manager I 65,915 84,178 3.00 252,540 3.00 252,540 3.00 252,540
30000686 Capital Project Manager II 71,302 95,389 6.00 554,541 7.00 632,096 7.00 632,096
30000687 Capital Project Manager III 74,734 100,443 3.00 275,616 3.00 275,616 3.00 275,616
30000110 Carpenter 55,078 61,630 5.00 308,160 5.00 308,160 5.00 308,160
30001809 Collection System Investigator 52,562 58,698 3.00 176,112 4.00 228,672 4.00 228,672
30001808 Collection System Video Inspector 52,562 58,698 6.00 351,286 6.00 352,224 6.00 352,224
30000493 Community Outreach & Informtn Rep, Sr 64,605 86,154 0.00 0 1.00 64,608 1.00 64,608
30000107 Concrete Finisher 55,078 61,630 10.00 609,768 13.00 775,008 13.00 775,008
30000105 Construction Equipment Operator 46,530 59,426 15.00 875,634 16.00 934,800 16.00 934,800
30000733 Development Services Manager 86,466 115,149 1.00 88,404 1.00 91,726 1.00 91,726
30000334 Development Services Technician III 65,915 84,178 1.00 84,180 1.00 84,180 1.00 84,180
30000732 Development Supervisor I 67,850 90,605 1.00 69,204 2.00 149,184 2.00 149,184
30000836 Development Supervisor II 74,734 100,443 1.00 99,012 1.00 100,440 1.00 100,440
30000634 Electrical Supervisor 67,850 90,605 1.00 67,848 1.00 67,848 1.00 67,848
30000116 Electrician 68,910 74,381 17.00 1,253,472 18.00 1,329,531 17.00 1,263,027
30000121 Electrician/Instrument Technician 71,011 76,648 0.00 0 0.00 0 1.00 71,016
30000237 Electronics Technician II:Traffic Signal 59,946 72,675 3.00 218,016 3.00 218,016 3.00 218,016
30000683 Engineer, Chief 109,886 157,310 1.00 157,308 1.00 157,308 1.00 157,308
30000682 Engineer, Principal 100,402 133,869 3.00 388,632 2.00 258,477 2.00 258,477
30000680 Engineer, Sr 86,902 115,856 8.00 913,918 8.00 921,912 8.00 921,912
30000681 Engineer, Supervising 93,413 124,550 5.00 618,581 6.00 747,288 6.00 747,288
30001734 Engineer-Bridge 86,653 105,310 2.00 210,624 2.00 210,624 2.00 210,624
30000365 Engineer-Civil 86,653 105,310 2.00 210,624 2.00 210,624 2.00 210,624
30000370 Engineer-Traffic 86,653 105,310 8.00 823,836 8.00 823,836 8.00 823,836
30000358 Engineering Associate, Sr-Civil 74,922 95,534 8.00 747,033 8.00 753,842 8.00 753,842
30000362 Engineering Associate, Sr-Structural 74,922 95,534 1.00 95,532 1.00 95,532 1.00 95,532
30000363 Engineering Associate, Sr-Traffic 74,922 95,534 7.00 631,830 7.00 639,145 7.00 639,145
30000353 Engineering Associate-Civil 61,589 82,514 4.00 297,912 4.00 300,328 4.00 300,328
30000696 Engineering Survey Manager 74,734 100,443 1.00 100,440 1.00 100,440 1.00 100,440
30000324 Engineering Technician I 40,498 54,267 9.00 411,171 12.00 551,043 12.00 551,043
City of Portland, Oregon – FY 2015-16 Adopted Budget 485

Portland Bureau of Transportation FTE SummaryTransportation & Parking Service Area
30000325 Engineering Technician II 54,267 69,243 24.00 1,520,436 27.00 1,713,197 27.00 1,713,197
30000326 Engineering Technician III 65,915 84,178 7.00 559,560 7.00 565,309 7.00 565,309
30001810 Env Policy & Hazardous Materials Coord 74,734 95,347 1.00 95,352 1.00 95,352 1.00 95,352
30000095 Environmental Systems Crew Leader 56,534 61,464 10.00 614,640 10.00 614,640 10.00 614,640
30000567 Financial Analyst 61,506 81,994 3.00 235,748 3.00 242,048 3.00 242,048
30000566 Financial Analyst, Assistant 48,256 74,339 1.00 63,840 1.00 66,020 1.00 66,020
30000569 Financial Analyst, Principal 80,413 107,099 1.00 107,100 1.00 107,100 1.00 107,100
30000568 Financial Analyst, Sr 67,850 90,605 3.00 270,755 3.00 271,800 3.00 271,800
30000127 General Mechanic 49,982 62,275 2.00 124,560 2.00 124,560 2.00 124,560
30000341 GIS Technician I 40,498 54,267 1.00 54,264 1.00 54,264 1.00 54,264
30000342 GIS Technician II 54,267 69,243 5.00 330,540 5.00 335,740 5.00 335,740
30000343 GIS Technician III 65,915 84,178 3.00 221,996 3.00 233,070 3.00 233,070
30000372 Graphics Designer II 54,267 69,243 1.00 59,820 1.00 62,760 1.00 62,760
30000218 Inf Syst Analyst, Principal-Gen 80,413 107,099 1.00 107,100 1.00 107,100 1.00 107,100
30000166 Lighting & Signal Inspector 70,574 81,682 1.00 81,684 1.00 81,684 1.00 81,684
30000855 Maintenance Group Manager 99,861 139,464 1.00 139,464 1.00 139,464 1.00 139,464
30000644 Maintenance Planner/Scheduler 58,573 78,083 3.00 196,392 3.00 204,432 3.00 204,432
30000451 Management Analyst 61,506 81,994 3.00 226,896 3.00 228,816 3.00 228,816
30000453 Management Analyst, Principal 80,413 107,099 3.00 273,432 3.00 277,503 3.00 277,503
30000452 Management Analyst, Sr 67,850 90,605 3.00 270,887 4.00 339,648 4.00 339,648
30000450 Management Assistant 48,256 74,339 1.00 53,244 3.00 165,192 3.00 165,192
30000978 Mapping Data Technician II 65,915 84,178 2.00 151,481 2.00 154,880 2.00 154,880
30000347 Materials Quality Compliance Specialist 65,915 84,178 1.00 84,180 1.00 84,180 1.00 84,180
30000012 Office Support Specialist II 33,738 48,443 9.00 401,496 9.00 412,539 9.00 412,539
30000013 Office Support Specialist III 43,160 57,200 3.00 157,572 4.00 209,640 5.00 261,708
30000112 Painter 55,078 61,630 1.00 61,632 1.00 61,632 1.00 61,632
30000185 Parking Code Enforcement Officer 40,914 53,747 66.00 3,262,156 66.00 3,289,994 66.00 3,289,994
30000638 Parking Control Manager 67,850 90,605 1.00 88,647 1.00 90,600 1.00 90,600
30000637 Parking Enforcement Supervisor 64,605 86,154 4.00 320,330 4.00 322,712 4.00 322,712
30001859 Parking Pay Station Analyst 64,605 86,154 1.00 86,148 1.00 86,148 1.00 86,148
30000099 Parking Pay Station Technician 49,400 59,654 9.00 514,596 9.00 522,952 9.00 522,952
30000385 Planner II. City-Land Use 63,419 73,299 2.00 138,288 2.00 141,426 2.00 141,426
30000388 Planner II. City-Transportation 63,419 73,299 1.00 73,296 1.00 73,296 1.00 73,296
30000393 Planner, Sr City-Land Use 65,915 84,178 1.00 84,180 2.00 158,484 2.00 158,484
30000396 Planner, Sr City-Transportation 65,915 84,178 5.00 413,016 5.00 416,928 5.00 416,928
30000395 Planner, Sr City-Transportation Modeling 65,915 84,178 1.00 84,180 1.00 84,180 1.00 84,180
30000640 Portland Streetcar Maintenance Manager 71,302 95,389 1.00 95,388 1.00 95,388 1.00 95,388
30000643 Portland Streetcar Maintenance Supvr 61,506 81,994 4.00 264,281 4.00 271,941 4.00 271,941
30000639 Portland Streetcar Operations Manager 71,302 95,389 1.00 95,388 1.00 95,388 1.00 95,388
30000839 Portland Streetcar Operations Supvr 61,506 81,994 4.00 312,653 4.00 318,743 4.00 318,743
30000464 Program Coordinator 64,605 86,154 4.00 325,585 4.00 331,868 4.00 331,868
30000465 Program Manager 67,850 90,605 4.00 341,580 4.00 347,897 4.00 347,897
30000466 Program Manager, Sr 80,413 107,099 1.00 107,100 1.00 107,100 1.00 107,100
30000463 Program Specialist 58,573 78,083 4.00 275,006 5.00 350,441 5.00 350,441
30000462 Program Specialist, Assistant 48,256 74,339 1.00 74,340 1.00 74,340 1.00 74,340
30000497 Public Information Manager 74,734 100,443 1.00 74,736 1.00 74,736 1.00 74,736
30000495 Public Information Officer 67,850 90,605 1.00 90,600 1.00 90,600 1.00 90,600
30000632 Public Works Division Manager 92,976 125,986 3.00 350,079 3.00 357,729 3.00 357,729
30000690 Public Works Inspection Supervisor 67,850 90,605 1.00 90,600 1.00 90,600 1.00 90,600
30000228 Public Works Inspector 60,882 69,576 8.00 542,933 8.00 551,102 8.00 551,102
Salary Range Revised
FY 2014-15 ProposedFY 2015-16
AdoptedFY 2015-16
Class Title Minimum Maximum No. Amount No. Amount No. Amount
486 City of Portland, Oregon – FY 2015-16 Adopted Budget
FTE Summary Portland Bureau of TransportationTransportation & Parking Service Area
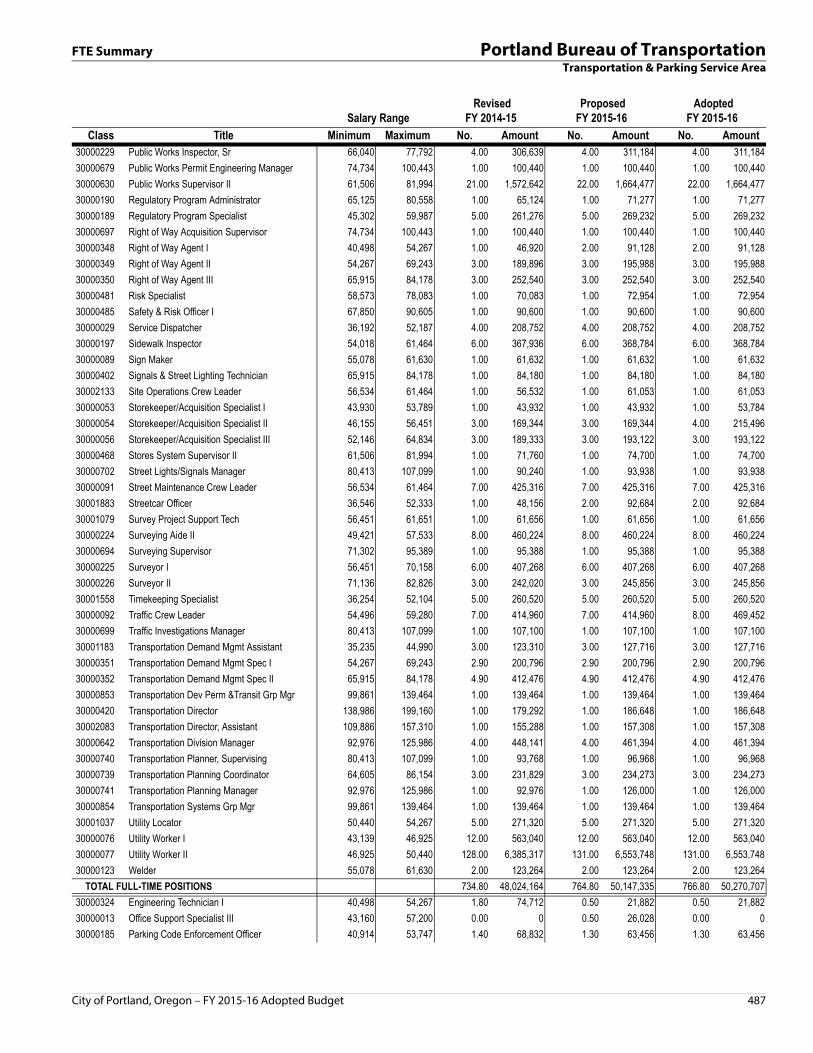
30000229 Public Works Inspector, Sr 66,040 77,792 4.00 306,639 4.00 311,184 4.00 311,184
30000679 Public Works Permit Engineering Manager 74,734 100,443 1.00 100,440 1.00 100,440 1.00 100,440
30000630 Public Works Supervisor II 61,506 81,994 21.00 1,572,642 22.00 1,664,477 22.00 1,664,477
30000190 Regulatory Program Administrator 65,125 80,558 1.00 65,124 1.00 71,277 1.00 71,277
30000189 Regulatory Program Specialist 45,302 59,987 5.00 261,276 5.00 269,232 5.00 269,232
30000697 Right of Way Acquisition Supervisor 74,734 100,443 1.00 100,440 1.00 100,440 1.00 100,440
30000348 Right of Way Agent I 40,498 54,267 1.00 46,920 2.00 91,128 2.00 91,128
30000349 Right of Way Agent II 54,267 69,243 3.00 189,896 3.00 195,988 3.00 195,988
30000350 Right of Way Agent III 65,915 84,178 3.00 252,540 3.00 252,540 3.00 252,540
30000481 Risk Specialist 58,573 78,083 1.00 70,083 1.00 72,954 1.00 72,954
30000485 Safety & Risk Officer I 67,850 90,605 1.00 90,600 1.00 90,600 1.00 90,600
30000029 Service Dispatcher 36,192 52,187 4.00 208,752 4.00 208,752 4.00 208,752
30000197 Sidewalk Inspector 54,018 61,464 6.00 367,936 6.00 368,784 6.00 368,784
30000089 Sign Maker 55,078 61,630 1.00 61,632 1.00 61,632 1.00 61,632
30000402 Signals & Street Lighting Technician 65,915 84,178 1.00 84,180 1.00 84,180 1.00 84,180
30002133 Site Operations Crew Leader 56,534 61,464 1.00 56,532 1.00 61,053 1.00 61,053
30000053 Storekeeper/Acquisition Specialist I 43,930 53,789 1.00 43,932 1.00 43,932 1.00 53,784
30000054 Storekeeper/Acquisition Specialist II 46,155 56,451 3.00 169,344 3.00 169,344 4.00 215,496
30000056 Storekeeper/Acquisition Specialist III 52,146 64,834 3.00 189,333 3.00 193,122 3.00 193,122
30000468 Stores System Supervisor II 61,506 81,994 1.00 71,760 1.00 74,700 1.00 74,700
30000702 Street Lights/Signals Manager 80,413 107,099 1.00 90,240 1.00 93,938 1.00 93,938
30000091 Street Maintenance Crew Leader 56,534 61,464 7.00 425,316 7.00 425,316 7.00 425,316
30001883 Streetcar Officer 36,546 52,333 1.00 48,156 2.00 92,684 2.00 92,684
30001079 Survey Project Support Tech 56,451 61,651 1.00 61,656 1.00 61,656 1.00 61,656
30000224 Surveying Aide II 49,421 57,533 8.00 460,224 8.00 460,224 8.00 460,224
30000694 Surveying Supervisor 71,302 95,389 1.00 95,388 1.00 95,388 1.00 95,388
30000225 Surveyor I 56,451 70,158 6.00 407,268 6.00 407,268 6.00 407,268
30000226 Surveyor II 71,136 82,826 3.00 242,020 3.00 245,856 3.00 245,856
30001558 Timekeeping Specialist 36,254 52,104 5.00 260,520 5.00 260,520 5.00 260,520
30000092 Traffic Crew Leader 54,496 59,280 7.00 414,960 7.00 414,960 8.00 469,452
30000699 Traffic Investigations Manager 80,413 107,099 1.00 107,100 1.00 107,100 1.00 107,100
30001183 Transportation Demand Mgmt Assistant 35,235 44,990 3.00 123,310 3.00 127,716 3.00 127,716
30000351 Transportation Demand Mgmt Spec I 54,267 69,243 2.90 200,796 2.90 200,796 2.90 200,796
30000352 Transportation Demand Mgmt Spec II 65,915 84,178 4.90 412,476 4.90 412,476 4.90 412,476
30000853 Transportation Dev Perm &Transit Grp Mgr 99,861 139,464 1.00 139,464 1.00 139,464 1.00 139,464
30000420 Transportation Director 138,986 199,160 1.00 179,292 1.00 186,648 1.00 186,648
30002083 Transportation Director, Assistant 109,886 157,310 1.00 155,288 1.00 157,308 1.00 157,308
30000642 Transportation Division Manager 92,976 125,986 4.00 448,141 4.00 461,394 4.00 461,394
30000740 Transportation Planner, Supervising 80,413 107,099 1.00 93,768 1.00 96,968 1.00 96,968
30000739 Transportation Planning Coordinator 64,605 86,154 3.00 231,829 3.00 234,273 3.00 234,273
30000741 Transportation Planning Manager 92,976 125,986 1.00 92,976 1.00 126,000 1.00 126,000
30000854 Transportation Systems Grp Mgr 99,861 139,464 1.00 139,464 1.00 139,464 1.00 139,464
30001037 Utility Locator 50,440 54,267 5.00 271,320 5.00 271,320 5.00 271,320
30000076 Utility Worker I 43,139 46,925 12.00 563,040 12.00 563,040 12.00 563,040
30000077 Utility Worker II 46,925 50,440 128.00 6,385,317 131.00 6,553,748 131.00 6,553,748
30000123 Welder 55,078 61,630 2.00 123,264 2.00 123,264 2.00 123,264
TOTAL FULL-TIME POSITIONS 734.80 48,024,164 764.80 50,147,335 766.80 50,270,707
30000324 Engineering Technician I 40,498 54,267 1.80 74,712 0.50 21,882 0.50 21,882
30000013 Office Support Specialist III 43,160 57,200 0.00 0 0.50 26,028 0.00 0
30000185 Parking Code Enforcement Officer 40,914 53,747 1.40 68,832 1.30 63,456 1.30 63,456
Salary Range Revised
FY 2014-15 ProposedFY 2015-16
AdoptedFY 2015-16
Class Title Minimum Maximum No. Amount No. Amount No. Amount
City of Portland, Oregon – FY 2015-16 Adopted Budget 487

Portland Bureau of Transportation FTE SummaryTransportation & Parking Service Area
30000463 Program Specialist 58,573 78,083 0.90 33,714 0.50 19,500 0.50 19,500
30000029 Service Dispatcher 36,192 52,187 3.60 163,453 3.60 166,936 3.60 166,936
30000351 Transportation Demand Mgmt Spec I 54,267 69,243 0.90 56,484 0.50 32,821 0.50 32,821
30000352 Transportation Demand Mgmt Spec II 65,915 84,178 0.90 75,756 0.50 42,084 0.50 42,084
TOTAL PART-TIME POSITIONS 9.50 472,951 7.40 372,707 6.90 346,679
30000434 Administrative Assistant 48,256 74,339 0.67 32,168 0.00 0 0.00 0
30000101 Automotive Equipment Oper I 43,701 52,978 0.00 0 1.00 42,180 1.00 42,180
30000448 Business Systems Analyst 61,506 81,994 0.83 51,260 1.00 61,512 1.00 61,512
30000491 Community Outreach & Informtn Assistant 48,256 74,339 1.00 49,407 1.00 51,436 1.00 51,436
30000116 Electrician 68,910 74,381 1.00 68,916 3.00 206,120 3.00 206,120
30000353 Engineering Associate-Civil 61,589 82,514 0.00 0 1.00 61,116 1.00 61,116
30000324 Engineering Technician I 40,498 54,267 2.00 85,668 0.00 0 0.00 0
30000325 Engineering Technician II 54,267 69,243 1.83 99,484 (1.00) (59,332) 0.00 (4)
30000342 GIS Technician II 54,267 69,243 1.00 55,584 1.00 58,362 1.00 58,362
30000451 Management Analyst 61,506 81,994 0.83 51,260 1.00 61,512 0.00 0
30000450 Management Assistant 48,256 74,339 1.00 48,252 (1.00) (61,512) 0.00 0
30000375 Planner, Associate 52,333 60,570 2.00 106,384 2.00 105,094 2.00 105,094
30000839 Portland Streetcar Operations Supvr 61,506 81,994 1.00 73,475 1.00 76,485 1.00 76,485
30000348 Right of Way Agent I 40,498 54,267 0.92 37,125 0.00 0 0.00 0
30001183 Transportation Demand Mgmt Assistant 35,235 44,990 1.92 69,256 2.00 74,144 1.00 17,684
TOTAL LIMITED TERM POSITIONS 16.00 828,239 12.00 677,117 12.00 679,985
GRAND TOTAL 760.30 49,325,354 784.20 51,197,159 785.70 51,297,371
Salary Range Revised
FY 2014-15 ProposedFY 2015-16
AdoptedFY 2015-16
Class Title Minimum Maximum No. Amount No. Amount No. Amount
488 City of Portland, Oregon – FY 2015-16 Adopted Budget

Budget Decisions Portland Bureau of TransportationTransportation & Parking Service Area
This chart shows decisions and adjustments made during the budget process. The chart begins with an estimate of the bureau's Current Appropriations Level (CAL) requirements.
Amount
Action Ongoing One-Time Total Package FTE Decision
FY 2015-16 199,878,817 0 199,878,817 757.12 FY 2015-16 Current Appropriation Level
CAL Adjustments
0 0 0 0.00 None
Mayor's Proposed Budget Decisions
0 4,690,000 4,690,000 0.00 Safety improvements on 122nd Avenue
0 12,065,800 12,065,800 0.00 Seven major maintenance projects
0 960,000 960,000 0.00 Youth bus pass
0 60,000 60,000 0.00 Safe Routes to School expansion (partial)
216,660 0 216,660 2.00 Two development review positions
68,208 0 68,208 1.00 Streetcar fare enforcement position
250,000 0 250,000 2.00 Manhole inspections
0 90,480 90,480 1.00 One posiiton to track LED lights replacements
0 259,452 259,452 3.00 Replace traffic signal equipment
0 700,000 700,000 0.00 SW Corridor Transit Project
1,364,843 135,157 1,500,000 0.00 "Out of the Mud" - improve unpaved streets
0 250,000 250,000 0.00 Streetcar capital improvements
0 500,000 500,000 0.00 Burnside pedestrian bridge
180,000 0 180,000 0.00 OMF Interagency for campsite cleanup
735 0 735 0.00 Minor technical adjustments
0 0 0 18.08 Realignments adding various FTEs
Approved Budget Additions and Reductions
0 240,000 240,000 0.00 Safe Routes to School expansion (full)
(190,224) (250,000) (440,224) 0.00 "Out of the Mud" reduction
0 0 0 0.50 Realignment - regulatory administration
0 19,472 19,472 0.00 OMF-Facilities interagency adjustments
Adopted Budget Additions and Reductions
0 157,500 157,500 0.00 Carryover: IA for Facilities Site Master Plan
0 0 0 1.00 Realignment to add new Streetcar Storekeeper
2,756 0 2,756 0.00 Risk IA - Specialty Driver's Education Training
14,000 0 14,000 0.00 State lease for fleet parking lot
1,906,978 19,877,861 21,784,839 28.58 Total FY 2015-16 Decision Packages
221,663,656 785.70 Total Adopted Budget
City of Portland, Oregon – FY 2015-16 Adopted Budget 489


