
PSU Friday Transportation Seminar13 February, 2015
Transportation System Impacts on Bicyclists' Air Pollution Risks
Alex BigazziMiguel Figliozzi James PankowWentai Luo
Considerations for System Design and Use
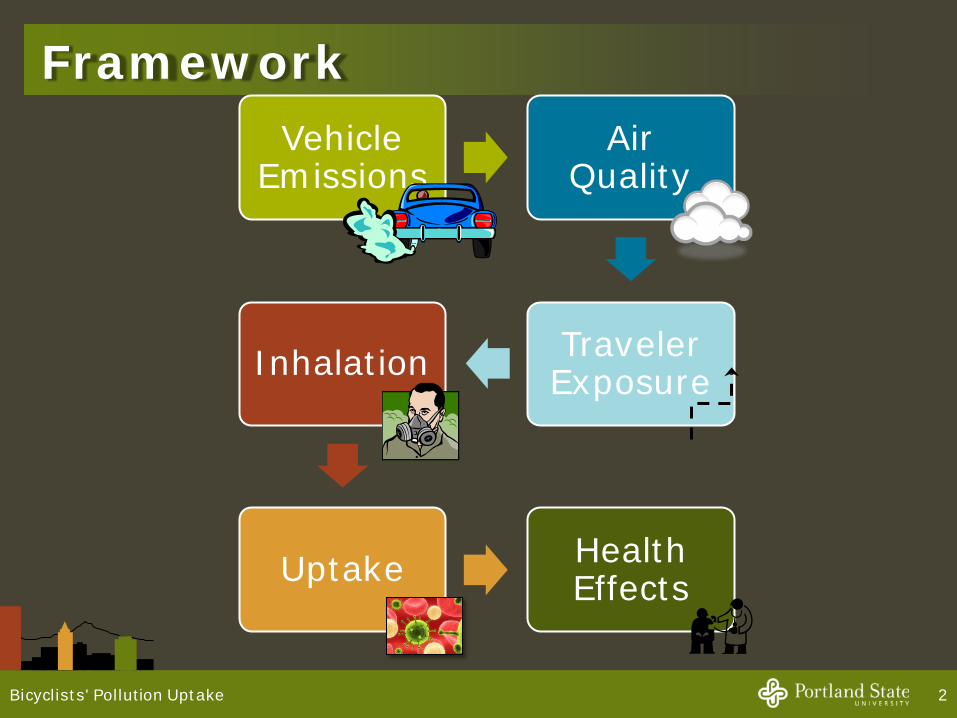
Framework
2
Vehicle Emissions
Air Quality
Traveler ExposureInhalation
Uptake Health Effects
Bicyclists' Pollution Uptake
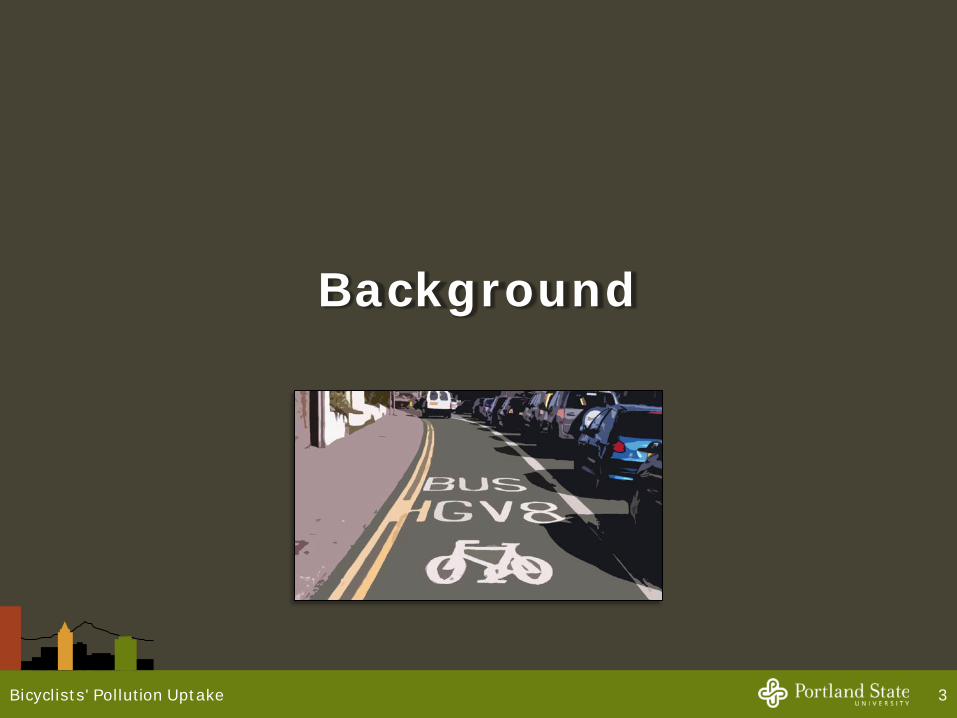
Background
3Bicyclists' Pollution Uptake
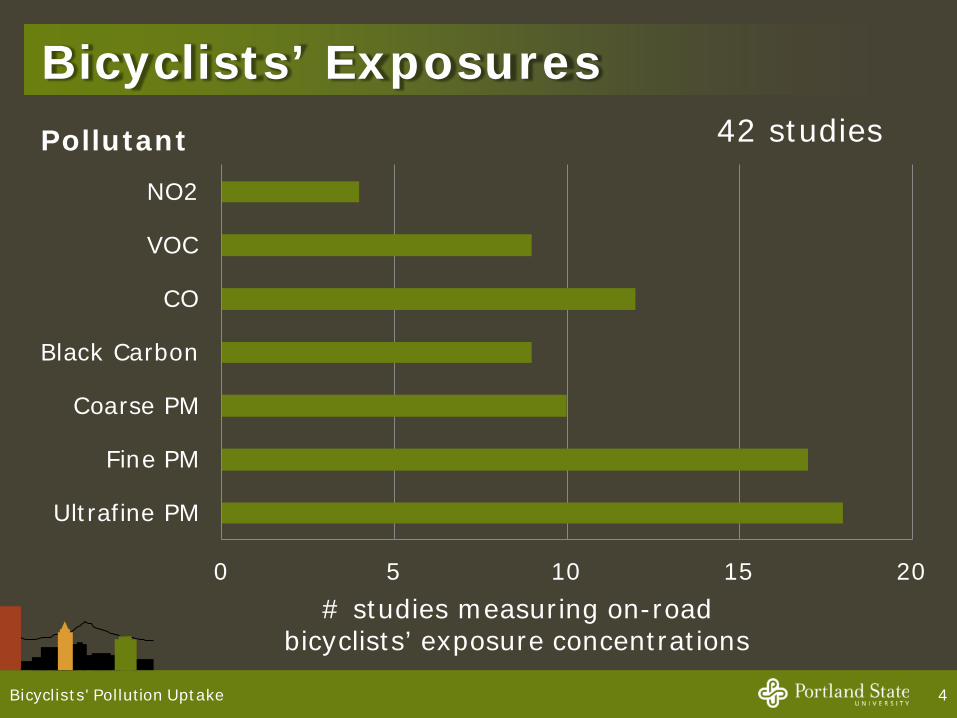
Bicyclists’ Exposures
4
0 5 10 15 20
Ultrafine PM
Fine PM
Coarse PM
Black Carbon
CO
VOC
NO2
# studies measuring on-road bicyclists’ exposure concentrations
Pollutant 42 studies
Bicyclists' Pollution Uptake
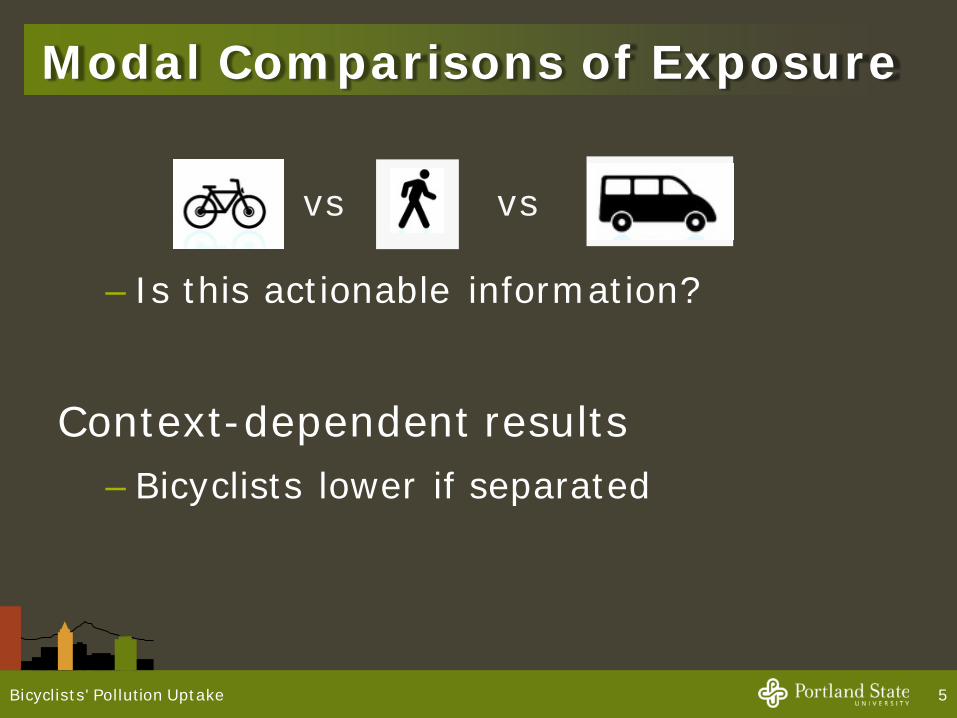
Modal Comparisons of Exposure
– Is this actionable information?
Context-dependent results– Bicyclists lower if separated
5Bicyclists' Pollution Uptake
vsvs
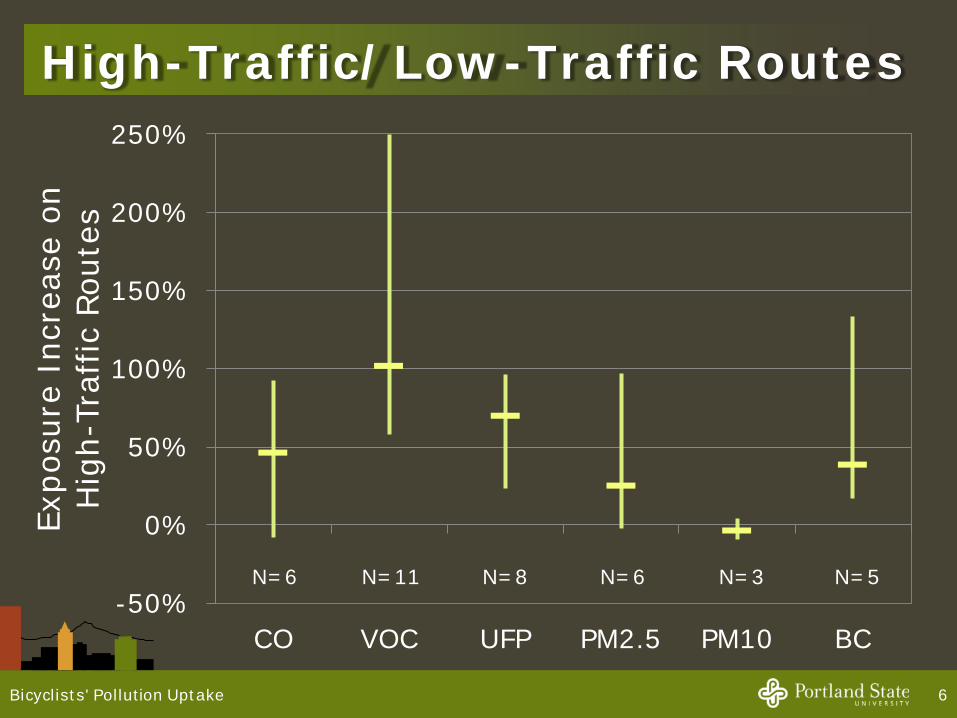
High-Traffic/Low-Traffic Routes
6Bicyclists' Pollution Uptake
-50%
0%
50%
100%
150%
200%
250%
CO VOC UFP PM2.5 PM10 BC
Expo
sure
Inc
reas
e on
H
igh-
Traf
fic R
oute
s
N=6 N=11 N=8 N=6 N=3 N=5
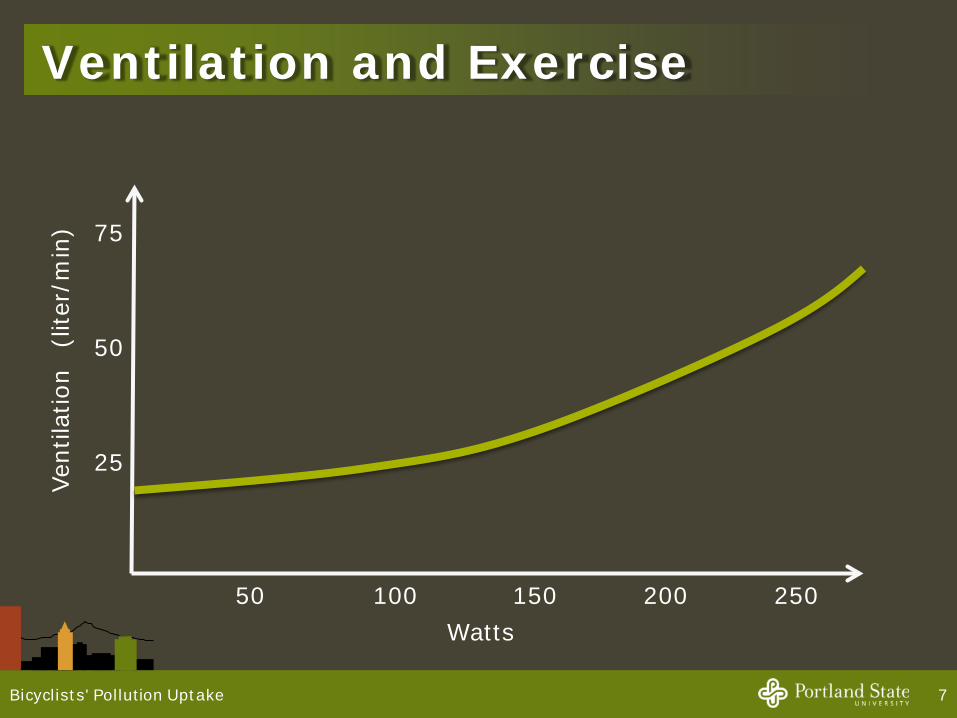
Ventilation and Exercise
7Bicyclists' Pollution Uptake
50 100 150 200 250 Watts
Vent
ilatio
n (
liter
/min
) 75
50
25
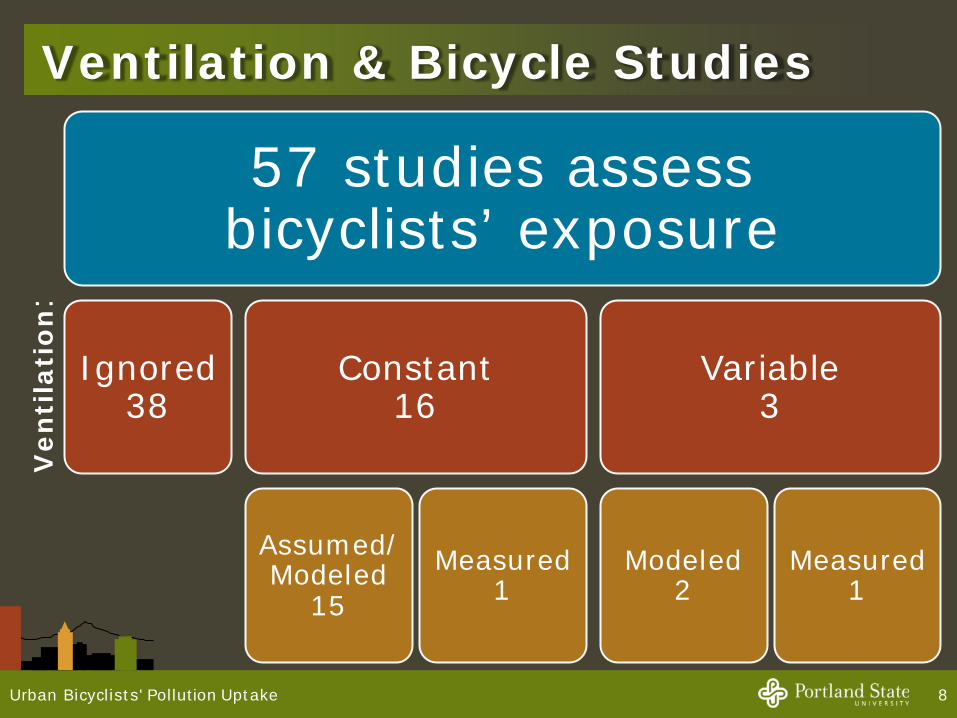
Ventilation & Bicycle Studies
8
57 studies assessbicyclists’ exposure
Ignored38
Constant16
Assumed/Modeled
15Measured
1
Variable3
Modeled 2
Measured1
Ven
tila
tio
n:
Urban Bicyclists' Pollution Uptake
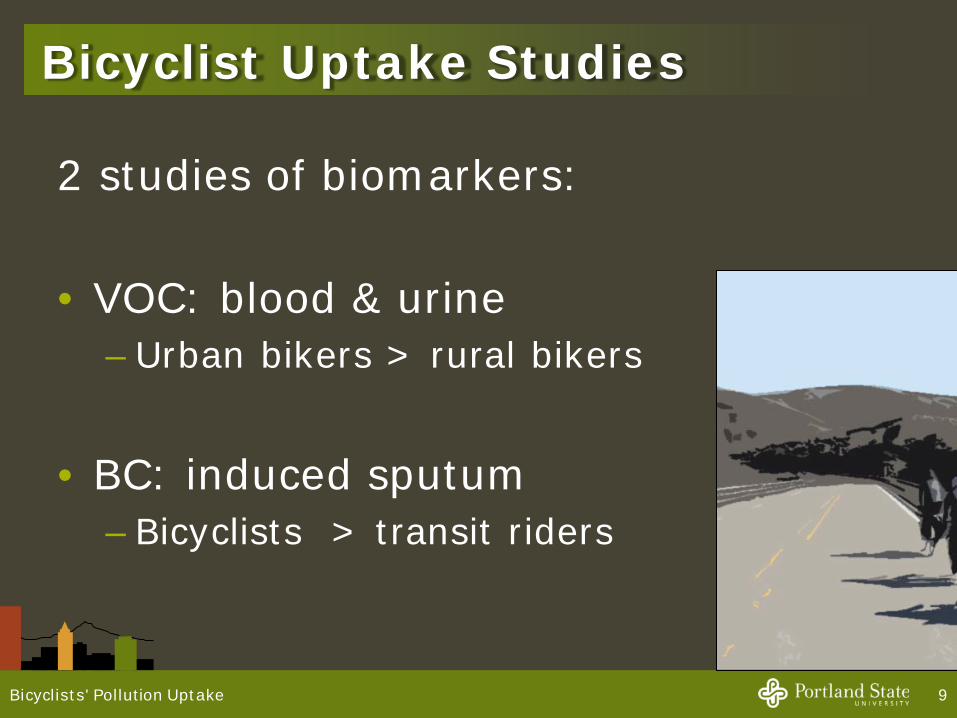
Bicyclist Uptake Studies
2 studies of biomarkers:
• VOC: blood & urine– Urban bikers > rural bikers
• BC: induced sputum– Bicyclists > transit riders
9Bicyclists' Pollution Uptake
Research Questions
1. How does uptake vary with roadway and travel conditions?
2. Can transport strategies reduce bicyclist uptake?
10Bicyclists' Pollution Uptake
Data & Methods
11Bicyclists' Pollution Uptake
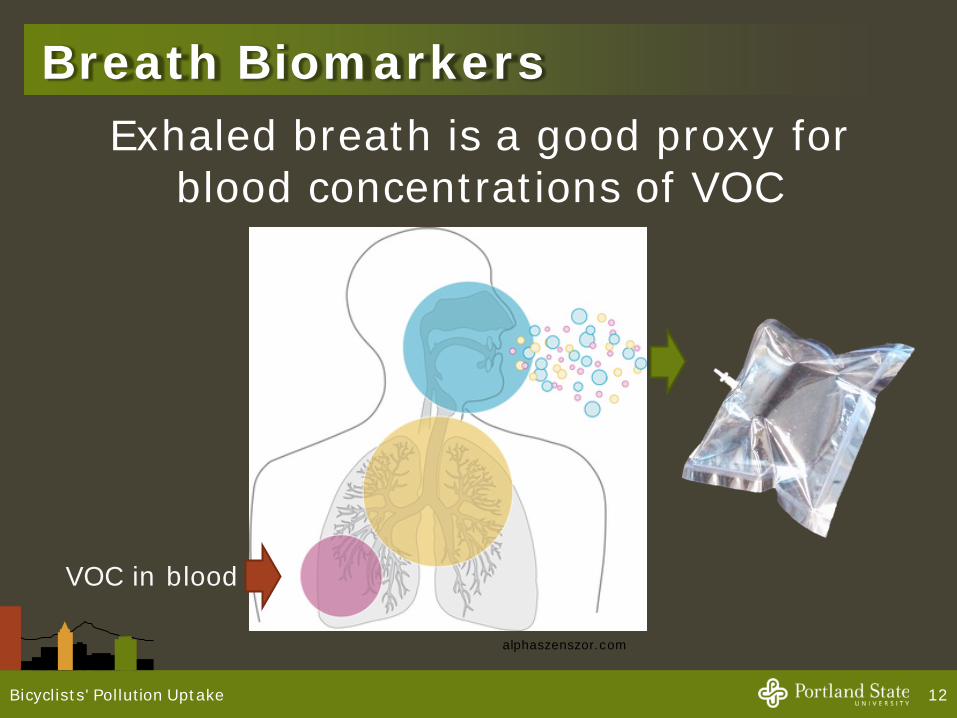
Breath BiomarkersExhaled breath is a good proxy for
blood concentrations of VOC
12Bicyclists' Pollution Uptake
alphaszenszor.com
VOC in blood
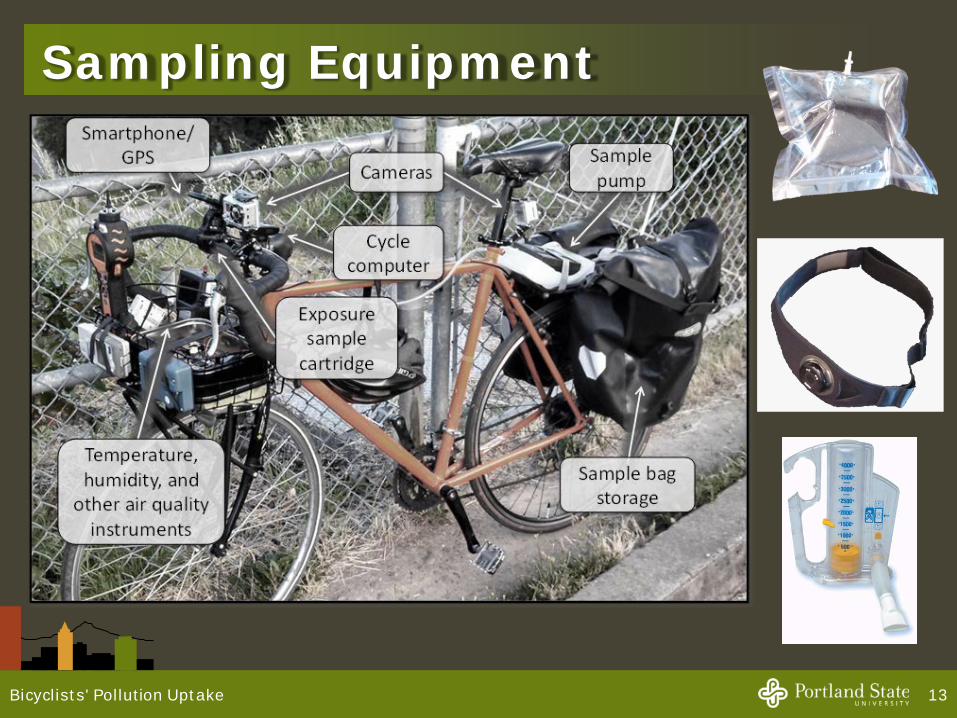
Sampling Equipment
13Bicyclists' Pollution Uptake
1) Local roads
Pre Breath
Post Breath
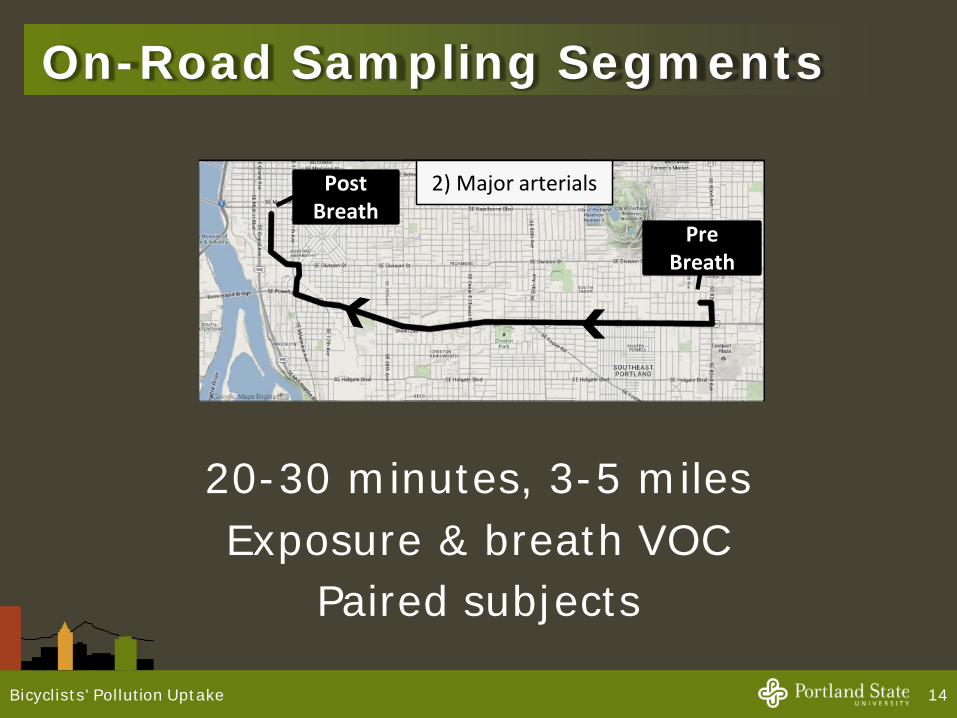
On-Road Sampling Segments
20-30 minutes, 3-5 milesExposure & breath VOC
Paired subjects
14Bicyclists' Pollution Uptake
Pre Breath
Post Breath
2) Major arterials
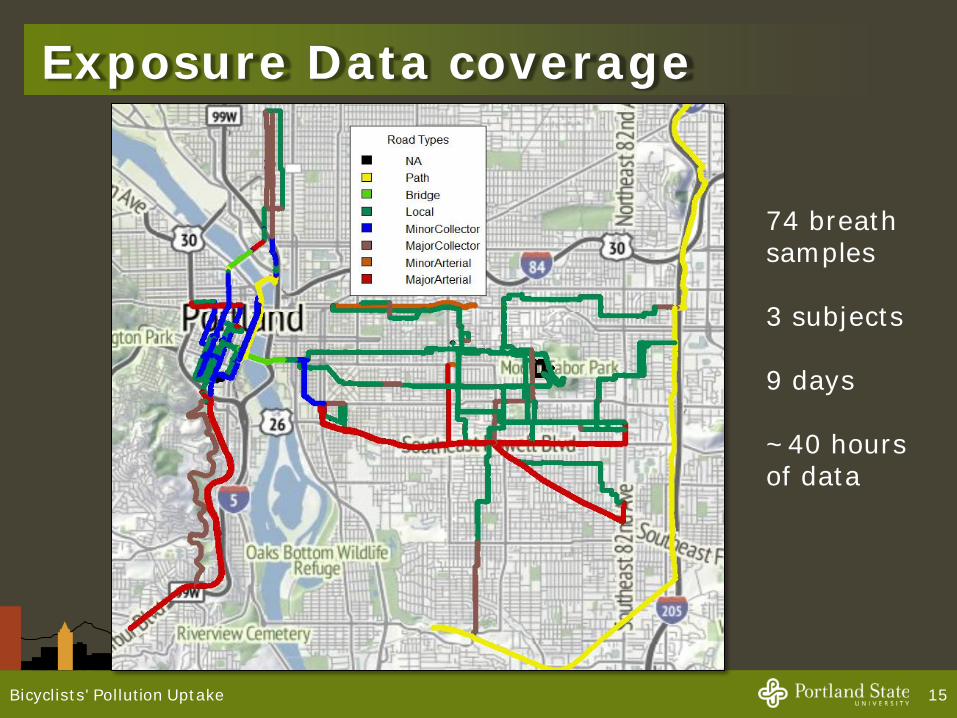
Exposure Data coverage
15Bicyclists' Pollution Uptake
74 breath samples
3 subjects
9 days
~40 hours of data
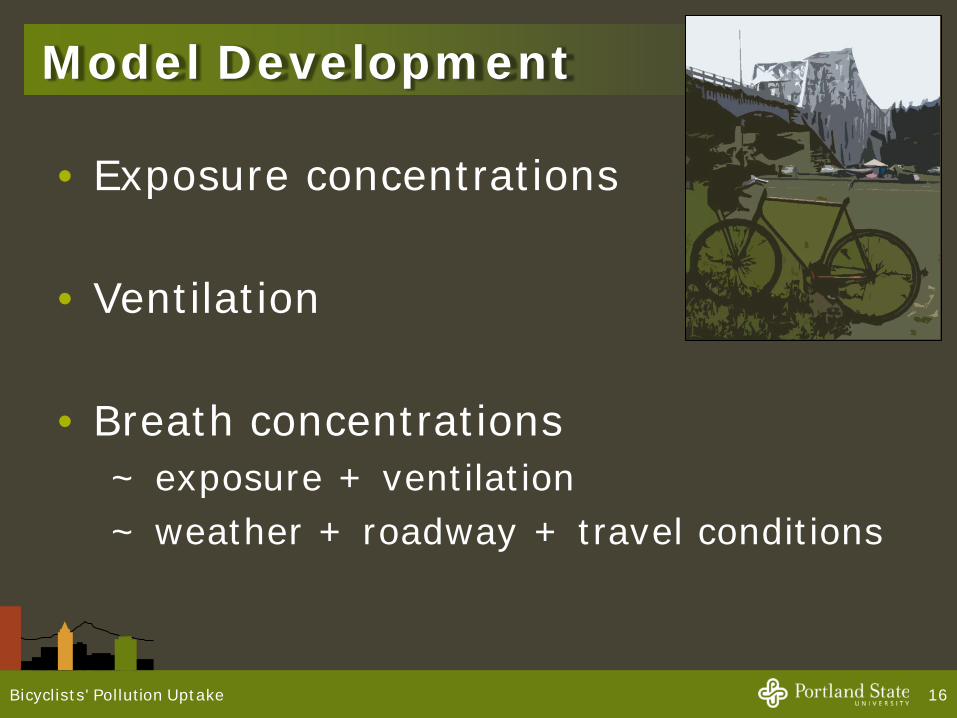
Model Development
• Exposure concentrations
• Ventilation
• Breath concentrations~ exposure + ventilation~ weather + roadway + travel conditions
16Bicyclists' Pollution Uptake
Results
17Bicyclists' Pollution Uptake
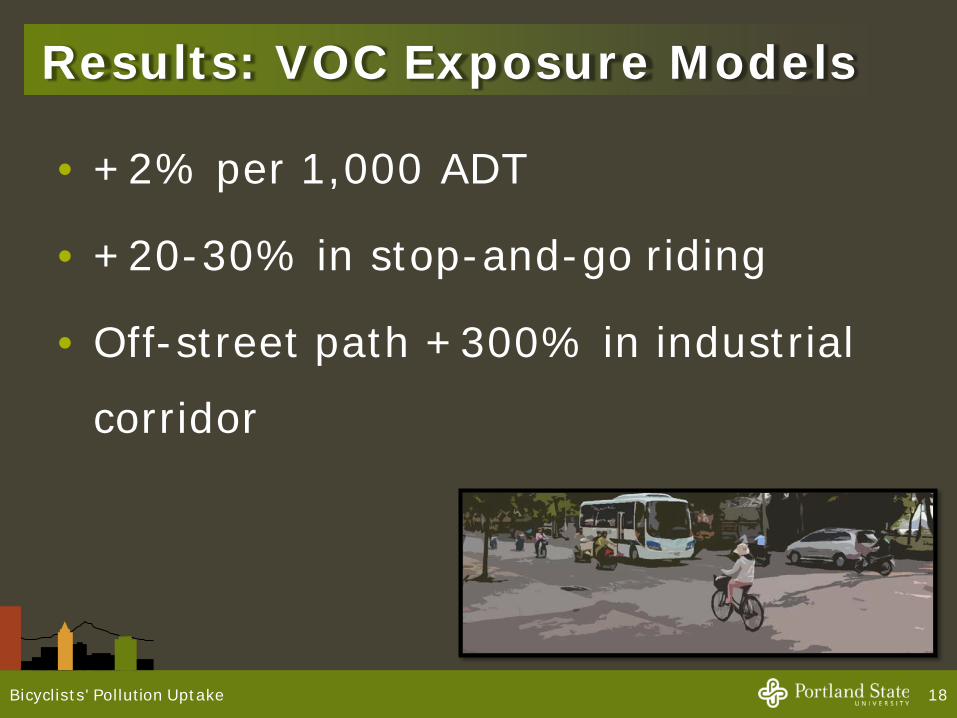
Results: VOC Exposure Models
• +2% per 1,000 ADT
• +20-30% in stop-and-go riding
• Off-street path +300% in industrial
corridor
18Bicyclists' Pollution Uptake
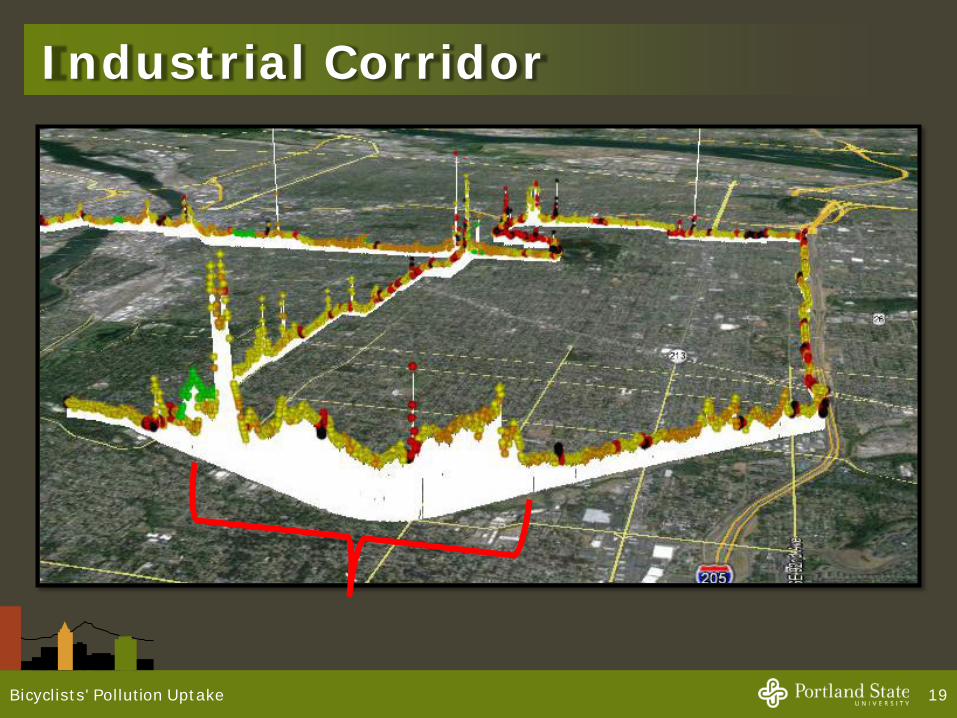
19
Industrial Corridor
Bicyclists' Pollution Uptake
20
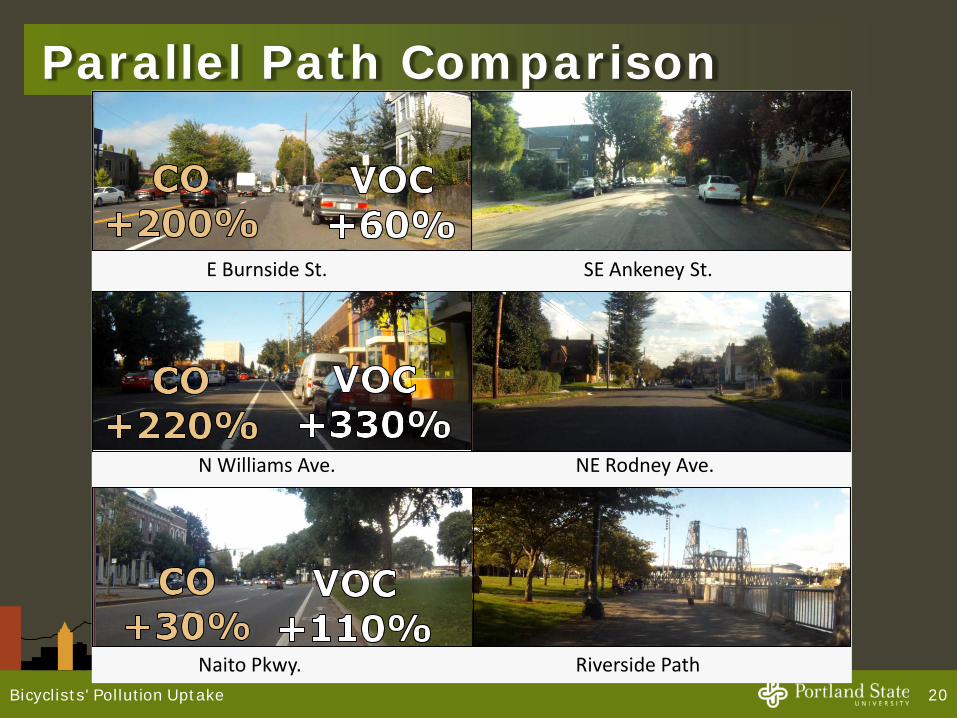
Parallel Path Comparison
Bicyclists' Pollution Uptake
E Burnside St. SE Ankeney St.
N Williams Ave. NE Rodney Ave.
Naito Pkwy. Riverside Path
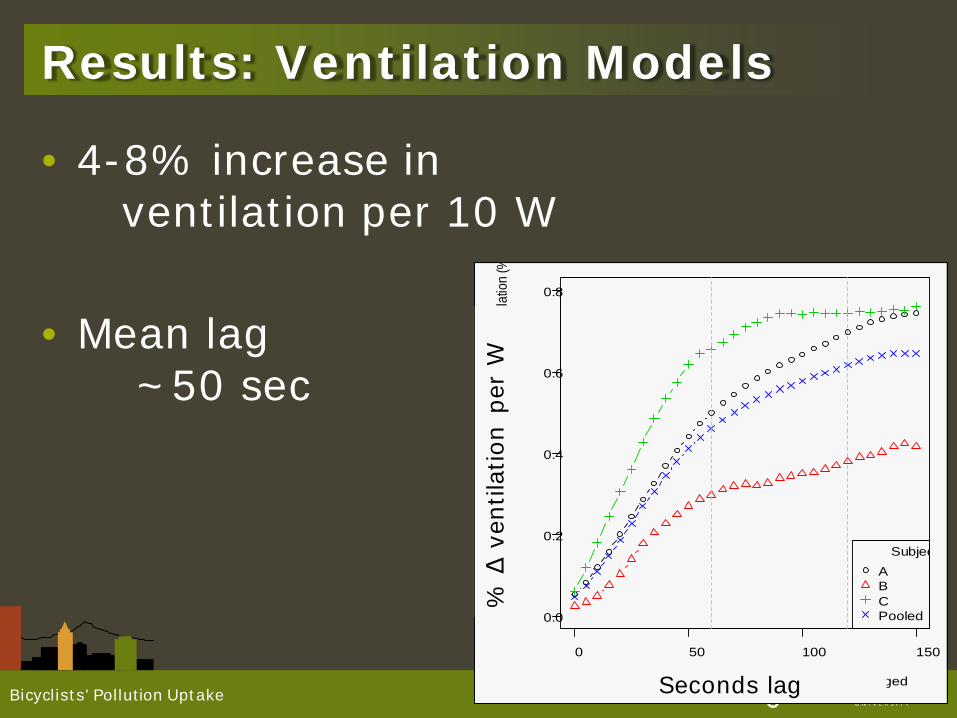
Results: Ventilation Models
• 4-8% increase in ventilation per 10 W
• Mean lag ~50 sec
21Bicyclists' Pollution Uptake
0 50 100 150
0.0
0.2
0.4
0.6
0.8
Seconds workload lagged
Cum
ulat
ive im
pact
on ve
ntila
tion
(%
SubjecABCPooled
% Δ
vent
ilatio
n pe
r W
Seconds lag
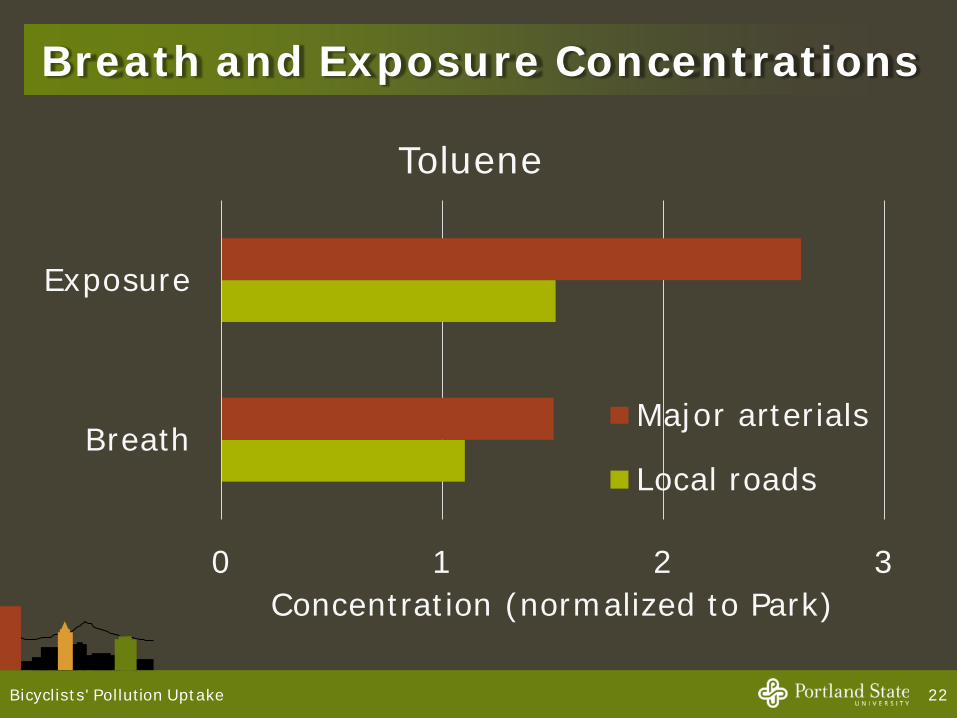
Breath and Exposure Concentrations
0 1 2 3
Breath
Exposure
Concentration (normalized to Park)
Toluene
Major arterials
Local roads
22Bicyclists' Pollution Uptake
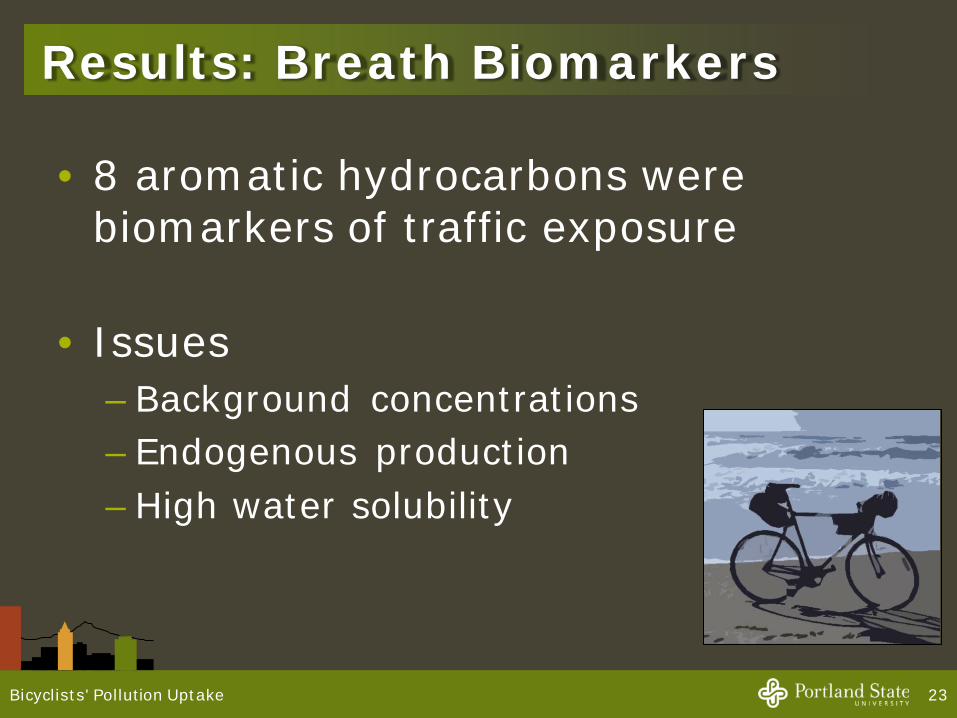
Results: Breath Biomarkers
• 8 aromatic hydrocarbons were biomarkers of traffic exposure
• Issues– Background concentrations– Endogenous production– High water solubility
23Bicyclists' Pollution Uptake
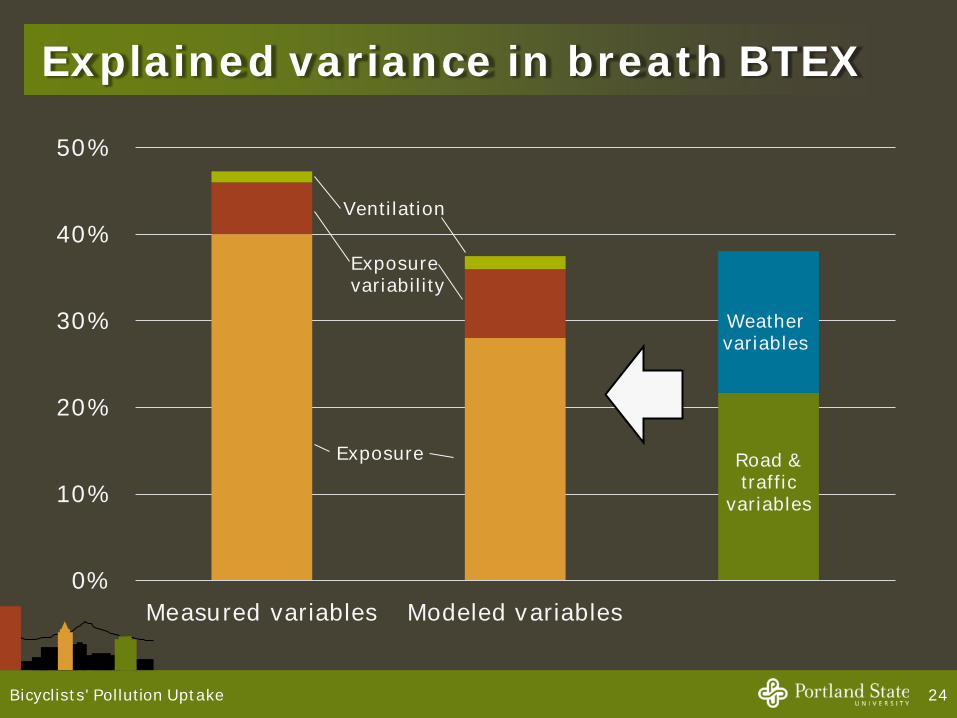
Explained variance in breath BTEX
24Bicyclists' Pollution Uptake
0%
10%
20%
30%
40%
50%
Measured variables Modeled variables
Exposure
Ventilation
Exposure variability
Weather variables
Road & traffic
variables
Applications
25Bicyclists' Pollution Uptake
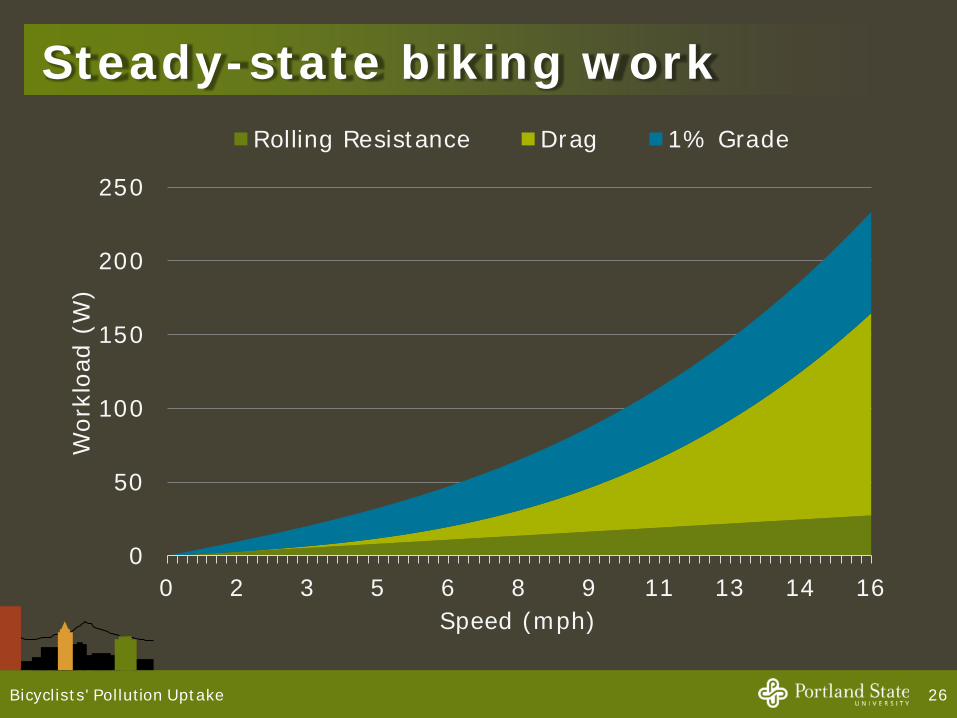
Steady-state biking work
26Bicyclists' Pollution Uptake
0
50
100
150
200
250
0 2 3 5 6 8 9 11 13 14 16
Wor
kloa
d (W
)
Speed (mph)
Rolling Resistance Drag 1% Grade
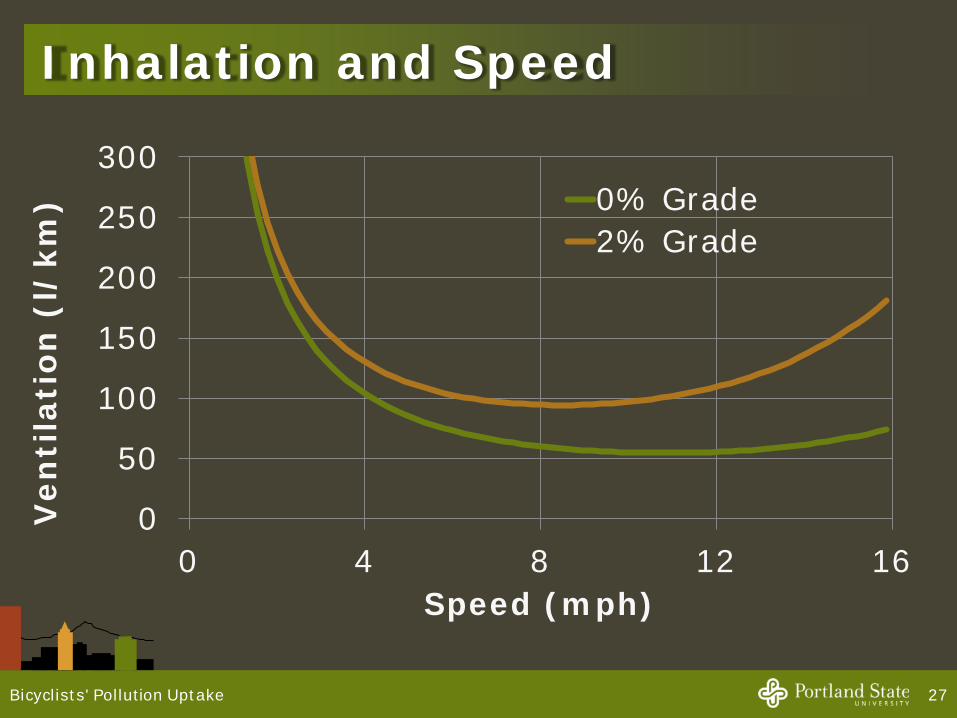
Inhalation and Speed
27Bicyclists' Pollution Uptake
0
50
100
150
200
250
300
0 4 8 12 16
Ven
tila
tion
(l/
km)
Speed (mph)
0% Grade2% Grade
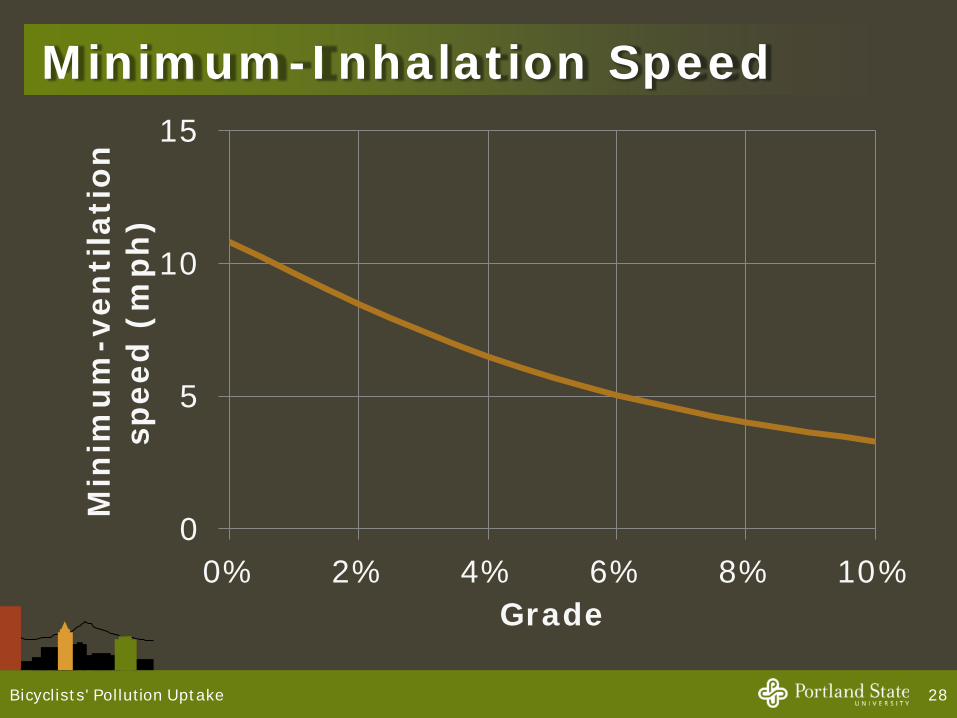
Minimum-Inhalation Speed
28Bicyclists' Pollution Uptake
0
5
10
15
0% 2% 4% 6% 8% 10%
Min
imu
m-v
enti
lati
on
spee
d (m
ph)
Grade
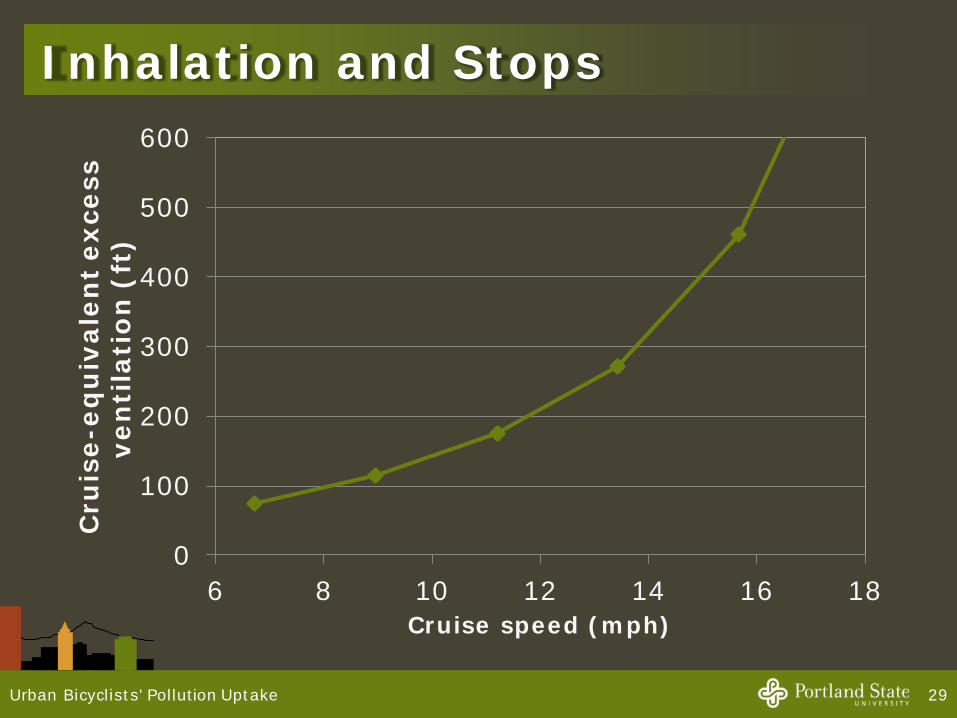
Inhalation and Stops
29Urban Bicyclists' Pollution Uptake
0
100
200
300
400
500
600
6 8 10 12 14 16 18
Cru
ise-
equ
ival
ent
exce
ss
ven
tila
tio
n (
ft)
Cruise speed (mph)
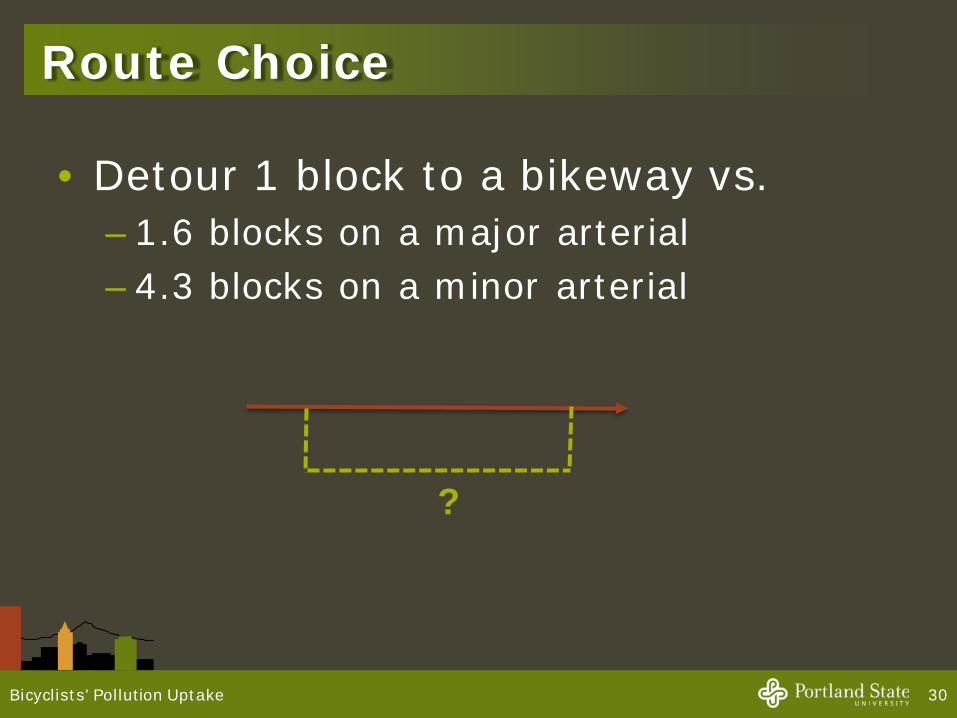
Route Choice
• Detour 1 block to a bikeway vs.– 1.6 blocks on a major arterial– 4.3 blocks on a minor arterial
30Bicyclists' Pollution Uptake
?
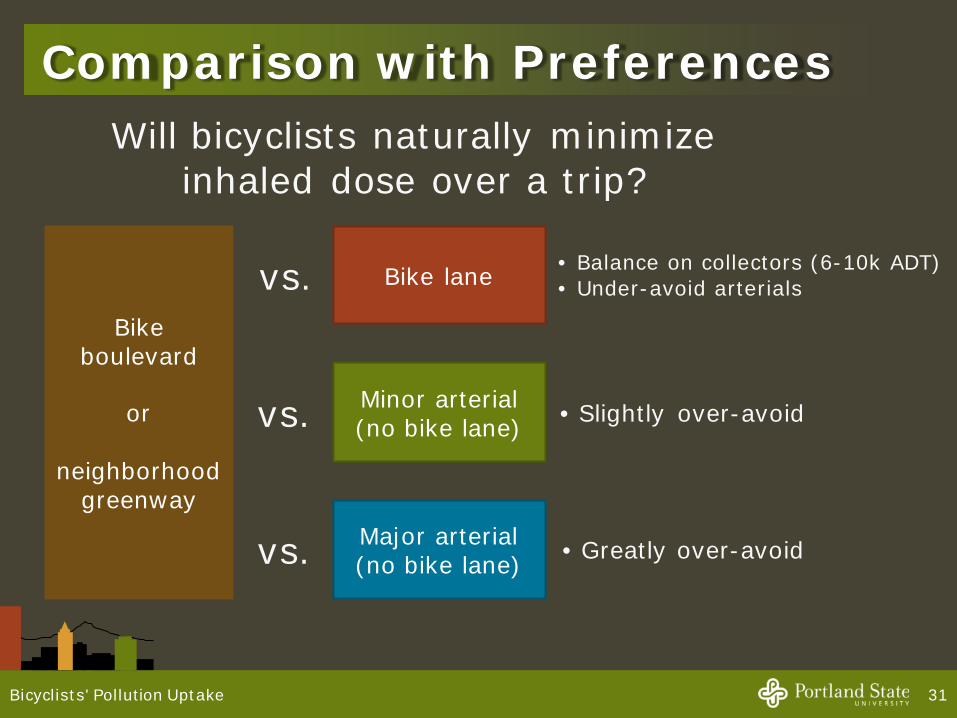
Comparison with Preferences
31Bicyclists' Pollution Uptake
Will bicyclists naturally minimize inhaled dose over a trip?
Bike boulevard
or
neighborhood greenway
Bike lane
Minor arterial (no bike lane)
Major arterial (no bike lane)
• Slightly over-avoid
• Balance on collectors (6-10k ADT) • Under-avoid arterials
• Greatly over-avoid
vs.
vs.
vs.
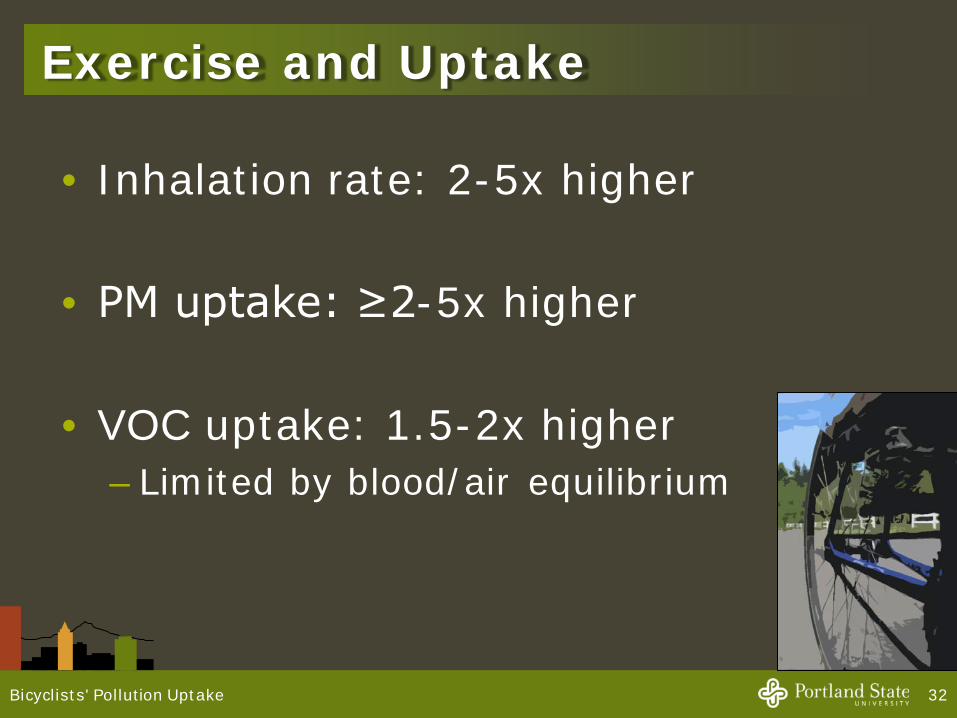
Exercise and Uptake
• Inhalation rate: 2-5x higher
• PM uptake: ≥2-5x higher
• VOC uptake: 1.5-2x higher– Limited by blood/air equilibrium
32Bicyclists' Pollution Uptake
Conclusions
33Bicyclists' Pollution Uptake
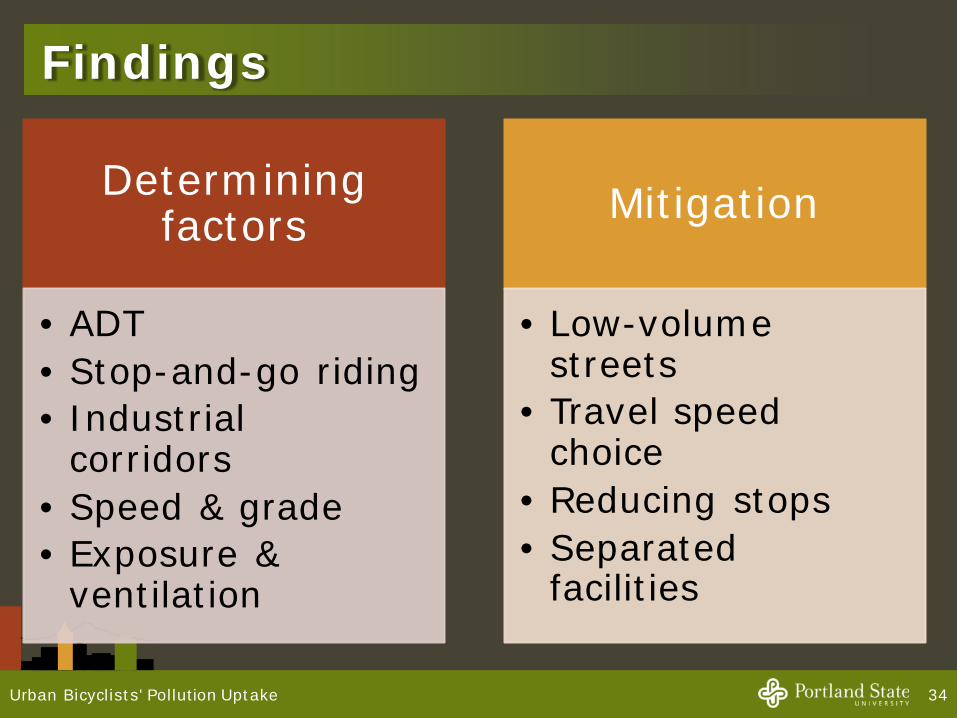
Findings
Determining factors
• ADT• Stop-and-go riding• Industrial
corridors• Speed & grade• Exposure &
ventilation
Mitigation
• Low-volume streets
• Travel speed choice
• Reducing stops• Separated
facilities
34Urban Bicyclists' Pollution Uptake
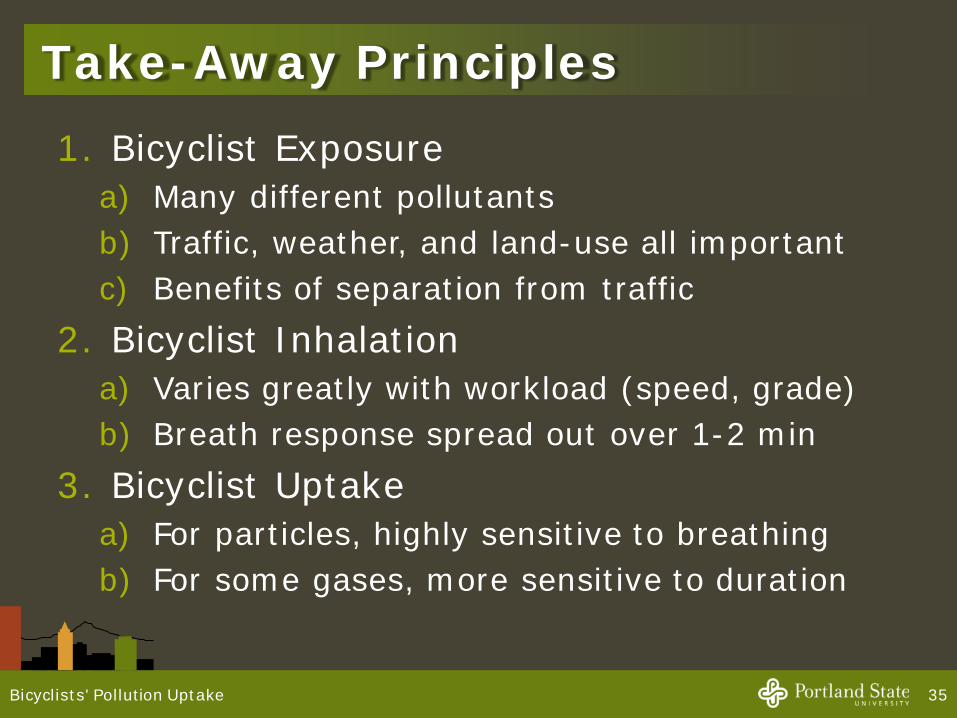
Take-Away Principles 1. Bicyclist Exposure
a) Many different pollutantsb) Traffic, weather, and land-use all important c) Benefits of separation from traffic
2. Bicyclist Inhalationa) Varies greatly with workload (speed, grade)b) Breath response spread out over 1-2 min
3. Bicyclist Uptakea) For particles, highly sensitive to breathingb) For some gases, more sensitive to duration
35Bicyclists' Pollution Uptake
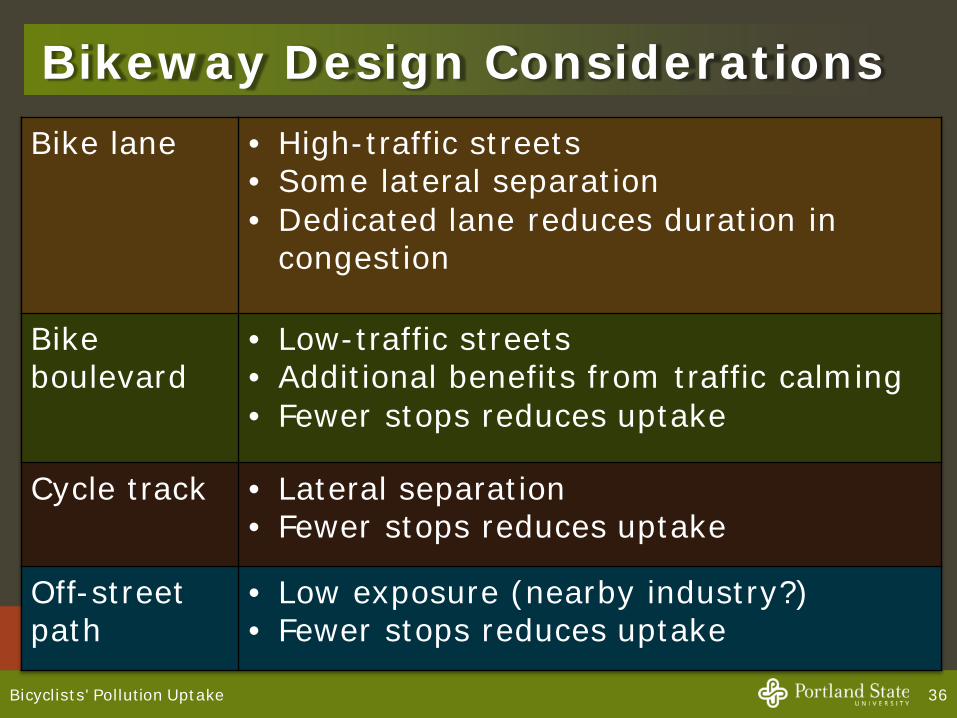
Bikeway Design ConsiderationsBike lane • High-traffic streets
• Some lateral separation• Dedicated lane reduces duration in
congestion
Bike boulevard
• Low-traffic streets• Additional benefits from traffic calming• Fewer stops reduces uptake
Cycle track • Lateral separation• Fewer stops reduces uptake
Off-street path
• Low exposure (nearby industry?)• Fewer stops reduces uptake
36Bicyclists' Pollution Uptake
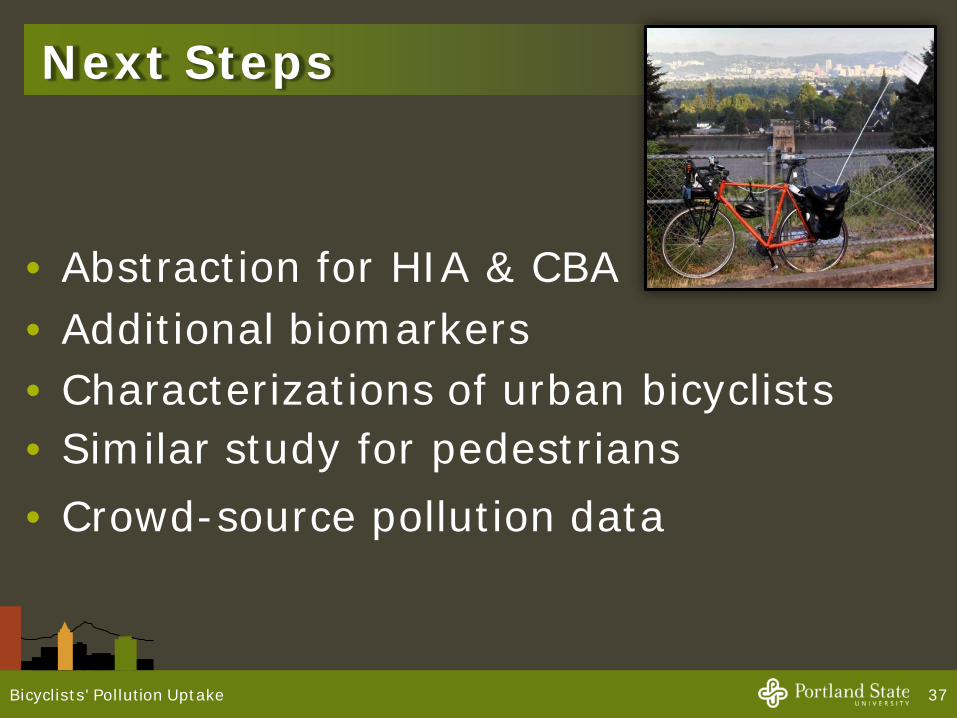
Next Steps
• Abstraction for HIA & CBA• Additional biomarkers • Characterizations of urban bicyclists • Similar study for pedestrians• Crowd-source pollution data
37Bicyclists' Pollution Uptake
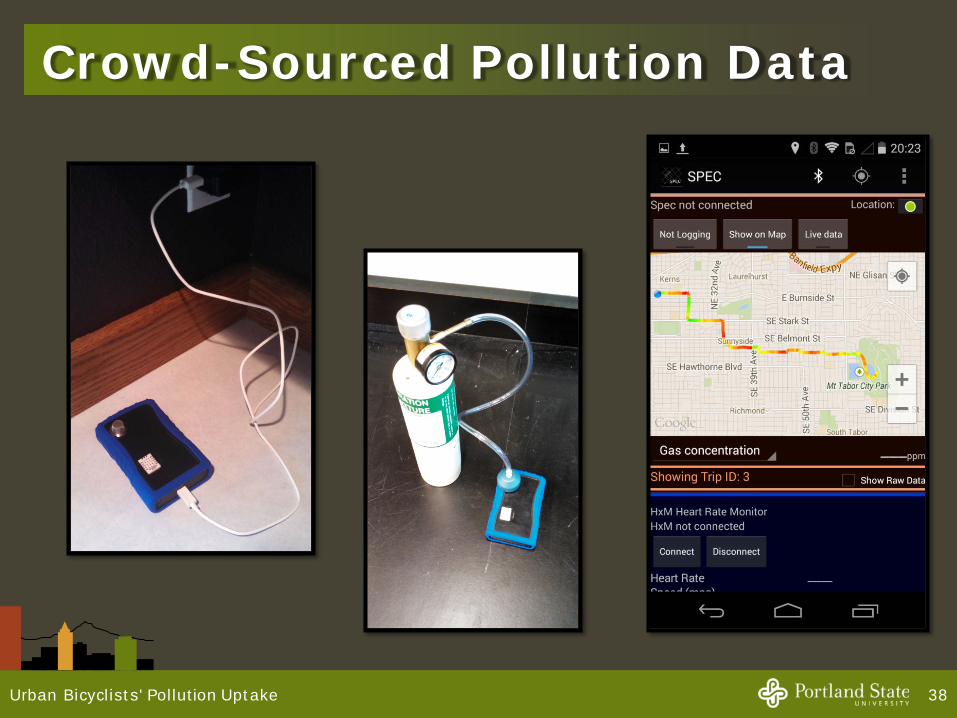
Crowd-Sourced Pollution Data
38Urban Bicyclists' Pollution Uptake
Questions?
39Bicyclists' Pollution Uptake
Acknowledgments• Dissertation committee: Miguel
Figliozzi, Jim Pankow, Robert Bertini, Jennifer Dill
• NITC research project with support from City of Portland and Metro
• NSF and OTREC fellowships

Bonus Slides!
40Bicyclists' Pollution Uptake
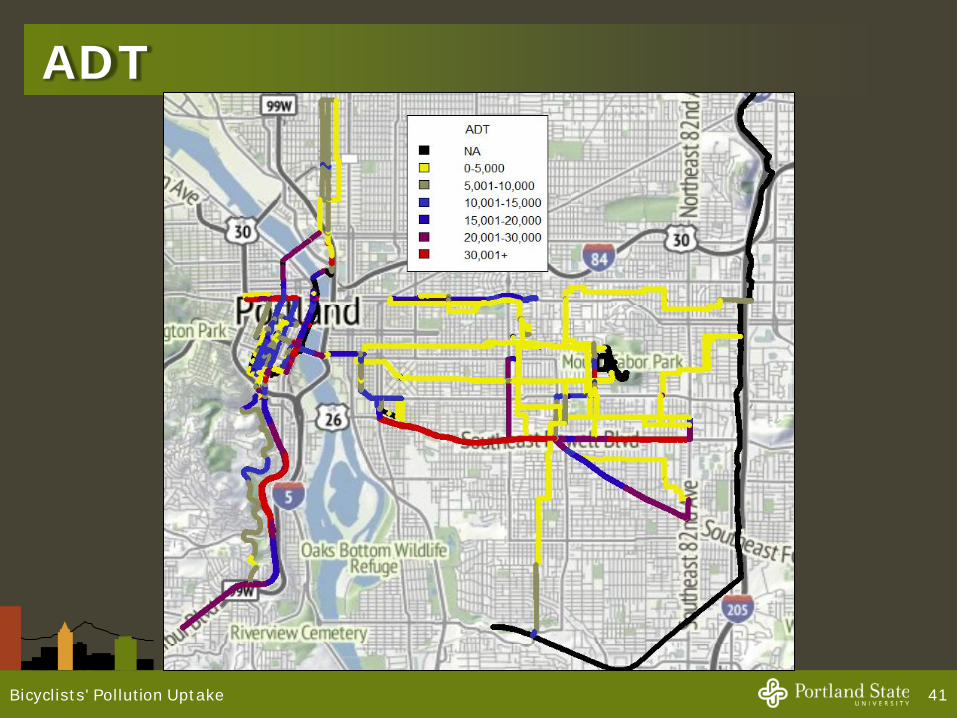
ADT
41Bicyclists' Pollution Uptake
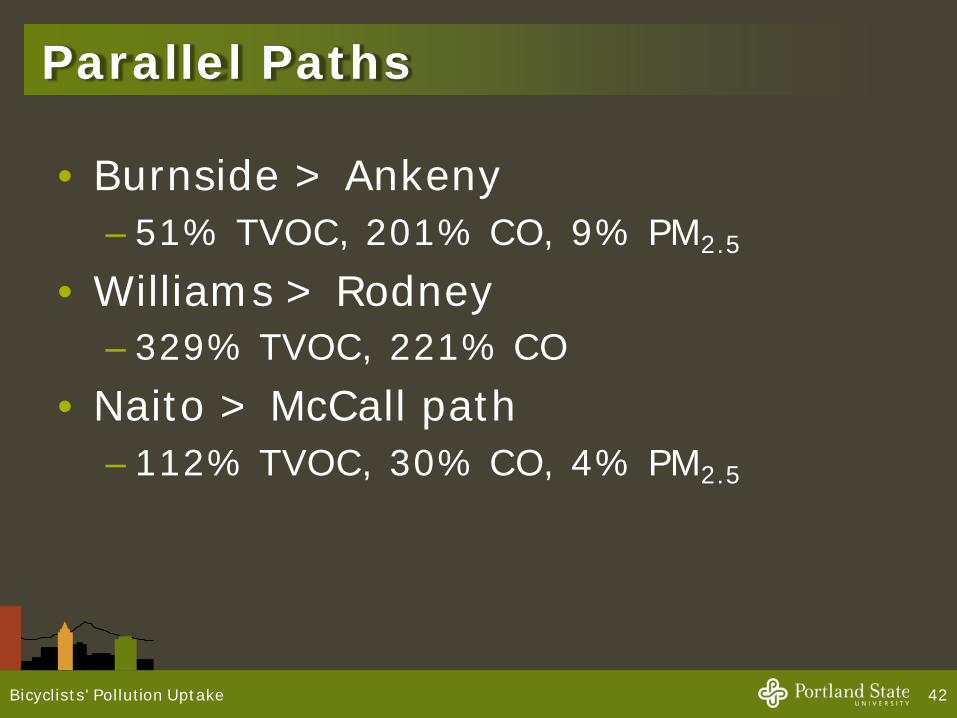
Parallel Paths
• Burnside > Ankeny– 51% TVOC, 201% CO, 9% PM2.5
• Williams > Rodney– 329% TVOC, 221% CO
• Naito > McCall path– 112% TVOC, 30% CO, 4% PM2.5
42Bicyclists' Pollution Uptake
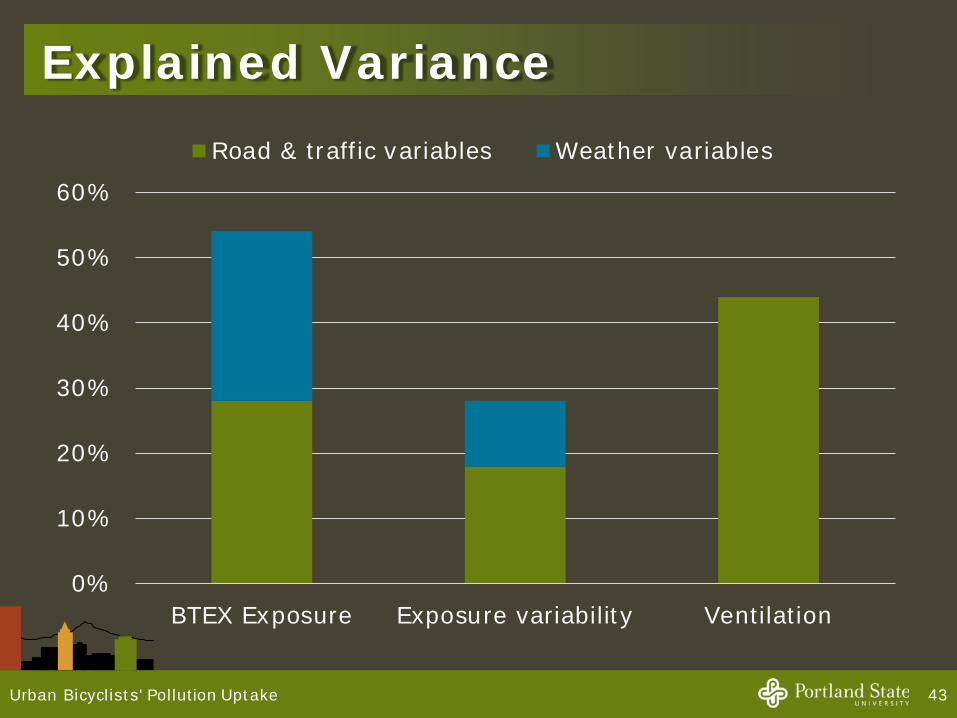
Explained Variance
43Urban Bicyclists' Pollution Uptake
0%
10%
20%
30%
40%
50%
60%
BTEX Exposure Exposure variability Ventilation
Road & traffic variables Weather variables
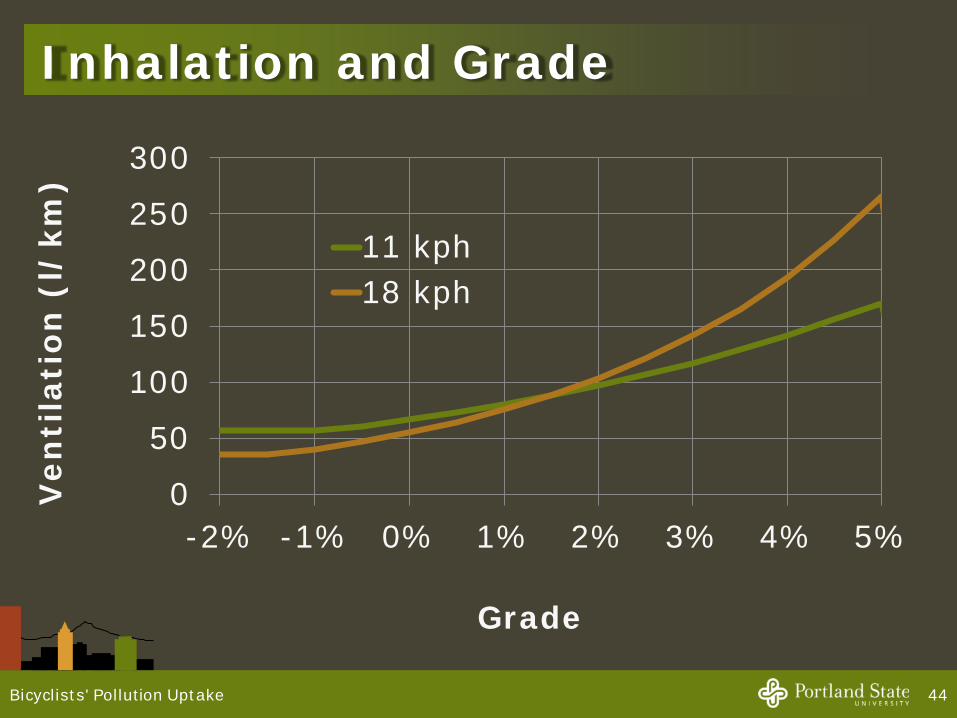
Inhalation and Grade
44Bicyclists' Pollution Uptake
0
50
100
150
200
250
300
-2% -1% 0% 1% 2% 3% 4% 5%
Ven
tila
tion
(l/
km)
Grade
11 kph18 kph

Minimum-ventilation envelope
45Urban Bicyclists' Pollution Uptake
0
5
10
15
20
25
30
0% 2% 4% 6% 8% 10%
Min
-ven
tila
tio
n v
enti
lati
on
(l
pm
)
Grade
Results: Uptake Models
• Elasticity of breath to exposure ~0.5– Δ Breath ~ ½ Δ Exposure– No significant difference by subject
• Ventilation effect small but significant for some compounds– Elasticity of 0.1-0.2
46Bicyclists' Pollution Uptake


