
Trends of Flow of Funds in the Indian Capital Market
Susanta Kumar DasMarch 2, 2017

Trends in Primary Market
Slide 2

Year Wise IPOs and amount mobilized through IPOs
Slide 3
0
20
40
60
80
100
120
0.00
1000.00
2000.00
3000.00
4000.00
5000.00
6000.00
2007-08 2008-09 2009-10 2010-11 2011-12 2012-13 2013-14 2014-15 2015-16 2016-17
No.
of
issue
s
US$
mill
ions
Year
Amount mobilised (US $ in millions) No. of Issues

Sector-Wise IPOs
Slide 4
28.8
4.2
14
00
0.4 0
52.6
2010-11Bank/Fis/Finance
Cement and construction
Power
Automobile
Airline
Healthcare andpharmaceuticalsRoads and Highways
Miscelleneous
32.6
0.3
3.613.65.2
7
5.4
32.3
2015-16Bank/Fis/Finance
Cement and construction
Power
Automobile
Airline
Healthcare and pharmaceuticals
Roads and Highways
Miscelleneous
54.10
2.650.005.24
0.00
9.020.00
28.99
2016-17 Bank/Fis/Finance
Cement and construction
Power
Automobile
Airline
Healthcare andpharmaceuticalsRoads and Highways
Miscelleneous
37.61
21.72
15.750
00.62 0
24.3
2007-08 Bank/Fis/Finance
Cement and construction
Power
Automobile
Airline
Healthcare andpharmaceuticals
Roads and Highways
Miscelleneous

Fresh Capital as % of Issue Amount
Slide 5
0
20
40
60
80
100
120
2005 2006 2007 2008 2009 2010 2011 2012 2013 2014 2015 2016

IPO in 2016-17- Features
First IPO by an Indian insurer; First IPO by an Indian Stock Exchange; First private sector bank IPO in a decade; IPO by small finance banks; IPO by India’s largest enzyme manufacturer ; Most of the IPOs are backed by private equity- money raised to
provide exit to existing investors; Strong participation by domestic institutional investors; Companies from newer sectors have raised capital ( manpower
consulting, medical diagnostic, coffee chain, beverage makers, etc.)
Slide 6

SME PLATFORM
Slide 7
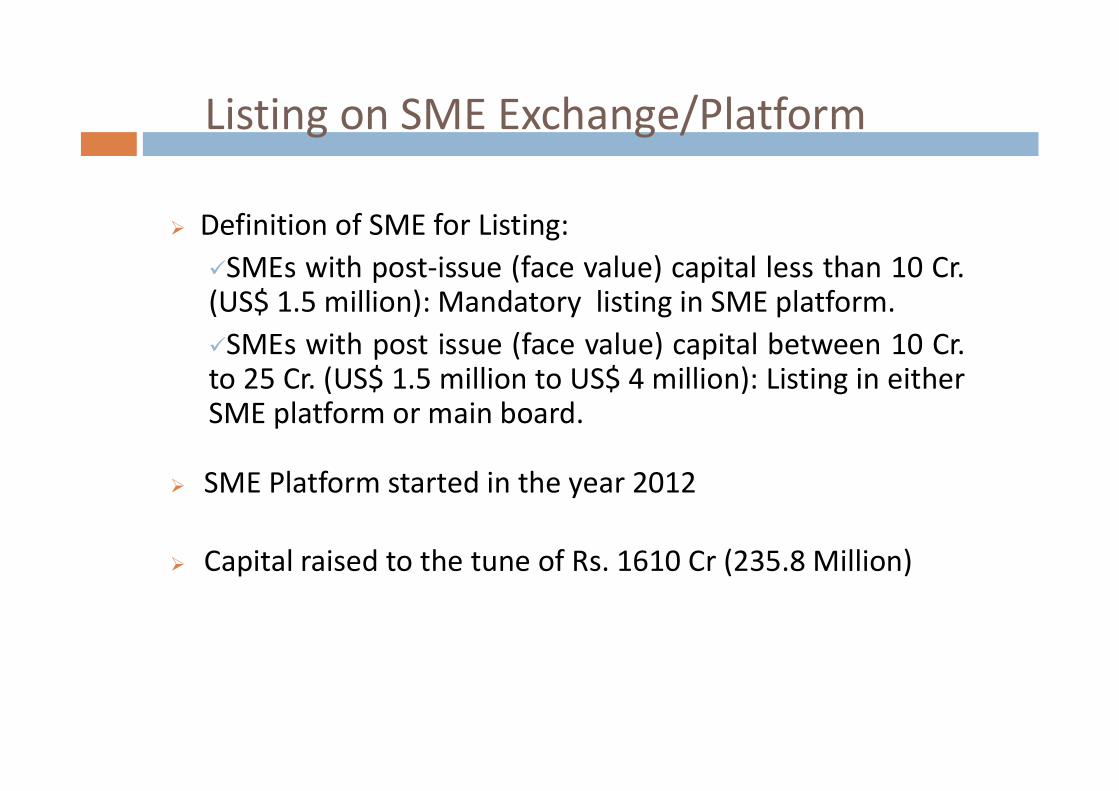
Listing on SME Exchange/Platform
Definition of SME for Listing:SMEs with post-issue (face value) capital less than 10 Cr.(US$ 1.5 million): Mandatory listing in SME platform.SMEs with post issue (face value) capital between 10 Cr.to 25 Cr. (US$ 1.5 million to US$ 4 million): Listing in eitherSME platform or main board.
SME Platform started in the year 2012
Capital raised to the tune of Rs. 1610 Cr (235.8 Million)

Features of SME
Filing and vetting of SME issue (public issue and right issue)with SEs, rather than SEBI.
Retail investors are ring fenced: minimum market lot of Rs. 1lakh (US$ 1600)
Minimum allottees at 50 (1000 in a normal IPO)
Less stringent continuous listing requirements- Periodicsubmissions can be half yearly instead of quarterly
100% Underwriting by Merchant bankers;
Abridged annual reports- Exemption from publishing financialresults (can make it available in their websites)

Listing and Fund Raising On SME Platform
Slide 10
1
19
39 37
46
58
1.32
27.72
53.55
40.545.39
76.73
2011-12 2012-13 2013-14 2014-15 2015-16 2016-17
No of Companies Listed Fund Raised (In Million USD)

Sector Wise Listed SME Companies
Slide 11
Manufacturing, 39%
Trading, 15%
Agro, 4%
NBFC , 15%
Realty, 6%
Service , 21%

Trends in SME IPO-2016-17
Cost of listing is significantly less compared to main board;
Less time to list;
Initial investors appear to be individuals who are from the same region as that of the company;
Early signs of participation by Institutional investors.
Slide 12
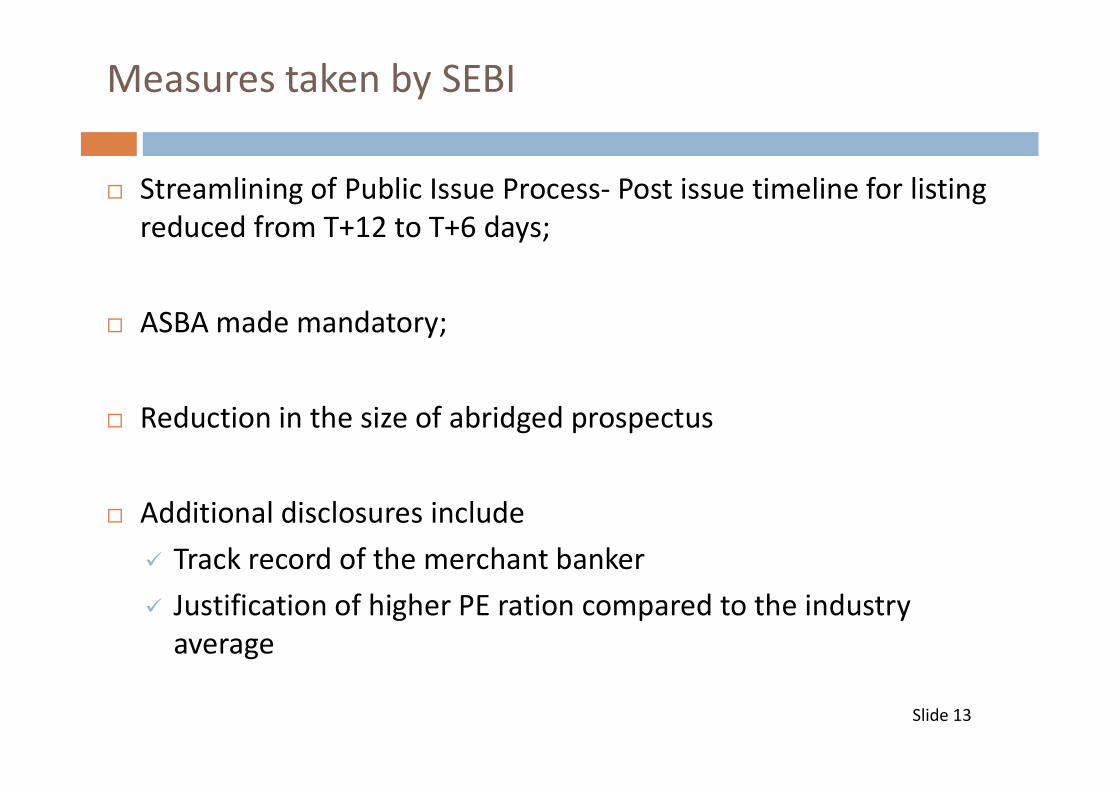
Measures taken by SEBI
Streamlining of Public Issue Process- Post issue timeline for listing reduced from T+12 to T+6 days;
ASBA made mandatory;
Reduction in the size of abridged prospectus
Additional disclosures include Track record of the merchant banker Justification of higher PE ration compared to the industry
average
Slide 13
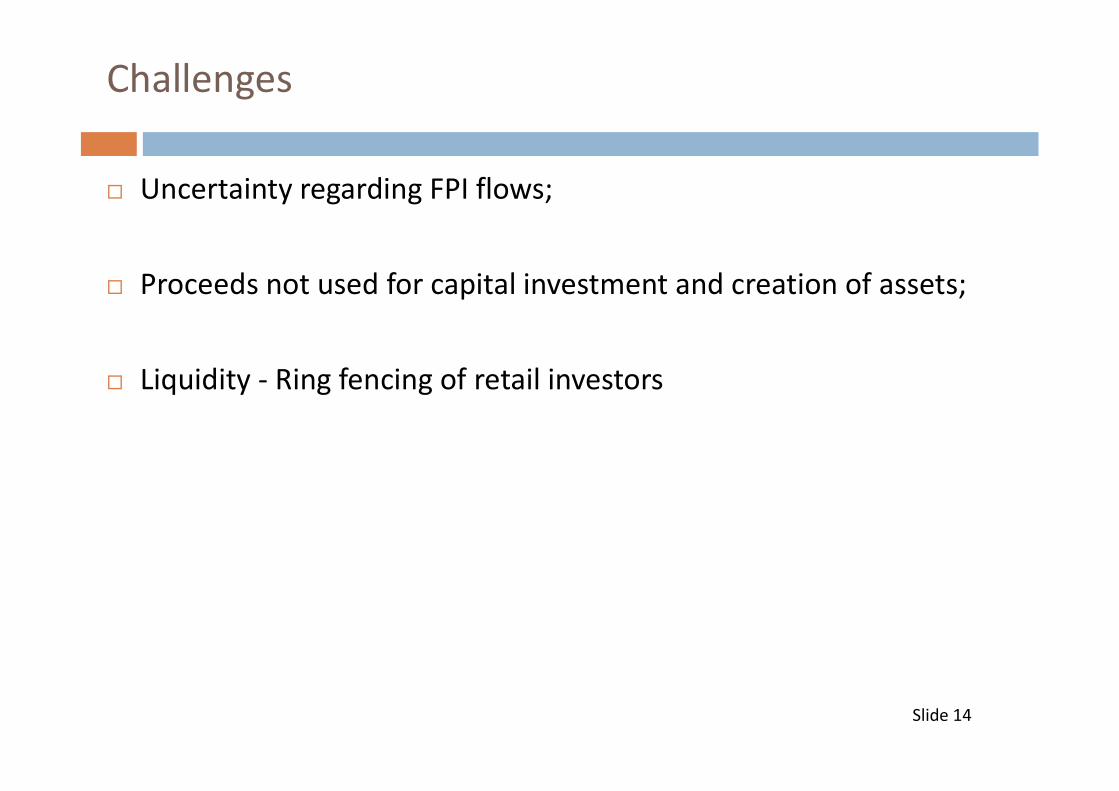
Challenges
Uncertainty regarding FPI flows;
Proceeds not used for capital investment and creation of assets;
Liquidity - Ring fencing of retail investors
Slide 14

Foreign Portfolio Investors (FPIs)
Slide 15
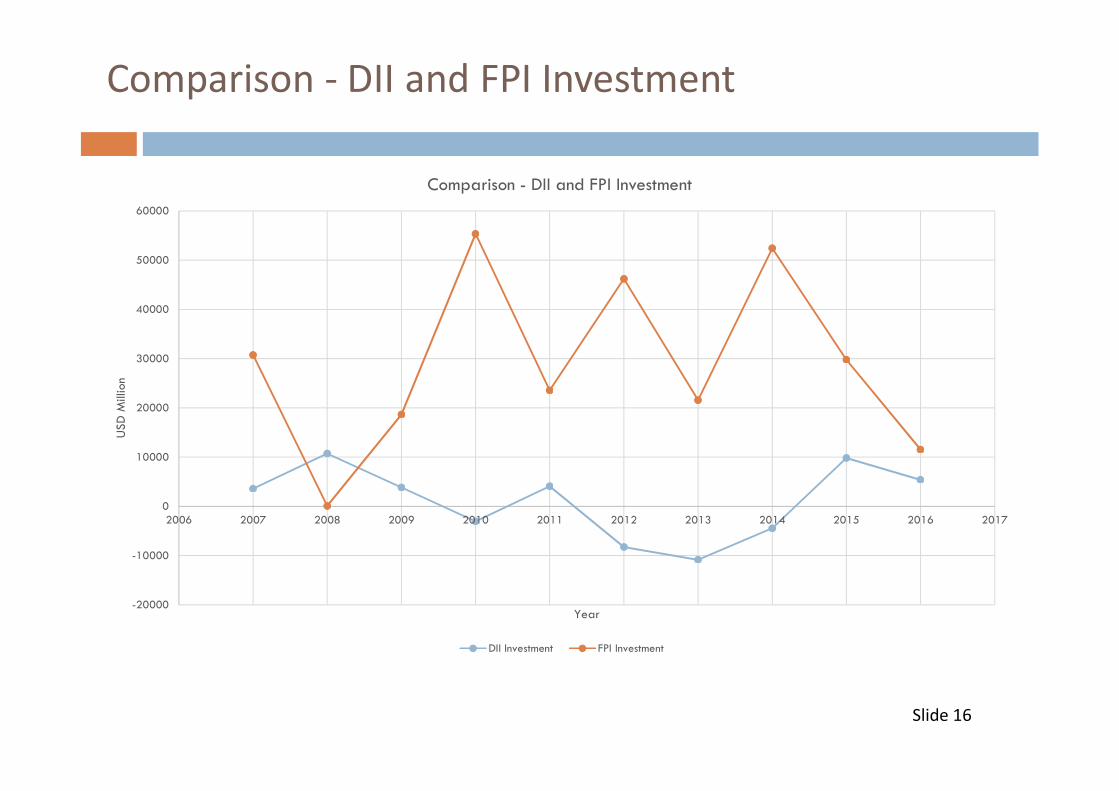
Comparison - DII and FPI Investment
Slide 16
-20000
-10000
0
10000
20000
30000
40000
50000
60000
2006 2007 2008 2009 2010 2011 2012 2013 2014 2015 2016 2017
USD
Mill
ion
Year
Comparison - DII and FPI Investment
DII Investment FPI Investment

FPI Net Investment – Equity & Debt
Slide 17
-7000
-6000
-5000
-4000
-3000
-2000
-1000
0
1000
2000
3000
4000
Jan Feb March April May June July Aug Sept Oct Nov Dec
in U
SD M
illio
n
Year
FPI Net Investment
Equity Debt Total
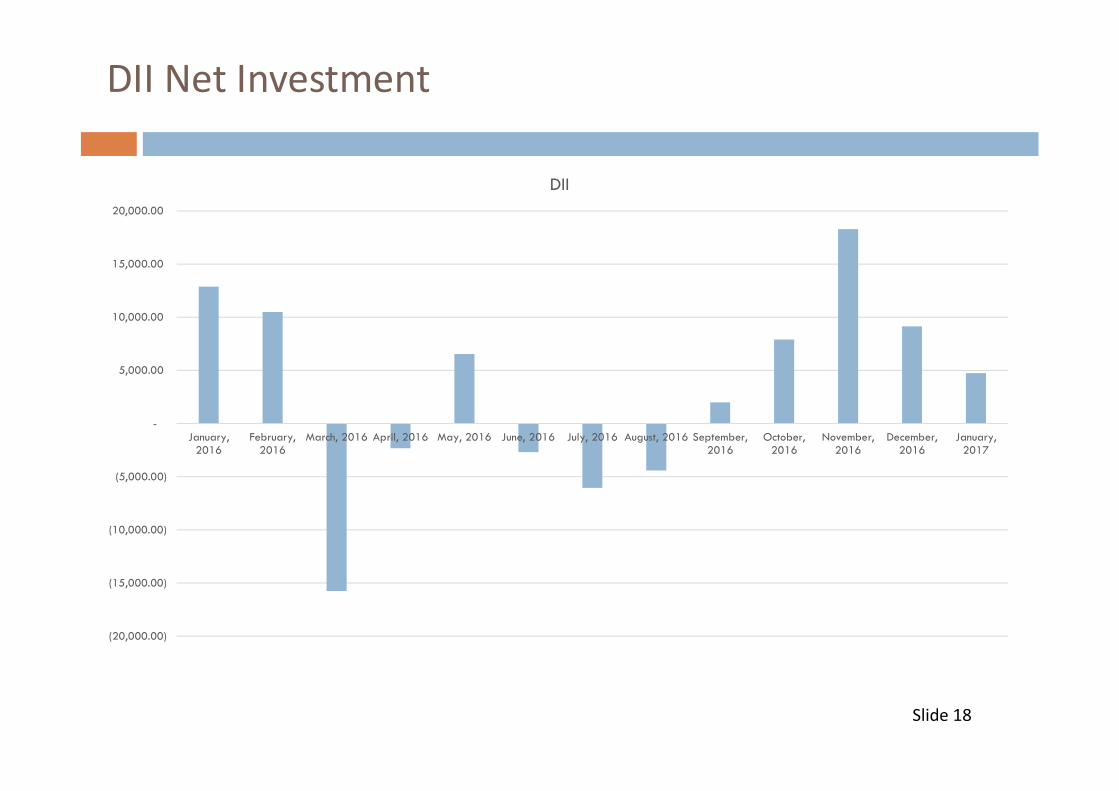
DII Net Investment
Slide 18
(20,000.00)
(15,000.00)
(10,000.00)
(5,000.00)
-
5,000.00
10,000.00
15,000.00
20,000.00
January,2016
February,2016
March, 2016 April, 2016 May, 2016 June, 2016 July, 2016 August, 2016 September,2016
October,2016
November,2016
December,2016
January,2017
DII
Mutual Funds (MFs)
Slide 19

Resource mobilization by Mutual Funds (in USD million)
Slide 20
0
50000
100000
150000
200000
250000
300000
2013-14 2014-15 2015-16 2016-17 (Till Dec )
Am
ount
in U
SD m
illio
n
Year
Resource mobilization by Mutual Funds (in USD million)
Net Flow AUM
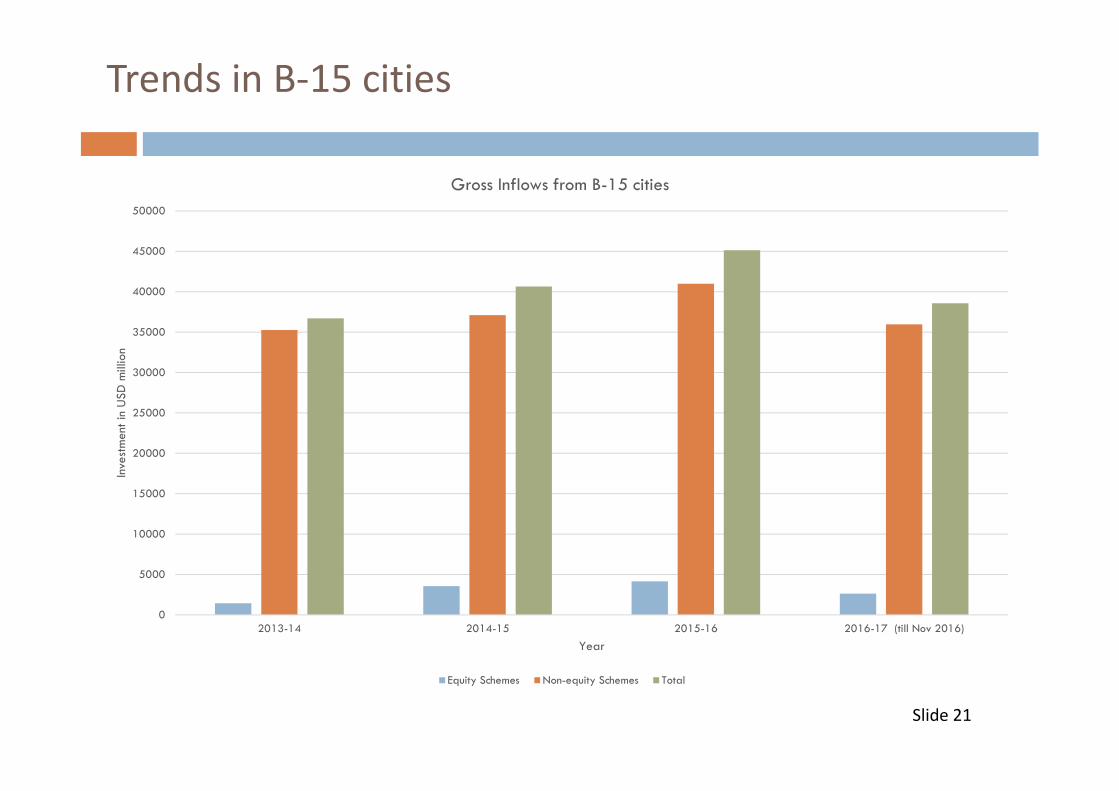
Trends in B-15 cities
Slide 21
0
5000
10000
15000
20000
25000
30000
35000
40000
45000
50000
2013-14 2014-15 2015-16 2016-17 (till Nov 2016)
Inve
stm
ent i
n U
SD m
illio
n
Year
Gross Inflows from B-15 cities
Equity Schemes Non-equity Schemes Total

Trends in mutual fund inflows
B 15 incentives to increase penetration No entry Load – Exit Load ploughed back to scheme Mutual Fund SIPs accounts crossed 10 million mark- Currently
about 12.3 million accounts MF industry has been adding about 619000 SIP accounts each
month Average SIP size is around USD 48
Slide 22
Thank you


