
Tr iangle House ///
A New Way to Stay // Concept Design Book
03.2013 /// TRACHTENBERG LLC

The Concept /// Past + Present + Future
The Triangle House Resort & Spa is a luxury, full service “inner-suburban” resort and conference center, with an emphasis on world-class facilities and service made comfortable with some south-ern hospitality. The project is an architectural, technological, and ecological showpiece for the “New North Carolina” which is building its reputation from the RDU/Triangle area, based of world-class universities, research and industry, mild seasonal weather, and a quality of life paralleled by very few places in the country.
The Triangle House Resort & Spa will have a focus on hosting small to medium sized university and corporate meetings and conferences. We will capitalize on the triangle’s geography and ex-istent conference business and area attractions by providing the areas only world-class banquet and meeting spaces with conference focused facilities and guest-facing technologies. The Tri-angle House will continue the areas rich traditions of producing and showcasing world-class and local talent in the event lounge space.
The hotel will tell this rich history through art, and help create new chapters with Artist-in- residen-cy programs and providing a venue for the creation and expression for the wealth of talent in our area.
The areas legendary universities and athletic programs will be steady drivers of business, includ-ing conferences, graduations, game-days, and other events. Banquet facilities, performance lounge, spa, retail and bar will also bring steady visibility, traffic, and revenue. The hotel will of-fer memberships to the private social club, which provides access to the wine bar and rooftop lounge, fitness facilities, preferential considerations for restaurant reservations, event tickets, facili-ties access, and discounts on hotel rooms.
Designed by world-class architects and expertly appointed, Triangle House blends world-class hospitality with a collection of exquisite condominium residences located in the heart of the RTP area. Residents will enjoy access to Triangle House’s superlative services and offerings in addi-tion to an array of enviable building amenities. The Residences at Triangle House represents the ultimate in
03.2013 /// TRACHTENBERG LLC

The Concept /// Past + Present + Future
The property will be a hospitable and conducive environment for gathering, celebrating, work-ing, creating, and relaxation, with a staff that exudes sincere hospitality and professionalism, without the stuffiness.
The property will carry a mystique and demand reminiscent of what the Morgan Hotels had when they first opened. Where people wanted to stay there because it was the place to be in that area, where you experienced the newest trends, and you never know who would also be-ing staying there. With a spa, pool, fantastic restaurants, rooftop and lobby bars, and the hot-test club and live music venue in the area, a guest has no reason to leave the property. We will create this experience, and enable the guests to take some of the it with them, with our “Take it with You” program, which allows the guests to purchase anything they experienced at the hotel (bed, sheets, furniture, TV, food, art, etc).
Additional property amenities will include a library to access and showcase research and the pursuit of knowledge. A place for people to study, work, and research, utilizing mobile kiosks linked to university libraries, with printing, creation, and business center facilities available.
03.2013 /// TRACHTENBERG LLC

Team //
03.2013 /// TRACHTENBERG LLC

Scott Bednaz is a commercial broker and developer with 19 years experience in North and South Carolina. As President of TerraCorp Commercial properties and Tallus Development group Mr. Bednaz has negotiated the purchase, sale, or lease of 1 million square feet of commercial space, 3,500 acres of land resulting in $100 million in completed transactions. In 2005 he branched out from representation to develop his own projects including Advanced Auto, Hooters Burlington, The Estates at Barton’s Creek, and the Straw Valley Project. His projects have been recognized by multiple news and architectural outlets and received awards from the NC and Durham Preservation Societies.
Isaac Brown has been Director of Emerging Markets for Choice HotelsInternational for the past 9 years and has worked with Marriott developing over 60 properties. Prior to his cur-rent position, he was Architectural Designer, where he was responsible for prototype design for all Choice brands, and design reviews which
Mr. Brown will be
these brands. In addition he has been responsible for almost a half a billion dollars worth of revenue during his tenure working in development at Choice International.leaving Choice durring 2013 in his full-time capacity, and is currently in the early stages of developing four other properties where he is majority principal in the project. Mr. Brownhas a masters degree in architecture from Louisiana State Universityand a MBA from New York University. Mr. Brown is a New York City native and will lead the development team for the project.
Cedric H Watkins is a technologist and founder of a technology compa-ny providing solutions for the hospi-tality industry, Adjacent Innovations. Mr. Watkins is a seasoned business development and marketing execu-tive who has founded marketing and technology companies and has done development projects in Raleigh and Newark, New Jersey.
After attending UNC-Chapel Hill where he studied Management andSociology, Mr. Watkins has lived in Manhattan and Miami for the last12 years where he has developed a
real estate, hospitality, design, tech-nology, and entertainment. Mr.Watkins will be project coordinator, lead business development, andserve as technology and guest expe-rience architect.
Jordan Trachtenberg Assoc. AIA, LEED AP has practiced architecture
-nents ranging from Asia to South America. During 2009-2012 in Am-sterdam, NL, while practicing under Ben van Berkel at UNStudio, Jordan led the design and execution as Coordinating Architect /Project Man-ager on several successful projects such as the Singapore University
-ish completion in 2014. In addition, Jordan led the design on successful competitions, small built projects, in-terior, and industrial design solutions, such as the Library + Center for New
-ship store in Rome, Italy and the 29th Annual Art Biennale’s Youturn Pavil-ion in Sao Paulo, Brazil.
Jordan received the degree Master of Architecture, with Honors in De-sign, from Columbia University, NY, and holds a Bachelor of Design in Architecture, with Honors, from Flori-da International University, Miami.
Michael Sims, Jr. is an architectural design professional now living and working in Europe. He has over 10 years professional experience in
-combe), Coop-Himmelblau (Wolf-gang Prix), Frank Gehry Associates, SOM (NY), UN Studio (Ben van Berkel), and co-taught workshops with Lebbeus Woods.
As a proponent of BIM and paramet-ric design processes, Mr. Sims has
projects including Manhattan’s tallest residential tower, Frank Gehry’s new 8 Spruce Street tower, the King of Morocco’s current theatre project, and the UN Studio in Amsterdam. He earned his Masters of Architec-ture from SCI-ARC, and a Bachelor of Architecture from the University of North Carolina at Charlotte. Mr. Sims has taught digital design at AIU (American Intercontinental Univer-sity) in Los Angeles, and was an SOM instructor in an applied studies research collaboration with SCI-Arc, investigating concepts related to responsive kinetic façades. He is now with Zaha Hadid Architects in London.
Team ///
03.2013 /// TRACHTENBERG LLC

Team /// Jordan Trachtenberg // Architecture Projects Sample Work
www.jordantrachtenberg.com
Pavilion / Sao Paulo, Brazil University / NYC, New York University / NYC, New York
Hotel / Philidelphia, PA Library / Ghent, Belgium
Library / Ghent, Belgium
University / Singapore
University / Singapore Performing Art Center / S. Korea Performing Art Center / S. Korea
Office Park / South Korea
Pavilion / Sao Paulo, Brazil
03.2013 /// TRACHTENBERG LLC

Team /// Michael Sims /// Architecture Projects
Residential Tower / NYC, NY
Residential Tower / NYC, NY
Mixed Use / ChinaTower / Abu Dhabi
Tower / Abu DhabiSymphony Center / Miami, Florida
Theater / Morocco
Symphony Center
Symphony Center
Commercial Tower / NYC, NY
Commercial Tower / NYC, NY
Sample Work
03.2013 /// TRACHTENBERG LLC

Design Model / /
03.2013 /// TRACHTENBERG LLC

Organization /// Event as an Integrated Concept
EventSpace
Auditorium
Restaurant
Pool + Deck
EventSpace
Bed
Bath
EventSpace
Eventspace
Bath
Bath
Bed
Bed
Lounge
Back o�ces
Stage
Logistics
Kitchen
Lounge +Bar
Parking
Lounge
Lounge
Relations
publicprimary
secondary
tertiary
semi-public
not publicDouble Quarters
Loft Quarters
Single Quarters
21
EventSpace
Auditorium
Restaurant
Pool + Deck
EventSpace
Bed
Bath
EventSpace
Eventspace
Bath
Bath
Bed
Bed
Lounge
Back o�ces
Stage
Logistics
Kitchen
Lounge +Bar
Parking
Lounge
Lounge
Relations
publicprimary
secondary
tertiary
semi-public
not publicDouble Quarters
Loft Quarters
Single Quarters
21
The Event Space becomes the central nucleus to the program. All spaces are in-terwoven and interdependent. The circula-tion around the event spaces are a direct connection between the different clusters. The secondary route, within each cluster, leads each visitor through the experience.
The functional diagram shows the various user levels magnified to best visualize and represent each relationship. It fulfills the event space as a crucial link, as well as an element that binds together the differ-ent spaces of the hotel.The relationship between the Event Spac-es and the surrounding clusters creates various degrees of public / dynamic (cen-tral event space, Lounges, Restaurants) to private / introvert (quiet lounges, quar-ters.)
The shared Lounge/event spaces in turn form the internal link between the clusters of Quarters, and provide a smooth transi-tion through the main event spaces. This seamless interweaving of function and circulation also creates various spatial experiences of open spaces, to intimate enclosed areas, and excites the visitors to discover and participate in the new way to stay.
03.2013 /// TRACHTENBERG LLC

Design Strategies ///
Vertical Landscape - Minimum Site Coverage - Iconic
Urban Social Landscape - Max Site Coverage
Vertical to LateralOur design philosophy is flexible in its concept. Depending on each site in context we adapt the design model to both vertical and horizontal typologies. This promotes a true understanding of our site, its surroundings, and how to best integrate the design model.
03.2013 /// TRACHTENBERG LLC

Organization /// Design Model //
INPUT | Basic Program 100 units50 Single30 Doubble10 Suites6 Condos 2500 SQ feet of Event Space
01 Program 02 Placement 03 Design model 04 Site Specific adapta-tion
SIte Placement and Typical Organization- Maintains program requirements - Approach does not promote program intergration
Adaptable Model | Pulling of floor plates- Pulling out frees up internal space for events- Creates a central organizational atrium - Maintains program requirements while promoting program integration- Landscape connectivity from inside out
Site Specific | Straw valleyApplying to the Site and making small adjustments adapts the Design model to its most ideal site to shape relationship.
03.2013 /// TRACHTENBERG LLC

Organization /// Site Model //
UNC/Duke/DPAC - 6mi.Research Triangle Park - 11 miRDU Airport - 16 mi.Raleigh/NC State/PNC Center - 20 mi.
Northwest View
North West
Exisitng Straw valley CafeProposed Triangle House Resort and Spa
03.2013 /// TRACHTENBERG LLC
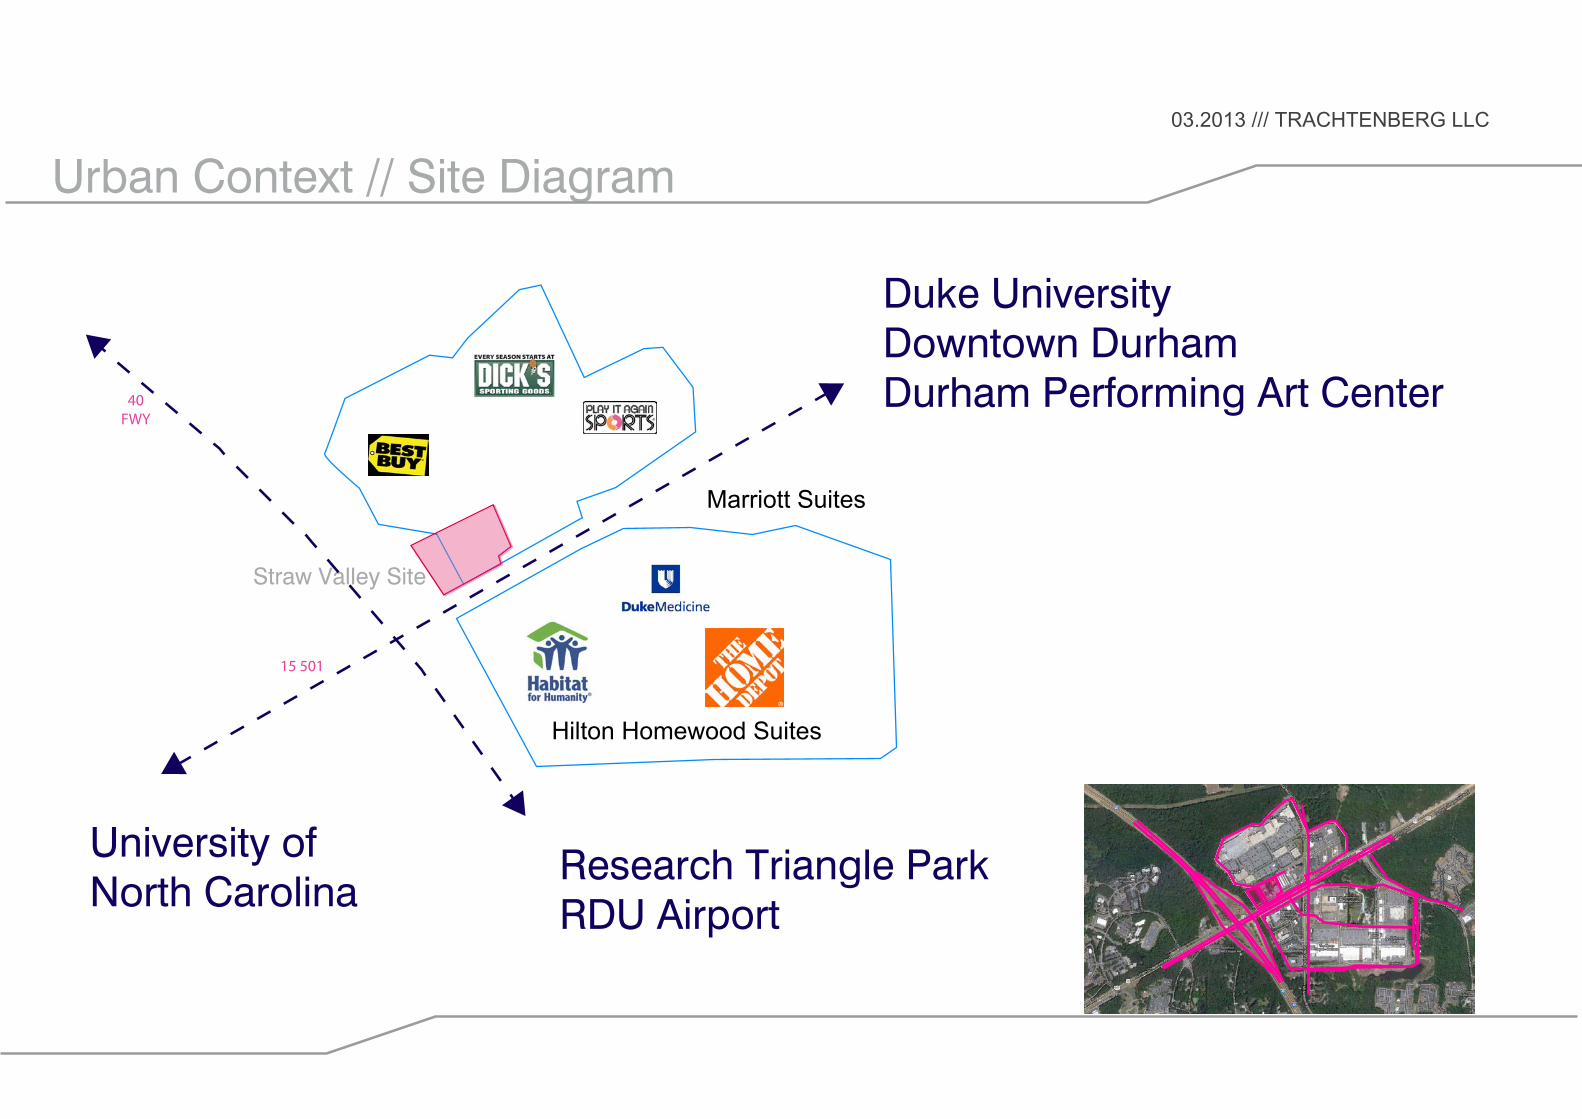
Urban Context // Site Diagram
Straw Valley Site
40FWY
Marriott Suites
Hilton Homewood Suites
15 501
University ofNorth Carolina
Duke University Downtown DurhamDurham Performing Art Center
Research Triangle ParkRDU Airport
03.2013 /// TRACHTENBERG LLC

Principles /// Sketch // Atrium Space Ground Level
03.2013 /// TRACHTENBERG LLC

Principles /// Sketch // Atrium Space Pool Level
03.2013 /// TRACHTENBERG LLC
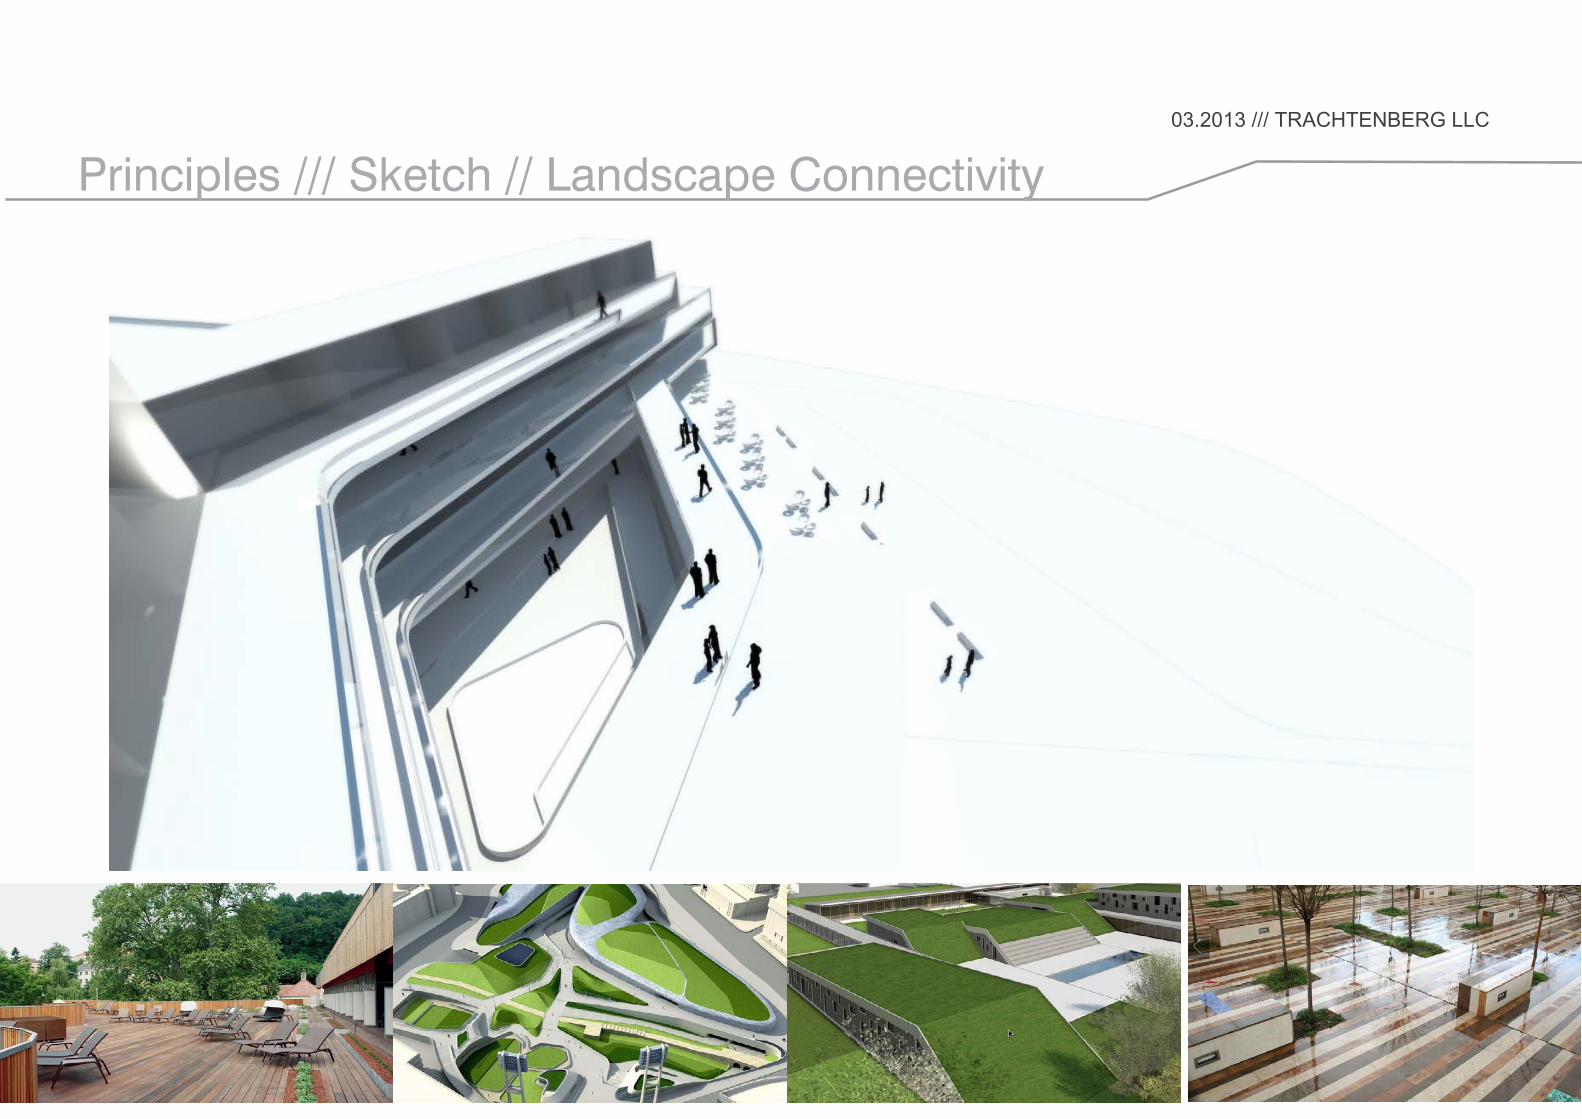
Principles /// Sketch // Landscape Connectivity
03.2013 /// TRACHTENBERG LLC
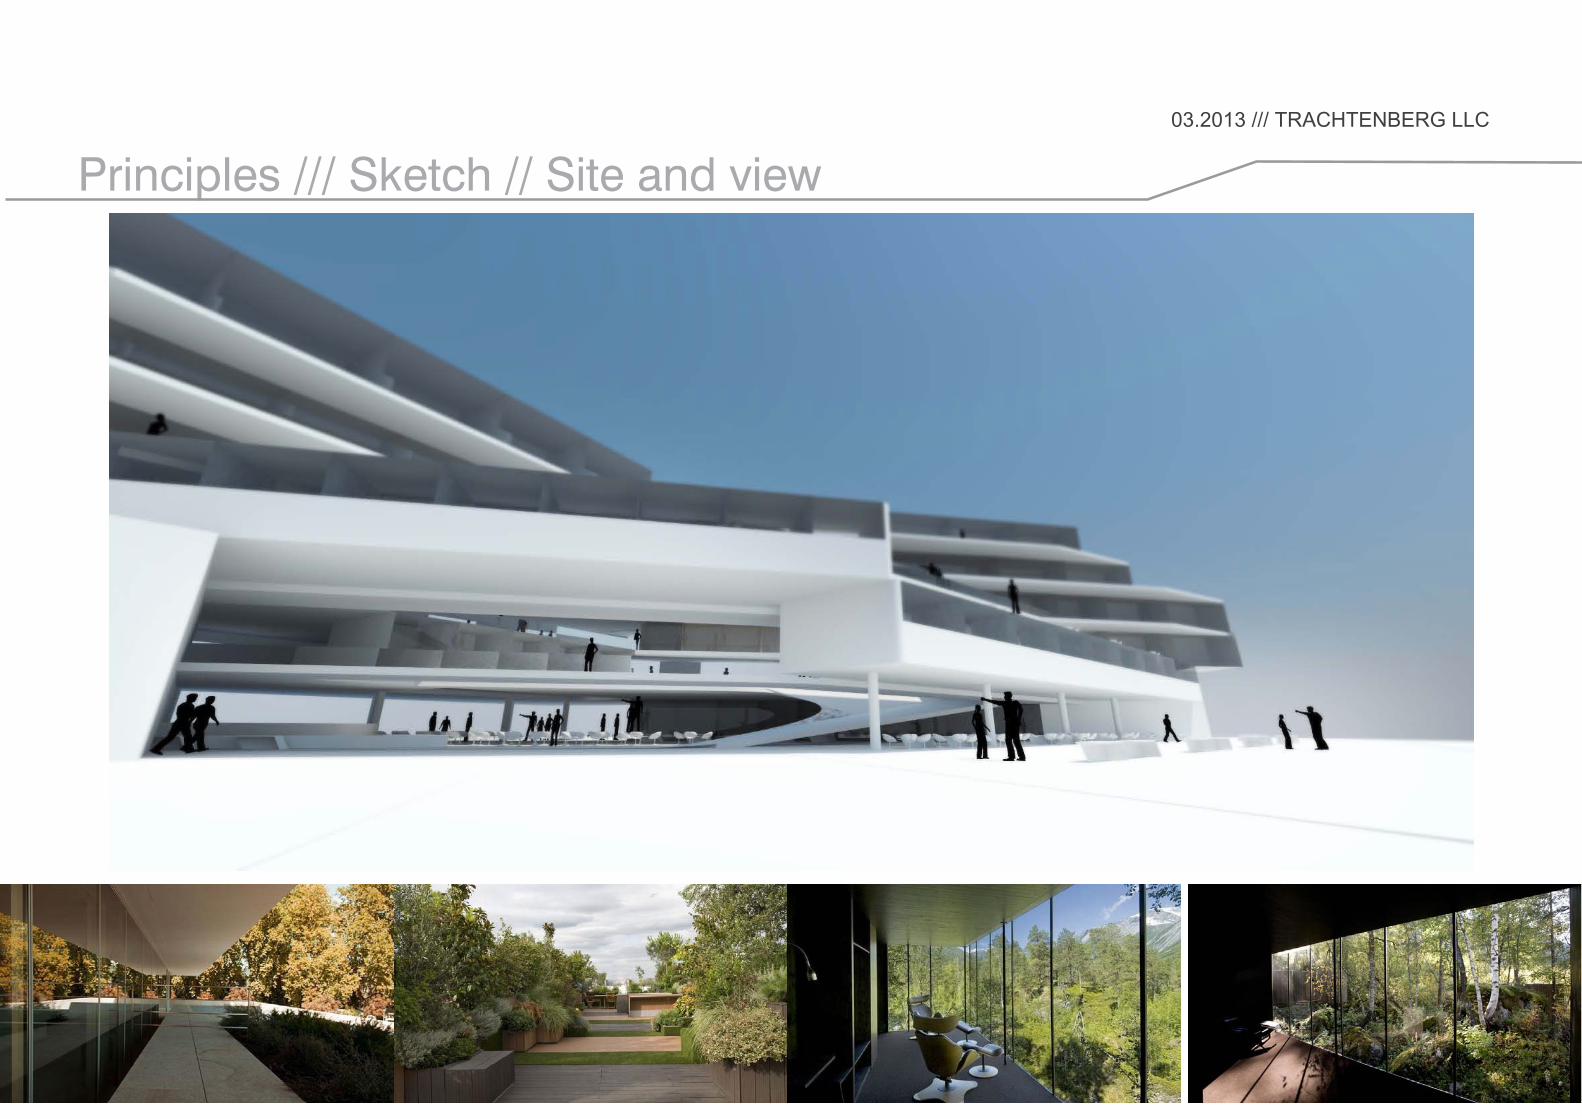
Principles /// Sketch // Site and view
03.2013 /// TRACHTENBERG LLC
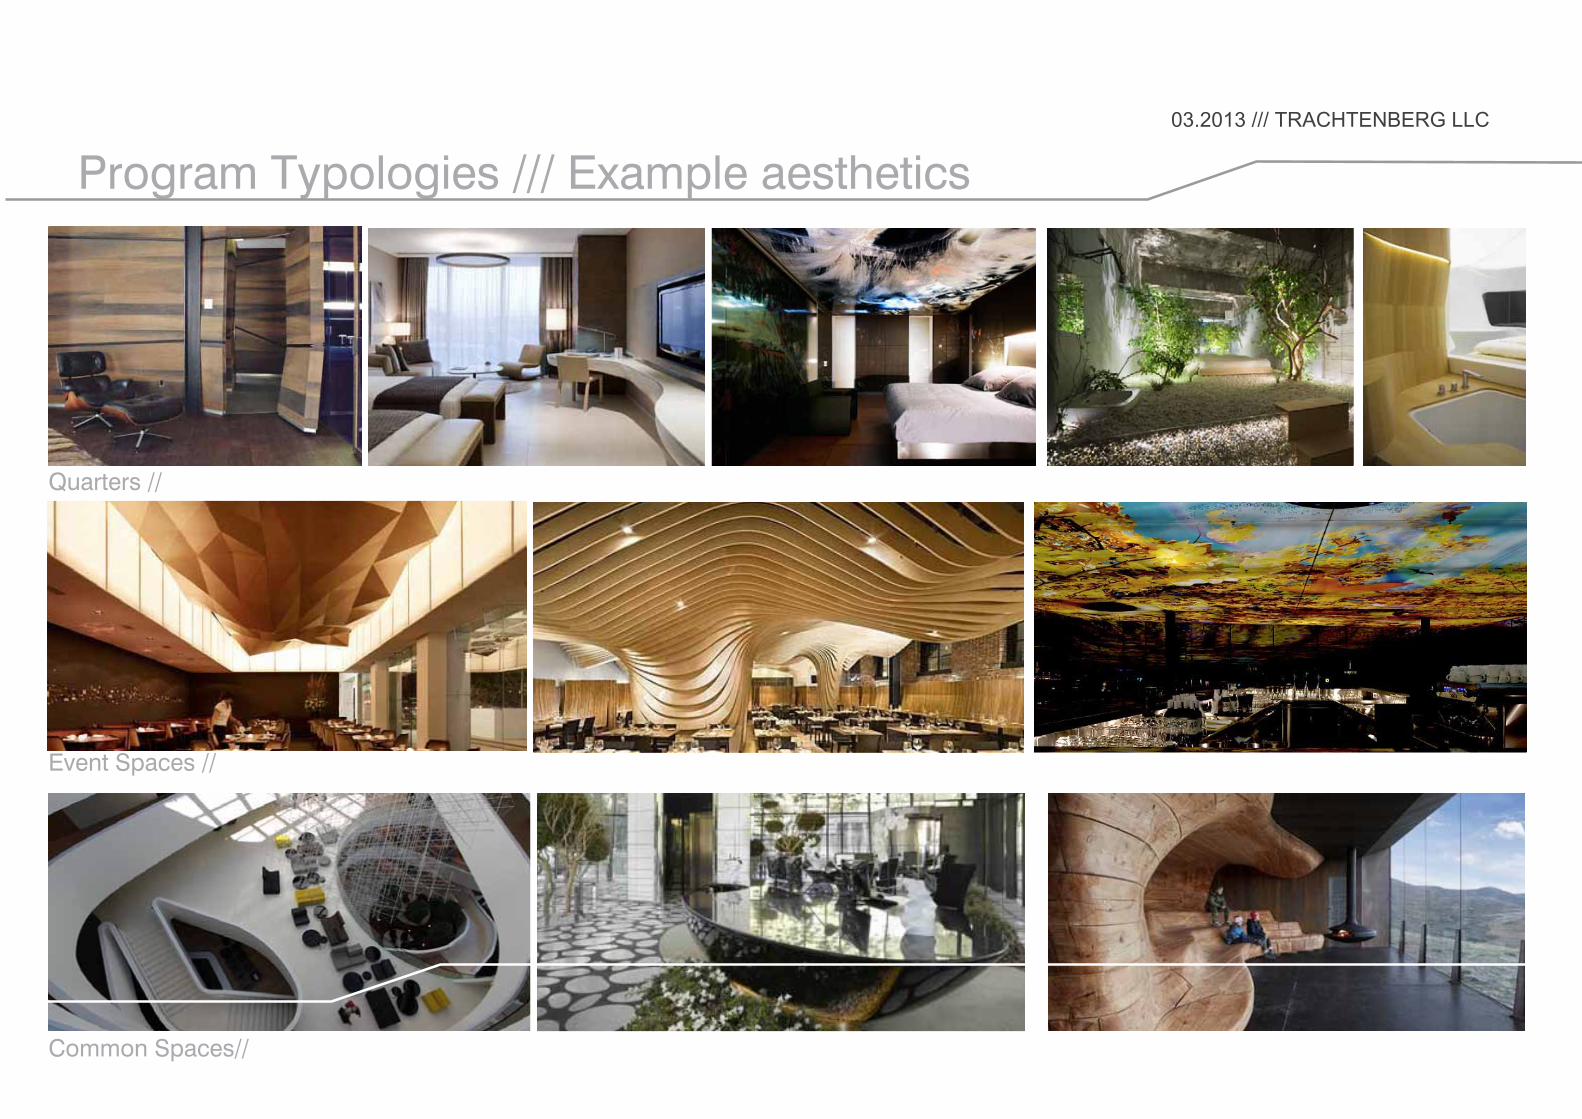
Program Typologies /// Example aesthetics
Quarters //
Event Spaces //
Common Spaces//
03.2013 /// TRACHTENBERG LLC

Referenced ///
03.2013 /// TRACHTENBERG LLC

Details /// Technology + Space + FunctionalityEach square foot is thought about in detail. How to maximize interactivity, comfort and usability
03.2013 /// TRACHTENBERG LLC

Details /// Finishes, Materials, Texture, LightingCrisp and simple details will allow the design to maintain a cost effective background and elegant foreground. // Crisp, sharp, elegant, defining,
03.2013 /// TRACHTENBERG LLC

Financials / /
03.2013 /// TRACHTENBERG LLC
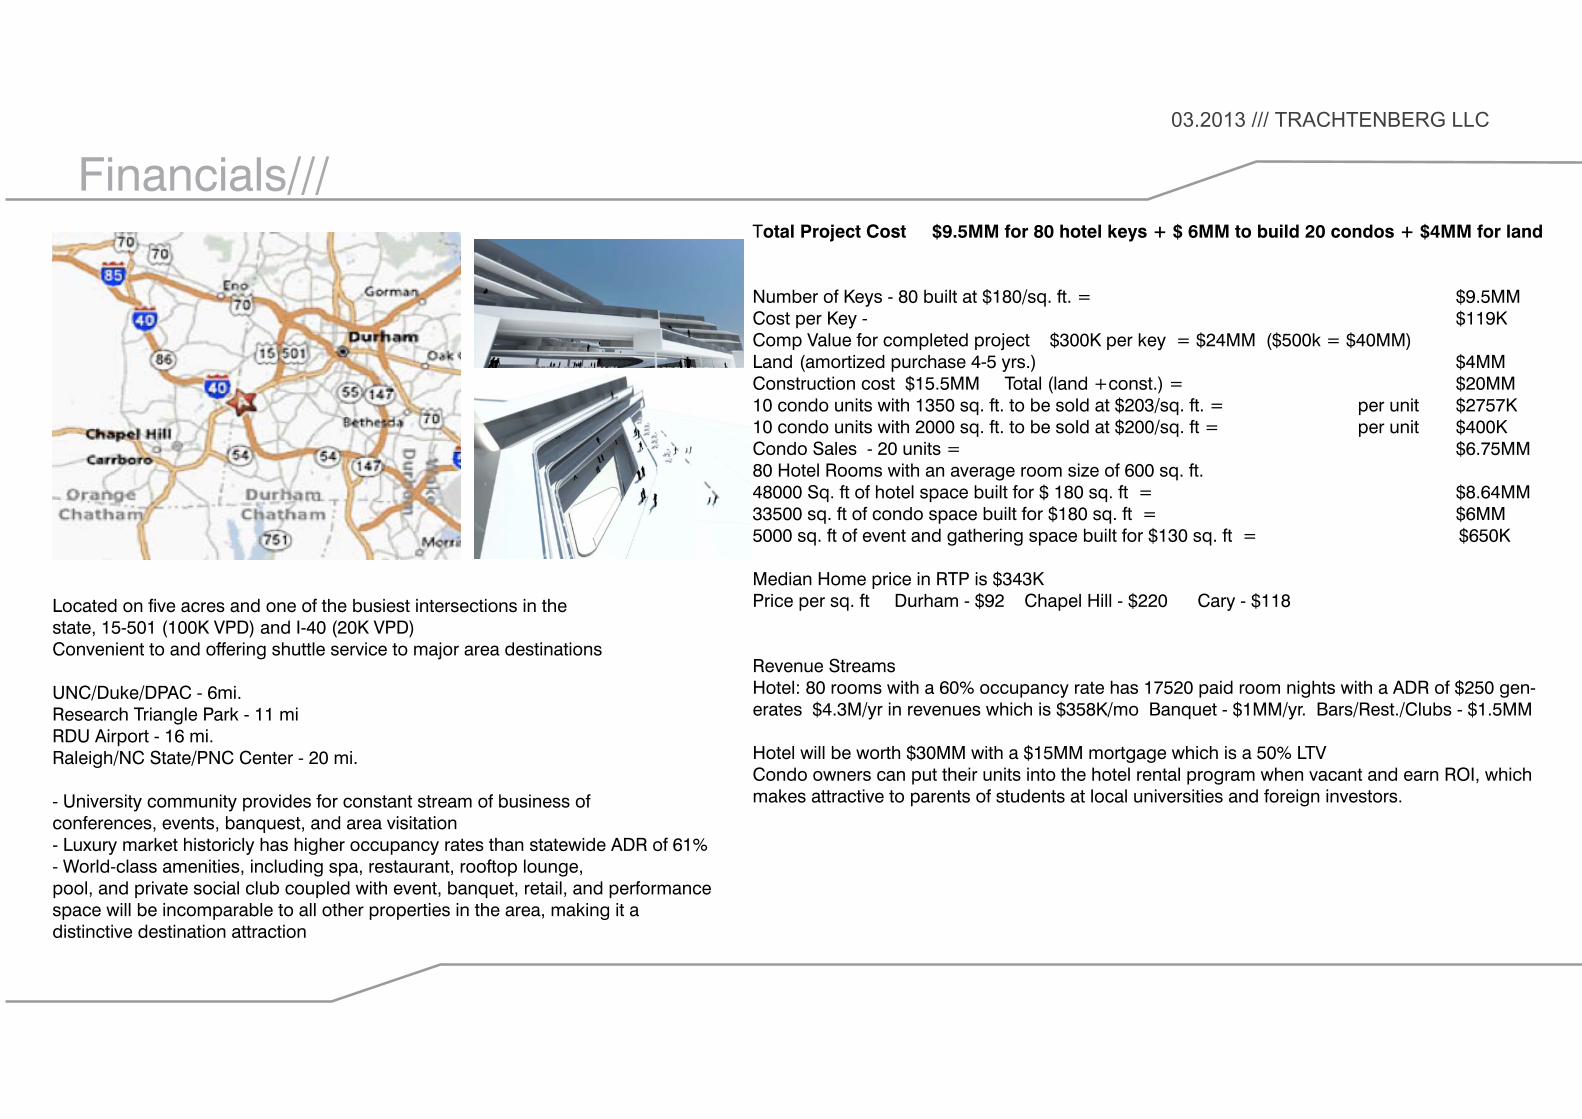
Financials/// Total Project Cost $9.5MM for 80 hotel keys + $ 6MM to build 20 condos + $4MM for land
Number of Keys - 80 built at $180/sq. ft. = $9.5MM Cost per Key - $119KComp Value for completed project $300K per key = $24MM ($500k = $40MM)Land (amortized purchase 4-5 yrs.) $4MMConstruction cost $15.5MM Total (land +const.) = $20MM10 condo units with 1350 sq. ft. to be sold at $203/sq. ft. = per unit $2757K 10 condo units with 2000 sq. ft. to be sold at $200/sq. ft = per unit $400K Condo Sales - 20 units = $6.75MM80 Hotel Rooms with an average room size of 600 sq. ft. 48000 Sq. ft of hotel space built for $ 180 sq. ft = $8.64MM33500 sq. ft of condo space built for $180 sq. ft = $6MM5000 sq. ft of event and gathering space built for $130 sq. ft = $650K
Median Home price in RTP is $343KPrice per sq. ft Durham - $92 Chapel Hill - $220 Cary - $118
Revenue StreamsHotel: 80 rooms with a 60% occupancy rate has 17520 paid room nights with a ADR of $250 gen-erates $4.3M/yr in revenues which is $358K/mo Banquet - $1MM/yr. Bars/Rest./Clubs - $1.5MM
Hotel will be worth $30MM with a $15MM mortgage which is a 50% LTVCondo owners can put their units into the hotel rental program when vacant and earn ROI, which makes attractive to parents of students at local universities and foreign investors.
Located on five acres and one of the busiest intersections in thestate, 15-501 (100K VPD) and I-40 (20K VPD)Convenient to and offering shuttle service to major area destinations
UNC/Duke/DPAC - 6mi.Research Triangle Park - 11 miRDU Airport - 16 mi.Raleigh/NC State/PNC Center - 20 mi.
- University community provides for constant stream of business ofconferences, events, banquest, and area visitation- Luxury market historicly has higher occupancy rates than statewide ADR of 61%- World-class amenities, including spa, restaurant, rooftop lounge,pool, and private social club coupled with event, banquet, retail, and performance space will be incomparable to all other properties in the area, making it adistinctive destination attraction
03.2013 /// TRACHTENBERG LLC

Investing in secondary markets is lucrative
19 February 2013
By Aik Hong Tan
HotelNewsNow.com columnist
Story Highlights
With interest rates remaining at historic low levels, cash-on-cash yield investing in
secondary markets can be lucrative with the appropriate level of leverage.
The key to successful investments in secondary markets is the existence of diverse and
sustainable demand generators.
The number of demand drivers in secondary markets is more targeted than in major
markets.
As the industry recovery continues to gain momentum, opportunities for investors abound.
Whether it’s a full-service property in New York, San Francisco or Miami, a select service hotel
in Pittsburgh or Raleigh, North Carolina, or a limited-service asset in Frisco, Texas, or Pueblo,
Colorado, there is no shortage of capital waiting to get off the sidelines and back in the game.
With real estate investment trusts, sovereign funds and institutional capital chasing deals in the
major markets, yields are being driven down to the range of 3% to 5%. The situation is quite
different in the secondary markets, where capitalization rates are ranging from 8.5% up to as
high as 12%. As a result, with interest rates remaining at historic low levels, cash-on-cash yield
investing in secondary markets can be
lucrative with the appropriate level of
leverage.
With that said, to be successful, an investor must pay special attention to specific issues that are
unique to any secondary-market deal.
Demand First and foremost, as with deals of any kind, careful study and understanding of demand
generators in the market are crucial. The number and nature of demand drivers in secondary
markets tends to be fewer and more targeted than in major markets such as New York or Los
Angeles.

It is important to understand the dynamics that draw travelers to the area. Sometimes it can be a
single landmark such as a college or military base. In these cases, it is essential to realize that
even one single event, like the closure of the military base, can have a major impact on demand.
In other cases, factors such as the construction or major refurbishment of a factory might bring
new, short-term demand to the market, causing occupancy and average daily rate to increase but
only temporarily.
The key to successful investments in secondary markets is the existence of diverse and
sustainable demand generators. Examples might include a strong corporate base, a major
university or popular attractions that draw leisure travelers on a consistent basis.
One example of such a market is Burlington, Vermont. GE, IBM and Ben & Jerry’s ice cream
have a major corporate presence there. The University of Vermont and Lake Champlain also
attract weekend travelers from New England as well as Canada. With the exception of a slight
decline during the depth of the recession in 2009, the revenue per available room in the
Burlington market has increased consistently by 4% to 5% annually from 2007 to 2012.
Supply Even though barriers to entry in secondary markets are not as high as in major markets, careful
consideration needs to be given to key variables. At the top of that list is location as it pertains to
potential new supply. For example, it is better to be in the downtown or core center of a
secondary market rather than at a highway location in the outer ring. Why? It is harder to build in
the urban center due to infill and permitting constraints, and because supply is limited in those
areas, it poses a distinct advantage if a hotel can be acquired in the urban center.
Buying at significant value below replacement costs is also a good strategy as it provides a
significant cost advantage over a new-build hotel. Securing affiliation with top brands including
Marriott International and Hilton Worldwide with a reasonable area of protection under the
franchise agreement also works to mitigate against new supply entering the market.
Exit strategy Exit strategies for hotels in secondary markets must be developed strategically and evaluated
carefully. One question to ask is whether the current brand will be available to the next buyer.
This depends, in large part, on the age of the asset. A select-service hotel with a major flag might
sound like a great opportunity. However, it might not be such a good deal if the property is 40
years old and is unlikely to retain that same flag when the owner attempts to sell it three or four
years later. As a result, the value of the hotel will be compromised greatly.
It is also important to project how and why the value of the asset will increase by the time the
hotel would be sold. In major markets, supply constraints and scarcity of land drive a natural
appreciation of real estate prices over time. This is not the case in secondary markets, where real
estate values are more subject to a range of variables.
The most critical factor is how cash flow of the hotel would grow. To be successful, a buyer in a
secondary market must clearly develop and implement a plan to increase the cash flow of the

property between the time of acquisition and the time of sale. Some strategies to accomplish this
could include an upgrade of the brand as well as more focused and sophisticated management
than the previous owner.
Conclusion New York’s Times Square and Main Street’s town square each offer opportunities for the hotel
investor. Those who are most successful are the ones who understand the dynamics and distinct
differences between the two market types and who are able to identify and capitalize on the
factors that drive customer demand, influence supply and have an effective exit strategy.
Development execs share recipes for success
12 February 2013
By Shawn A. Turner
Finance Editor
Story Highlights
Markets such as Austin, Texas, and Columbus, Ohio, are catching the eye of
development executives.
“We’ll certainly chase where there is oil demand,” Choice’s Shane Platt said.
Generation X, Generation Y and millennials are driving the design of hotels today,
panelists said.
HOUSTON—Brand executives detailed their recipes for development success Monday during an opening day panel at the Hospitality Law Conference.
The panelists agreed the top 20 U.S. markets are still en vogue, but they also are increasingly finding success in markets such as Austin, Texas; Columbus, Ohio; and Pittsburgh.

“Some of these second-tier markets are phenomenal,” said Chip Ohlsson, VP of development at Starwood Hotels & Resorts Worldwide.
Shane Platt, VP of franchise sales and development at Choice Hotels International, said it’s a “no brainer” that many of the
company’s brands, such as Cambria Suites, need to be in the top U.S. markets. But creative development creeps into the picture
when considering some other Choice brands, such as Sleep Inn.
Platt said when considering development of that brand, the company looks for small markets that can support only one or two hotels.
“Mid-market rates didn’t fall as far,” Platt said. “There’s been big interest in development of secondary and tertiary markets with
the right brands.” There is a lot of developer interest in the Sleep Inn brand also because it is an affordable brand to build, he added.
Developing around energy America’s energy industry boom in markets such as North Dakota and Texas has been a boon to the hotel industry, panelists said.
Earlier in the day, Stephen Barth, founder and president of HospitalityLawyer.com, talked about a Motel 6 property in Odessa, Texas, that is generating a $310 average daily rate thanks to the energy industry.
“It’s crazy right now,” Ohlsson said during the panel.
And the executives said they’re looking to get their share of the market. Tye Turman, senior VP of hotel development at Marriott
International, said the company is actively seeking development opportunities for its Fairfield brand in oil-patch markets.
“We’ll certainly chase where there is oil demand,” Platt said. “If they keep finding oil, they’ll keep building hotels.”
Design influence The panelists also discussed the emerging market dictating the design of these hotels.
While the baby-boomer generation is still on the road, it is Generation X, Generation Y and millennials who are influencing hotel design, the panelists said.
“Now we are designing hotels for the social media networking group,” Ohlsson said. “They want instant results.”
Recent updates to the Courtyard by Marriott brand, for instance, were made with these new travelers in mind, Turman said.
“At the end of the day, baby boomers, they’re still traveling. But Generation X, Generation Y, they’re the ones we have to appeal
to,” he said.
So when thinking about the redesign of the Courtyard by Marriott properties, Marriott focused on rounded corners instead of
straight lines, Turman said. The company also chose muted earth tones for the guestrooms because these generations of travelers indicated they wanted to relax first and think about work second.
The changes were rolled out in December during the company’s annual Courtyard by Marriott brand conference.
Companies are also looking to eke out as much functionality as possible from public spaces, the panelists said.
“It’s about getting people out of their rooms and creating a community environment,” Starwood Hotels’ Ohlsson said.
$20-million wish list Moderator Rich Sprecher, VP of business development at Aimbridge Hospitality, asked the panelists what they would do in the hotel sector if handed a $20-million check.
“I would love to say I’d go out and do new construction,” Ohlsson said.

Instead, Ohlsson said he’d likely acquire an office building and convert it to a design-centered brand.
“Design is the future of our industry,” he said.
Choice’s Platt said he’d develop a variety of hotels in various markets and might also look to acquire an office building and give it “a fresh new look” as a hotel.
And finally, Turman said his wishes for the $20 million are not as complex. He would develop as many TownePlace Suites by Marriott and Fairfield Inn & Suites properties as possible because developers have shown a high level of interest in the brands.
“In our industry, sometimes we think too much,” he said. “We think it’s rocket science, and it doesn’t need to be.”
Move-ins help push demand in college towns
14 September 2012
By Samantha Worgull
Editorial Assistant
Story Highlights
The Carolina Inn, a historic hotel located directly on UNC’s campus, sells out every
move-in weekend.
Occupancy increased by at least 10% in select U.S. college towns in comparison to July
year-to-date numbers.
Fargo, North Dakota, had the highest occupancy rates during move-in weekend.
REPORT FROM THE U.S.—While the fall travel season means a boon for many urban hotels, properties in more
isolated college towns traditionally also report a demand uptick as students—and their parents—return to campus.
In Ann Arbor, Michigan, the University of Michigan is a steady demand driver, according to Joe Sefcovic, GM at
the Holiday Inn near the University of Michigan.
“We have 9,700 kids move into the dorms at the university, and a total of 50,000 go to the university, so we see all
those people moving into town,” he said “It definitely accelerates occupancy.”

Occupancy at his 225-room property—the largest hotel in Ann Arbor—was 90% during the university’s move-in
weekend during 31 August.
During the first seven months of the year, hotels in the market reported an average occupancy of 69.3%, average
daily rate of $88.70, and revenue per available room of $61.43, according to STR, parent company of
HotelNewsNow.com.
Performance during Friday and Saturday night of move-in weekend were much stronger: Occupancy was 90.1% and
88.9%; ADR was $94.01 and $92.08; and RevPAR was $84.72 and $81.90, respectively.
Hoteliers in Chapel Hill, North Carolina—home to The University of North Carolina at Chapel Hill—saw a similar
bump in performance, according to STR data. Hoteliers reported average occupancy of 90.4% and 80.7%; ADR of
$119.49 and 118.75; and RevPAR of $108.03 and $95.88 on 17 and 18 August, respectively.
July year-to-date numbers showed occupancy of 70.2%, ADR of $110.58 and RevPAR of $77.58.
The Carolina Inn, a historic hotel located directly on UNC’s campus, sees demand increase during every
major weekend throughout the school year, including move-in, major sporting events and university-related
meetings, said GM Jack Schmidt.
“We sell out every move-in weekend and during seven home football games
throughout the school year,” he said. “It's a good place to be because nobody is fully insulated from
downturns in the economy, and universities drive a lot of business.”
Manish Atma, owner of Atma Hotel Group, which manages a Holiday Inn Express, a Hampton Inn & Suites and a
Hampton Inn in Chapel Hill, said move-in weekend is like any other.
“We do see a spike in occupancy in August when travel is a little bit slow, but it’s staggered,” he said. “It’s a normal
weekend, but the difference is we get a lot of questions from the family about the town.”
Atma added approximately 70% of his hotels’ business comes from UNC and UNC Health Care, a not-for-profit
health-care system associated with the university’s school of medicine.
And while Fargo, North Dakota, reported some of the country’s highest occupancy rates during North Dakota State
University’s move-in weekend—96% and 95.8% on 17 and 18 August, respectively—sources could not confirm
demand was directly attributable to parents visiting.
The 83-room Best Western Plus Kelly Inn & Suites in Fargo, five miles from NDSU’s campus, only filled three to
five rooms with move-in-related travelers, said GM Lisa Amann. Still, occupancy at her hotel was 100% during the
weekend.
“It’s not an anomaly,” she said. “It’s not something where there’s an unconstrained demand because we’re not next
door to the college.”
Sandi Adams, GM at the 151-room Radisson Hotel Fargo, located in the heart of downtown, said most of her
property’s business comes from meetings and conferences. She does, however, see some parents coming to stay.
“We are more of a business hotel, and we do get parents here … but it’s not something that is huge numbers and
huge occupancy,” she said.
But even then, being able to attribute demand to any given generator can prove challenging, Adams added.
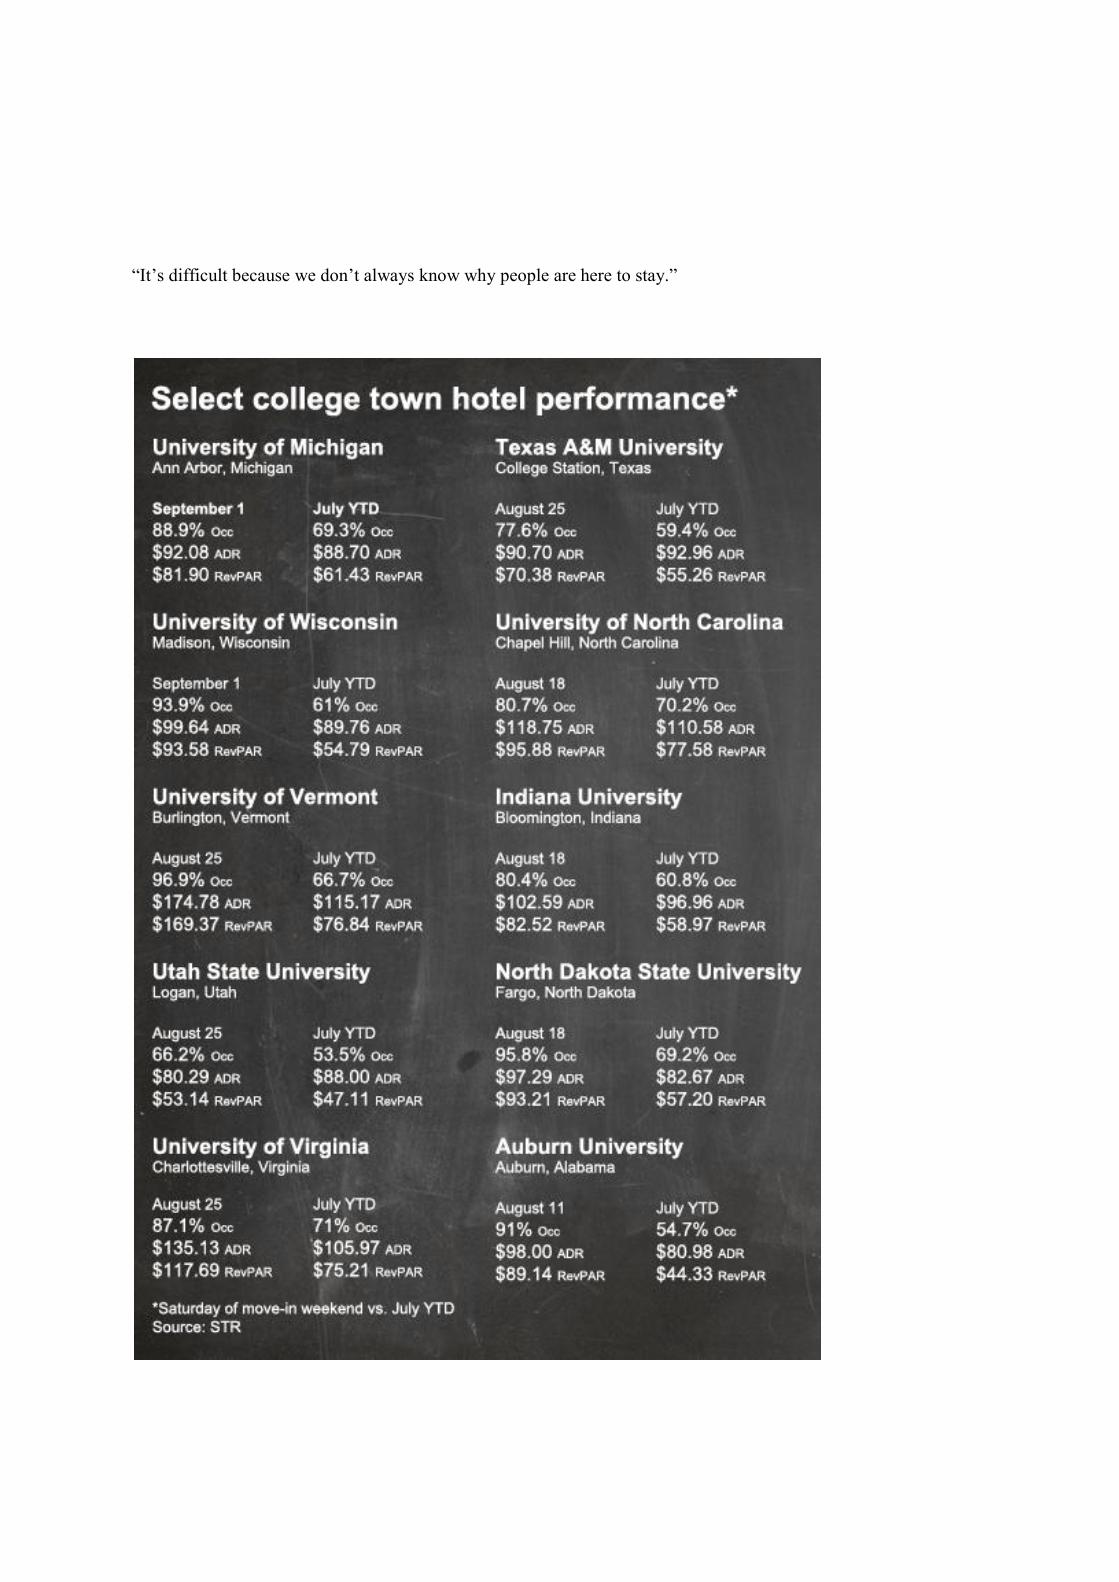
“It’s difficult because we don’t always know why people are here to stay.”


Division of Tourism, Film and Sports Development
2012 North Carolina Lodging Report
A Publication of the North Carolina Division of Tourism, Film and Sports Development
January 2013

Division of Tourism, Film and Sports Development
2012 North Carolina Lodging Report
Year-end 2012 hotel/motel occupancy was up 2.5% statewide from 2011. This represents a nearly fourteen percent increase over the last three years, and slightly above 2008 occupancy. Though still down about five percent from the peak in 2007, the last three years have significantly lessened the gap. o The US occupancy and South Atlantic states occupancy were also up 2.5% from 2011.
Smith Travel Research, 2013 *Occupancy – Rooms sold divided by rooms available.
44%
46%
48%
50%
52%
54%
56%
58%
60%
62%
2005 2006 2007 2008 2009 2010 2011 2012
58.3
60.0 60.4
55.9
50.5
53.9
56.1
57.4
Occupancy in North Carolina 2005-2012
+2.9% +0.7% -7.5% +2.8%
-1.5%
-9.7% +6.7% +4.0% +2.5%

Division of Tourism, Film and Sports Development
In 2012 monthly hotel/motel occupancy followed the same general trend as in recent years. Historically, statewide occupancy is always higher during the summer months and October. Nine months of 2012 experienced the highest occupancy since 2007. Growth was stronger during the spring, summer and early fall, and slowed a bit in late fall/early winter. Information from neighboring states confirms similar trend lines for them, as well as nationwide estimates.
Smith Travel Research, 2013
35%
45%
55%
65%
Jan
uar
y
Feb
ruar
y
Mar
ch
Ap
ril
May
Jun
e
July
Au
gust
Sep
tem
ber
Oct
ob
er
No
vem
ber
Dec
emb
er
Monthly Occupancy in North Carolina 2007-2012
2007 2008 2009 2010 2011 2012

Division of Tourism, Film and Sports Development
2012 room rates (ADR) in North Carolina were up 4.5% from 2011, just topping the 2008 average rate to be the highest on record. Room rates have increased seven percent over the last two years. o The US ADR was up 4.2% from 2011. ADR in the South Atlantic states was up 3.1% from 2011.
Smith Travel Research, 2013 *ADR (Average Daily Rate) – Room revenue divided by rooms sold.
$30.00
$45.00
$60.00
$75.00
$90.00
2005 2006 2007 2008 2009 2010 2011 2012
$70.42
$75.73
$81.51 $84.84
$80.21 $79.80 $81.86 $85.34
Average Daily Room Rates (ADR) in North Carolina 2005-2012
+7.5% +7.6% +4.1% +3.8%
+21.2%
-5.5% -0.5% +2.6% +4.5%

Division of Tourism, Film and Sports Development
Room rates (ADR) in North Carolina in 2012 were the highest on record (+0.5% over the previous high in 2008). In particular, September rates, as a result of the Democratic National Convention, increased four percent statewide (38% in the Carolinas Region). Late fall/early winter saw the highest room rates on record for those particular months.
Smith Travel Research, 2013
$65.00
$75.00
$85.00
$95.00
Jan
uar
y
Feb
ruar
y
Mar
ch
Ap
ril
May
Jun
e
July
Au
gust
Sep
tem
ber
Oct
ob
er
No
vem
ber
Dec
emb
er
Monthly ADR in North Carolina 2007-2012
2007 2008 2009 2010 2011 2012

Division of Tourism, Film and Sports Development
Statewide, Revenue Per Available Room (RevPAR) was up 7.1% from 2011, nearly reaching the peak set in 2007. RevPAR has increased over twenty percent in the last three years. o Nationally, RevPAR was up 6.8% from 2011. South Atlantic states RevPAR was up 5.7% from 2011.
Smith Travel Research, 2013 *RevPAR – Revenue Per Available Room – Room revenue divided by rooms available (occupancy times average room rate will closely approximate RevPAR)
$35.00
$40.00
$45.00
$50.00
$55.00
2005 2006 2007 2008 2009 2010 2011 2012
$41.02
$45.44
$49.13
$47.46
$40.52
$43.05
$45.92
$49.00
Revenue Per Available Room (RevPAR) in North Carolina 2005-2012
+10.8% +8.1% -3.4% +6.6%
+19.5%
-14.6% +6.2% +6.7% +7.1%

Division of Tourism, Film and Sports Development
2012 statewide monthly Revenue per Available Room (RevPAR) increased each month from 2011, particularly late spring, summer and early fall. As with ADR, RevPAR was at a record in September, due in part to the increased room rates as a result of the DNC in Charlotte.
Smith Travel Research, 2013
$20.00
$25.00
$30.00
$35.00
$40.00
$45.00
$50.00
$55.00
$60.00
$65.00
$70.00
Jan
uar
y
Feb
ruar
y
Mar
ch
Ap
ril
May
Jun
e
July
Au
gust
Sep
tem
ber
Oct
ob
er
No
vem
ber
Dec
emb
er
Monthly Revenue Per Available Room (RevPAR) in North Carolina 2007-2012
2007 2008 2009 2010 2011 2012
Division of Tourism, Film and Sports Development
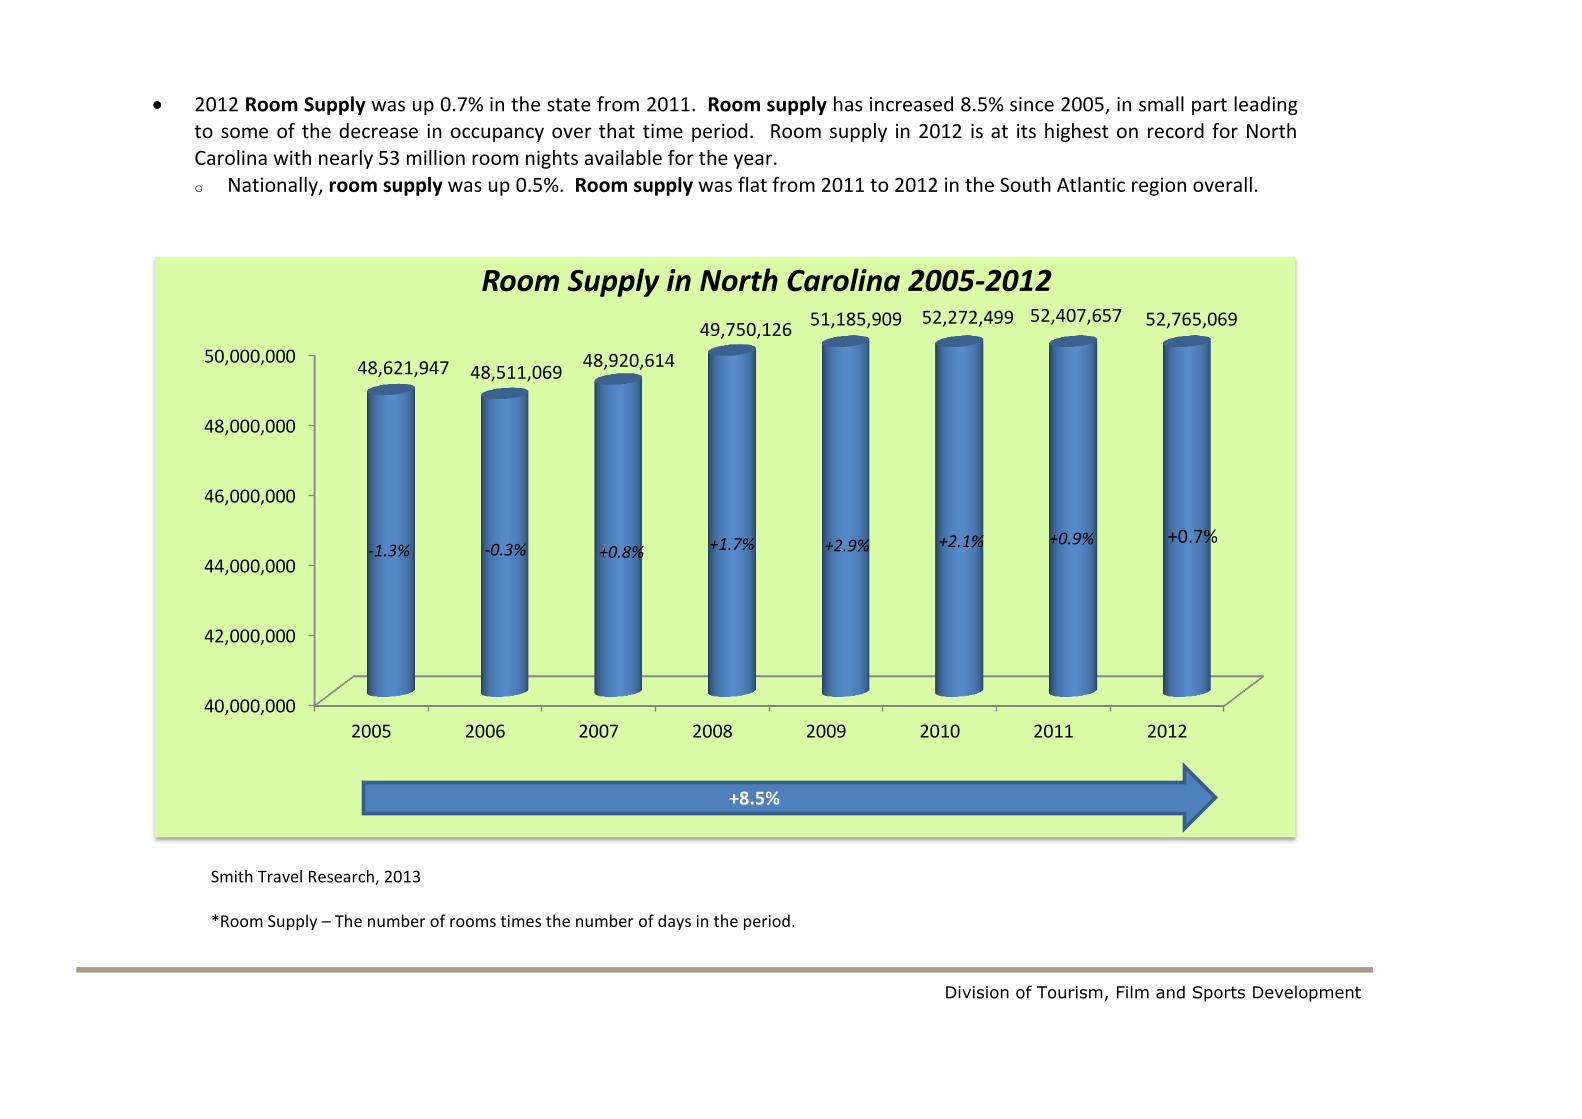
2012 Room Supply was up 0.7% in the state from 2011. Room supply has increased 8.5% since 2005, in small part leading to some of the decrease in occupancy over that time period. Room supply in 2012 is at its highest on record for North Carolina with nearly 53 million room nights available for the year. o Nationally, room supply was up 0.5%. Room supply was flat from 2011 to 2012 in the South Atlantic region overall.
Smith Travel Research, 2013 *Room Supply – The number of rooms times the number of days in the period.
40,000,000
42,000,000
44,000,000
46,000,000
48,000,000
50,000,000
2005 2006 2007 2008 2009 2010 2011 2012
48,621,947 48,511,069 48,920,614
49,750,126 51,185,909 52,272,499 52,407,657 52,765,069
Room Supply in North Carolina 2005-2012
-0.3% +0.8% +1.7% -1.3%
+8.5%
+2.9% +2.1% +0.9% +0.7%

Division of Tourism, Film and Sports Development
Room Supply in 2012 followed the same trend line as last year, showing more growth in the second half of the year.
Smith Travel Research, 2013
3,000,000
3,200,000
3,400,000
3,600,000
3,800,000
4,000,000
4,200,000
4,400,000
4,600,000
4,800,000
5,000,000
Jan
uar
y
Feb
ruar
y
Mar
ch
Ap
ril
May
Jun
e
July
Au
gust
Sep
tem
ber
Oct
ob
er
No
vem
ber
Dec
emb
er
Monthly Room Supply in North Carolina 2007-2012
2007 2008 2009 2010 2011 2012
Division of Tourism, Film and Sports Development
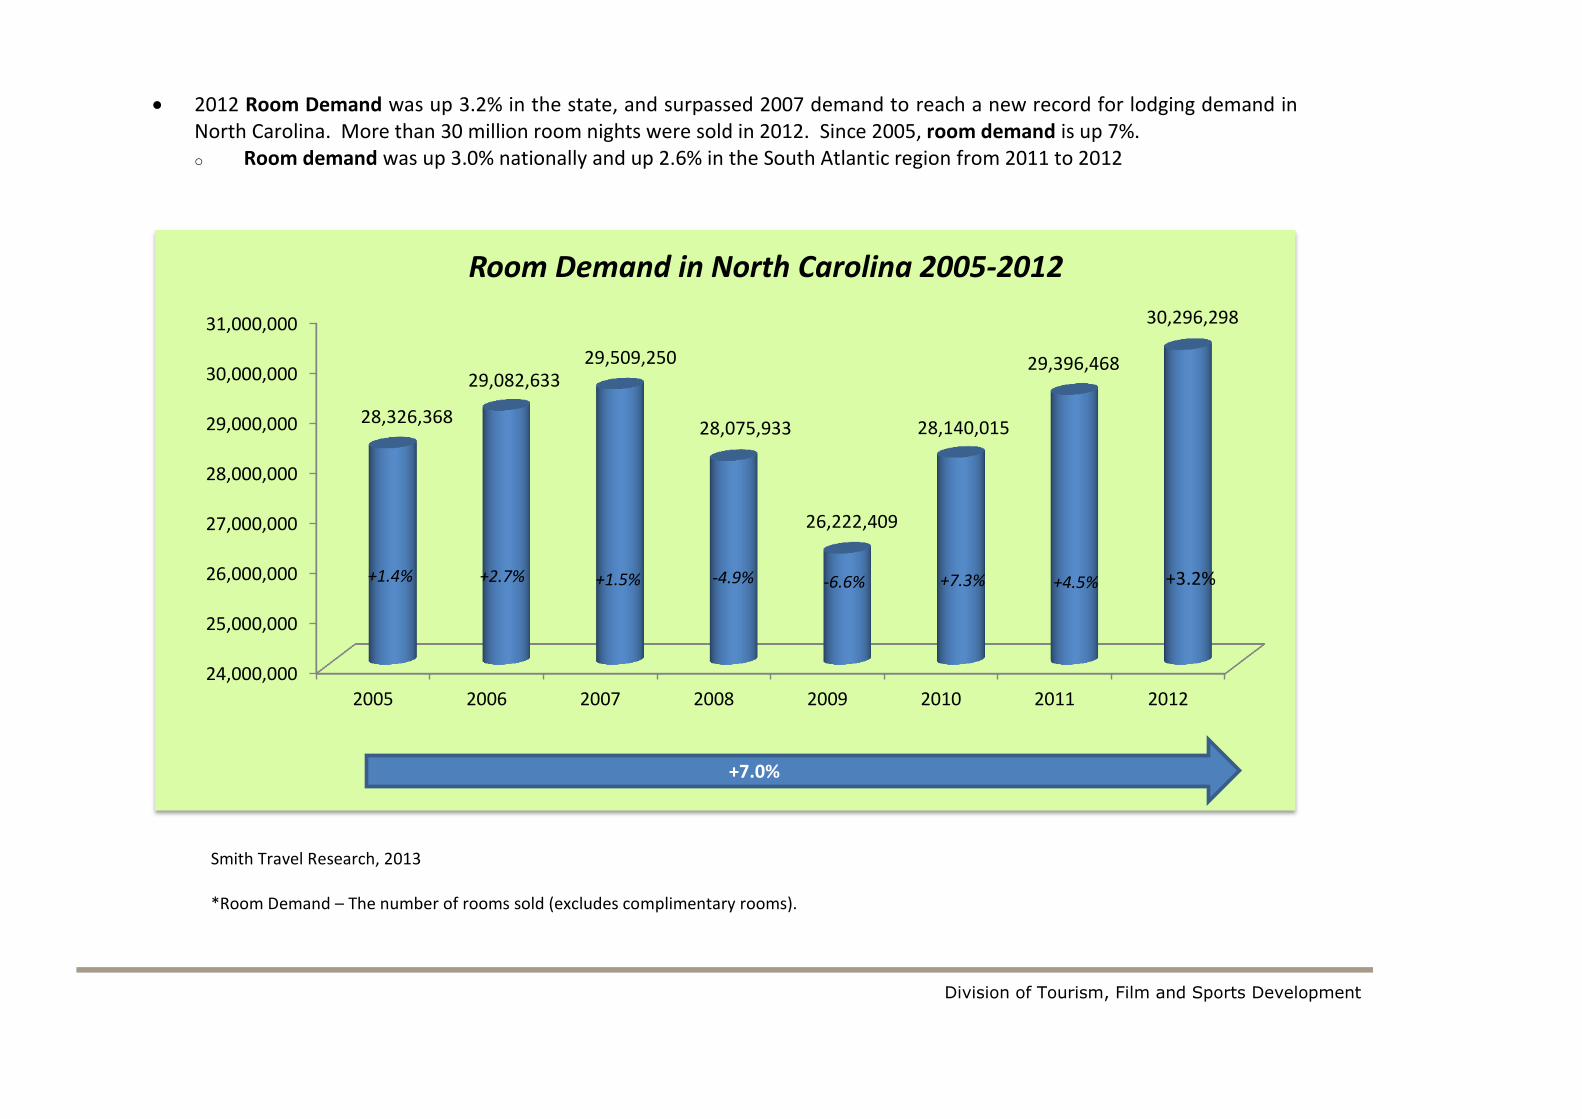
2012 Room Demand was up 3.2% in the state, and surpassed 2007 demand to reach a new record for lodging demand in North Carolina. More than 30 million room nights were sold in 2012. Since 2005, room demand is up 7%. o Room demand was up 3.0% nationally and up 2.6% in the South Atlantic region from 2011 to 2012
Smith Travel Research, 2013 *Room Demand – The number of rooms sold (excludes complimentary rooms).
24,000,000
25,000,000
26,000,000
27,000,000
28,000,000
29,000,000
30,000,000
31,000,000
2005 2006 2007 2008 2009 2010 2011 2012
28,326,368
29,082,633 29,509,250
28,075,933
26,222,409
28,140,015
29,396,468
30,296,298
Room Demand in North Carolina 2005-2012
+2.7% +1.5% -4.9% +1.4%
+7.0%
-6.6% +7.3% +4.5% +3.2%

Division of Tourism, Film and Sports Development
Nearly every month in 2012 showed increased statewide Room Demand from 2011, setting records in many months. Winter months were fairly flat, but spring and summer picked up before slowing in late fall. Due to an increased supply in rooms over the last several years, demand has fared somewhat better than occupancy; meaning a slightly smaller number of people are filling an even larger number of rooms than in previous years.
Smith Travel Research, 2013
1,000,000
1,200,000
1,400,000
1,600,000
1,800,000
2,000,000
2,200,000
2,400,000
2,600,000
2,800,000
3,000,000
Jan
uar
y
Feb
ruar
y
Mar
ch
Ap
ril
May
Jun
e
July
Au
gust
Sep
tem
ber
Oct
ob
er
No
vem
ber
Dec
emb
er
Monthly Room Demand in North Carolina 2007-2012
2007 2008 2009 2010 2011 2012

Division of Tourism, Film and Sports Development
North Carolina room revenues were up 7.9% in 2012 from 2011, reaching nearly $2.6 billion and topping the previous high set in 2007. Statewide room revenues have increased nearly thirty percent since 2005. This is due in part to the increased ADR from 2005-2007, and a resurge in 2011. However, demand has also increased over fifteen percent over the last three years, contributing to the increased revenues as well. o Nationally, room revenues were up 7.3%. In the South Atlantic states, room revenues increased 5.7% from 2011 to 2012.
Smith Travel Research, 2013 *Room Revenue – Total room revenue generated from the sale or rental of rooms.
$0.00
$0.50
$1.00
$1.50
$2.00
$2.50
$3.00
2005 2006 2007 2008 2009 2010 2011 2012
$1.99
$2.20 $2.40 $2.35
$2.06 $2.24
$2.41 $2.59
Room Revenues in North Carolina 2005-2012 ($ billions)
+10.4% +9.2% -2.1% +5.2%
+29.6%
-12.4% +8.5% +7.6% +7.9%

Division of Tourism, Film and Sports Development
North Carolina room revenues in 2012 showed very positive increases nearly every month over 2011, particularly during September (as a result of the previously noted DNC in Charlotte). However, May through August and October through December also reported strong growth in revenues.
Smith Travel Research, 2013
100,000,000
120,000,000
140,000,000
160,000,000
180,000,000
200,000,000
220,000,000
240,000,000
260,000,000
Jan
uar
y
Feb
ruar
y
Mar
ch
Ap
ril
May
Jun
e
July
Au
gust
Sep
tem
ber
Oct
ob
er
No
vem
ber
Dec
emb
er
Monthly Room Revenues in North Carolina 2007-2012
2007 2008 2009 2010 2011 2012
Division of Tourism, Film and Sports Development
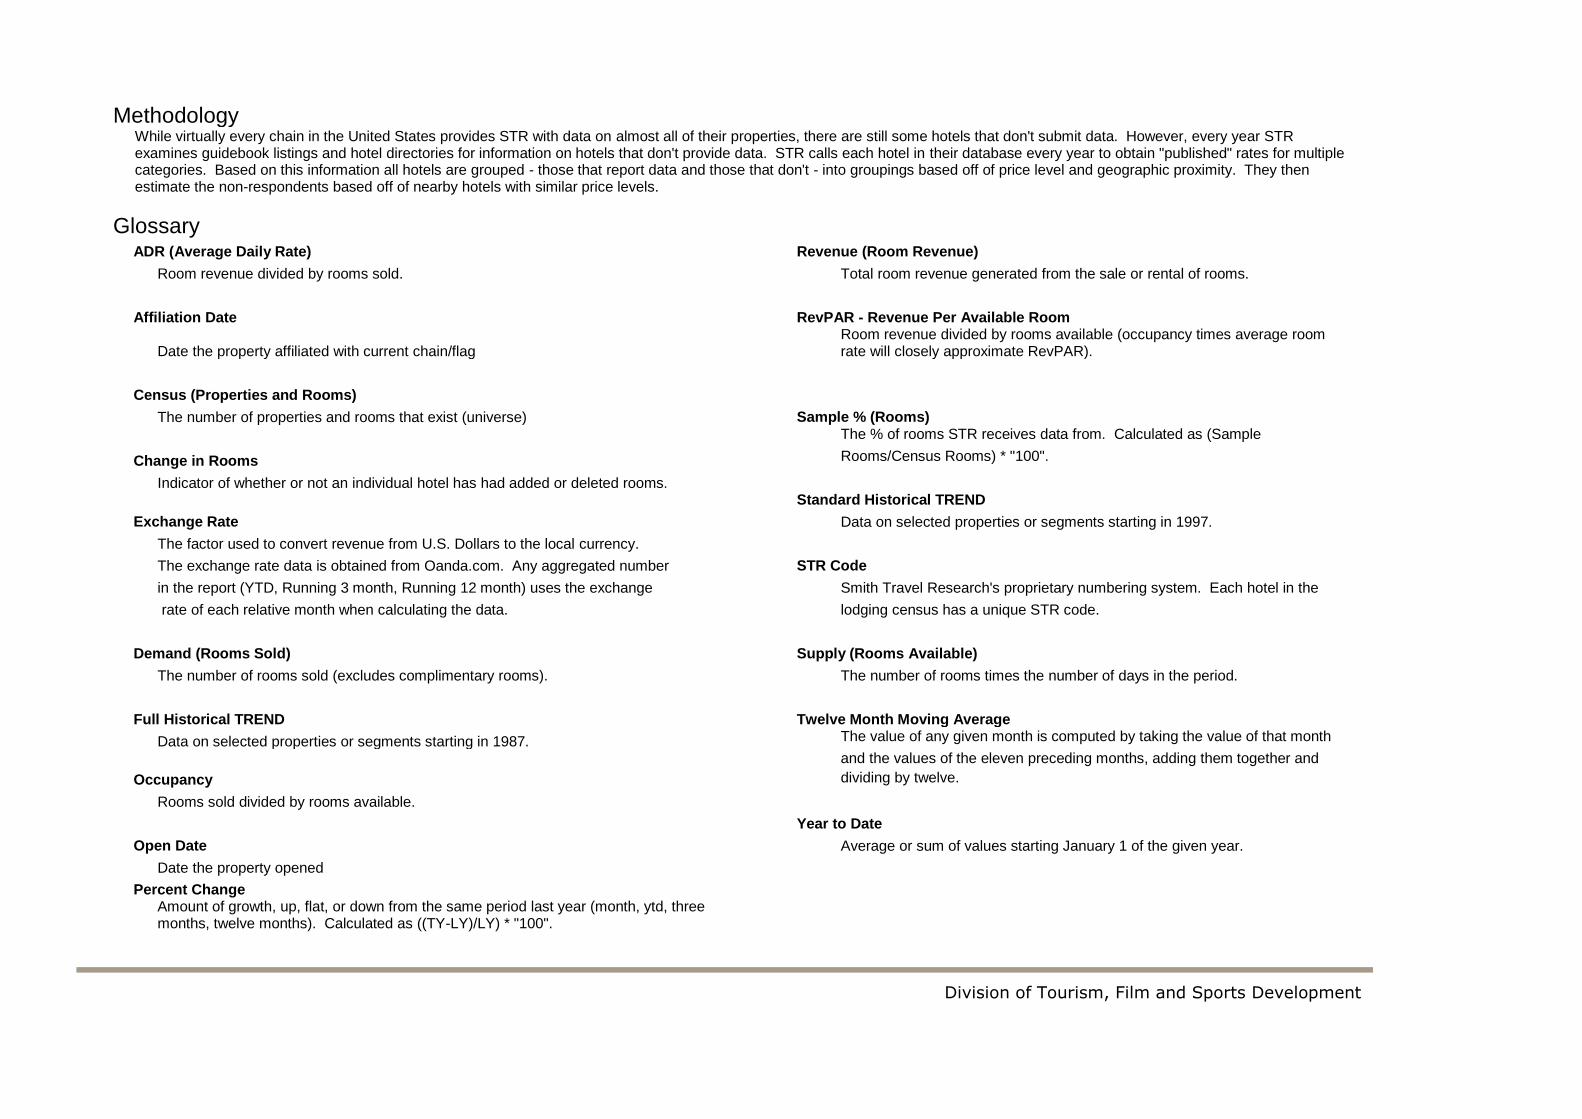
Methodology
While virtually every chain in the United States provides STR with data on almost all of their properties, there are still some hotels that don't submit data. However, every year STR examines guidebook listings and hotel directories for information on hotels that don't provide data. STR calls each hotel in their database every year to obtain "published" rates for multiple categories. Based on this information all hotels are grouped - those that report data and those that don't - into groupings based off of price level and geographic proximity. They then estimate the non-respondents based off of nearby hotels with similar price levels.
Glossary
ADR (Average Daily Rate)
Revenue (Room Revenue)
Room revenue divided by rooms sold.
Total room revenue generated from the sale or rental of rooms.
Affiliation Date
RevPAR - Revenue Per Available Room
Date the property affiliated with current chain/flag
Room revenue divided by rooms available (occupancy times average room rate will closely approximate RevPAR).
Census (Properties and Rooms)
The number of properties and rooms that exist (universe)
Sample % (Rooms)
The % of rooms STR receives data from. Calculated as (Sample
Change in Rooms
Rooms/Census Rooms) * "100".
Indicator of whether or not an individual hotel has had added or deleted rooms.
Standard Historical TREND
Exchange Rate
Data on selected properties or segments starting in 1997.
The factor used to convert revenue from U.S. Dollars to the local currency.
The exchange rate data is obtained from Oanda.com. Any aggregated number
STR Code
in the report (YTD, Running 3 month, Running 12 month) uses the exchange
Smith Travel Research's proprietary numbering system. Each hotel in the
rate of each relative month when calculating the data.
lodging census has a unique STR code.
Demand (Rooms Sold)
Supply (Rooms Available)
The number of rooms sold (excludes complimentary rooms).
The number of rooms times the number of days in the period.
Full Historical TREND
Twelve Month Moving Average
Data on selected properties or segments starting in 1987.
The value of any given month is computed by taking the value of that month
and the values of the eleven preceding months, adding them together and
Occupancy
dividing by twelve.
Rooms sold divided by rooms available.
Year to Date
Open Date
Average or sum of values starting January 1 of the given year.
Date the property opened
Percent Change
Amount of growth, up, flat, or down from the same period last year (month, ytd, three months, twelve months). Calculated as ((TY-LY)/LY) * "100".

Articles from recapping the
2012 Lifestyle/Boutique Hotel Development Conference
Booming Boutique Business Meets in Miami
Beach
Oct 19, 2012 7:06 AM, By Ed Watkins
South Florida Leads the Way Back in Boutique/Lifestyle Segment
Jason Pomeranc of Commune Hotels believes in some cases branding can be a negative in
obtaining financing.
It‟s no surprise to anyone that the boutique and lifestyle segments of the hotel industry are doing
well. And based on strong operating performance in the sector, interest in the product has gained
a lot of ground in recent years from developers, operators, lenders and even traditional brand
companies. And nowhere is that trend more evident than in Miami, and in its Miami Beach
submarket, one of two epicenters (Manhattan is the other) of the boutique and lifestyle hotel
industry.
As Jay Coldren, vice president of lifestyle brands at Marriott, said during an opening panel at this
week‟s Lifestyle/Boutique Hotel Development Conference, “If you‟re serious about this
segment, you must be in Miami.”
Lodging Hospitality, in conjunction with HVS Hotel Management, sponsors LBHDC, which is
being held at the Fontainebleau Hotel in Miami Beach. The School of Hospitality Management
at Michigan State University is the conference‟s academic sponsor.
New data from STR shows the strength of the Miami area markets. Year-to-date through August
occupancy for Miami was 77.7%, while RevPAR increased a whopping 8.2%. And perhaps most
promising is the news that ADR has almost fully recovered to pre-recession levels, a process that
took 48 months.
The success of the lifestyle/boutique segment is having an effect throughout the industry. All
hotels, but especially lifestyle and boutique properties, need to become “more experiential and
sensory, said Marriott‟s Coldren. “The alternative is to perish.”

An example of how this segment has grown is seen in the financing arena. While many believe
it‟s difficult for non-branded hotels to attract debt or equity financing, Jason Pomeranc of
Commune Hotels said a brand can actually be a negative for a boutique hotel seeking financing,
particularly in some high-rate markets like New York City.
“With some products and in some markets it‟s warranted [to affiliate with a brand], but lenders
and institutions are starting to see in certain sectors you can do without brands and be better off,”
said Pomeranc. Commune includes a JdV Collection and the Thompson-brand hotels. He said
the company is also developing a new value-oriented, design-driven chain that will compete with
boutiques in lower price segments.
Marriott‟s Jay Coldren says all hotels need to take on some of the
characteristics of boutique hotels.
Nor surprisingly, Coldren of Marriott had a different opinion. In explaining the rationale for
Marriott‟s soft-brand Autograph Collection, he said, “People are looking for the ability to
function independently in the lifestyle segment but also to have a floor to their risk. By plugging
into our [reservations system] but maintaining the independent integrity of these hotels gives
lenders a lot more comfort and the financing comes a lot easier.”
The boutique segment is a beneficiary to what Denihan Hospitality President David Duncan
called a “raindrop recovery. Recovery very specifically depends on where you are,” he said,
adding that while nationwide about 35% of jobs lost in the downturn have returned, in New York
City 135% of jobs have returned. Denihan has 16 hotels under two brands (Affinia and James)
and a collection of independent properties. “That‟s why we focus on the top five to 10 markets
and in the center cities of those markets.”
Every industry conference panel focused on the boutique segment seems obligated to define the
word boutique, and this one was no different. While terms like “luxury finishes,” and
“individualized experiences” were cited by some panelists, Trust Hospitality President & COO
Patrick Goddard may have had the most insightful take on the topic.
“In many ways, a consumer‟s lodging decision is a form of self-expression,” he said. “That‟s the
way consumers buy certain brands of cars, clothing or shoes. The ways they choose a restaurant
or a hotel are reflections of themselves. So when we‟re creating a brand identity or voice, we
look at the target demographic and think about what they want in their experience.”
“Lifestyle” may be an even harder term to pin down. As Coldren said, “Every consumer product
on the market seems to have a „lifestyle‟ bent to it, right down to „lifestyle tires.‟” And as
moderator Jeff Higley of Smith Travel Research noted, the notion of a lifestyle product is really
not new in the hotel industry. “Even Knights Inn was developed decades ago as a lifestyle hotel
because it catered to the lifestyle of truckers,” he said.

Independent and Boutique Hotels Gain
Mainstream Acceptance
by Eric Stoessel October 19th, 2012
What Ian Schrager and Bill Kimpton started 25 years ago on opposite ends of the country in
gateway cities like San Francisco and New York has now met in the middle. Independent
boutique hotels can work — and thrive — in cities like Milwaukee, and developers at the fourth
annual Lifestyle/Boutique Hotel Development Conference in Miami this week talked about
projects in faraway places like Montana, Kentucky and Tennessee.
The segment has reached mainstream acceptance by consumers, investors and even the hotel
franchise companies.
Jay Coldren, vice president of lifestyle brands for Marriott International, said it‟s because of a
generational — and transformational — shift happening as Gen Y consumers and their
preference for lifestyle hotels take over buying power from the Baby Boomers in the next five
years.
Coldren heads Marriott‟s fast-growing Autograph Collection, a pseudo-brand allowing owners
more independence, yet a connection to the powerful Marriott system. Other hotel franchise
companies have similar offerings, like Choice‟s Ascend Collection, and more will follow in the
next five years, said Jeff Low, CEO and founder of Stash Hotel Rewards.
Investors and lenders are also taking notice. Neil Shah, president and chief operating officer of
Hersha Hospitality Trust, said in some markets independents have recovered faster than their
branded-counterparts and are trading at similar or even premium levels, in part because they are
unencumbered of a franchise or management contract. He also added that during the last cycle
there were many lenders who were only interested in branded properties. “Not anymore,” he said
during a general session at the Fontainebleau Thursday. “That‟s changing. More investors are
interested in independents.”
The general acceptance of the segment and success stories like the Iron Horse in Milwaukee
have helped open the door to new development in secondary markets. Patrick Goddard, president
of Trust Hospitality, said his company even targets some of those non-gateway cities. “There are
different prices, investments and it may be harder to get financing, but it can be done,” he said.
When this conference began three years ago we talked about the “burgeoning” lifestyle and
boutique segments. They‟re now booming.
Related Topics: General |

Independent Hoteliers Share Best Practices
Oct 23, 2012 9:03 AM, By Eric Stoessel
Jeff Low, founder and CEO of Stash Hotel Rewards, said one of the biggest challenges facing
independent hotel owners and operators is their “isolation.” They have no “idea bank” to draw
from.
At last week‟s Lifestyle/Boutique Hotel Development Conference at the Fontainebleau in Miami,
a panel of independent hoteliers traded best practices and shared similar stories of the challenges
they face competing in a branded world. The panel — titled, „Independents‟ Day‟ — was
moderated by Paramount Lodging Advisors Associate Michael Kitchen, and also included
Stash‟s Low, Clarendon Hotel Owner and General Manager Ben Bethel, Gemstone Resorts
Principal Jeff McIntyre and Cambean Hospitality President Brian Scheinblum.
“What‟s cool about being an independent is the customer tells us what we should be doing, not
the brand,” said McIntyre. “We‟re in the business of making memories.”
Being nimble and capable of reacting quickly to problems and market situations was the
consensus advantage independents have. “We can do what we want when we want,” said
Scheinblum, whose Cambean Hospitality owns and operates four small boutique hotels in South
Beach.
Online travel agencies were the biggest challenge facing independents, the panel agreed.
“Independents have twice the bookings from OTAs,” said Low. “Think about that, there‟s so
much money going out. Meanwhile you‟re calking your window to save money and you‟ve got
an entire wall missing. A lot independent players just aren‟t aware …
“If OTAs are like crack, then flash sales are like meth. Either way, your teeth fall out.”
Stash Rewards has approximately 200 hotel partners taking advantage of its loyalty program for
independents that helps offset franchised chains‟ hugely successful rewards programs.
During the downturn, Scheinblum said, there were many hotels probably “borderline losing
money on every single room they sold through OTAs” because of the reduced rates and high
commissions.
“Capture and keep,” said McIntyre of the strategy after bringing in a customer through an OTA
booking. “We don‟t just look at the 24% (cost), but (OTAs) are also a search engine to us. Many
customers look at pricing and product offerings and then book at the hotel‟s website. There is a
billboard effect.”

He also said OTAs could be a “great tool” for distressed properties, which Gemstone often is
brought on to manage. “As independents, those channels can‟t be ignored.”
Like the OTAs, where franchise partners often get better margins through brand-negotiated rates,
procurement was another area of concern for the independent hotelier. Low said he‟s heard from
his hotel partners that margins they‟re paying for purchasing products can be 25%, while the rate
is as low as 17% for at least one of the large franchise companies.
Bethel, the owner and general manager of the Clarendon, said he‟s ordered products direct from
Amazon.com and also recommended alibaba.com for sourcing and shipping direct from factories
around the world.
Bethel, who had no prior hotel experience, said he‟s not afraid to call other owners and
properties he respects to ask for advice. It was his only education after maxing out credit cards
and using home equity loans to buy the dilapidated building in Phoenix two weeks after he first
considered the idea.
At the Clarendon, he doesn‟t see an ROI in having a sales staff and doesn‟t employ a director of
sales. Instead, he heavily incents his front-desk staff with 20% to 50% commissions for every
room upgrade, early check-in or additional pool pass sold, meaning they can make up to $80,000
per year on their $10/hour salary. “Our front desk staff is so important, not just for loyalty
building, but to increase revenue,” he said.
Even more outside the box, Bethel charged guests for his property taxes during the downturn to
stay afloat when he couldn‟t even make his debt service. A 5% property tax fee was included on
all folios and also listed as a surcharge at all online sites. “We brought in $90,000 initially and it
enabled us to catch up,” he said. “It‟s not what I wanted to do, but at the time was something I
thought was a great idea when we were having problems making ends meet.”
Be Strong If You Want to Finance a Boutique
Hotel
Oct 24, 2012 6:44 AM, By Ed Watkins
Cash Flow Is the Most Important Ingredient
A panel on lending to boutiques said strong and stable cash flow is the most important element in
securing financing.
In the final analysis, finding financing for a transaction involving a boutique or lifestyle hotel
isn‟t much different than for a more traditional branded property. Most speakers on the topic at
last week‟s Lifestyle/Boutique Hotel Development Conference in Miami agreed it‟s all a matter

of strength: a strong story, strong sponsorship and management and, perhaps above all, strong
cash flow.
“In putting together the capital stack for a boutique property, the first questions to come up are
what is the cash flow, how stable is it, how does it compare to the peak of the market and how
much more room is there to grow,” said Frank Nardozza, chairman & CEO of REH Capital
Partners, who spoke on a panel titled „The Boutique Lending Landscape.‟ “If we can articulate
the cash flow, we can then get the interest of capital, both debt and equity.”
Financing is easier for boutique properties in a hot market like Miami, said Suzanne
Amaducci-Adams of Bilzen Sumberg law firm.
While she agreed “cash is king,” attorney Suzanne Amaducci-Adams said capital sources also
look at other factors in considering debt or equity placement for a boutique hotel transaction.
Location, uniqueness of product, food and beverage offerings and sponsorship are on her list of
important items.
“The market is critical. Miami is so hot right now it‟s a lot easier to get financing for a boutique
hotel here,” said Amaducci-Adams, a partner with the Miami firm of Bilzen Sumberg. “The
hotel needs to be unique and part of that often is food and beverage. But, at the end of the day,
it‟s all about sponsorship.”
Still, some significant barriers exist for boutiques that make acquirers, and especially developers,
work harder to get funding for their projects. The consensus among panelists was that boutique
and lifestyle hotels are financeable, but it may cost more to do so. Nardozza speculated while
loan-to-value ratios for financing of a traditional branded hotel may be as high as 70%, it‟s more
like 60% to 65% for non-branded properties or boutique hotels. And debt yields (net operating
income divided by the amount of the loan) tend to be higher, he said. Cassie Resnick, a vice
president of Mast Capital, pegged yields for boutique deals at 9%-10% up to 13% if it‟s a
particularly risky deal.
Craig Greenberg of 21c Museum Hotels said it took a complicated web of financing vehicles to
fund the company‟s first boutique hotel in Louisville, KY.

Another panel at the conference tackled the problem of how to overcome the often-negative
perception lenders have about unbranded and independent boutique hotels. Craig Greenberg,
president of 21c Museum Hotels, acknowledged the issue is especially critical in the markets in
which his firm operates. The company has a successful property open in Louisville, KY, with
another to open next month in Cincinnati, followed by one in northwest Arkansas.
“It‟s definitely more challenging, especially in smaller or medium-sized cities, to get money,”
said Greenberg, who showed the audience an elaborate chart outlining the variety of funding
sources—a mix of tax credits, rebates, grants, equity and traditional recourse bank loans—used
to develop the first 21c. “In that kind of environment, it usually takes a perfect story to put
together a financing package.”
Oliver Striker, a director at UBS Investment Bank, agreed, saying his firm, which provides both
CMBS financing and direct investment, takes a “holistic approach” to evaluating financing
proposals, both from traditional hotels and also boutique and lifestyle properties. While he said
location is a primary factor, it‟s not the only one.
“Gateway cities with high barriers of entry and depth of demand are obviously preferred,” he
said, “but sponsorship is also crucial, especially the depth of experience they have in the sector.
It‟s also important the sponsor has skin in the game, because it forces them to keep their eyes on
the ball.”
Despite these caveats, speakers on both panels believe financing for boutique and lifestyle
products, both branded and non-branded, is becoming more mainstream.
“Because real cash flows are showing up on the bottom lines of boutique hotels, there is more
receptivity in the lending community to funding and capitalizing [these products],” said
Nardozza. “It‟s a more familiar product to guests and a more familiar product to the capital
markets.”


