

Triangulation of epidemiological and programme
data to close the HIV programme gap
Prof R.P.H. Peters

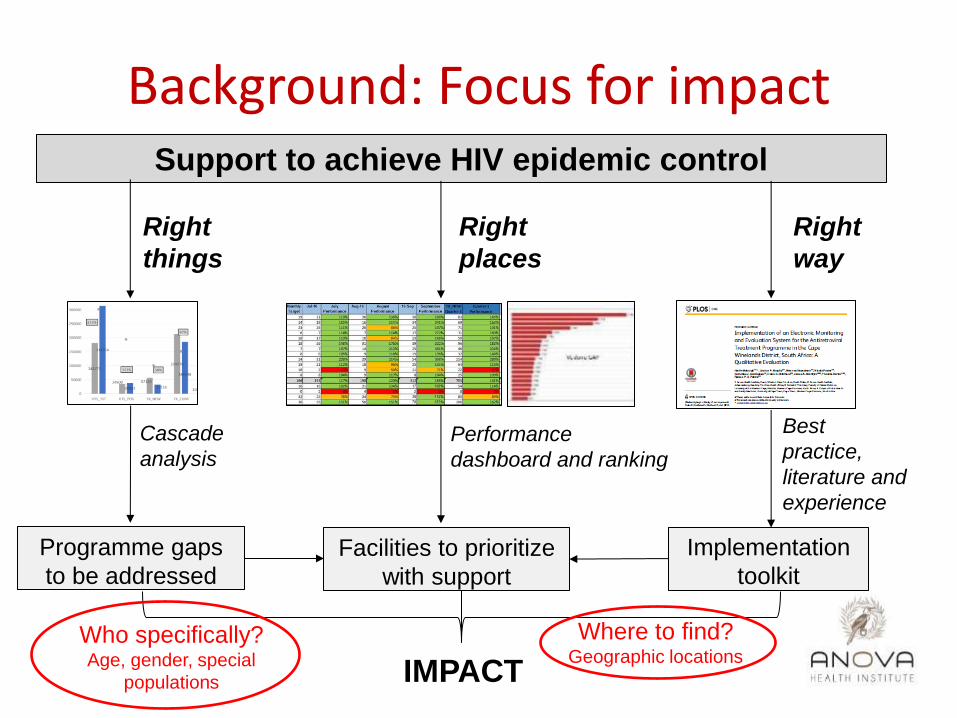
Background: Focus for impact Support to achieve HIV epidemic control
Right
things
Right
places
Right
way
Performance
dashboard and ranking
Cascade
analysis
Programme gaps
to be addressed
Facilities to prioritize
with support
Best
practice,
literature and
experience
Implementation
toolkit
IMPACT
Background: Focus for impact Support to achieve HIV epidemic control
Right
things
Right
places
Right
way
Performance
dashboard and ranking
Cascade
analysis
Programme gaps
to be addressed
Facilities to prioritize
with support
Best
practice,
literature and
experience
Implementation
toolkit
IMPACT
Who specifically? Age, gender, special
populations
Where to find? Geographic locations
Rationale
• ↑ Programme coverage means ↑ data need to inform efficient closure of final gaps
• Programme data ≠ epidemiological data
– Actions based on gaps in programmatic data – Epidemiological data for epidemic control
• ‘Epidemiological’ vs. ‘Programmatic’ projections as alternative approach to inform operations
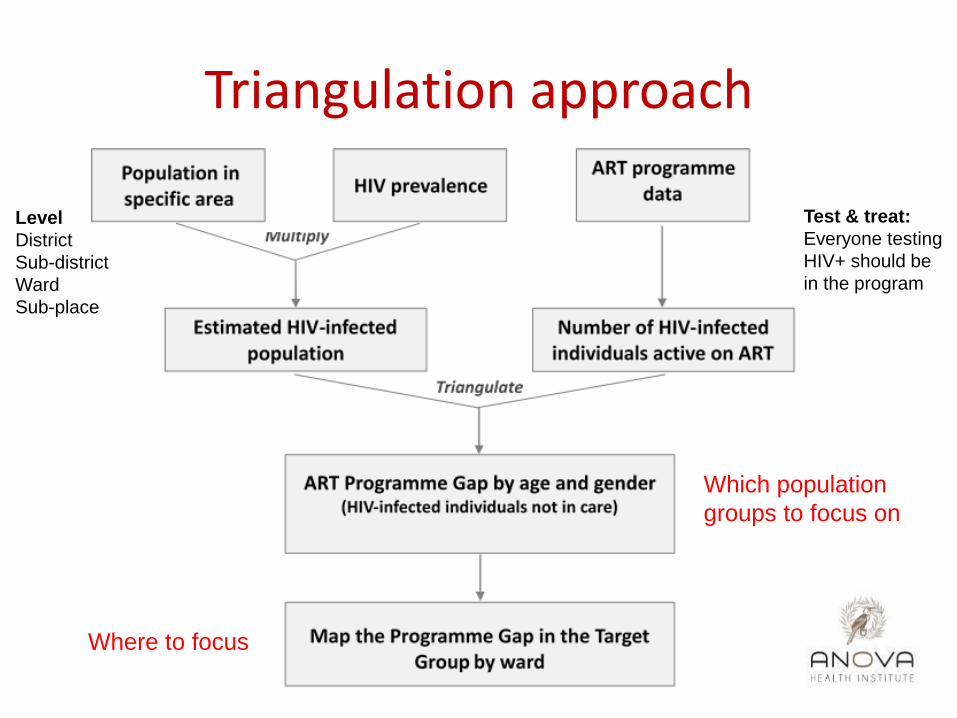
Triangulation approach
Which population
groups to focus on
Where to focus
Test & treat:
Everyone testing
HIV+ should be
in the program
Level
District
Sub-district
Ward
Sub-place

• Epidemiological data
– StatsSa census data at ward level
– Thembisa model data with district HIV prevalence
• Programme data
– TIER.net data provided by local government
– DHIS data provided by local government
Data sources

Triangulation exercise
• Epidemiological gap analysis
– Region C largest % gap
– Region D smallest % gap
• Maturing programme in region D
– Women aged 20-29 years; men 30-39 years as priority population
• “Work to do” in region C
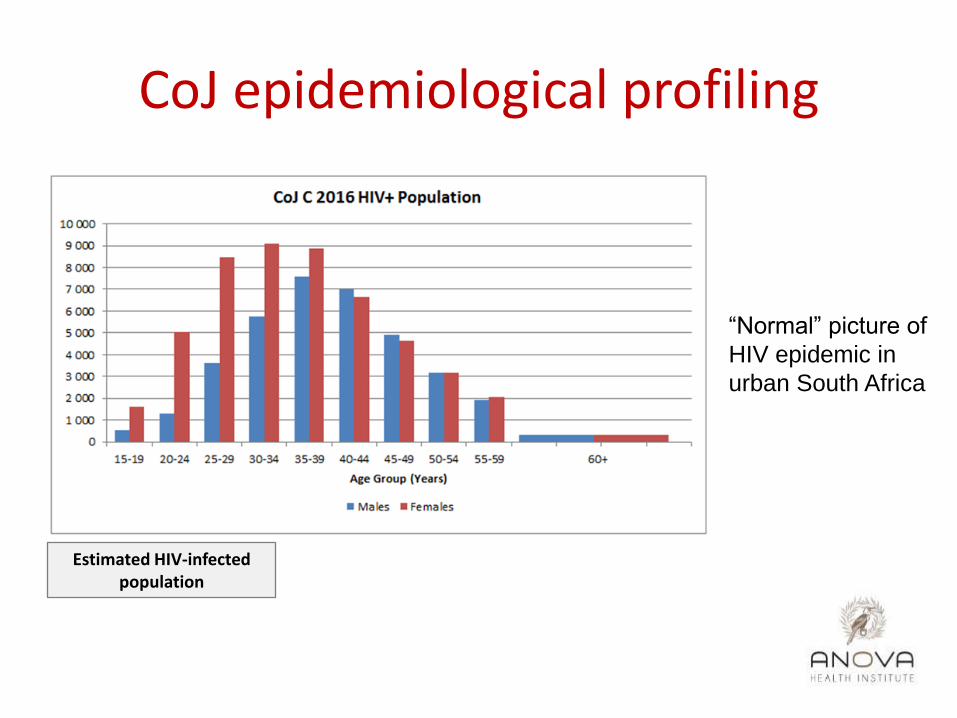
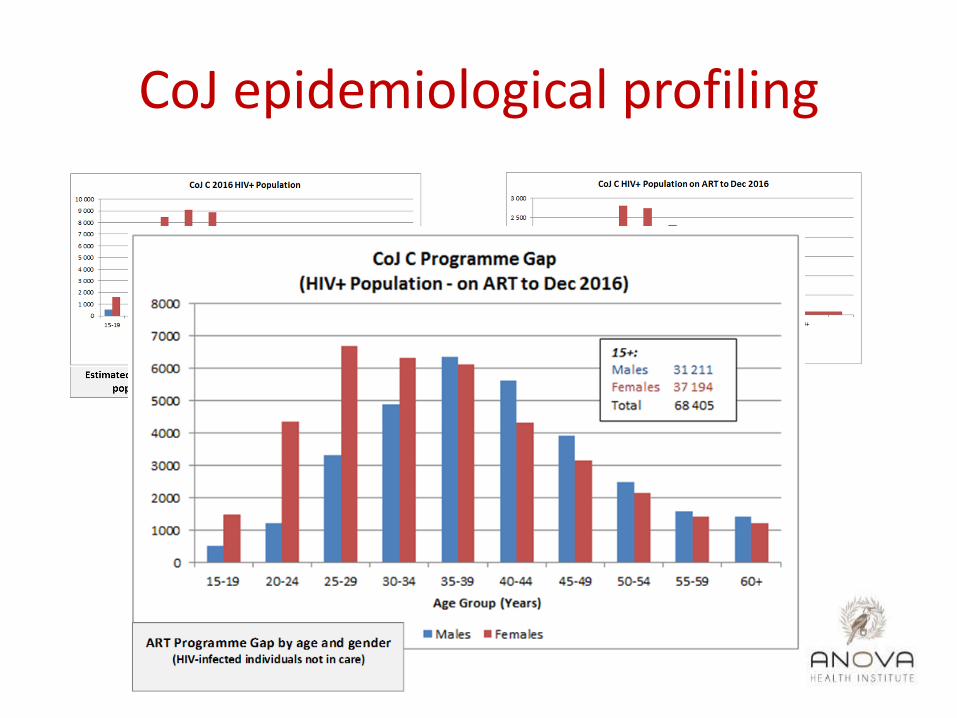
CoJ epidemiological profiling
Estimated HIV-infected population
“Normal” picture of
HIV epidemic in
urban South Africa

Number of HIV-infected individuals active on ART
CoJ epidemiological profiling
CoJ epidemiological profiling
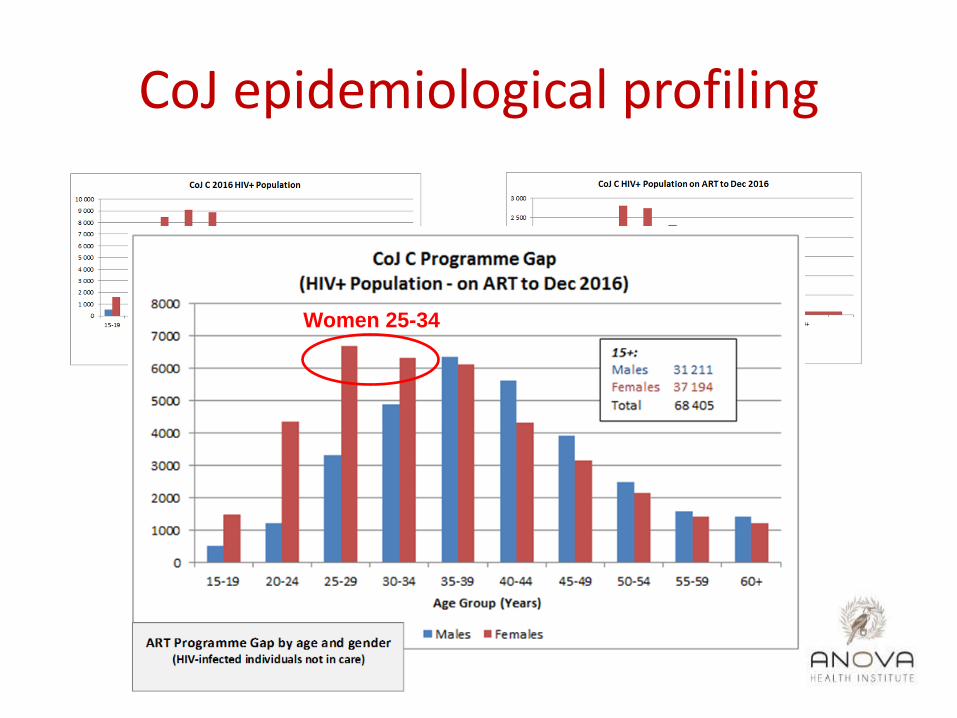
Women 25-34
CoJ epidemiological profiling
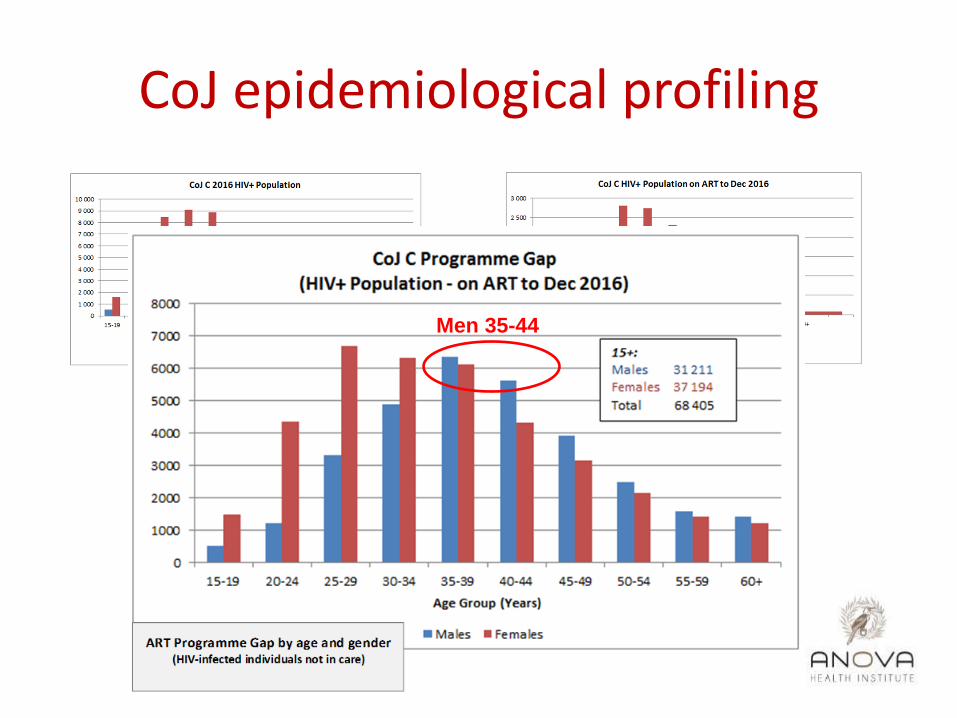
Men 35-44
CoJ epidemiological profiling

CoJ epidemiological profiling
Region C: gaps to close Region D: maturing HIV programme
• Profiling in the context of programme growth
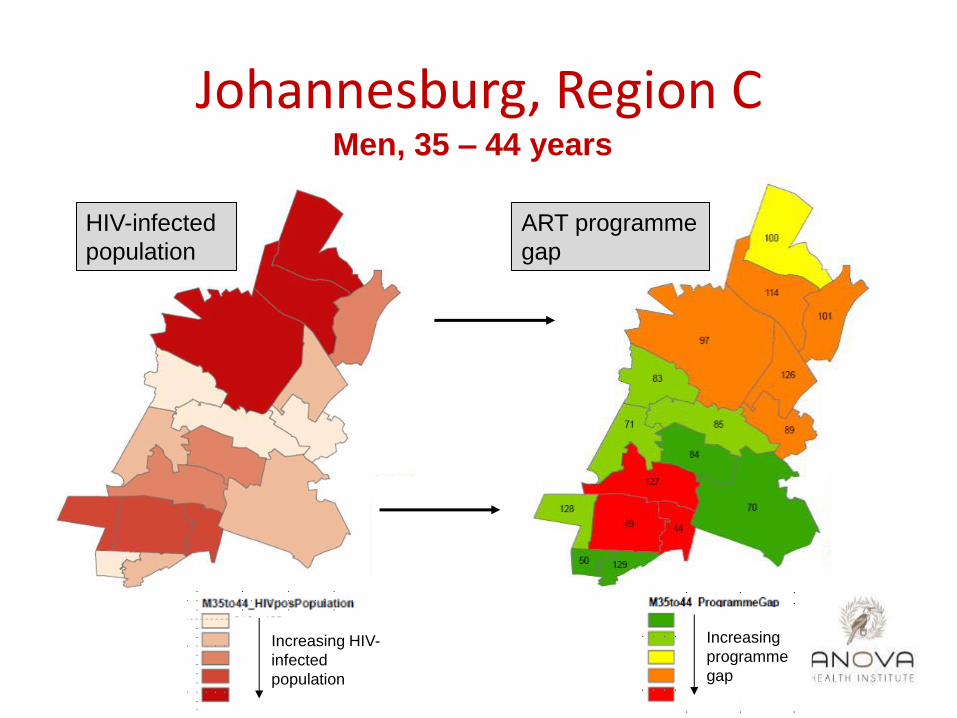
Johannesburg, Region C Men, 35 – 44 years
HIV-infected
population
ART programme
gap
Increasing
programme
gap
Increasing HIV-
infected
population

Johannesburg, Region C Men, 35 – 44 years
ART programme
gap Specific area to
target
Increasing
programme
gap
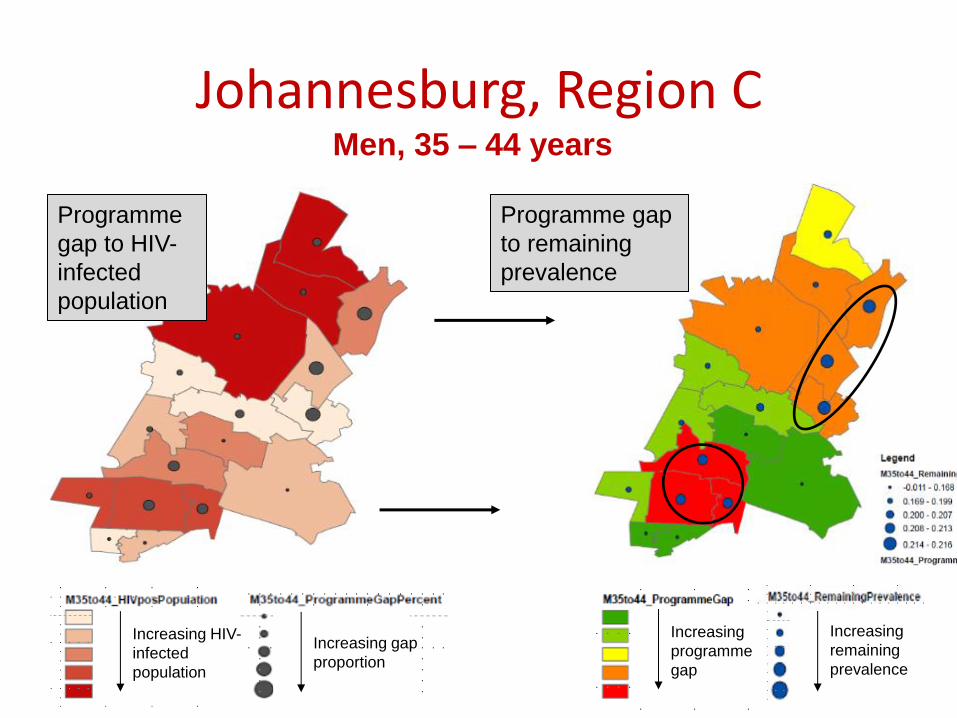
Johannesburg, Region C Men, 35 – 44 years
Programme
gap to HIV-
infected
population
Programme gap
to remaining
prevalence
Increasing gap
proportion
Increasing
remaining
prevalence
Increasing HIV-
infected
population
Increasing
programme
gap

Lessons learnt
• Triangulation reports used in Anova’s strategic information toolkit to direct support activities to support reaching the 90s
• “Known” and “new” target populations and areas identified
• Potential methodological limitations
– Takes all HIV into account instead of 90-90-90
– Timestamp and breakdown level of data used
– Assignment of drainage facility
– Medical insurance not taken into account yet
Way forward
• Triangulation data is linked to operational support activities
– Directed specific operations based on profiling of specific populations
– Establishment of feedback mechanism: ‘real-time monitoring’ through dashboard
– Evaluation of impact of ‘data triangulation-driven’ support

Conclusion and recommendation
• Our triangulation approach can be useful in directing operations to close programme gaps
– Target population (age, gender)
– Target area (geographic)
• Evaluation of implementation of this approach is underway
Contact details:
Prof Remco Peters
Email: [email protected]
Tel.: +27 11 5815000


