

Biweekly Oceanic and Atmospheric Tropical Instability Waves
1. Are the Oceanic TIWs forced by the surface wind stress vectors?
2. Are the O-TIWs forcing the atmosphere?
3. Could the Moon be the trigger?
Claire Perigaud, JPL, OVWST May2009

Oceanic TIWs • TIWs in the 3 tropical oceans have been observed long ago as (10-to-40day) cross-equatorial current reversals.
• As early as Seasat and Geosat, TIWs were identified as Mixed-Rossby-Gravity-Waves (MRGW).
• TIWs and MRGWs are simulated by all Primitive Equation ocean models, regardless of the wind stress forcing. See experiments forced by climatology.
TIW characteristics in models are however very sensitive to the wind stress forcing. See 1993-to-2006 experiments forced by ERA (Mercator), NCEP+TPJ (ECCO), 1999-to-2006 Intermediate Coupled Model forced by (TRMM+QSCAT) daily variability (ICM).

SL dispersion diagram from altimetry
Oceanic MRGW: periods from 10 to 35 days, phase speed propagation to the West, group velocity to the East.
14.7 days

TIW forced by ERA in Indian Ocean (Mercator) meridional wind stress (dyn/cm2) and surface current (m/s) along the equator
On top of 20-to-40 day cross-equatorial current reversals propagating at 30-to-50 cm/s, ~15 day reversals propagate much faster at ~200 cm/s. ~15 day reversals are also in ERA, propagating slightly faster.

TIW forced by QuikSCAT in Indian ICM
~15 day reversals are present in QSCAT all throughout the year, stronger than in other winds model TIWs dominated by ~15 days. Wind reversals trigger and lead the MRGWs in wind FORCED ocean experiments.
meridional wind stress (dyn/cm2) and surface current (m/s) along the equator
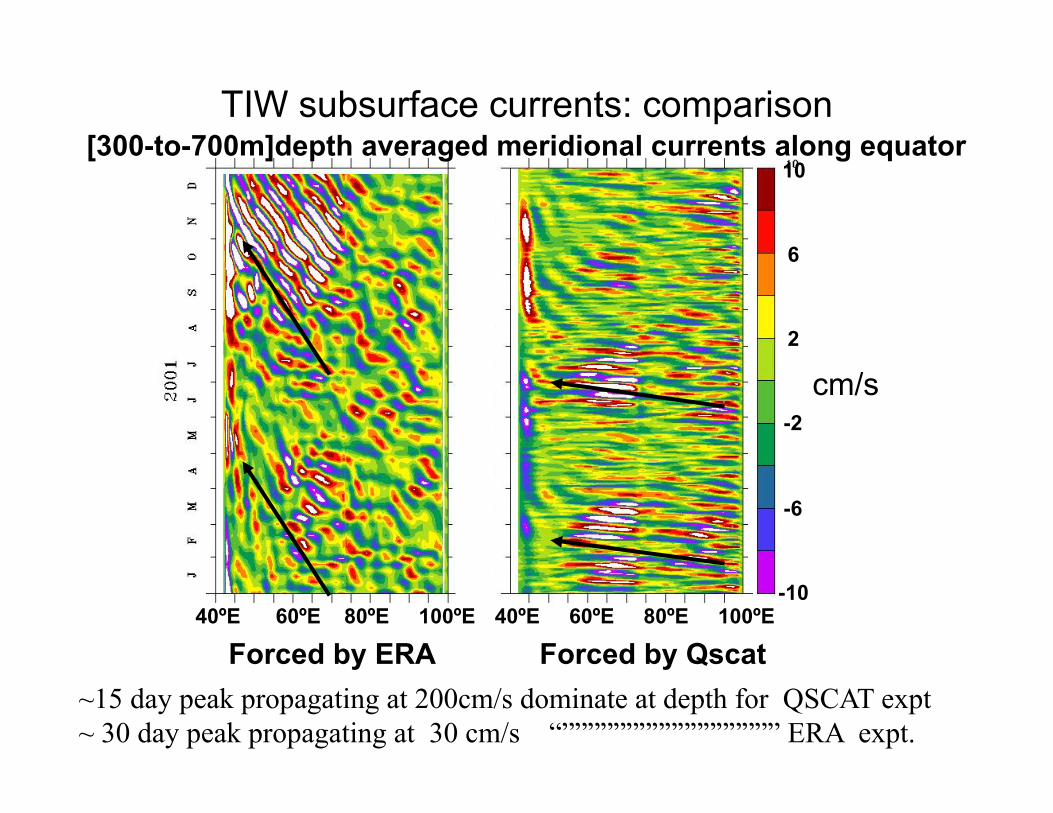
TIW subsurface currents: comparison
40ºE 60ºE 80ºE 100ºE 40ºE 60ºE 80ºE 100ºE
10
6
2
-2
-6
-10
[300-to-700m]depth averaged meridional currents along equator
Forced by ERA Forced by Qscat
cm/s
~15 day peak propagating at 200cm/s dominate at depth for QSCAT expt ~ 30 day peak propagating at 30 cm/s “””””””””””””””””” ERA expt.
Spectra QSCAT and Sea Level 14.7days
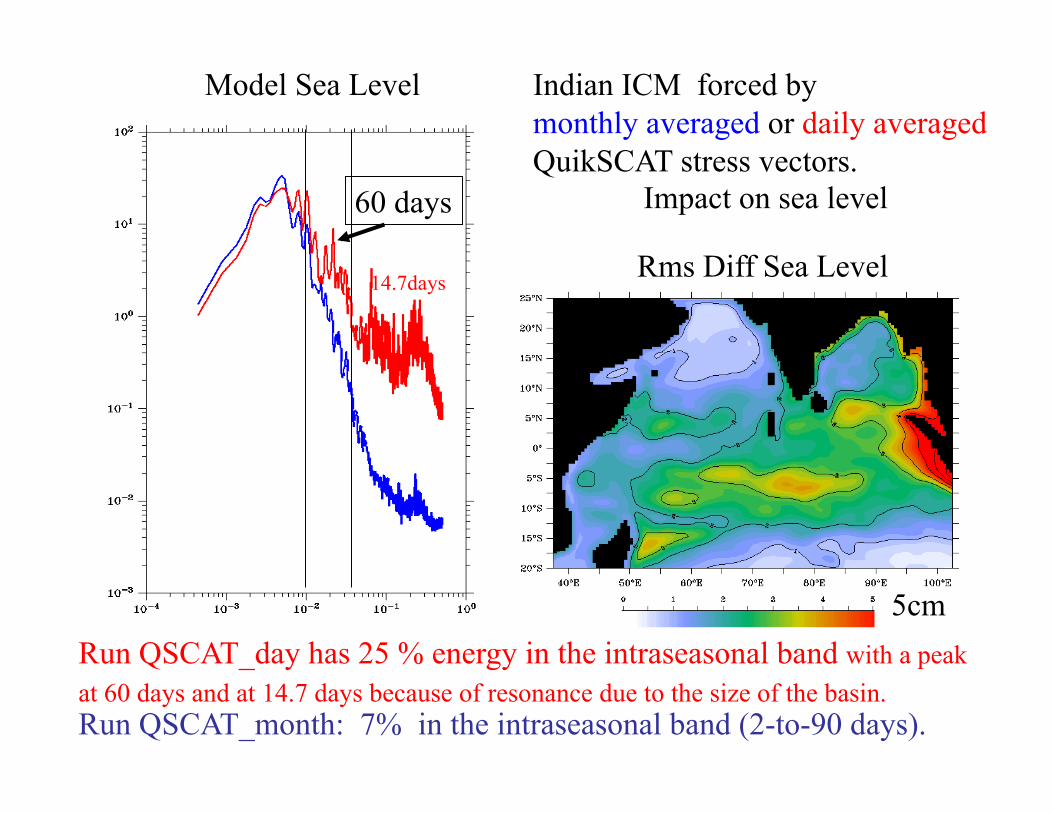
Run QSCAT_day has 25 % energy in the intraseasonal band with a peak at 60 days and at 14.7 days because of resonance due to the size of the basin. Run QSCAT_month: 7% in the intraseasonal band (2-to-90 days).
Indian ICM forced by monthly averaged or daily averaged QuikSCAT stress vectors. Impact on sea level 60 days
5cm
Rms Diff Sea Level
Model Sea Level

Biweekly TIWs in TY and SL forced by QSCAT
0 0.2 0.4 day-1
14.7 days
14.7 days

TY and SL NCEP or ECCO
SLantisym ECCO
14.7 days 14.7 days

14.7 days
Biweekly Atmospheric MRGW OLR(-) [80ºE; 10º]
From Wheeler and Kiladis: Westward MRGW are known in the 2 to 10 day band. Actually OLR data also have a 14.7 day peak

OLR biweekly signal in all tropics (a)
(b)
(c)
Biweekly OLR signals are in the tropical Pacific TIW zone too.
15 days
6 hourly OLR data from 1999 to 2006. Rms total and filtered [10-to-50 day] And ratio. Box 1 for Pacific TIW index = [1N-3N, 238E-242E]

QSCAT vorticity
FIG : Graphe d’Hovmüeller pour la vorticité du vent
1
1
1
The 15 day peak of Pacific TIW is in QSCAT vorticity like in OLR.

Correlation (QSCAT, OLR)
((OLR,curl) in blue significant level >95%: highlighted
FIG : Corrélation OLR/Divergence (rouge) et OLR/Vorticité (bleu) pour les anomalies totales (a) et filtrées (b).
Correlation between OLR and divergence is significative and maximum at lag = 0:
Correl= +0.4 (total) Correl= + 0.3 (filtered)
In the Eastern Pacific TIW

TIW in the Eastern Pacific from SST
SST fluctuations have a longer period: 20 days. QSCAT divergence (15 day period) propagate westward.

Correlation (SST, QSCAT)
(a)
(b)
Correlation between SST and divergence is significative. It is maximum at lag= 2 day lead for SST:
Correl= - 0.6 (total) Correl= - 0.3 (filtered)
( ) in red ( ) in blue significant level >95%: highlighted

TIW Forced? Coupled? Or Conditionned by the Moon?
Sidereal period = 27.322 days --- > 13.66 days
Nodical period = 27.212 days
Anomalistic period = 27.555 days
Synodic period = 29.5306 days ---> 14.77 days
Lunar Nodal precession period is 18.6 yrs

(Moon-Earth) center of mass travels North/South
The center of mass is ~4700km away from the Earth center. Because the Earth axis is so tilted, the mass center moves from South to North in ~14 days (from ~28S to ~28N in years of max standstill like in 2006) and back from ~28N to ~28S during the following ~14 days.
Equator
~28N at day0
~28S at day0 +14day

Orbit Parameters
The Orbital plane intersects the Reference plane. along lone of nodes ---> 3 angles: Ω=longitude of Asc node, ω=argument of perigee, ν=true anomaly.
Reference plane for: <- Earth around Sun= ecliptic plane <- Moon around Earth=equatorial plane
Fixed stars

(Moon-Earth) mass center biweekly travel in Jun/Jul
Full Moon in South in Jun-Jul
New Moon in North ~14 days after or before
The Sun is on the right of this slide.
Displacement on orbit around the Sun is towards us.

(Moon-Earth) mass center biweekly travel in Fall
waxing quarter in South in Sep-Oct
waning quarter in North ~14 days later
Direction of (Moon-Earth) displacement on orbit around Sun
The Sun is in the back of this slide.

Moon Climatology of QSCAT

Moon Climatology of TRMM

Moon Climatology of QSCAT and TRMM
Units of time (1 to 12) are “month-of-Moon-Clim”, meaning 12 months in 29.53 days each”month” = 2.46 days
TRMM


SWELL POOLS in the tropics
There is a biweekly signal in the significant wave height monitored by TPJ.
---- New Moon phase …. Full Moon phase.
Swell modifies the direction of the Ocean Wind Stress Vectors. See note.

Conclusion and Perspectives • Biweekly signals are found in QSCAT, TMI,
TRMM, OLR, Significant Wave Height, and sea level with MRGW characteristics.
• Possible Luni-Solar gravitational triggering of TIWs
• COUPLED models fail to reproduce observed characteristics of TIWs. Should we add the biweekly Luni-Solar gravitational forcing?
• Are the strong biweekly swell variations introducing larger scale momentum in the Ocean-Wind stress important for climate?


![Compact and Discreet - yaesu.ru · Battery Life [5-5-90 duty with battery saver]MDC-1200® Features: - MDC-1200® ANI - MDC-1200® Call Alert - MDC-1200® Sel Call - MDC-1200® Radio](https://static.documents.pub/doc/80x56/5e80d3de6005c20fb639820d/compact-and-discreet-yaesuru-battery-life-5-5-90-duty-with-battery-savermdc-1200.jpg)
