
UK Journal of Pharmaceutical and Biosciences Vol. 2(5), 12-26, 2014 RESEARCH ARTICLE
Chemically Modified Carbon Sensors Mixed or Single for the Determination of
Cardiovascular Drug Nafronyl Oxalate in Bulk, Praxilene and Human Fluids
Amal F. Khorshid
Pharmaceutical Analytical Chemistry Department, Faculty of Pharmacy, Nahda University, NUB, Beni-Sueff, Egypt
Article Information
Received 8 August 2014
Received in revised form 28 Oct 2014
Accepted 30 Oct 2014
Abstract
Three novel modified carbon paste sensors (CMCPs) were proposed for the determination of
nafronyl potentiometric in bulk, pharmaceutical dosage form; human plasma/urine. The sensors
were based on an ion-pair associates of nafronyl silicotungstic acid (Nf-St) (sensor 1), nafronyl
silicomolybdic acid (Nf-SM) (sensor 2), a mixture of [(Nf-St) + (Nf-SM)] (sensor 3). The modified
sensors showed Nernstian slopes ranging from 58.5±0.5-60.7±0.5 mV over the concentration
ranged from 1.0 x 10⁻⁷-1.0 x 10
-2 M and pH 2.0-6.0 with a detection limit 0.1 nM. The sensors
exhibited good selectivity for nafronyl with respect to inorganic /organic cations, sugars and
amino acids. The calibration curve, standard addition and potentiometric titration methods were
applied for the determination of nafronyl ion in its bulk powder, pharmaceutical dosage form, and
human fluids plasma/urine taken from a healthy volunteer and for the monitoring Praxilene tablets
in vitro dissolution rates. Sensor 3 was successfully used for the determination the solubility
products of ion-pair associates. The results were excellent and satisfactory recovery comparable
to those obtained with the British Pharmacopoeia.
Keywords:
Nafronyl oxalate Nf-(COOH)2
Carbon-paste Sensor
Potentiometry
Praxilene tablets
Vitro-dissolution rates
Solubility product
*Corresponding Author:
E-mail: [email protected]
Tel.: +201280875558
1 Introduction
Naftidrofuryl oxalate [Nf-(COOH)2] is known as nafronyl oxalate,
which is an alpha-(1-Naphthylmethyl)-2- tetrahydrofuranpropionic
acid diethylaminoethyl ester oxalate. The empirical formula of
nafronyl oxalate is (C26H35NO7) and its molecular weight is (mol. wt.
473.56) as shown in Fig. 1. Naftidrofuryl oxalate [3200-06-4] belongs
to a group of medicines called vasodilator in the treatment of
peripheral and cerebral vascular disorders1,2
. Many sophisticated
methods of analytical were showed to determine [Nf], including
chromatographic3-7
, spectrophotometric8, electrochemical method
9-11,
phosphorimetric12-15
. The spectrophotometric methods of drug
analysis usually suffer from poor selectivity. Others include a flow
injection analysis with fluorescence optosensor16
. Many of these
methods involve derivatization reactions, several time-consuming
manipulations, extraction steps, that are liable to various
interferences, and are not applicable to colored and turbid solutions
either. No methods in the literature for determination [Nf] by chemical
modified carbon paste sensor (CMCPs).
The advantages (CMCPs), the cell voltage is related to the activity or
concentration of the desired ionic compound, are generally used. So
measuring cells consisting of the CP-ISE and proper reference
sensor can be used to determine the activity or concentration of the
ion of interest. From the view of equilibrium potentiometry, the
composition or chemically modified of carbon pastes makes and
exhibits the pasting liquids usually as a good extraction ability
against neutral electroactive species of the type of non-dissociated
weak acids, neutral metal chelates or ion-associates. The potential of
the sensor containing such an organic solvent extract is
predominantly governed by an ionic exchange at the interface
between the organic phase of the sensor and the sample
solution17,18
.
This work describes the construction, potentiometric
characterization, and analytical application of a three novel
naftidrofuryl-chemically modified carbon paste sensors (Nf-CMCPEs)
based on the use of naftidrofuryl silicotungstate (Nf-ST), naftidrofuryl
silicomolybdate (Nf-SM) and a mixed of (Nf ST+Nf- SM) dissolved in
2-NPPE as pasting liquid. In vitro dissolution testing serves as an
important tool for characterizing the biopharmaceutical quality of a
UK Journal of Pharmaceutical and Biosciences
Available at www.ukjpb.com ISSN: 2347-9442

Khorshid et al. Chemically Modified Carbon Sensors
UK J Pharm & Biosci, 2014: 2(5); 13
product at different stages in its lifecycle. The results presented in
the paper show that the sensor constructed for naftidrofuryl ion has a
wide concentration range, low limit of detection, good Nernstain
slope, and high selectivity over a wide variety of other cations and
compared with sensors previously reported9-11
. In addition, the
determination of solubility products of the sparingly soluble
naftidrofuryl salts based on CMCPs fabricated in the laboratory and
was compared with the solubility products determined by
potentiometric / conductimetric method.
Fig 1 Chemical structure of Naftidrofuryl oxalate
2 Experimental
2.1 Reagents and materials
All reagents used were chemically pure grade. Doubly distilled water
was used throughout all experiments. Naftidrofuryl oxalate and its
pharmaceutical preparation (Praxilene tablets, 200 mg/tablet) were
provided by MinaPharm-Egypt under license of MERK France.
Graphite powder, dibutyl phthalate (DBP), dioctyl phthalate (DOP),
tributyl phthalate (TBP), tricresyl phosphate (TCP), 2-nitrophenyl
phenyl ether (2-NPPE), silicotungestic acid (STA), silicomolybdic
acid (SMA) were selective products from Aldrich.
Chloride solution with 0.5 M of each of the following cations: K+, Na
+,
NH4+, Ni
2+, Co
2+, Cu
2+, Zn
2+, Ba
2+, Mn
2+, Cr
3+, Mg
2+, and Fe
3+solutions
were obtained from Merck. Glucose anhydrous, lactose
monohydrate, maltose, urea, ascorbic acid, aspirin, L-threonine, L-
lysine, L-cystine, and L-glycine were obtained from Aldrich. Plasma
was used within 24 h and provided by VACSERA (Giza, Egypt) while
urine samples were obtained from healthy volunteers. Corn oil,
sodium hydroxide and hydrochloric acid are from chemical stores,
(Giza-Egypt).
2.2 Apparatus
2.2.1 The Electrochemical system
The potentiometric measurements were carried out at 25±1 oC with a
Jenway 3515 digital pH/mV meter with a WTW-packed saturated
calomel sensor (SCE) was used as an external reference sensor.
The electrochemical system was as follows: CMCPS/test
solution//SCE. The dissolution was studied using USP XXXII19
method with apparatus II20
, which was provided in vitro dissolution
testing for controlled/modified-release preparations, and more
uniform flow profile. The apparatus used for this purpose is model
"SR8Plus", CA USA Hanson Research; with number "73-100-116"
and the spectrophotometer double beam instrumentUV-1800
Shimadzu (Japan).
2.3 Preparation of ion-pair
The ion-exchangers, naftidrofuryl silicotungstate (Nf-ST), naftidrofuryl
silicomolybdate (Nf-SM) were prepared by addition of 50 ml of
1.0x10⁻² M naftidrofuryl oxalate Nf-(COOH)2 solution to 50 ml of
2.5x10⁻³ M STA and SMA. The resulting precipitates were left in
contact with their mother liquor overnight to assure complete
coagulation. The precipitates were washed thoroughly with distilled
water, then filtered and dried at room temperature and ground to fine
powder. The resulting precipitates were left in contact with their
mother liquor overnight to assure complete coagulation. The
formation and purity of the ion-pairs and ion-associates, chemical
compositions of the precipitates were checked by elemental analysis
for carbon, hydrogen and nitrogen at the Micro Analytical Center,
Faculty of Science, Cairo University.
2.4 Preparation of carbon paste sensors
Chemically modified carbon paste sensors [CMCPS-Nf] were
prepared as previously described21
. The sensor was used directly for
potentiometric measurements without preconditioning requirements.
A fresh surface of the paste was obtained by squeezing more out.
The surplus paste was wiped out and the freshly exposed surface
was polished on a paper until the surface showed shiny appearance.
2.5 Effect of pH on the sensor potential
The effect of pH of the test solution in batch measurements, on the
potential values of the sensor system in solutions of different
concentrations (1.0x10⁻³, 1.0x10
-4 and 1.0x10
-5 M) of the Nf-(COOH)2
was studied. Aliquots of the drug solution (50 ml) were transferred to
100 ml titration cell and the tested ion-selective sensor in conjunction
with the calomel reference sensor, and a combined glass sensor
were immersed in the same solution. The mV and pH readings were
simultaneously recorded. The pH of the solution was varied over the
range of 1.0-10.0 by addition of very small volumes of 2 M HCl
and/or (0.1-1.0 M) NaOH solution. The mV-readings were plotted
against the pH-values for the different concentrations.
2.6 Temperature effect on the sensor
The study of thermal stability of the sensors, calibration graphs were
constructed at different test solution-temperatures covering the range
25-50˚C. The slope, the standard sensor potentials (Eo), usable
O
O
O
N
O
O
HOOH

Khorshid et al. Chemically Modified Carbon Sensors
UK J Pharm & Biosci, 2014: 2(5); 14
concentration ranges, and response time of the sensors
corresponding to each temperature were reported.
2.7 Sensors selectivity
The matched potential method is unique in that it depends neither on
the Nicolsky-Eisenman equation nor on any of its modifications. This
method was recommended in 1995 by IUPAC as a method that gives
analytically relevant practical selectivity coefficient values. To
determine the selectivity coefficients of different interfering ions for
the studied sensors, a reference solution (aA) is added an amount of
the drug to give a final concentration of (a-A), the shift in potential
change (ΔΕ) is thus measured. To a reference solution containing the
same concentration (aA), a certain amount of interference ion that
cause the same (ΔΕ) value is thus determined (Aj). The following
equation is used to calculate the selectivity values22,23
ofpot
JNf, zKlog :
Where: is the initial concentration of drug, adrug is the activity of
the added drug and aj is the activity of the added interfering ion
producing the same increase in potential.
In addition, the separate solutions method (SSM) was used. Two
values of potential were determined for the same drug concentration
and the interferents. The selectivity values of pot
JNf, zKlog are
calculated using the following equation
24:
1/zz12pot
JNf,][Jlog[Drug]log
S
EEKlog z
Where: E1 and E2 are the sensor potentials of 10−3
M solution of each
of the Nf drug and interfering cation, Jz+
, respectively and S is the
slope of the calibration graph.
2.8 Determination by Standard addition method
2.8.1 In bulk powder
The potentiometric determination by the standard additions method
was applied, in which a known incremental change is made through
the addition of standard solution of the sample. This was achieved by
adding known volumes of standard Nf-(COOH)2 drug solution to 50
ml water containing different amounts of the investigated drug in its
pure state. The change in mV reading was recorded for each
increment and used to calculate the concentration of the drug in
sample solution using the following equation24
:
Where Cx is the concentration to be determined, Vx is the volume of
the original sample solution, Vs and Cs are the volume and
concentration of the standard solution added to the sample to be
analyzed, respectively, ΔΕ is the change in potential after addition of
certain volume of standard solution, and S is the slope of the
calibration graph.
2.8.2 In dosage form
For analysis of tablets of drug, the contents of five coated (Praxilene
tablets, 200 mg/tablet) were powdered and an accurately weighed
(200-250 mg) portion from each was mixed with 50 ml doubly
distilled water, shaken in a mechanical shaker for about 30 min and
filtered into a 100 ml volumetric flask, the solution was completed to
the mark with doubly distilled water and shaken. Different volumes of
the solution (1.0-10 ml) were taken and subjected to the standard
additions technique of the potentiometric determination.
2.8.3 In human fluids
In spiked human plasma three of centrifugation 20-ml stoppered
shaking tubes containing 0.5 ml Nf-(COOH)2 drug solution from the
concentration 1x10⁻³, 1x10
-4 and 1x10
-5 M and spiked with 4.5 ml
plasma separately to each tube. An acetate buffer pH 4 was added
to the plasma until adjusted the pH. The modified sensor was
immersed in conjunction with the calomel electrode in these
solutions and then washed with water between measurements. The
emf produced for each solution was measured by the proposed
sensor, and the concentration of Nf-(COOH)2 drug was determined
from the corresponding sensor calibration and standard addition
methods.
In spiked urine five ml urine were putted to a 100 ml volumetric flask
and spiked with different quantities of the concentrations from
1.0x10⁻⁶
to 5.0x10⁻⁴ M drug Nf-(COOH)2 drug then left stirred for 5
min, completed to the mark with doubly bidistilled water. A small
volume of 0.01 M HCl (0.1– 2.0 ml) was added to adjust the pH
ranging from 4 to 5. This spiked urine was subjected to the standard
addition method for drug determination.
2.9 Determination by potentiometric titrations
An aliquot of the Nf-(COOH)2 drug containing different weights
ranging from 4.73-47.36 mg was dissolved into 50 ml by bidistilled
water, the resulting solutions were titrated against 0.0025 M SMA
and 0.0025 M STA using the corresponding sensor(s). The end
points were determined from the conventional S-shaped curves by
the first and second derivative plots. The same procedure was
applied for the tablets.
2.10 Content uniformity assay of Praxilene tablets
Vs Vx Cx = Cs ( ـــــــــــــــ
) (10
n(ΔΕ//S)ــــــــــــــ -
)-1
Vx+Vs Vs+Vx

Khorshid et al. Chemically Modified Carbon Sensors
UK J Pharm & Biosci, 2014: 2(5); 15
A tablet of Praxilene, (200 mg/tablet) was immersed in the
measuring flask for measuring each sensor was immediately putted
in the sample solution three times and then washed between each
individual measurement with distilled water to reach steady potential.
The content uniformity was evaluated from the calibration graph by
using the mean potential. For the spectrophotometric measurements
by employing UV absorbance λ max 283 nm with the standard
solution.
2.11 Determination of the solubility product constant
About 0.5 g portion of each ion-associate Nf4-ST and Nf4-SM was
added to 50 ml distilled water. The solution were shaken for about 24
h and left to stand for a week to attain a stable equilibrium. Then,
each saturated solution was decanted to a dry beaker and the
equilibrium concentration of drug ion present was determined
potentiometriclly using the corresponding sensors by the standard
additions method, and hence the solubilities and the solubility
product constants of the ion associates were calculated. The
conductivity of these solutions were measured at 25oC and the
specific conductivities (o), corrected for the effect of solvent, were
calculated and used to obtain the equivalent conductivities () of
these solutions. Straight line plots of versus √c were constructed
and 0 Nf-(COOH)2 , 0 STA and 0 SMAwere determined from the intercept
of the respective line with the -axis. The activity coefficients of the
ions employed were taken as unity because all the solutions were
sufficiently dilute. The values of 0 (Nf-ST) and 0(Nf-SM) were
calculated using Kohlrausch's law of independent migration of ions25
.
The solubility (S) and solubility product (Ksp) of a particular ion
associate were calculated using the following equations:
S = Ks x 1000 0 (ion-associate),
Ksp = 256 S5 for 1:4 ion-associates
Where Ks is the specific conductivity of a saturated solution of the ion
associate, determined at 25oC and corrected for the effect of solvent.
The saturated solution was made by stirring a suspension of the
solid precipitate in distilled water for 60 min and then leaving it for 24
h at 25oC before measuring the conductivities.
2.12 Dissolution
One tablet of Praxilene, (200 mg/tablet) was placed in one vessel of
tablet dissolution instruments apparatus 2 (paddle method). In vitro
release study, the testing liquids, prepared from gastric media permit
the dissolution medium pH 1.2 (900 ml of 0.01 M HCl) was
maintained at 37±0.5˚C for 2 h. The dissolution speed of the
naftidrofuryl tablet is measured with gentle agitation (60 rpm), to
come close to physiological conditions (coated tablet). At intervals
time, the investigated sensor in conjunction with (SCE) reference
sensor recorded the potential values and the amount of releasing
was calculated from the calibration graph.
For the spectrophotometric measurements, 5.0 ml aliquots of the
dissolution solution were withdrawn, filtered, diluted with 0.01 M HCl
and the concentration of samples was analyzed using UV
spectrophotometer (1800, Shimadzu, Japan) and the absorbencies
were measured at λ max 283 nm. A calibration graph was used for
drug release calculation.
3 Result and Discussion
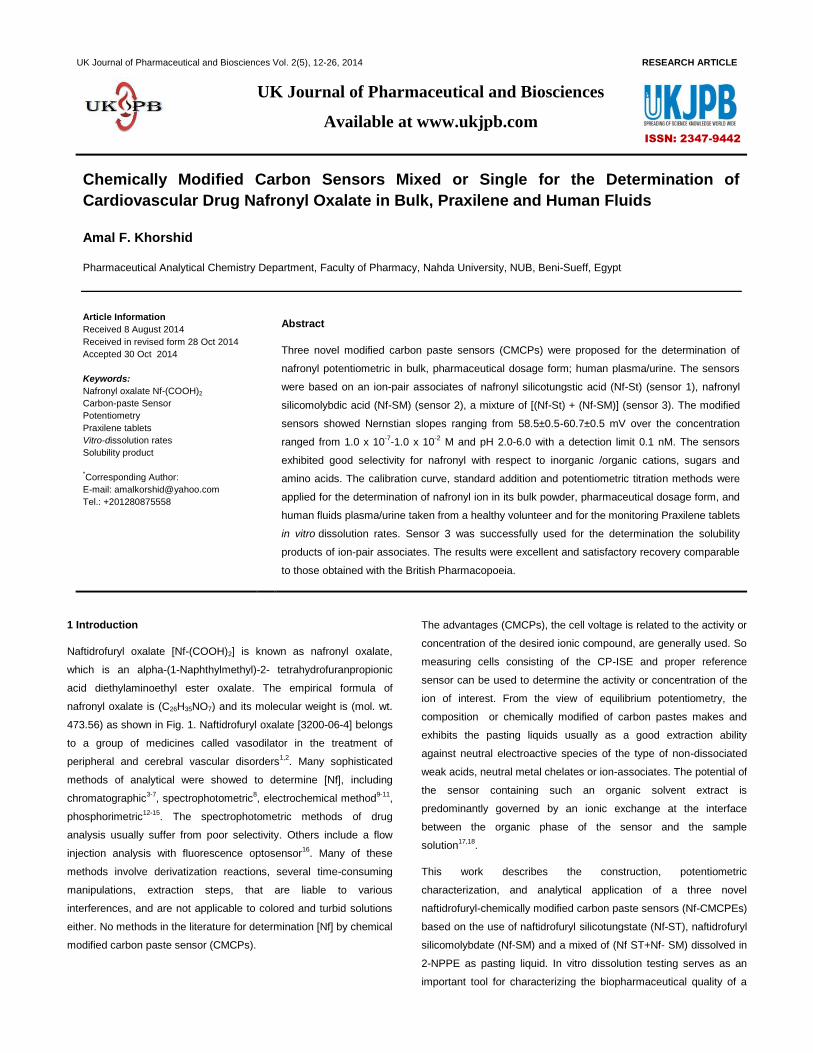
3.1 The nature of binder and the effect of composition
It is well known that, the sensitivity and linearity for a given CMCPs
depend significantly on the nature with the amount of the modifier in
the paste and the ratios of ion-exchanger(s)/graphite/binder that
significantly influence the sensitivity and selectivity of sensors. For
this reason, the influence of the binder type and its quantity on the
characteristics of the studied sensors was investigated by using five
binder with different polarities including TCP, DOP, DBP, TBP and
2-NPPE as shown in table 1. In addition, five pastes of varying
nature and ratios of ion-exchanger(s)/graphite/binder were prepared
for the systematic investigation of each paste composition as shown
in the same table. As can be seen from the emf-pDs plots Fig 2 the
sensor with 2-NPPE as a solvent mediator produced the Nernstian
response, , likely due to better dielectric characteristics of 2-NPPE
comparing to other solvents, and the ability of 2-NPPE to extract
naftidrofuryl ions from the aqueous solution to the organic paste
phase.
Trials are done to improve the performance characteristics of the
sensors, as the presence of a mixture. When mixed different
percentages of Nf-SM ion-exchanger, to Nf-ST, it is found that,
mixed (2.5% Nf-ST +0.5% Nf-SM), is the best, where the sensor
improves, its slope increases from -59.0±0.5, -58.5±0.5 for Nf-ST,
Nf-SM respectively to -60.5±0.5mV/decade and the linear range
increases slightly from 2.50x10⁻⁸-1.00x10
-3, 5.00x10
-8-1.00x10
-3 to
1.25x10⁻⁸-5.00 x 10
-2 M and the detection limit reaches to 0.1 nM as
shown in table 2.
3.2 Reproducibility of the Sensor
The examination of the repeatability for the potential reading of the
Nf-ST/CMCP sensor was taken by the subsequent measurements in
1.0 x 10⁻³ M Nf-(COOH)2 solution then followed by measuring the first
set of solution at 1.0 x 10⁻⁴ M Nf-(COOH)2. The standard deviation
values for each sensor are given in table 3 by measuring emf for five
replicate measurements. The obtained values indicate the excellent
repeatability of the potential response of the sensors. The slope of
the calibration graph obtained by the sensors was found to decrease

Khorshid et al. Chemically Modified Carbon Sensors
UK J Pharm & Biosci, 2014: 2(5); 16
slightly after several times of use, which may be attributed to surface contaminations.
Table 1 Effect of binders on the CP sensor modified by Nf-ST ion exchangers at 25.0±0.1 °C
LOD (M)
Slope
(mV/decade)
Composition% (w/w)
R(s) C.R. (M) binder graphite Nf-ST
TCP
≤7 7.90 x 10⁻⁷
1.00 x 10⁻⁶-5.00 x 10
-3 -55.5±1.5 44.5 55.0 0.5
≤7 5.00 x 10⁻⁷ 7.90 x 10
-7-1.00 x 10
-3 -56.7±1.0 44.0 55.0 1.0
≤5 1.00 x 10⁻⁷ 2.50 x 10
-7-1.00 x 10
-3 -58.0±0.5
42.0 55.0 3.0
≤6 1.25 x 10⁻⁷ 5.00 x 10
-7-1.00 x 10
-3 -56.8±0.5 40.0 55.0 5.0
DOP
≤9 7.64 x 10⁻⁷ 1.00 x 10
-6-9.70 x 10
-3 -53.5±1.5 44.5 55.0 0.5
≤9 ≤≤≤ 2.50 x 10⁻⁷ 5.00 x 10
-7-7.66 x 10
-3 -54.7±1.0 44.0 55.0 1.0
≤8 1.00 x 10⁻⁷ 1.50 x 10
-7-5.00 x 10
-3 -55.0±1.5
42.0 55.0 3.0
≤9 2.50 x 10⁻⁷ 5.50 x 10
-7-7.94 x 10
-3 -54.8±0.5 40.0 55.0 5.0
DBP
≤10 1.50 x 10⁻⁶ 2.50 x 10
-6-6.40 x 10
-3 -54.5±1.5 44.5 55.0 0.5
≤12 2.00 x 10⁻⁶ 5.00 x 10
-6-5.00 x 10
-3 -54.5±1.0 44.0 55.0 1.0
≤10 7.50 x 10⁻⁷ 1.99 x 10
-6-1.00 x 10
-3 -55.0±1.5
42.0 55.0 3.0
≤10 2.50 x 10⁻⁶ 5.80 x 10
-6-6.31 x 10
-3 -53.5±0.5 40.0 55.0 5.0
TBP
≤10 1.50 x 10⁻⁶ 1.00 x 10
-6-1.00 x 10
-3 -53.5±1.5 44.5 55.0 0.5
≤12 2.00 x 10⁻⁶ 5.00 x 10
-7-1.66 x 10
-3 -54.7±1.0 44.0 55.0 1.0
≤10 5.50 x 10⁻⁷ 1.00 x 10
-6-1.00 x 10
-3 -55.0±1.5
42.0 55.0 3.0
≤10 2.50 x 10⁻⁶ 5.00 x 10
-6- 6.50 x 10
-3 -52.8±0.5 40.0 55.0 5.0
2-NPPE
≤7 2.52 x 10⁻⁸ 3.99 x 10
-8-5.00 x 10
-3 -56.5±1.5 44.5 55.0 0.5
≤7 2.00 x 10⁻⁸ 3.50 x 10
-8-7.94 x 10
-3 -57.5±1.0 44.0 55.0 1.0
≤5 1.25 x 10⁻⁸ 2.50 x 10
-8-2.50 x 10
-3 -59.0±0.5⃰
42.0 55.0 3.0
≤6 4.12 x 10⁻⁸ 5.50 x 10
-8-6.31 x 10
-3 -57.8±0.5 40.0 55.0 5.0
2-NPPE Nf-SM
≤7 7.90 x 10⁻⁸ 8.99 x 10
-8-5.00 x 10
-3 -54.5±1.5 44.5 55.0 0.5
≤7 6.50 x 10⁻⁸ 7.25 x 10
-8-7.94 x 10
-3 -56.5±1.0 44.0 55.0 1.0
≤5 4.00 x 10⁻⁸ 5.00 x 10
-8-1.00 x 10
-3 -58.5±0.5⃰
42.0 55.0 3.0
≤6 5.00 x 10⁻⁸ 6.50 x 10
-8-6.31 x 10
-3 -57.8±0.5 40.0 55.0 5.0

Khorshid et al. Chemically Modified Carbon Sensors
UK J Pharm & Biosci, 2014: 2(5); 17
Mixed ion-exchangers (Nf-ST + Nf-SM)
Nf-ST + Nf-SM
3.0 0.0
2.5 0.5
2.0 1.0
1.5 1.5
1.0 2.0
0.5 2.5
0.0 3.0
G B S C.R. (M) LOD (M) R(s)
55.0 42.0 -60.5±0.5* 1.25 x 10-8-5.00 x 10
-2 1.00 x 10
-8 ≤5
55.0 42.0 -58.5±0.5 2.50 x 10⁻⁸-1.00 x 10
-3 1.25 x 10
-8 ≤6
55.0 42.0 -56.0±1.0 6.31 x 10⁻⁸-1.00 x 10
-3 5.00 x 10
-8 ≤7
55.0 42.0 -55.0±1.0 2.50 x 10⁻⁸-1.00 x 10
-3 2.00 x 10
-8 ≤6
55.0 42.0 -56.6±1.0 3.50 x 10⁻⁸-5.00 x 10
-3 2.50 x 10
-8 ≤7
55.0 42.0 -57.8±0.5 6.50 x 10⁻⁸-6.31 x 10
-3 5.00 x 10
-8 ≤6
* The selected sensor, CP: Carbon Paste, C.R.: concentration range (M), LOD: limit of detection (M), R(s): response time (s)
Table 2 Response characteristics of the Ns-ion exchangers at 95% confidence intervals, average of five replicates at 25.0±0.1 °C
Parameters
Sensors
Sensor 1
Nf-ST
Sensor 2
Nf-SM
Sensor 3
Nf (ST+SM)
Composition
(W/W %)
3.0% (I.P)
+55.0% G + 42.0% P
3.0% (I.P)
+55.0% G+ 42.0% P
2.5 % (ST) (I.P)+
0.5 % (SM) (I.P)+ 55.0% G + 42.0% P
Slope (mV/decade) -59.0±0.5 -58.5±0.5 -60.5±0.5
Correlation coefficient
(r)
0.996 0.999 0.998
LOD (M) 1.25 x 10⁻⁸ 4.00 x 10
-8 1.00 x 10
-8
Linear range (M)
2.50x10⁻⁸
-1.00x10⁻³
5.00x10⁻⁸
-1.00x10⁻³
1.25 x 10⁻⁸-5.00 x 10
-2
Working pH range 2.0–6.0 2.0–6.0 2.0–6.0
Response time (s)
≤5 s ≤5 s ≤5 s
Recovery (%) ± S.D*
99.12±0.5 98.55±0.5 99.25±0.5
Robustness 99.65±0.5 99.37±0.5 99.87±0.5
Ruggedness 99.75±0.5 99.45±0.5 99.75±0.5
* Five replicates
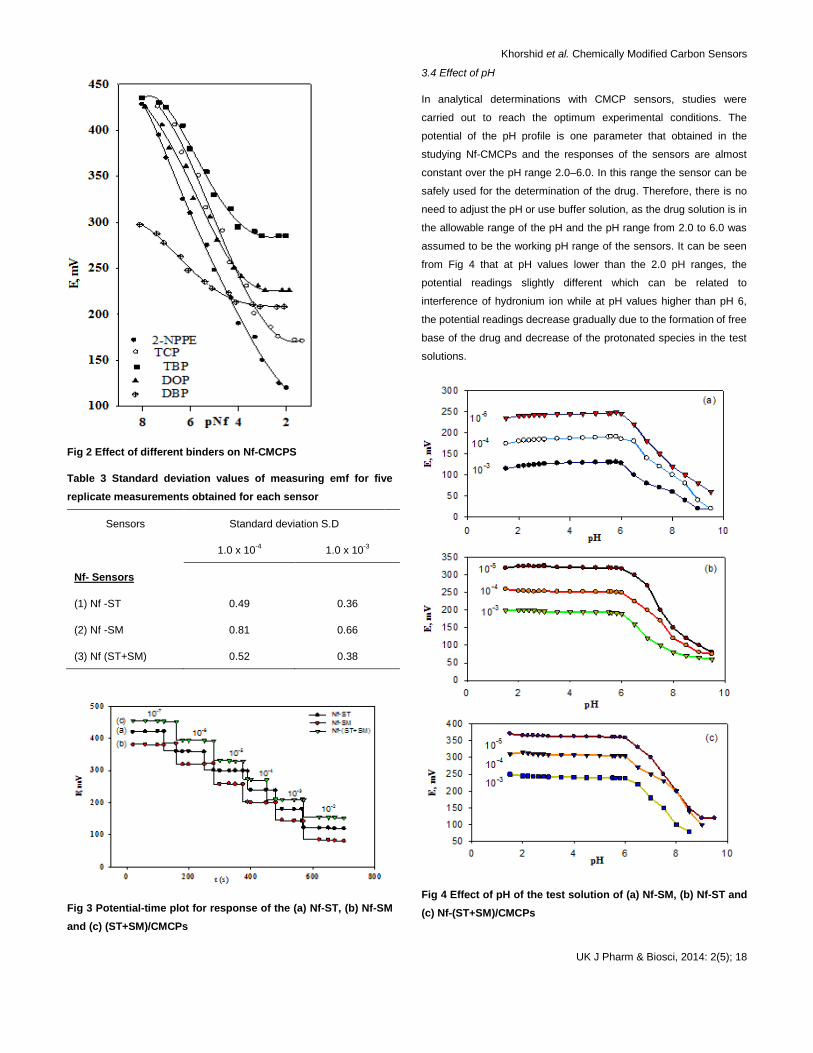
3.3 Dynamic response time
The response time of the sensor is defined as the time between
addition of the analyte to the sample solution and the time when a
limiting potential has been reached. The dynamic response time [26]
was obtained for the sensor by recording the time required to
achieve a steady-state potential (within ± 1 mV) after subsequence
immersions of the sensor in a series of drug solutions, each having a
10-fold increase in concentration from 1.0 x 10⁻⁷ to 1.0 x 10
-2 M. The
practical response time was examined by following Nf-(COOH)2
concentration by up to 10-fold. The sensor reached steady potential
within 5–7 s. This is most probably due to the fast exchange kinetics
of association–dissociation of naftidrofuryl ion with the ionophores at
the solution–paste interface. The potential–time plot for the response
of the sensor Nf-CMCPs is shown in Fig 3.
Khorshid et al. Chemically Modified Carbon Sensors
UK J Pharm & Biosci, 2014: 2(5); 18
Fig 2 Effect of different binders on Nf-CMCPS
Table 3 Standard deviation values of measuring emf for five
replicate measurements obtained for each sensor
Sensors Standard deviation S.D
1.0 x 10⁻⁴
1.0 x 10⁻³
Nf- Sensors
(1) Nf -ST 0.49 0.36
(2) Nf -SM 0.81 0.66
(3) Nf (ST+SM) 0.52 0.38
Fig 3 Potential-time plot for response of the (a) Nf-ST, (b) Nf-SM
and (c) (ST+SM)/CMCPs
3.4 Effect of pH
In analytical determinations with CMCP sensors, studies were
carried out to reach the optimum experimental conditions. The
potential of the pH profile is one parameter that obtained in the
studying Nf-CMCPs and the responses of the sensors are almost
constant over the pH range 2.0–6.0. In this range the sensor can be
safely used for the determination of the drug. Therefore, there is no
need to adjust the pH or use buffer solution, as the drug solution is in
the allowable range of the pH and the pH range from 2.0 to 6.0 was
assumed to be the working pH range of the sensors. It can be seen
from Fig 4 that at pH values lower than the 2.0 pH ranges, the
potential readings slightly different which can be related to
interference of hydronium ion while at pH values higher than pH 6,
the potential readings decrease gradually due to the formation of free
base of the drug and decrease of the protonated species in the test
solutions.
Fig 4 Effect of pH of the test solution of (a) Nf-SM, (b) Nf-ST and
(c) Nf-(ST+SM)/CMCPs

Khorshid et al. Chemically Modified Carbon Sensors
UK J Pharm & Biosci, 2014: 2(5); 19
3.5 Effect of temperature
The investigation of the thermal stability of CMCPs is of prime
importance in characterization of their behavior. In case if the
thermal coefficient is high, more than 1 mV/oC, then it is important
that temperature be controlled as variation in this parameter can lead
to significant measurement errors as shown in table 4.
3.6 Sensors selectivity
In analytical applications, the selectivity for the analyte must be as
high as possible, i.e. the selectivity for foreign substances must be
very small, so that the sensor exhibits a Nernstian dependence on
the primary ion over a wide concentration range. The response of the
sensors towards different substances and ionic species such as
inorganic / organic cations, amino acids, sugars that may be present
in the pharmaceutical preparations was checked both by SSM and or
MPM conditions and the values of selectivity coefficients were used
to evaluate of their interference. The inorganic cations do not
interfere due to their mobility and permeability is difference as
compared to nafronyl cation. For amino acids and sugars the high
selectivity is related to the difference in polarity and lipophilic nature
of their molecules relative to nafronyl cation as shown in table 5.
3.7 Analytical Applications
3.7.1 Standard addition method
The analytical applications involve determination of the drug in its
bulk powder, pharmaceutical dosage form, and human fluids
plasma/urine by the standard addition method [24], which is
frequently the most, applied one in using CMCPs. The method was
proved successful for the determination of nafronyl ions. The data
reflect the high accuracy and precision of the investigated sensors
for determination of nafronyl ion and its statistical data treatments in
comparison with official methods27,28
.
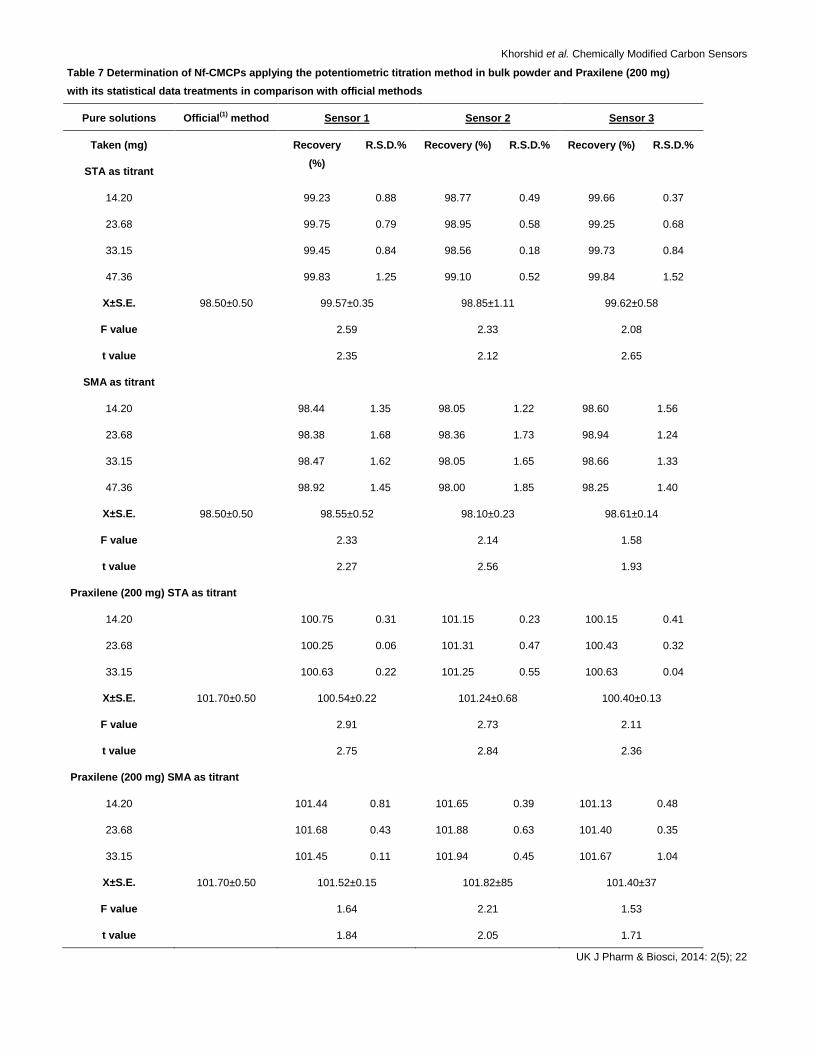
3.7.2 Potentiometric titration
The potentiometric titration technique usually offers the advantage of
high accuracy and precision. A further advantage is that the potential
break at the titration end-point must be well defined. The titration
process was carried in pure solution and/or pharmaceutical dosage
form containing from 2.37-47.36 mg Nf-(COOH)2. As shown in Fig 5
and table 7 with its statistical data treatments in comparison with
official methods27,28
.
3.8 Robustness and ruggedness
The examination of the robustness method was checked by the
replacement of aqueous solution with acetate buffer pH 4±0.5 for the
Nf-CMCPSs. All results are in a good agreement with those obtained
from standard drug solution as shown in Table 1 In addition, the
reproducibility or the ruggedness was examined by using another
model type of pH-meter (Jenway, 3510) for each sensor (1, 2 and 3).
table 1.
Table 4 Performance characteristics of Nf-CMCPs at different
test solution temperatures.
Sensors Temp.
(˚C)
Slope
(mV/decade)
Linear range (M)
Sensor 1 25 -59.0±0.5 2.50x10⁻⁸
-1.00x10⁻³
30 -60.0±0.5 5.00x10⁻⁷
-7.20x10⁻³
35 -61.0±0.5 1.00x10⁻⁶
-3.50x10⁻³
40 -59.0±0.5 1.25x10⁻⁵
-2.00x10⁻³
50 -57.0±0.5 4.00x10⁻⁵
-1.50x10⁻³
Sensor 2 25 -58.5±0.5 5.00x10⁻⁸
-1.00x10⁻³
30 -59.5±0.5 8.90x10⁻⁷
-1.60x10⁻³
35 -60.5±0.5 2.50x10⁻⁶
-5.00x10⁻³
40 -58.5±0.5 1.00x10⁻⁵
-2.00x10⁻³
50 -56.5±0.5 5.00x10⁻⁵
-1.90x10⁻³
Sensor 3 25 -60.5±0.5 1.25x10⁻⁸
-5.00x10⁻²
30 -61.5±0.5 5.00x10⁻⁷
-5.00x10⁻³
35 -62.5±0.5 2.25x10⁻⁶
-4.00x10⁻³
40 -60.5±0.5 7.50x10⁻⁶
-3.00x10⁻³
50 -58.5±0.5 1.00x10⁻⁵
-1.60x10⁻³

Khorshid et al. Chemically Modified Carbon Sensors
UK J Pharm & Biosci, 2014: 2(5); 20
Table 5 Selectivity coefficient values for pot
zJDrug,K log - Nf /CMCPS
Sensor 3 Sensor 2 Sensor 1
MPM SSM MPM SSM MPM SSM Interferent
3.83 3.55 3.65 3.22 3.71 3.43 Na+
3.62 3.88 3.44 3.65 3.39 3.51 NH4+
3.65 3.60 3.43 3.43 3.53 3.50 K+
4.05 3.88 3.79 3.87 3.83 3.90 Cu2+
4.08 3.80 3.84 3.76 3.67 3.82 Zn2+
4.13 3.95 3.59 3.54 3.93 3.89 Co2+
2.81 2.66 2.30 2.11 2.38 2.27 Fe2+
3.85 3.88 3.55 3.47 3.76 3.81 Fe3+
3.72 3.84 3.49 3.33 3.65 3.67 Ni2+
3.65 3.73 3.51 3.47 3.53 3.60 Mn2+
4.02 3.81 3.33 3.24 3.85 3.75 Mg2+
4.23 4.08 3.89 3.95 4.02 3.93 Cr3+
4.27 4.13 3.94 3.77 4.23 4.05 Ba2+
3.71 -- 3.44 -- 3.61 -- Glucose
3.85 -- 3.39 -- 3.73 -- Maltose
3.69 -- 3.46 -- 3.61 -- Lactose
4.01 -- 3.25 -- 3.54 -- Urea
4.03 -- 3.42 -- 3.58 -- Ascorbic acid
3.93 -- 3.53 -- 3.83 -- Asparagine
4.11 -- 3.56 -- 3.94 -- L-Lysine
4.05 -- 3.73 -- 3.96 -- L-cystine
4.08 -- 3.67 -- 3.97 -- L-Glycine
4.15 -- 3.55 -- 3.89 -- L-Theronine
Each value is the average of three determinations, (---): No response
3.9 Content uniformity of Praxilene tablets
The content uniformity assay for Nf-CMCPS method described good
accuracy, reproducible results and precision for the quality control
tests so the sensors can be working for the quantification
determination of nafronyl ions and the percentage of the recovery of
Nf-(COOH)2 is almost acceptance quantitatively.

Khorshid et al. Chemically Modified Carbon Sensors
UK J Pharm & Biosci, 2014: 2(5); 21
Table 6 Determination of Nf-CMCPs applying the standard addition method in bulk powder, Praxilene (200 mg) and spiked human
plasma/urine and its statistical data treatments in comparison with official method
Pure solutions Official(1)
method
Sensor 1 Sensor 2 Sensor 3
Taken (mg) Recovery (%) R.S.D.% Recovery (%) R.S.D.% Recovery (%) R.S.D.%
4.74 99.21 1.11 98.84 0.53 99.18 0.27
7.11 99.53 0.85 98.75 0.38 99.25 0.33
14.20 99.00 0.97 98.55 0.47 99.78 0.78
X±S.E. 98.5±0.5 99.25±0.05 98.71±0.12 99.40±0.09
F value 1.85 2.05 1.45
t value 2.74 2.93 1.89
Praxilene (200 mg)
4.74 99.85 0.76 98.23 0.87 100.58 0.54
7.11 100.54 0.25 98.66 1.05 101.89 0.93
14.20 101.25 0.35 98.47 1.25 101.25 0.36
X±S.E. 101.7±0.5 100.55±0.05 98.45±0.52 101.24±0.14
F value 2.51 1.81 1.37
t value 1.39 1.55 0.76
Spiked Plasma
X±S.E. 101.95±0.50 101.70±0.35 101.20±0.15
F value 0.84 1.23 0.44
t value 0.73 1.09 0.39
Spiked Urine
X±S.E. 101.50±0.25 101.65±0.42 101.25±0.33
F value 1.36 1.68 1.34
t value 0.68 1.74 1.53
X S.E: Recovery standard error, F- tabulated is 6.39 at 95.0% confidence limit, t- tabulated at 99.0% confidence limit and 6 degrees of freedom, (1)
British
Pharmacopoeia (Non‐aqueous titration with 0.1 M perchloric acid)
3.10 Validation of the proposed method
3.10.1 Linearity and detection limit (LOD)
The value of LOD was indicating that the proposed method is
sensitive for detection of very small concentrations of Nf-CMCPSs
reach to 0.1nM, the correlation coefficient (r) and other statistical
parameters were listed in table 1.
3.10.2 Accuracy
The investigation of accuracy for the proposed Nf-CMCPS method
was examined by determination of nafronyl ions in its pharmaceutical
preparations without interfering from the co formulated adjuvant as
indicated and the recovery value showed excellent procedure of the
investigated sensors.
Khorshid et al. Chemically Modified Carbon Sensors
UK J Pharm & Biosci, 2014: 2(5); 22
Table 7 Determination of Nf-CMCPs applying the potentiometric titration method in bulk powder and Praxilene (200 mg)
with its statistical data treatments in comparison with official methods
Pure solutions Official(1)
method Sensor 1 Sensor 2 Sensor 3
Taken (mg) Recovery
(%)
R.S.D.% Recovery (%) R.S.D.% Recovery (%) R.S.D.%
STA as titrant
14.20 99.23 0.88 98.77 0.49 99.66 0.37
23.68 99.75 0.79 98.95 0.58 99.25 0.68
33.15 99.45 0.84 98.56 0.18 99.73 0.84
47.36 99.83 1.25 99.10 0.52 99.84 1.52
X±S.E. 98.50±0.50 99.57±0.35 98.85±1.11 99.62±0.58
F value 2.59 2.33 2.08
t value 2.35 2.12 2.65
SMA as titrant
14.20 98.44 1.35 98.05 1.22 98.60 1.56
23.68 98.38 1.68 98.36 1.73 98.94 1.24
33.15 98.47 1.62 98.05 1.65 98.66 1.33
47.36 98.92 1.45 98.00 1.85 98.25 1.40
X±S.E. 98.50±0.50 98.55±0.52 98.10±0.23 98.61±0.14
F value 2.33 2.14 1.58
t value 2.27 2.56 1.93
Praxilene (200 mg) STA as titrant
14.20 100.75 0.31 101.15 0.23 100.15 0.41
23.68 100.25 0.06 101.31 0.47 100.43 0.32
33.15 100.63 0.22 101.25 0.55 100.63 0.04
X±S.E. 101.70±0.50 100.54±0.22 101.24±0.68 100.40±0.13
F value 2.91 2.73 2.11
t value 2.75 2.84 2.36
Praxilene (200 mg) SMA as titrant
14.20 101.44 0.81 101.65 0.39 101.13 0.48
23.68 101.68 0.43 101.88 0.63 101.40 0.35
33.15 101.45 0.11 101.94 0.45 101.67 1.04
X±S.E. 101.70±0.50 101.52±0.15 101.82±85 101.40±37
F value 1.64 2.21 1.53
t value 1.84 2.05 1.71

Khorshid et al. Chemically Modified Carbon Sensors
UK J Pharm & Biosci, 2014: 2(5); 23
X S.E: Recovery standard error, F- tabulated is 6.39 at 95.0% confidence limit, t- tabulated at 99.0% confidence limit and 6 degrees of freedom
Fig 5 Potentiometric titration of 23.68 mg Nf(COOH)2 with
2.5x10⁻⁴ M ST as titrant using sensors (a) Nf-SM, (b) Nf-ST
and (c) Nf (ST+SM)
3.10.3 Precision
The precision of the Nf-CMCPS method was tested by repeating the
proposed CMCPS method for analysis of the investigated nafronyl
ions in intra-day (within the day) and inter-day (consecutive days) to
five replicates measured as percentage relative standard deviation
(% RDS). The percentage RSD values are less than 2%, indicating
acceptable and good precision.
3.11 Determination of the solubility products of the ion-exchangers
It is noteworthy to mention that the solubility of an ion-exchanger is
one of the main factors controlling the sensitivity of the ion-selective
sensor, which incorporate this ion-exchanger as electroactive
material. This is confirmed by the values of solubilites whereas the
solubilities have the lowest value the detection limits also have as
given in table 8. This is in agreement with what was stated by
Pungor and Toth29
. The reciprocal of the solubility product is
approximately equal to the equilibrium constant (K) of the
precipitation reaction employed in such titration.
An-
+ n D+ ↔ Dn A K = 1/KSP
An- is the counter anion and D+ is the drug cation, number of
experiments (N) =4.
3.12 Potentiometric monitoring of Plavix tablet dissolution
The changes in the electrochemical potential of the dissolution
medium caused by the dissolving drug can be detecting by the
sensor monitors to the dissolution of the tablet. These changes are
converted into the concentration in % of dissolved drug via dedicated
(“Potential measured in mV, to Concentration”). The results are
compared to subsequent sample analysis using UV. It shows that
nafronyl releases immediately after capsule was ruptured. Taking
into account that the releasing was achieved in three stages; the first
during 15 min nearly 50% was released, the second more than 74%
drug was released within 30 min and complete dissolution in the third
stage within 45 min according to USP19
.
Table 8 Solubility product constants of ion-associates
Ion- Ksp Limit of
associates S Potentiometric Conductimetric detection K=1/Ksp (P)
Method (P) Method (C) (LOD) M
Nf4ST 7.45x10⁻⁷
8.35x10⁻²⁷
8.56x10⁻²⁷
1.25 x 10⁻⁸
1.20x1026
Nf4SM 6.23x10⁻⁷
5.44x10⁻²⁷
4.61x10⁻²⁷
4.00 x 10⁻⁸
1.83x1026
S: Solubility (M/l), K: Equilibrium constant
For the UV spectrophotometric assay, fixed volumes of the
dissolution medium were withdrawn, diluted with 0.01 M HCl,
measured at λ max 283 nm and compared with a calibration graph.
Fig 6 shows the dissolution profiles of nafronyl tablet using both
measurement techniques. The results obtained by
spectrophotometric and potentiometry are almost identical but the
use of the potentiometric method sensor has the advantage of more
sensitive due to overcome the matrix effect.

Khorshid et al. Chemically Modified Carbon Sensors
UK J Pharm & Biosci, 2014: 2(5); 24
Fig 6 Dissolution profiles of 200 mg naftidrofuryl tablets
obtained by (A) potentiometric mixed sensor Nf CMCPS, and (B)
spectrophotometric measurement at 283 nm
3.13 Comparison of the nafronyl selective sensors
For comparison, the performance characteristics of the choice
sensor and the reported ISE method are showed in table 9. It is
noteworthy that the proposed sensor CMCPS is comparable with
most of the reported sensors with regard to working concentration
range, response time and low detection limit. The comparisons
indicate that the present sensor is high selective than the previous
methods in applications.
4 Conclusion
The preparation and investigation of the performance characteristics
of CMCPS for the determination of cardiovascular drug naftidrofuryl
ion. The proposed potentiometric methods based on the construction
of different selective sensors with ion exchangers in analytical
characteristics for the determination of Nf-(COOH)2 in its pure
solutions, pharmaceutical preparation and human fluids. The
excellent recoveries and low relative standard deviations obtained
reflect the high accuracy and precision of the proposed method. In
addition, the method is easy to operate, high sensitivity, simple, fast
static response; reasonable selectivity; long term stability and
applicability over a wide concentration range with minimal sample
pretreatment and inexpensive making it an excellent tool for the
routine determination of Nf in quality control laboratories. The sensor
developed is superior as compared with the naftidrofuryl selective
sensor described in the literature9-11
.
5 References
1. British Pharmacopoeia, 14th Edn., Her Majesty‟s Stationary
office, London on behalf of MHRA, Vol. I&II, London, UK.
2009, 373.
2. Sweetman SC. Martindale: The Complete Drug Reference,
35th edition, The Pharmaceutical Press, London, 2007.
3. Brodie RR, Chasseaud LF, Taylor T, Hunter JO, Ciclitira PJ.
Determination of naftidrofuryl in the plasma of humans by
high-performance liquid chromatography. J. Chromatogr.
1979; 164: 534-540.
4. Garrett ER, Barbhaiya R. Prediction of stability in
pharmaceutical preparation XVIII: Application of high-pressure
liquid chromatographic assays to study of nafronyl stability and
bioanalysis. J. Pharm. Sci. 1981; 70: 39-45.
5. Beyer K H, Hildebrand M. Naftidrofuryl (Dusodril) Possible
uses of gas chromatography and high pressure liquid
chromatography for analysis. Dtsch Apoth Ztg. 1982; 122:
1709-1712.
6. Walmsley LM, Wilkinson PA, Brodie RR, Chasseaud LF.
Determination of naftidrofuryl in human plasma by high-
performance liquid chromatography with fluorescence
detection. J Chromatogr. 1985; 338: 433-437.
7. Waaler PJ, Mueller BW. Solid-phase extraction of naftidofuryl
from human plasma for high performance liquid
chromatography analysis. Int. J.Pharm. 1992; 87: 223-227.
8. Cawood A, Marshall IW. Estimation of naftidrofuryl in sodium
chloride solution. J Hosp Pharm. 1975; 33: 149-151.
9. Ionescu MS, Badea V, Baiulescu GE, Cosofret VV. Nafronyl
ion-selective membrane sensors and their use in
pharmaceutical analysis. Talanta. 1986; 33: 101-103.
10. Abbas SS, Zaazaa HE, El-Ghobashy MR, Fayez YM, Fattah
SA. Application of Membrane-Selective Sensors for the
Determination of Naftidrofuryl Oxalate in the Presence of Its
Alkaline Degradant in Tablets and Plasma. Port Electrochim
Acta. 2012; 30(3).
11. El-Sayed MA. The use of Calixarene as ionophores in
potentiometric ion-selective sensors of naftidrofuryl oxalate
using microsized membrane sensors for kinetic study of
naftidrofuryl (NF) degradation. Eur. J. of Chemistry. 2013;
4(2): 124-131.
12. Munoz de la Pena A, Espinosa Mansilla A, Murillo Pulgarin JA,
Alanon Molina A, Fernandez Lopez P. Determination of
nafronyl in pharmaceutical preparations by means of stopped-
flow micellar-stabilized room temperature phosphorescence.
Analyst. 1998; 123: 2285-2290.
13. Murillo Pulgarin JA, Alanon Molina A, Fernandez Lopez P.
Phosphorimetric determination of nafronyl in pharmaceutical
preparations. Anal Chim Acta. 1999; 382: 77-85.
14. Cruces-Blanco C, Segura Carretero A, Fernandez Sanchez
JF, Fernandez Gutierrez A. Facile and selective determination
of the cerebral vasodilator nafronyl in a commercial
formulation by heavy atom induced room temperature
phosphorimetry. J Pharm Biomed Anal. 2000; 23: 845-850.

Khorshid et al. Chemically Modified Carbon Sensors
UK J Pharm & Biosci, 2014: 2(5); 25
Table 9 Comparison between the published and the current methods for determination of Nf-ISS
Ref. 9 Ref. 10 Ref. 11 Sensor 1
Nf-ST
Sensor 2
Nf-SM
Sensor 3
Nf (ST+SM)
Parameter NFT-
dipicrylamine
NFL-
CD/PVC-
COOH
NFT-
sulfocalix‐8‐arene
3.0% (I.P)
+55.0% G +
42.0% P
3.0% (I.P)
+55.0% G+
42.0% P
2.5 % (ST) (I.P)+
0.5 % (SM) (I.P)+
55.0% G + 42.0% P
Slope (mV/decade) -54-56 -50.5 ‐54.1 -59.0±0.5 -58.5±0.5 -60.5±0.5
Correlation coefficient (r) --- 0.9974 0.9993 0.996 0.999 0.998
Linear range (M) 10-5-10
-2 10
-5-10
-3 1x10‐5‐1x10‐2 2.50x10
-8-1.00x10
-3 5.00x10
-8-1.00x10
-3 1.25 x 10
-8-5.00 x 10
-2
LOD (M) --- ---- 5.6x 10‐6 1.25 x 10⁻⁸ 4.00 x 10
-8 1.00 x 10
-8
Working pH range 2-5 2.50 –4.50 2 ‐ 5 2.0–6.0 2.0–6.0 2.0–6.0
Response time (s) --- 20-30 9 ≤5 s ≤5 s ≤5 s
Life span/days --- 6-8 w 14 d Fresh surface
Accuracy (%) --- 100.13±1.6
1
99.97±0.89 99.12±0.5 98.55±0.5 99.25±0.5
Standard deviation ≤2.0% 1.612 less than 2.0%
Robustness --- --- --- 99.65±0.5 99.37±0.5 99.87±0.5
Ruggedness --- --- --- 99.75±0.5 99.45±0.5 99.75±0.5
r2: Correlation coefficient, R%: Mean recovery%, C.S: Current Study
15. Segura Carretero, A., Cruces Blanco, C., Canabate Diaz, B.,
Fernandez Sanchez, J. F. and Fernandez Gutierrez, A. (2000)
Heavy-atom induced room-temperature phosphorescence: a
straightforward methodology for the determination of organic
compounds in solution. Anal. Chim. Acta 417: 19-30.
16. Fernandez-Sanchez JF, Segura-Carretero A, Cruces-Blanco
C, Fernandez-Gutierrez A. (2002) Room-temperature
luminescence optosensings based on immobilized active
principles actives. Application to nafronyl and naproxen
determination in pharmaceutical preparations and biological
fluids. Anal Chim Acta 462: 217-224.
17. Svancara I, Vytras K, Kalcher K, Walcarius A. Carbon Paste
Sensors in Facts, Numbers, and Notes: A Review on the
Occasion of the 50-Years Jubilee of Carbon Paste in
Electrochemistry and Electroanalysis. J Electroanalysis. 2009;
21(1): 7 – 28.
18. Svancara I, Walcarius A, Kalcher K, Vytras K. Carbon paste
sensors in the new millennium. Cent Eur J Chem. 2009; 7(4):
598–656.
19. United States Pharmacopeia, National Formulary USP, 32–NF
27 Convention, Inc. Rockville, MD. 2009; 733.
20. Liddell M, Deng G, Hauck W, Brown W, Wahab S, Manning R.
Evaluation of Glass Dissolution Vessel Dimensions and
Irregularities. Dissolution Technologies. 2007; 14(1): 28-33.
21. Khorshid AF, Issa YM. Modified carbon paste sensor for the
potentiometric determination of neostigmine bromide in
pharmaceutical formulations, human plasma and urine.
Biosensors and Bioelectronics. 2014; 51:143–149.
22. Umezawa Y, Buhlmann P, Umezawa K, Tohda K, Amemiya S,
Potentiometric selectivity coefficients of ion-selective sensors.
Part I. Inorganic cations. Pure Appl Chem. 2000; 72: 1851-55.
23. Umezawa Y, Umezawa K, Sato H. Selectivity coefficients for
ion-selective sensors: recommended methods for reporting
KA,B pot values. Pure Appl. Chem. 1995; 67: 507-511.
24. Guilbault G, Drust RA, Frant MS, Freiser H, Hansen.
Recommendations for nomenclature of ion-selective sensors.
Pure Appl. Chem. 1976; 48: 127-129.
25. Antropov LL. Reference Electrodes in Metal Corrosion.
Theoretical Electrochemistry, Mir, Moscow, 1977.

Khorshid et al. Chemically Modified Carbon Sensors
UK J Pharm & Biosci, 2014: 2(5); 26
26. Linder E, Umezawa Y. Performance evaluation criteria for
preparation and measurement of macro- and micro fabricated
ion-selective sensors. Pure Appl Chem. 2008; 80(1): 85–104.
27. Skoog DA, Holler FJ, Neiman TA. Principles of Instrumental
Analysis, 5Th
ed. Harcourt Brace College Publishers, London.
1997.
28. Miller JC, Miller JN. Statistics for Analytical Chemistry, Ellis
Horwood, Chichester, England.1994.
29. Pungor E, Toth K, Analyst. 1970; 95: 625.


