
UNCTAD National Workshop Saint Lucia 24 – 26 May 2017, Rodney Bay, Saint Lucia
“Climate Change Impacts and
Adaptation for Coastal Transport Infrastructure in Caribbean SIDS”
Climate Risk and Vulnerability
Assessment Framework for Caribbean Coastal Transport
Infrastructure
By
Cassandra Bhat
ICF, United States
This expert paper is reproduced by the UNCTAD secretariat in the form and language in which it has been received. The views expressed are those of the author and do not necessarily reflect the views of the UNCTAD.
1
Climate Risk and Vulnerability Assessment Framework for Caribbean Coastal Transport Infrastructure
Climate Change Impacts on Coastal Transport Infrastructure
in the Caribbean: Enhancing the Adaptive Capacity of SIDS
May 25, 2017
United Nations Conference on
Trade and Development
National Workshop - Saint Lucia
Cassandra Bhat
ICF
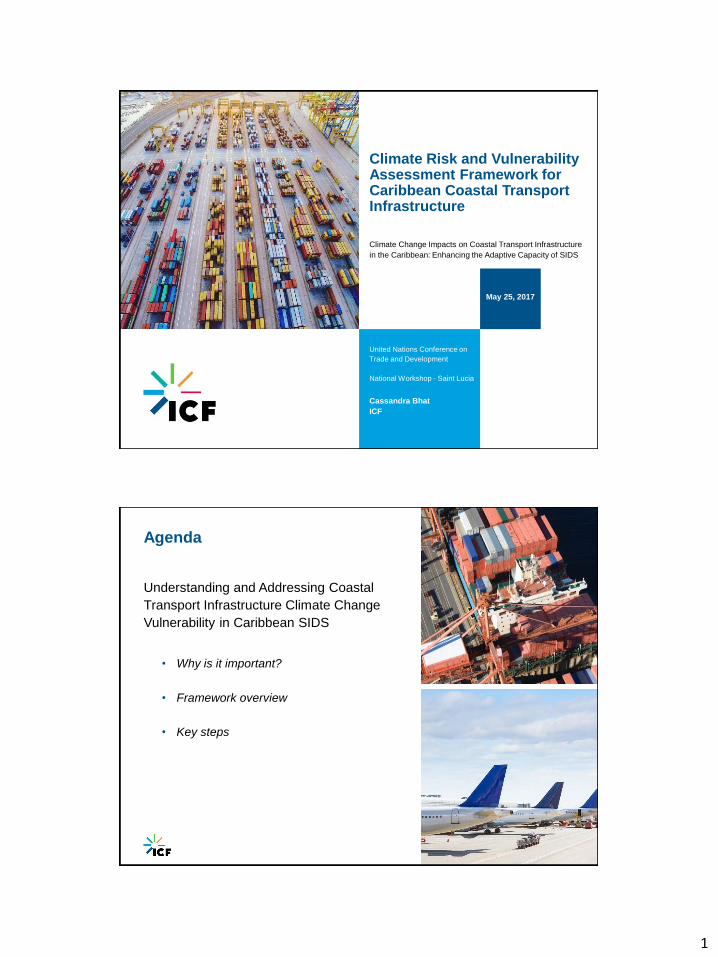
Agenda
6/9/2017 2
Understanding and Addressing Coastal
Transport Infrastructure Climate Change
Vulnerability in Caribbean SIDS
• Why is it important?
• Framework overview
• Key steps
2
6/9/2017 3
Why is it important?
Understanding and addressing coastal transport
infrastructure climate change vulnerability in
Caribbean SIDS
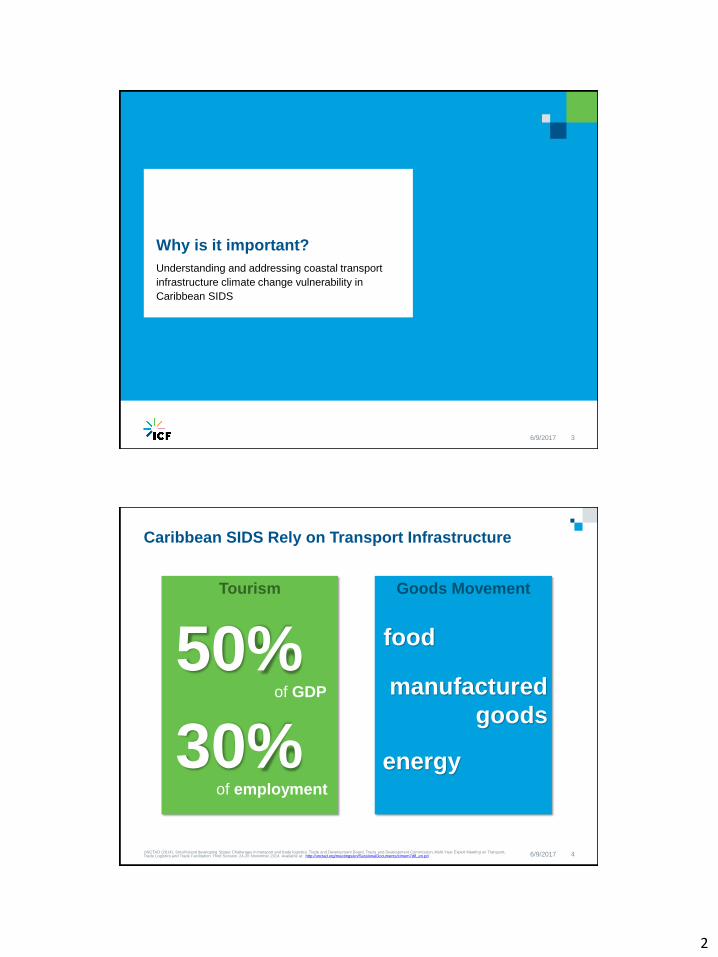
Caribbean SIDS Rely on Transport Infrastructure
6/9/2017 4UNCTAD (2014). Small island developing States: Challenges in transport and trade logistics. Trade and Development Board, Trade and Development Commission, Multi-Year Expert Meeting on Transport, Trade Logistics and Trade Facilitation, Third Session. 24-26 November 2014. Available at: http://unctad.org/meetings/en/SessionalDocuments/cimem7d8_en.pd
Tourism
30%of employment
50%of GDP
Goods Movement
food
energy
manufactured
goods
3
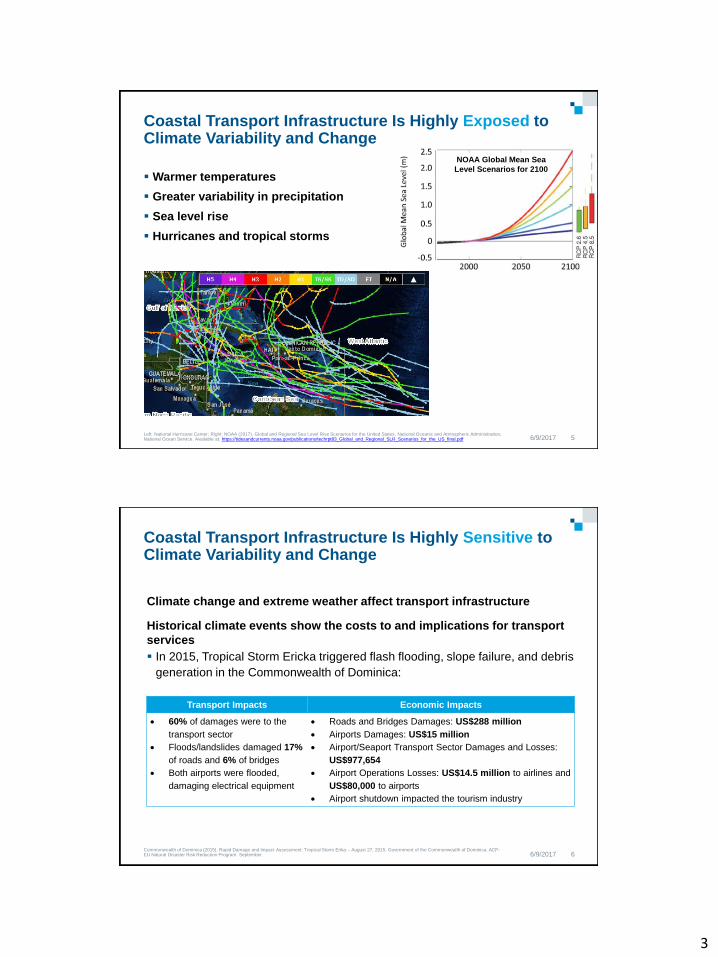
Coastal Transport Infrastructure Is Highly Exposed to Climate Variability and Change
▪ Warmer temperatures
▪ Greater variability in precipitation
▪ Sea level rise
▪ Hurricanes and tropical storms
6/9/2017 5Left: National Hurricane Center; Right: NOAA (2017). Global and Regional Sea Level Rise Scenarios for the United States. National Oceanic and Atmospheric Administration, National Ocean Service. Available at: https://tidesandcurrents.noaa.gov/publications/techrpt83_Global_and_Regional_SLR_Scenarios_for_the_US_final.pdf
NOAA Global Mean Sea
Level Scenarios for 2100
Coastal Transport Infrastructure Is Highly Sensitive to Climate Variability and Change
6/9/2017 6
Climate change and extreme weather affect transport infrastructure
Historical climate events show the costs to and implications for transport
services
▪ In 2015, Tropical Storm Ericka triggered flash flooding, slope failure, and debris
generation in the Commonwealth of Dominica:
Transport Impacts Economic Impacts
• 60% of damages were to the
transport sector
• Floods/landslides damaged 17%
of roads and 6% of bridges
• Both airports were flooded,
damaging electrical equipment
• Roads and Bridges Damages: US$288 million
• Airports Damages: US$15 million
• Airport/Seaport Transport Sector Damages and Losses:
US$977,654
• Airport Operations Losses: US$14.5 million to airlines and
US$80,000 to airports
• Airport shutdown impacted the tourism industry
Commonwealth of Dominica (2015). Rapid Damage and Impact Assessment: Tropical Storm Erika – August 27, 2015. Government of the Commonwealth of Dominica. ACP-EU Natural Disaster Risk Reduction Program. September.
4
6/9/2017 7
Reducing Transport Sector Vulnerability in SIDS is Critical
Disruptions to the transport network can have immediate and severe
consequences on:
▪ Development goals of the island
▪ Economy
▪ Health and lifestyles of residents
The challenge of maintaining these critical services is already
significant and will only increase as the climate changes
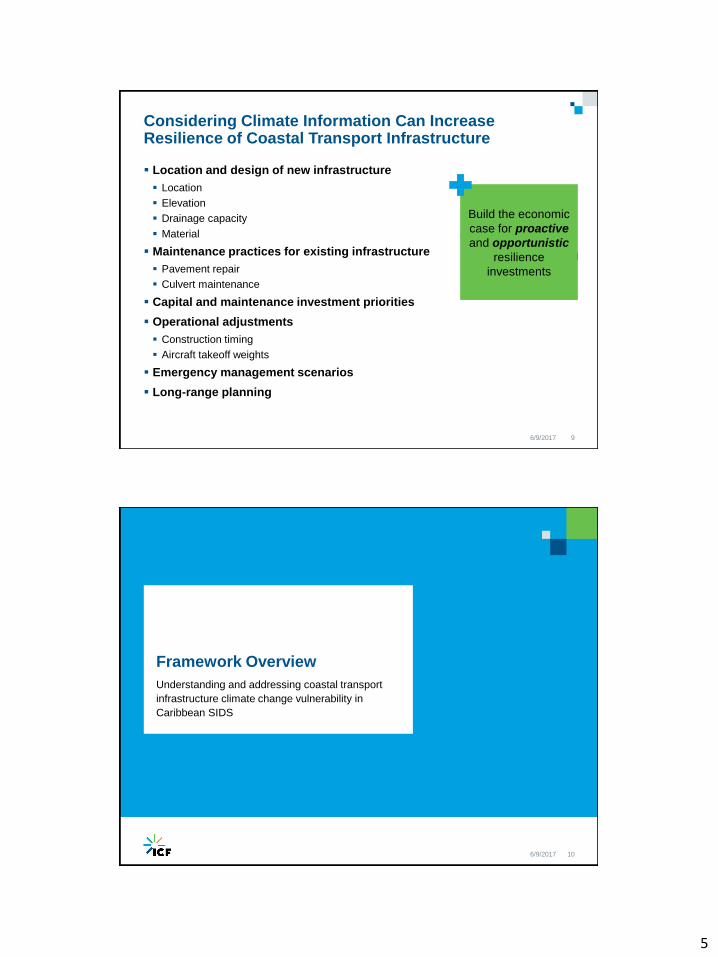
Considering Climate Information Can Increase Resilience of Coastal Transport Infrastructure
▪ Historically, climate-sensitive investments
and decisions assumed “Stationarity”
▪ Stationarity = climate conditions remain
the same when averaged over a
sufficiently long time period
▪ However, climate model projections and
observations indicate non-stationarity
6/9/2017 8
5
Considering Climate Information Can Increase Resilience of Coastal Transport Infrastructure
▪ Location and design of new infrastructure
▪ Location
▪ Elevation
▪ Drainage capacity
▪ Material
▪ Maintenance practices for existing infrastructure
▪ Pavement repair
▪ Culvert maintenance
▪ Capital and maintenance investment priorities
▪ Operational adjustments
▪ Construction timing
▪ Aircraft takeoff weights
▪ Emergency management scenarios
▪ Long-range planning
6/9/2017 9
Build the economic
case for proactive
and opportunistic
resilience
investments
6/9/2017 10
Framework Overview
Understanding and addressing coastal transport
infrastructure climate change vulnerability in
Caribbean SIDS

6
Framework Goals
6/9/2017 11
Provide a:
▪ Structured way for organizations in SIDS to approach climate change
adaptation
▪ Flexible, practical approach that uses available data to inform decision-
making
▪ Framework outlines a continuum of approaches that can be used depending on data
available
Audience: Port and Airport Managers in SIDS
By following the recommendations and steps in the methodology, transport managers can
work towards identifying critical assets, current and future vulnerabilities, and potential
adaptation strategies for the transport sector.
Key Principles
6/9/2017 12
#1: Keep the end goal in mind
The purpose of assessing vulnerability is to improve decision-making with
respect to climate variability and change. If possible, identify specific decisions to
inform.
#2: Work within data limitations
Data limitations—be they gaps in data on current assets, historical weather,
future climate, or others—need not curtail adaptation efforts.
#3: Engage stakeholders
Stakeholder engagement is central to an effective climate change vulnerability
assessment process and has multiple benefits, including:
▪ Help fill data gaps
▪ Build support for adaptation efforts
▪ Build capacity

7
6/9/2017 13
Key Steps
Understanding and addressing coastal transport
infrastructure climate change vulnerability in
Caribbean SIDS
6/9/2017 14

8
Stage 1: Set Context and Scope
6/9/2017 15
6/9/2017 16
9
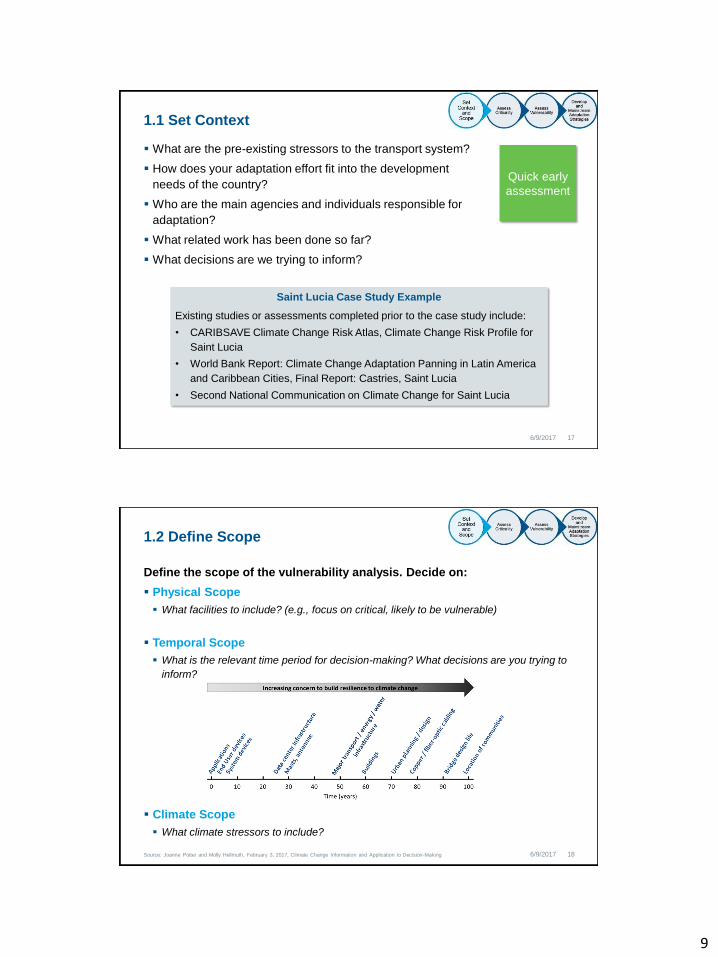
1.1 Set Context
6/9/2017 17
▪ What are the pre-existing stressors to the transport system?
▪ How does your adaptation effort fit into the development
needs of the country?
▪ Who are the main agencies and individuals responsible for
adaptation?
▪ What related work has been done so far?
▪ What decisions are we trying to inform?
Saint Lucia Case Study Example
Existing studies or assessments completed prior to the case study include:
• CARIBSAVE Climate Change Risk Atlas, Climate Change Risk Profile for
Saint Lucia
• World Bank Report: Climate Change Adaptation Panning in Latin America
and Caribbean Cities, Final Report: Castries, Saint Lucia
• Second National Communication on Climate Change for Saint Lucia
Quick early
assessment
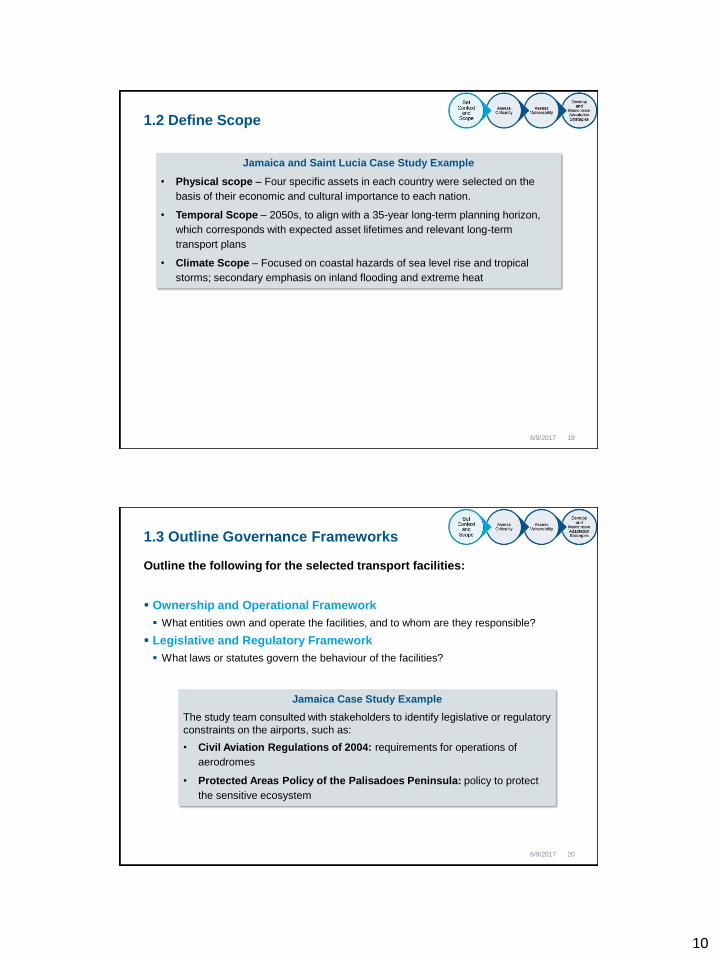
1.2 Define Scope
6/9/2017 18
Define the scope of the vulnerability analysis. Decide on:
▪ Physical Scope
▪ What facilities to include? (e.g., focus on critical, likely to be vulnerable)
▪ Temporal Scope
▪ What is the relevant time period for decision-making? What decisions are you trying to
inform?
▪ Climate Scope
▪ What climate stressors to include?
Source: Joanne Potter and Molly Hellmuth, February 3, 2017, Climate Change Information and Application to Decision-Making
10
1.2 Define Scope
6/9/2017 19
Jamaica and Saint Lucia Case Study Example
• Physical scope – Four specific assets in each country were selected on the
basis of their economic and cultural importance to each nation.
• Temporal Scope – 2050s, to align with a 35-year long-term planning horizon,
which corresponds with expected asset lifetimes and relevant long-term
transport plans
• Climate Scope – Focused on coastal hazards of sea level rise and tropical
storms; secondary emphasis on inland flooding and extreme heat
1.3 Outline Governance Frameworks
6/9/2017 20
Outline the following for the selected transport facilities:
▪ Ownership and Operational Framework
▪ What entities own and operate the facilities, and to whom are they responsible?
▪ Legislative and Regulatory Framework
▪ What laws or statutes govern the behaviour of the facilities?
Jamaica Case Study Example
The study team consulted with stakeholders to identify legislative or regulatory
constraints on the airports, such as:
• Civil Aviation Regulations of 2004: requirements for operations of
aerodromes
• Protected Areas Policy of the Palisadoes Peninsula: policy to protect
the sensitive ecosystem
11
1.4 Identify Stakeholders
6/9/2017 21
Develop a list of stakeholders to engage during the assessment process:
▪ Port and airport managers
▪ Port and airport authorities (e.g., Maritime Authority, Airport Authority)
▪ Private sector operators (e.g., ship owners, airline representatives)
▪ Asset owners and operators of interdependent infrastructure (e.g., energy, water)
▪ Government agencies overseeing transport, environment, natural development, and
disaster preparedness
▪ Meteorological service
▪ Local or regional universities
▪ International or other organizations who have done related work
Tips for Engaging
Stakeholders
• Establish regular
communication protocols
• Establish clear requests
for stakeholders
Benefits of engaging stakeholders include:
▪ Help fill data gaps
▪ Build support for adaptation efforts
▪ Build capacity to address risks
Stage 2: Assess Criticality
6/9/2017 22
12
6/9/2017 23
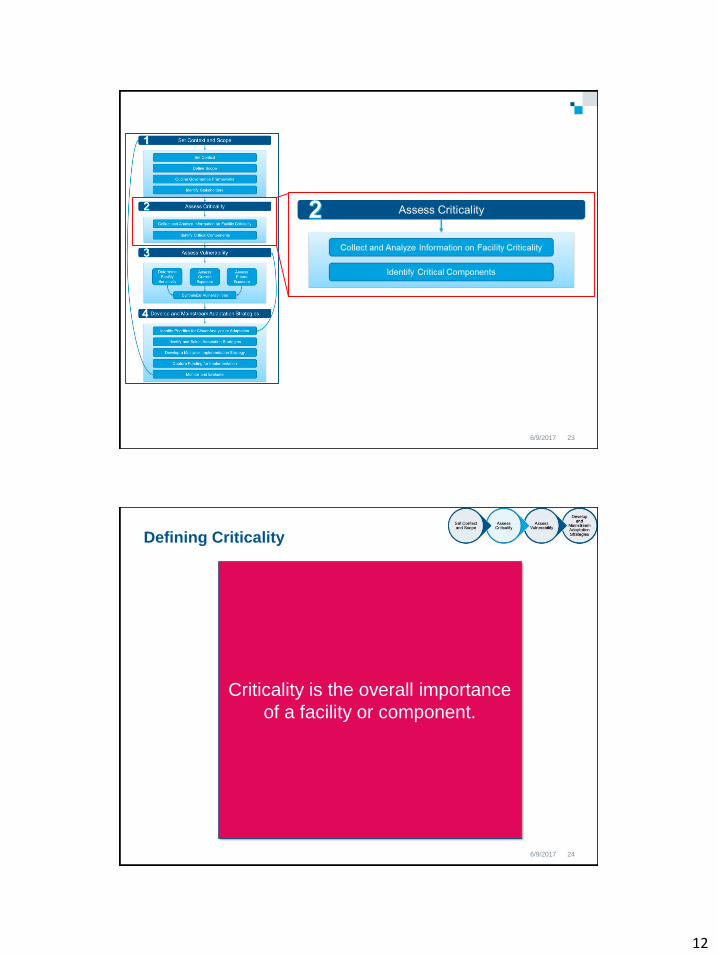
Defining Criticality
6/9/2017 24
Criticality is the overall importance
of a facility or component.
13
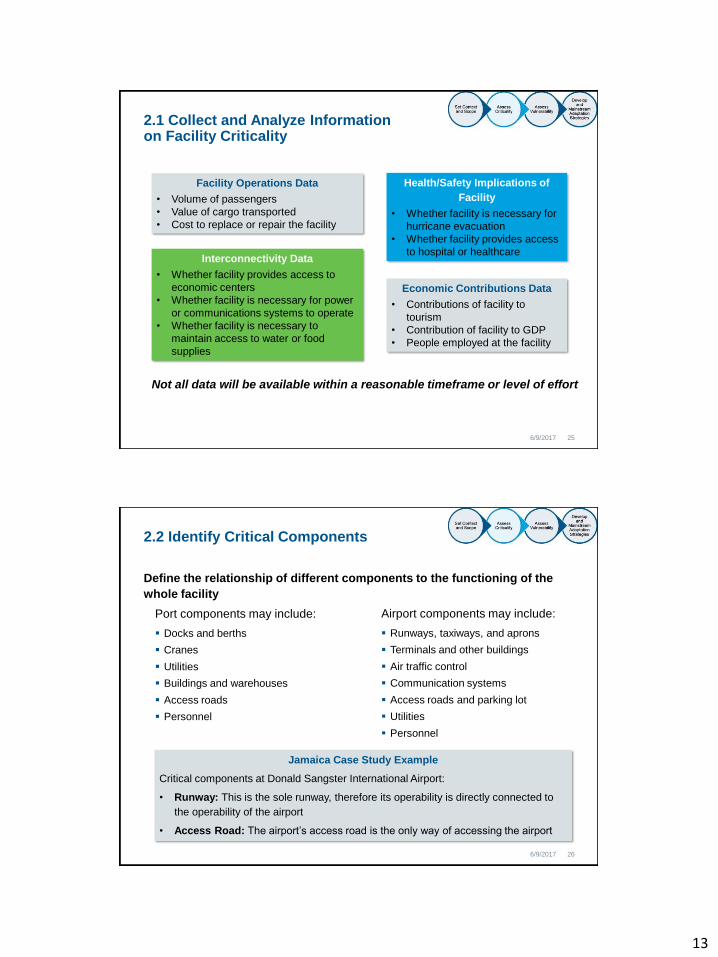
2.1 Collect and Analyze Information on Facility Criticality
6/9/2017 25
Facility Operations Data
• Volume of passengers
• Value of cargo transported
• Cost to replace or repair the facility
Economic Contributions Data
• Contributions of facility to
tourism
• Contribution of facility to GDP
• People employed at the facility
Health/Safety Implications of
Facility
• Whether facility is necessary for
hurricane evacuation
• Whether facility provides access
to hospital or healthcareInterconnectivity Data
• Whether facility provides access to
economic centers
• Whether facility is necessary for power
or communications systems to operate
• Whether facility is necessary to
maintain access to water or food
supplies
Not all data will be available within a reasonable timeframe or level of effort
2.2 Identify Critical Components
6/9/2017 26
Define the relationship of different components to the functioning of the
whole facility
Port components may include:
▪ Docks and berths
▪ Cranes
▪ Utilities
▪ Buildings and warehouses
▪ Access roads
▪ Personnel
Airport components may include:
▪ Runways, taxiways, and aprons
▪ Terminals and other buildings
▪ Air traffic control
▪ Communication systems
▪ Access roads and parking lot
▪ Utilities
▪ Personnel
Jamaica Case Study Example
Critical components at Donald Sangster International Airport:
• Runway: This is the sole runway, therefore its operability is directly connected to
the operability of the airport
• Access Road: The airport’s access road is the only way of accessing the airport
14
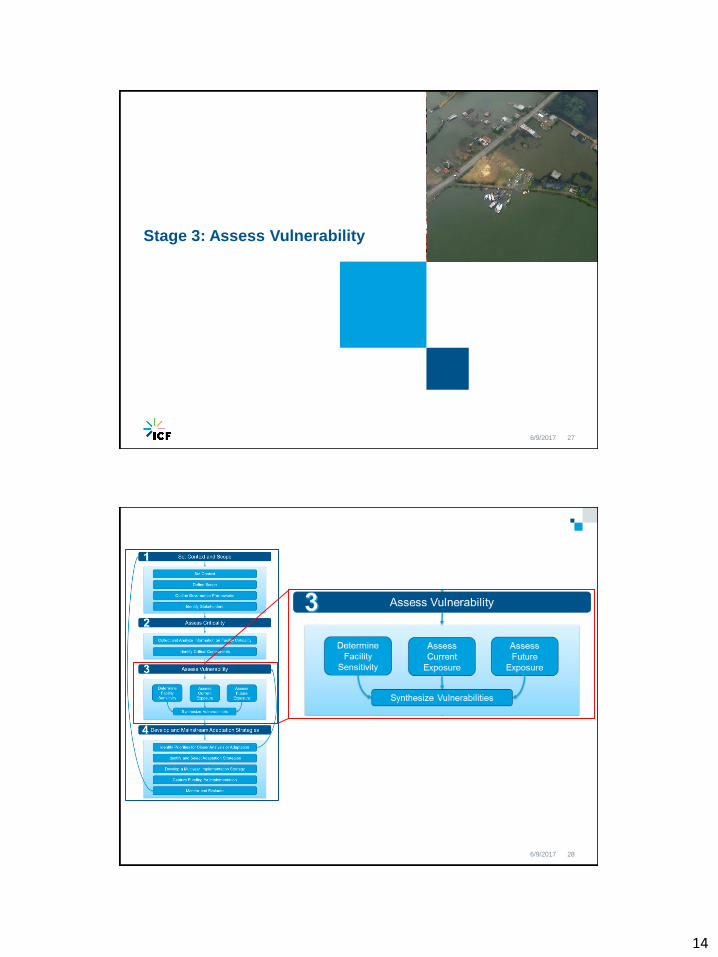
Stage 3: Assess Vulnerability
6/9/2017 27
6/9/2017 28
15
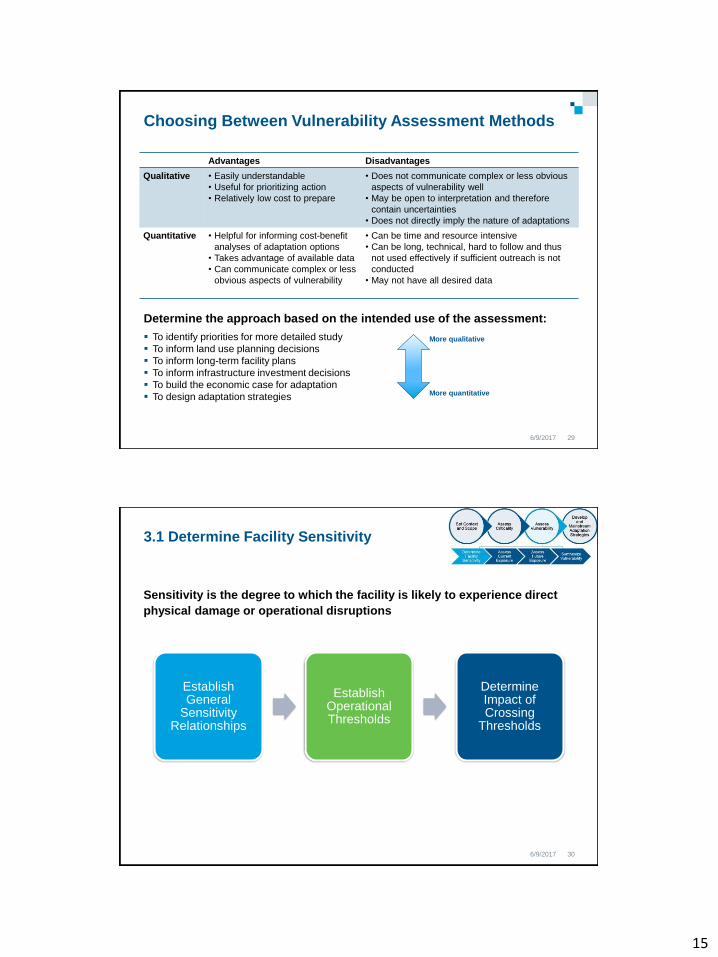
Choosing Between Vulnerability Assessment Methods
Determine the approach based on the intended use of the assessment:
▪ To identify priorities for more detailed study
▪ To inform land use planning decisions
▪ To inform long-term facility plans
▪ To inform infrastructure investment decisions
▪ To build the economic case for adaptation
▪ To design adaptation strategies
6/9/2017 29
Advantages Disadvantages
Qualitative • Easily understandable
• Useful for prioritizing action
• Relatively low cost to prepare
• Does not communicate complex or less obvious
aspects of vulnerability well
• May be open to interpretation and therefore
contain uncertainties
• Does not directly imply the nature of adaptations
Quantitative • Helpful for informing cost-benefit
analyses of adaptation options
• Takes advantage of available data
• Can communicate complex or less
obvious aspects of vulnerability
• Can be time and resource intensive
• Can be long, technical, hard to follow and thus
not used effectively if sufficient outreach is not
conducted
• May not have all desired data
More quantitative
More qualitative
3.1 Determine Facility Sensitivity
6/9/2017 30
Sensitivity is the degree to which the facility is likely to experience direct
physical damage or operational disruptions
Establish General
Sensitivity Relationships
Establish Operational Thresholds
Determine Impact of Crossing
Thresholds

16
General Sensitivity Relationships
6/9/2017 31
Climate
Hazard
Docks Crane
Operations
Access Other
Sea Level
Rise
Higher sea levels can increase the risk of chronic flooding and lead to permanent inundation of dock facilities, making a port inoperable.
Not sensitive. Sea level rise could
affect port access
routes.
Not applicable.
Tropical
Storms/
Hurricanes/
Storm Surge
Storm surge can
damage marine port
facilities, causing
delays in shipping
and transport. For
example, Hurricane
Ivan in Grenada
damaged the main
port terminal and
prevented normal
operations for three
weeks (OECS,
2004).
Not sensitive. Tropical storms can
cause roadway damage
and debris movement,
blocking access to the
port for staff and ground
transport.
Port operations
may be halted for
the duration of the
storm. Floodwaters
or winds can also
transport debris
that must be
removed before
operations can
resume.
Wind Not sensitive. Cranes cannot
be used above
certain wind
speeds.
Inoperable
cranes can
cause delays
in shipping.
Wind can blow over road
signs and stir up dust
from unpaved roads.
Downed signs and
swirling dust can create
confusing and
dangerous travel
conditions.
High wind speeds
could create
hazardous working
conditions for port
staff. Winds can
also transport
debris that must be
removed before
operations can
resume.
Extreme
Heat
Not sensitive. Not sensitive. Extreme heat can result
in asphalt pavement
softening or rutting, or
cracks in concrete
pavement.
Extreme heat can
create hazardous
working conditions
for port staff and
could deteriorate
paved terminal
areas. Extreme
heat can also raise
energy costs for
cooling.
Heavy
Precipitation
/Flooding
Heavy rain can
reduce visibility and
create flooding,
causing damage to
port structures and
equipment and
delaying shipping
and transport.
Flooding can
cause damage
to crane
equipment,
making it
inoperable
and halting or
slowing
Heavy rain can
overwhelm existing
draining systems and
cause flooding, creating
pavement and
embankment failure,
erosion, debris
movement, and
Flood waters can
transport debris
that must be
removed before
operations can
resume. For
example, this has
occurred at
Establish Operational Thresholds
▪ In what conditions is the facility likely to experience damage or
disruption?
• Does the facility have official operational manuals that specify thresholds?
• What conditions is it designed to withstand?
• In which conditions has it been unable to operate in the past?
• In which conditions has it been damaged in the past?
6/9/2017 32
Why establish thresholds?
• Helps focus search for and analysis of climate data (historical and projected)
• Process for sharing and documenting critical institutional knowledge
• Informs monitoring and evaluation over time
• Helps develop practical estimates of risks over time
Level of weather conditions at which a facility or piece of
infrastructure experiences disruption or damage
What is an
operational
threshold?
17
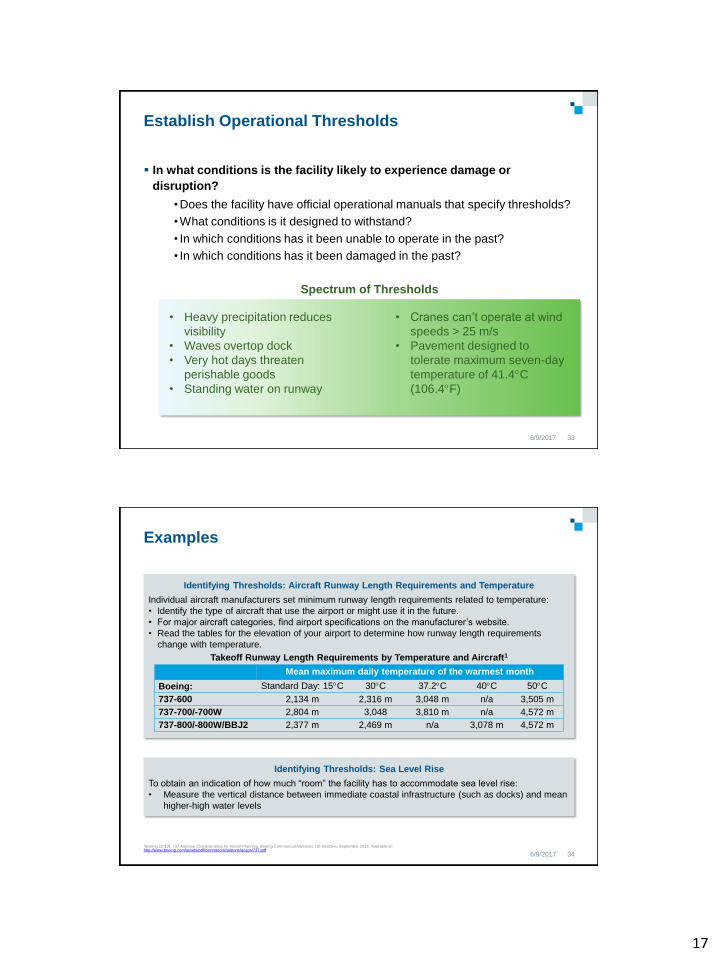
Establish Operational Thresholds
▪ In what conditions is the facility likely to experience damage or
disruption?
• Does the facility have official operational manuals that specify thresholds?
• What conditions is it designed to withstand?
• In which conditions has it been unable to operate in the past?
• In which conditions has it been damaged in the past?
6/9/2017 33
• Cranes can’t operate at wind
speeds > 25 m/s
• Pavement designed to
tolerate maximum seven-day
temperature of 41.4C
(106.4F)
• Heavy precipitation reduces
visibility
• Waves overtop dock
• Very hot days threaten
perishable goods
• Standing water on runway
Spectrum of Thresholds
Examples
6/9/2017 34
1Boeing (2013). 737 Airplane Characteristics for Airport Planning. Boeing Commercial Airplanes. D6-58325-6, September 2013. Available at: http://www.boeing.com/assets/pdf/commercial/airports/acaps/737.pdf
Identifying Thresholds: Sea Level Rise
To obtain an indication of how much “room” the facility has to accommodate sea level rise:
• Measure the vertical distance between immediate coastal infrastructure (such as docks) and mean
higher-high water levels
Identifying Thresholds: Aircraft Runway Length Requirements and Temperature
Individual aircraft manufacturers set minimum runway length requirements related to temperature:
• Identify the type of aircraft that use the airport or might use it in the future.
• For major aircraft categories, find airport specifications on the manufacturer’s website.
• Read the tables for the elevation of your airport to determine how runway length requirements
change with temperature.
Takeoff Runway Length Requirements by Temperature and Aircraft1
Mean maximum daily temperature of the warmest month
Boeing: Standard Day: 15C 30C 37.2C 40C 50C
737-600 2,134 m 2,316 m 3,048 m n/a 3,505 m
737-700/-700W 2,804 m 3,048 3,810 m n/a 4,572 m
737-800/-800W/BBJ2 2,377 m 2,469 m n/a 3,078 m 4,572 m
18
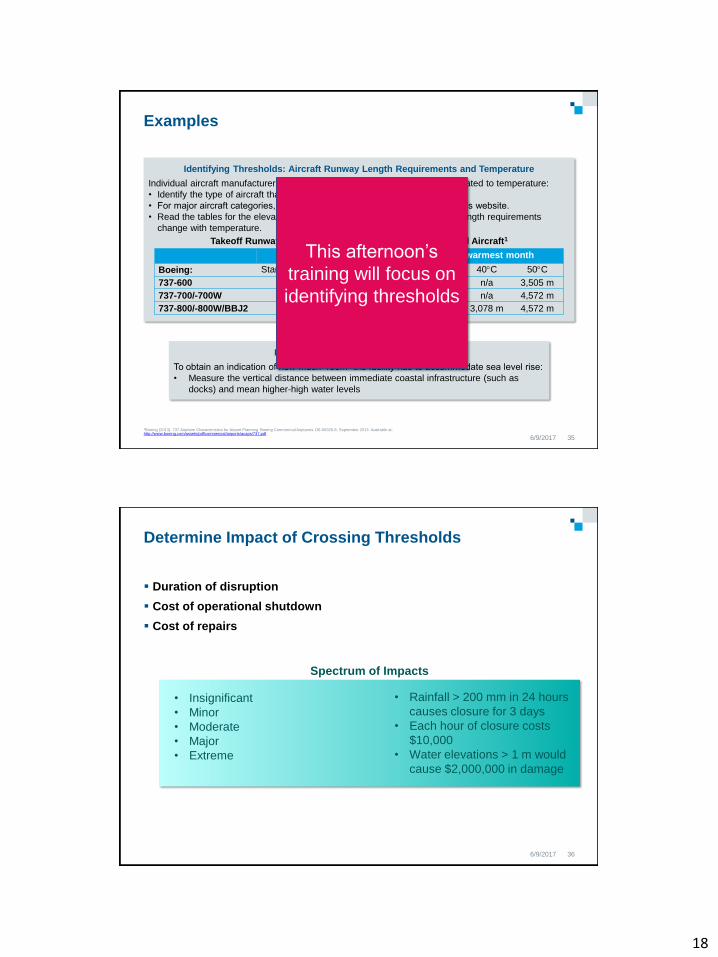
Examples
6/9/2017 35
1Boeing (2013). 737 Airplane Characteristics for Airport Planning. Boeing Commercial Airplanes. D6-58325-6, September 2013. Available at: http://www.boeing.com/assets/pdf/commercial/airports/acaps/737.pdf
Identifying Thresholds: Sea Level Rise
To obtain an indication of how much “room” the facility has to accommodate sea level rise:
• Measure the vertical distance between immediate coastal infrastructure (such as
docks) and mean higher-high water levels
Identifying Thresholds: Aircraft Runway Length Requirements and Temperature
Individual aircraft manufacturers set minimum runway length requirements related to temperature:
• Identify the type of aircraft that use the airport or might use it in the future.
• For major aircraft categories, find airport specifications on the manufacturer’s website.
• Read the tables for the elevation of your airport to determine how runway length requirements
change with temperature.
Takeoff Runway Length Requirements by Temperature and Aircraft1
Mean maximum daily temperature of the warmest month
Boeing: Standard Day: 15C 30C 37.2C 40C 50C
737-600 2,134 m 2,316 m 3,048 m n/a 3,505 m
737-700/-700W 2,804 m 3,048 3,810 m n/a 4,572 m
737-800/-800W/BBJ2 2,377 m 2,469 m n/a 3,078 m 4,572 m
This afternoon’s
training will focus on
identifying thresholds
Determine Impact of Crossing Thresholds
▪ Duration of disruption
▪ Cost of operational shutdown
▪ Cost of repairs
6/9/2017 36
• Rainfall > 200 mm in 24 hours
causes closure for 3 days
• Each hour of closure costs
$10,000
• Water elevations > 1 m would
cause $2,000,000 in damage
• Insignificant
• Minor
• Moderate
• Major
• Extreme
Spectrum of Impacts
19
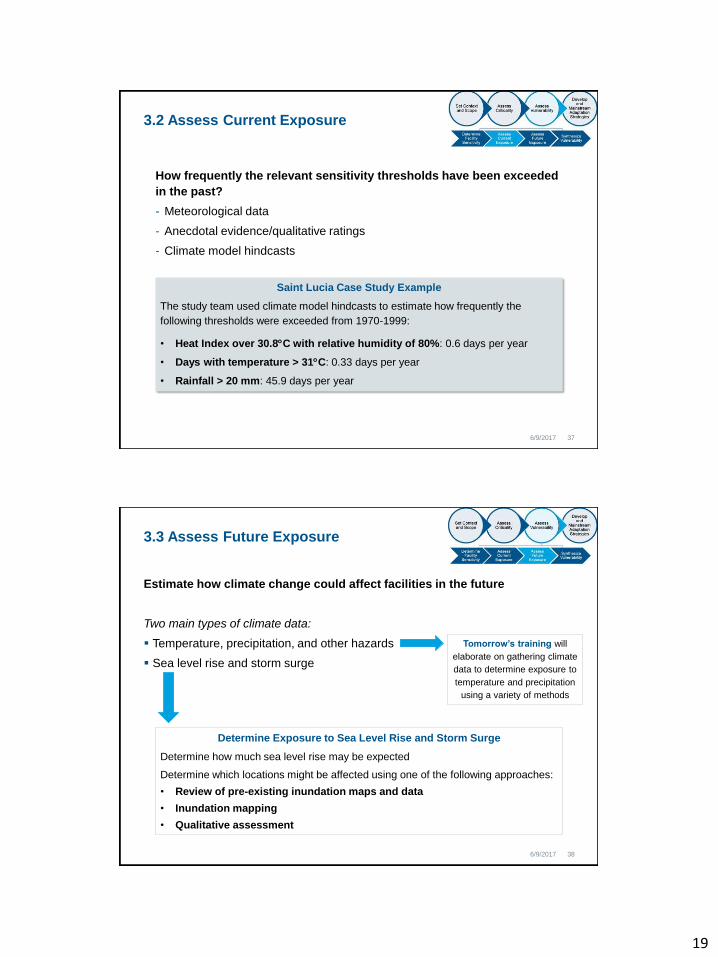
3.2 Assess Current Exposure
6/9/2017 37
How frequently the relevant sensitivity thresholds have been exceeded
in the past?
- Meteorological data
- Anecdotal evidence/qualitative ratings
- Climate model hindcasts
Saint Lucia Case Study Example
The study team used climate model hindcasts to estimate how frequently the
following thresholds were exceeded from 1970-1999:
• Heat Index over 30.8C with relative humidity of 80%: 0.6 days per year
• Days with temperature > 31C: 0.33 days per year
• Rainfall > 20 mm: 45.9 days per year
Estimate how climate change could affect facilities in the future
Two main types of climate data:
▪ Temperature, precipitation, and other hazards
▪ Sea level rise and storm surge
3.3 Assess Future Exposure
6/9/2017 38
Tomorrow’s training will
elaborate on gathering climate
data to determine exposure to
temperature and precipitation
using a variety of methods
Determine Exposure to Sea Level Rise and Storm Surge
Determine how much sea level rise may be expected
Determine which locations might be affected using one of the following approaches:
• Review of pre-existing inundation maps and data
• Inundation mapping
• Qualitative assessment
20
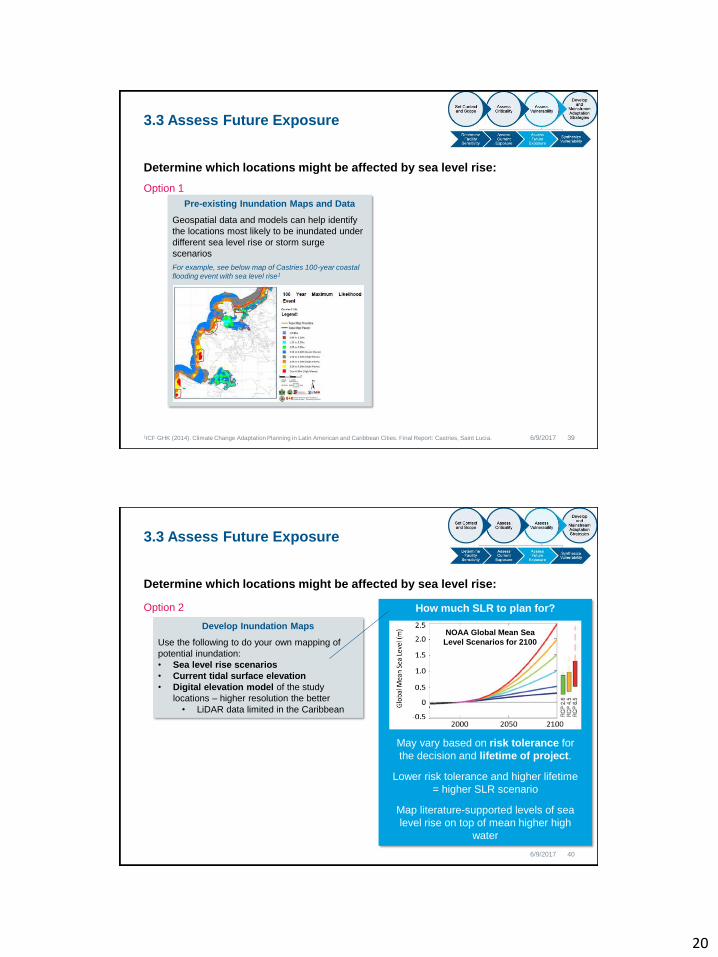
3.3 Assess Future Exposure
6/9/2017 391ICF GHK (2014). Climate Change Adaptation Planning in Latin American and Caribbean Cities. Final Report: Castries, Saint Lucia.
Determine which locations might be affected by sea level rise:
Pre-existing Inundation Maps and Data
Geospatial data and models can help identify
the locations most likely to be inundated under
different sea level rise or storm surge
scenarios
For example, see below map of Castries 100-year coastal
flooding event with sea level rise1
Option 1
3.3 Assess Future Exposure
6/9/2017 40
How much SLR to plan for?
Determine which locations might be affected by sea level rise:
Develop Inundation Maps
Use the following to do your own mapping of
potential inundation:
• Sea level rise scenarios
• Current tidal surface elevation
• Digital elevation model of the study
locations – higher resolution the better
• LiDAR data limited in the Caribbean
NOAA Global Mean Sea
Level Scenarios for 2100
Option 2
May vary based on risk tolerance for
the decision and lifetime of project.
Lower risk tolerance and higher lifetime
= higher SLR scenario
Map literature-supported levels of sea
level rise on top of mean higher high
water
21
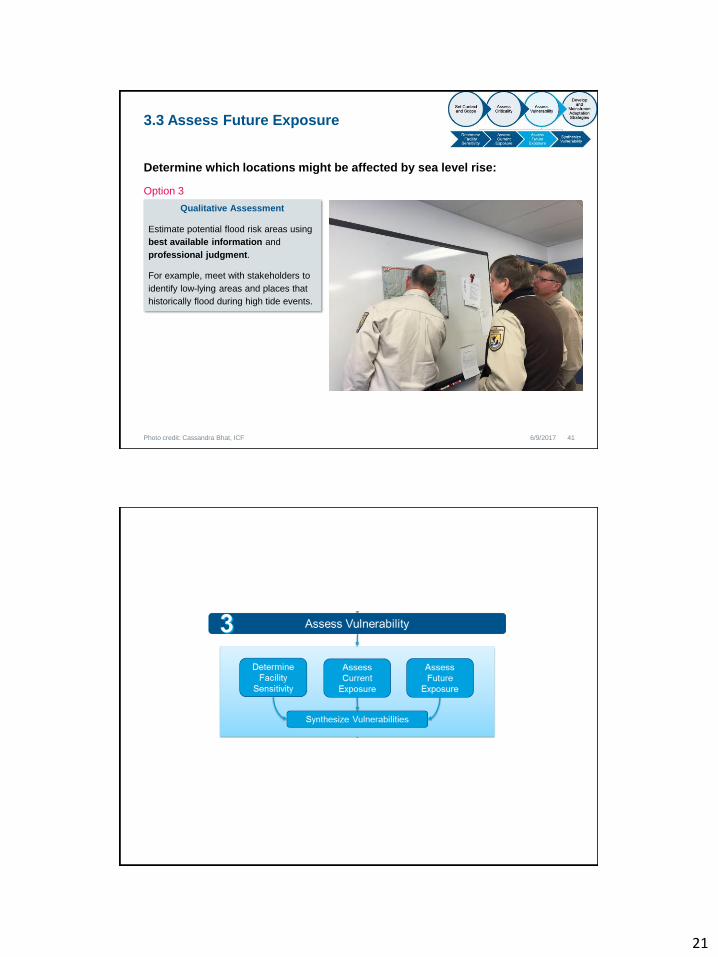
3.3 Assess Future Exposure
6/9/2017 41Photo credit: Cassandra Bhat, ICF
Determine which locations might be affected by sea level rise:
Qualitative Assessment
Estimate potential flood risk areas using
best available information and
professional judgment.
For example, meet with stakeholders to
identify low-lying areas and places that
historically flood during high tide events.
Option 3
22
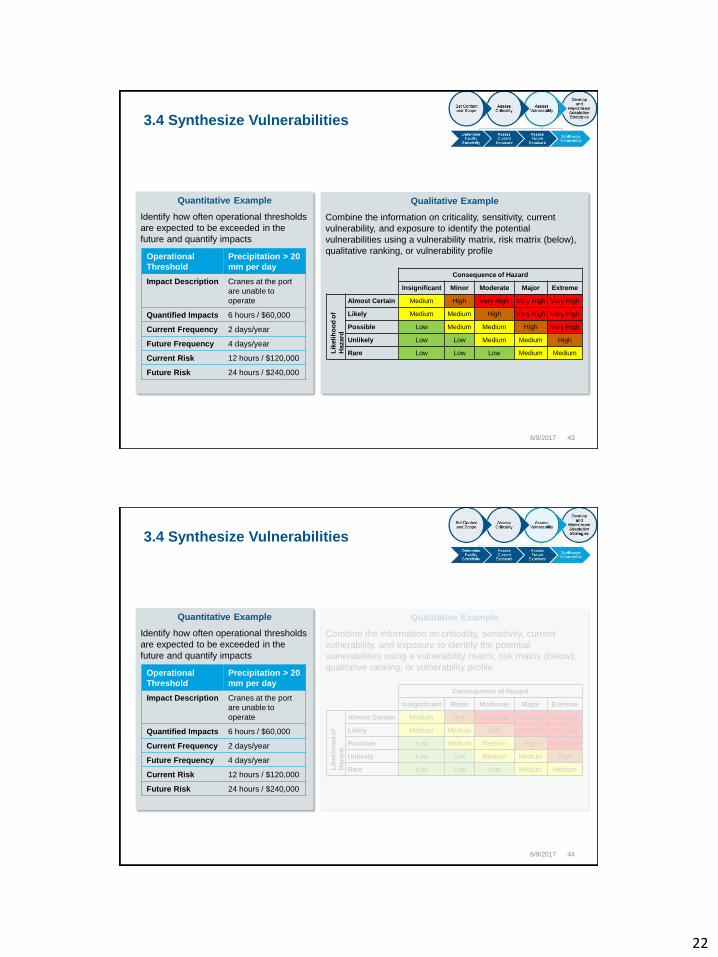
3.4 Synthesize Vulnerabilities
6/9/2017 43
Quantitative Example
Identify how often operational thresholds
are expected to be exceeded in the
future and quantify impacts
Qualitative Example
Combine the information on criticality, sensitivity, current
vulnerability, and exposure to identify the potential
vulnerabilities using a vulnerability matrix, risk matrix (below),
qualitative ranking, or vulnerability profile Operational
Threshold
Precipitation > 20
mm per day
Impact Description Cranes at the port
are unable to
operate
Quantified Impacts 6 hours / $60,000
Current Frequency 2 days/year
Future Frequency 4 days/year
Current Risk 12 hours / $120,000
Future Risk 24 hours / $240,000
Consequence of Hazard
Insignificant Minor Moderate Major Extreme
Lik
eli
ho
od
of
Hazard
Almost Certain Medium High Very High Very High Very High
Likely Medium Medium High Very High Very High
Possible Low Medium Medium High Very High
Unlikely Low Low Medium Medium High
Rare Low Low Low Medium Medium
3.4 Synthesize Vulnerabilities
6/9/2017 44
Quantitative Example
Identify how often operational thresholds
are expected to be exceeded in the
future and quantify impacts
Qualitative Example
Combine the information on criticality, sensitivity, current
vulnerability, and exposure to identify the potential
vulnerabilities using a vulnerability matrix, risk matrix (below),
qualitative ranking, or vulnerability profile Operational
Threshold
Precipitation > 20
mm per day
Impact Description Cranes at the port
are unable to
operate
Quantified Impacts 6 hours / $60,000
Current Frequency 2 days/year
Future Frequency 4 days/year
Current Risk 12 hours / $120,000
Future Risk 24 hours / $240,000
Consequence of Hazard
Insignificant Minor Moderate Major Extreme
Lik
eli
ho
od
of
Hazard
Almost Certain Medium High Very High Very High Very High
Likely Medium Medium High Very High Very High
Possible Low Medium Medium High Very High
Unlikely Low Low Medium Medium High
Rare Low Low Low Medium Medium
23
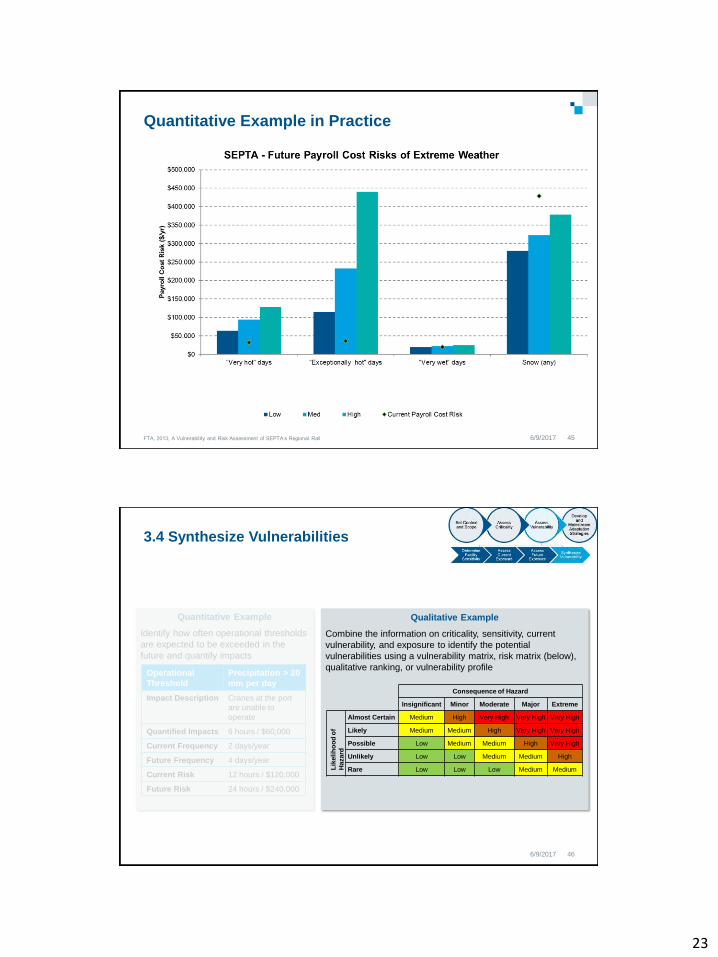
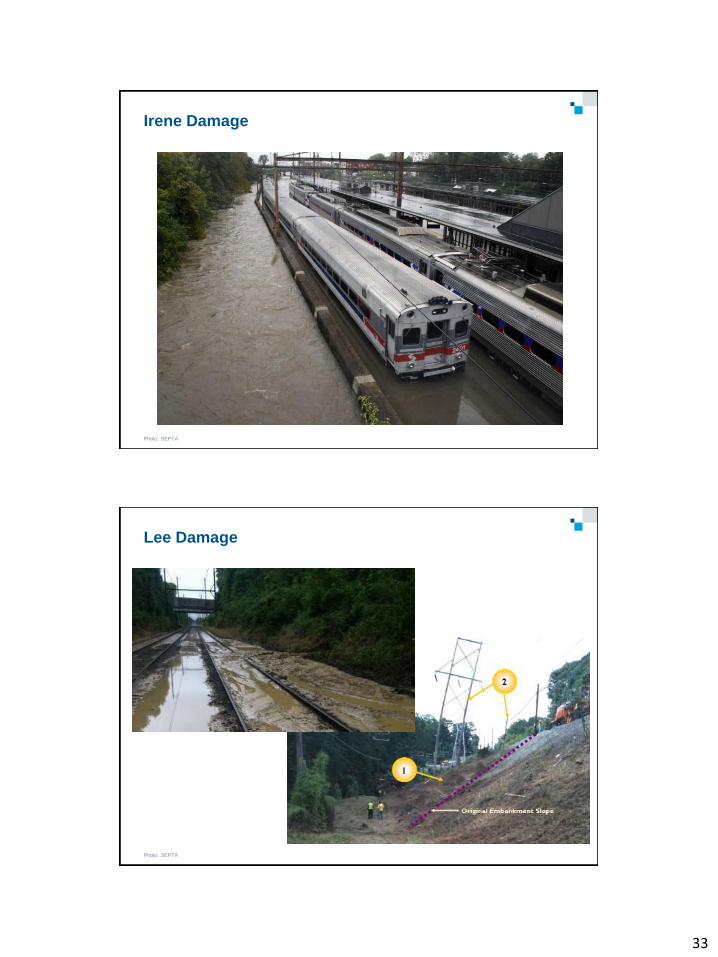
Quantitative Example in Practice
6/9/2017 45FTA, 2013, A Vulnerability and Risk Assessment of SEPTA’s Regional Rail
3.4 Synthesize Vulnerabilities
6/9/2017 46
Quantitative Example
Identify how often operational thresholds
are expected to be exceeded in the
future and quantify impacts
Qualitative Example
Combine the information on criticality, sensitivity, current
vulnerability, and exposure to identify the potential
vulnerabilities using a vulnerability matrix, risk matrix (below),
qualitative ranking, or vulnerability profile Operational
Threshold
Precipitation > 20
mm per day
Impact Description Cranes at the port
are unable to
operate
Quantified Impacts 6 hours / $60,000
Current Frequency 2 days/year
Future Frequency 4 days/year
Current Risk 12 hours / $120,000
Future Risk 24 hours / $240,000
Consequence of Hazard
Insignificant Minor Moderate Major Extreme
Lik
eli
ho
od
of
Hazard
Almost Certain Medium High Very High Very High Very High
Likely Medium Medium High Very High Very High
Possible Low Medium Medium High Very High
Unlikely Low Low Medium Medium High
Rare Low Low Low Medium Medium

24
Qualitative Example in Practice
6/9/2017 47Adapted from Cox R, Panayotou K, Cornwel R, and Blacka M (2013). Climate Risk Assessment for Ports and Connected Infrastructure: Case Study Avatiu Port, Rarotonga, Cook Islands. Water Research Laboratory (WRL) Technical Report 2013/15. October 2013. Available at: http://www.mfem.gov.ck/images/documents/DCD_Docs/Climate_Change/Coastal_Adaptation/WRL_TR2013_15_Final.pdf
Avatiu Port, Rarotonga, Cook Islands
Stage 4: Develop and Mainstream Adaptation Strategies
6/9/2017 48
25
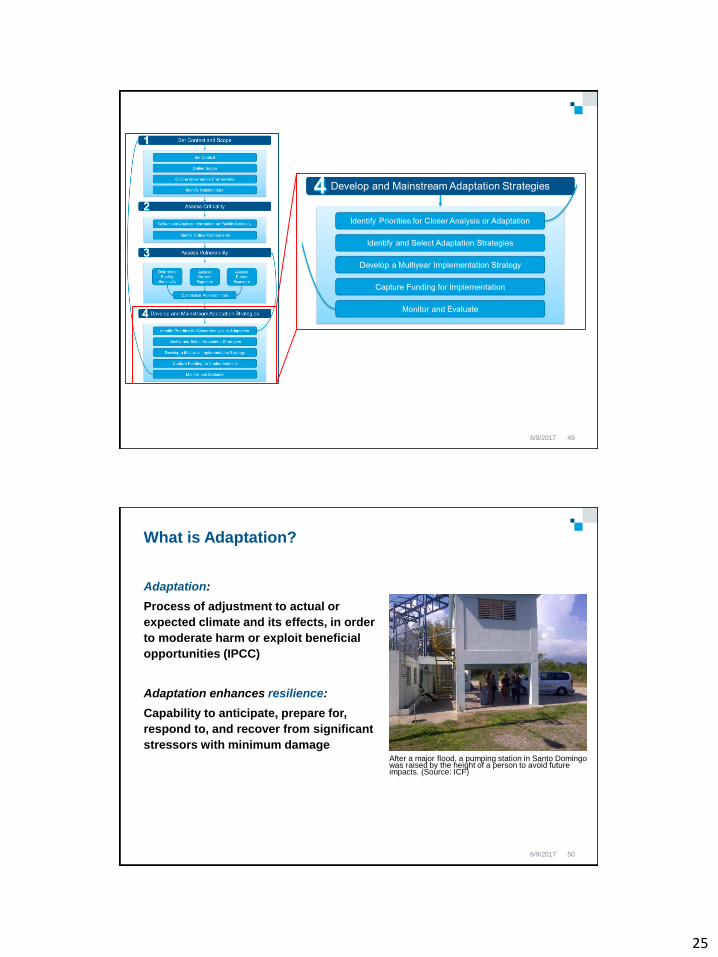
6/9/2017 49
What is Adaptation?
Adaptation:
Process of adjustment to actual or
expected climate and its effects, in order
to moderate harm or exploit beneficial
opportunities (IPCC)
Adaptation enhances resilience:
Capability to anticipate, prepare for,
respond to, and recover from significant
stressors with minimum damage
6/9/2017 50
After a major flood, a pumping station in Santo Domingo was raised by the height of a person to avoid future impacts. (Source: ICF)
26
Recipe for Success in Adaptation Planning
▪ Serve now or later
▪ Augment as needed
▪ Variety of “flavors”
6/9/2017 51
4.1 Identify Priorities for Closer Analysis or Adaptation
6/9/2017 52
What are the adaptation priorities? (from vulnerability assessment)
Where do you need further information in order to act?
▪ Further analysis is useful where the costs of adaptation could be high
▪ Some adaptation measures can be justified from economic, social, and
environmental perspectives regardless of the future changes in climate
27
4.2 Identify and Select Adaptation Strategies
Strategic planning & policy
▪ Airport/port strategic plan
▪ Airport/port master plan
▪ Land-use planning
▪ Utility planning
Infrastructure development
▪ Infrastructure siting, design specifications
▪ Construction budget and schedule
Program management
▪ Staff training
Operations & maintenance
▪ Maintenance schedules
▪ Annual maintenance budget
Emergency management & disaster risk reduction
▪ Worst case scenarios
▪ Proactive mitigation
6/9/2017 53
Adaptation options may not be
technologically innovative or
climate change‐specific; many will
involve well‐established
technologies and management
approaches applied wisely to
address climate risks.
Adaptation can apply to all levels of
decision-making
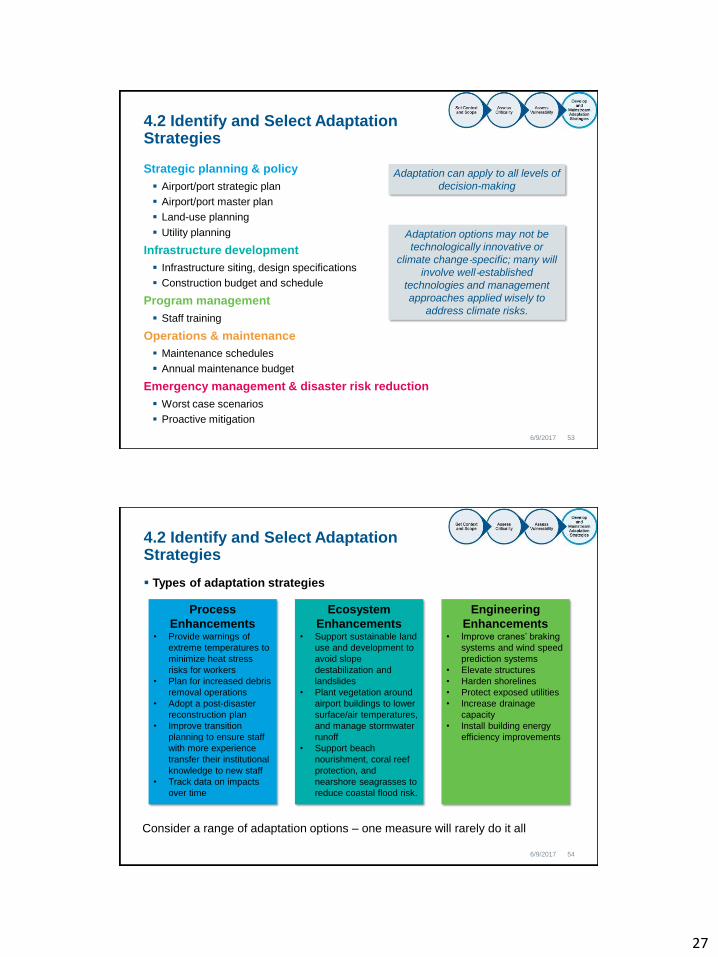
4.2 Identify and Select Adaptation Strategies
▪ Types of adaptation strategies
6/9/2017 54
Process
Enhancements• Provide warnings of
extreme temperatures to
minimize heat stress
risks for workers
• Plan for increased debris
removal operations
• Adopt a post-disaster
reconstruction plan
• Improve transition
planning to ensure staff
with more experience
transfer their institutional
knowledge to new staff
• Track data on impacts
over time
Ecosystem
Enhancements• Support sustainable land
use and development to
avoid slope
destabilization and
landslides
• Plant vegetation around
airport buildings to lower
surface/air temperatures,
and manage stormwater
runoff
• Support beach
nourishment, coral reef
protection, and
nearshore seagrasses to
reduce coastal flood risk.
Engineering
Enhancements• Improve cranes’ braking
systems and wind speed
prediction systems
• Elevate structures
• Harden shorelines
• Protect exposed utilities
• Increase drainage
capacity
• Install building energy
efficiency improvements
Consider a range of adaptation options – one measure will rarely do it all
28
4.2 Identify and Select Adaptation Strategies
Identify adaptation strategies through:
▪ Collective brainstorming with system and asset managers as well as relevant
stakeholders to collaboratively brainstorm adaptation strategies
▪ Exploring relevant adaptation strategies proposed for or implemented locally or
elsewhere
▪ Seeking guidance from relevant experts from both inside and outside of the
refuge
6/9/2017 55
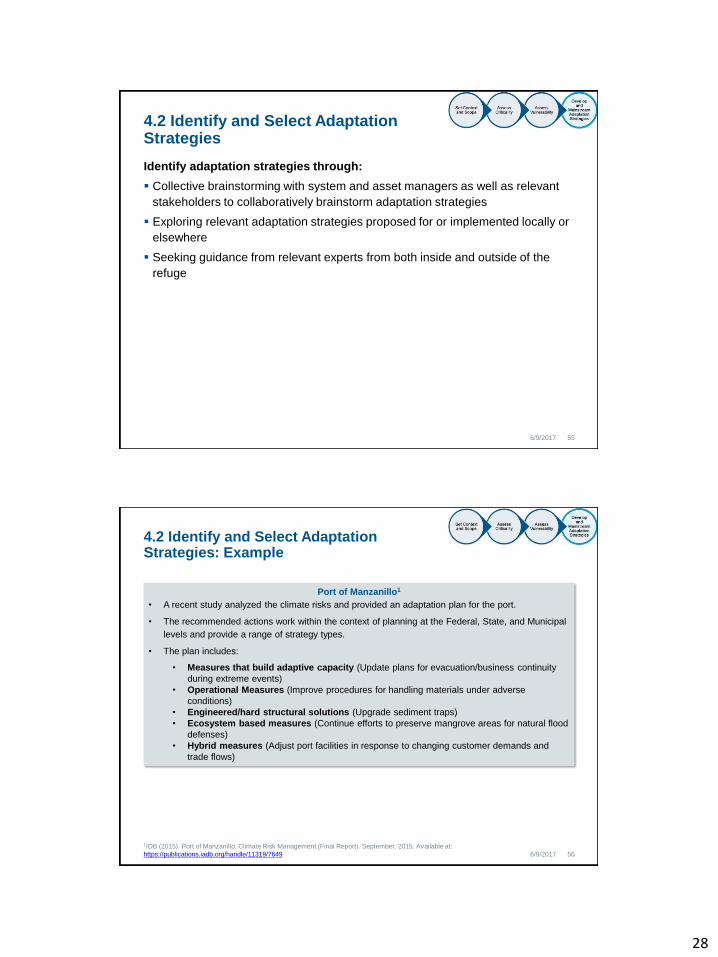
4.2 Identify and Select Adaptation Strategies: Example
6/9/2017 56
1IDB (2015). Port of Manzanillo: Climate Risk Management (Final Report). September, 2015. Available at:
https://publications.iadb.org/handle/11319/7649
Port of Manzanillo1
• A recent study analyzed the climate risks and provided an adaptation plan for the port.
• The recommended actions work within the context of planning at the Federal, State, and Municipal
levels and provide a range of strategy types.
• The plan includes:
• Measures that build adaptive capacity (Update plans for evacuation/business continuity
during extreme events)
• Operational Measures (Improve procedures for handling materials under adverse
conditions)
• Engineered/hard structural solutions (Upgrade sediment traps)
• Ecosystem based measures (Continue efforts to preserve mangrove areas for natural flood
defenses)
• Hybrid measures (Adjust port facilities in response to changing customer demands and
trade flows)
29
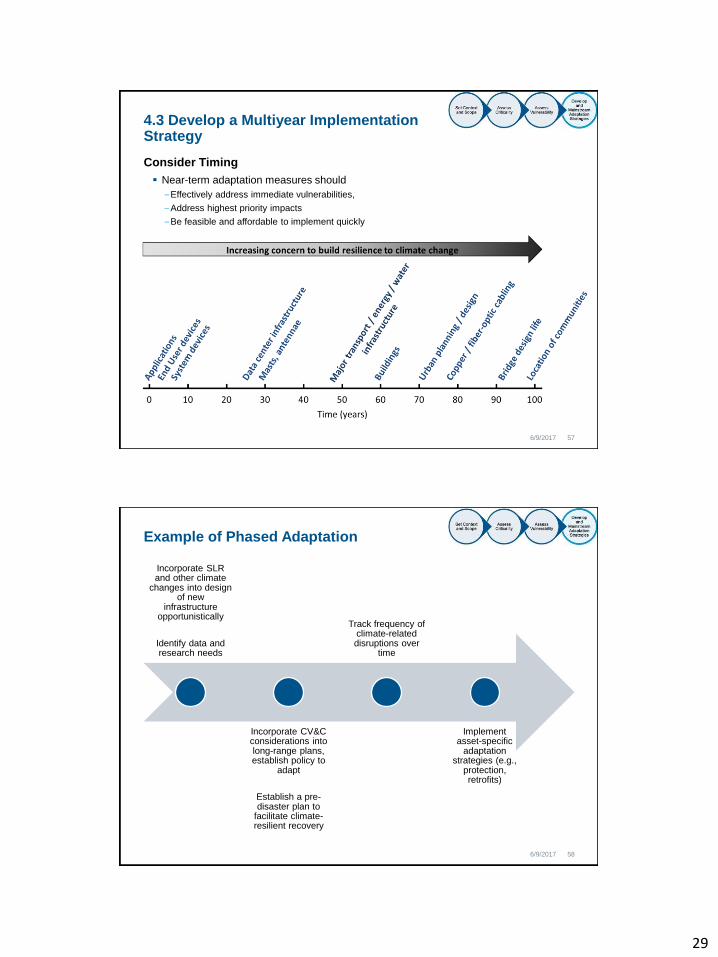
4.3 Develop a Multiyear ImplementationStrategy
6/9/2017 57
Consider Timing
▪ Near-term adaptation measures should
–Effectively address immediate vulnerabilities,
–Address highest priority impacts
–Be feasible and affordable to implement quickly
Example of Phased Adaptation
6/9/2017 58
Incorporate SLR and other climate
changes into design of new
infrastructure opportunistically
Identify data and research needs
Incorporate CV&C considerations into long-range plans, establish policy to
adapt
Establish a pre-disaster plan to
facilitate climate-resilient recovery
Track frequency of climate-related disruptions over
time
Implement asset-specific
adaptation strategies (e.g.,
protection, retrofits)
30
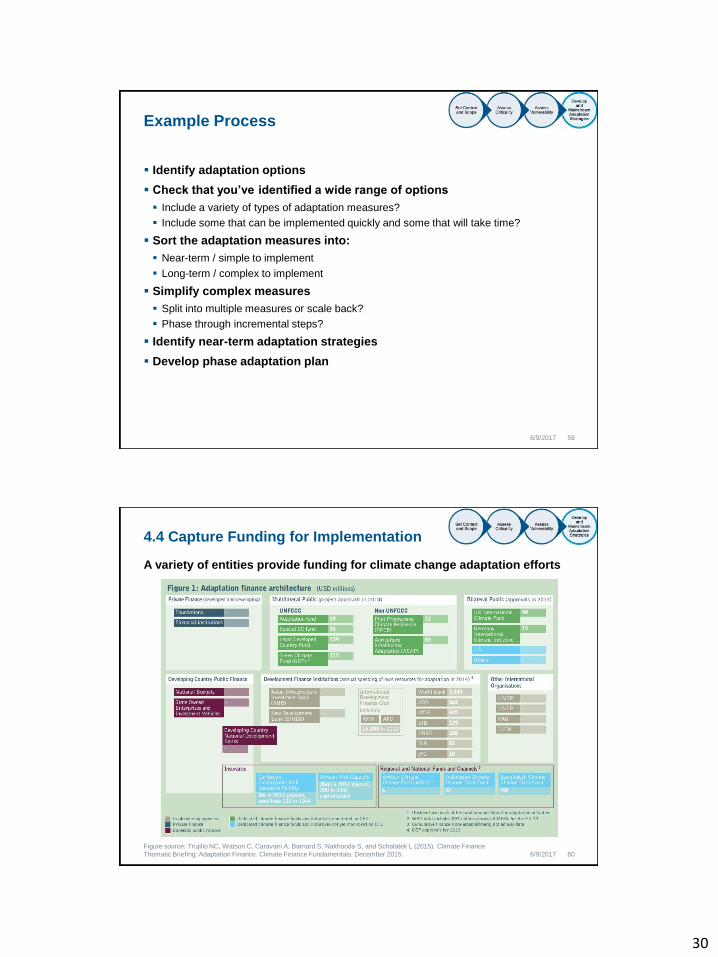
Example Process
▪ Identify adaptation options
▪ Check that you’ve identified a wide range of options
▪ Include a variety of types of adaptation measures?
▪ Include some that can be implemented quickly and some that will take time?
▪ Sort the adaptation measures into:
▪ Near-term / simple to implement
▪ Long-term / complex to implement
▪ Simplify complex measures
▪ Split into multiple measures or scale back?
▪ Phase through incremental steps?
▪ Identify near-term adaptation strategies
▪ Develop phase adaptation plan
6/9/2017 59
4.4 Capture Funding for Implementation
6/9/2017 60
Figure source: Trujillo NC, Watson C, Caravani A, Barnard S, Nakhooda S, and Schalatek L (2015). Climate Finance
Thematic Briefing: Adaptation Finance. Climate Finance Fundamentals. December 2015.
A variety of entities provide funding for climate change adaptation efforts
31
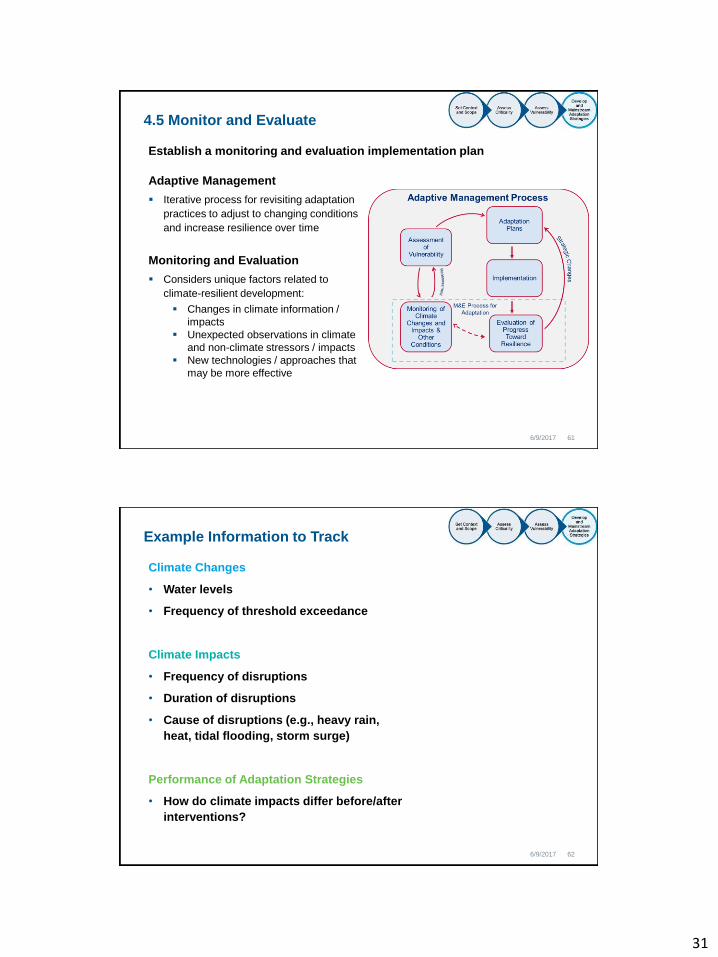
4.5 Monitor and Evaluate
6/9/2017 61
Establish a monitoring and evaluation implementation plan
Adaptive Management
▪ Iterative process for revisiting adaptation
practices to adjust to changing conditions
and increase resilience over time
Monitoring and Evaluation
▪ Considers unique factors related to
climate-resilient development:
▪ Changes in climate information /
impacts
▪ Unexpected observations in climate
and non-climate stressors / impacts
▪ New technologies / approaches that
may be more effective
Example Information to Track
6/9/2017 62
Climate Changes
• Water levels
• Frequency of threshold exceedance
Climate Impacts
• Frequency of disruptions
• Duration of disruptions
• Cause of disruptions (e.g., heavy rain,
heat, tidal flooding, storm surge)
Performance of Adaptation Strategies
• How do climate impacts differ before/after
interventions?
32
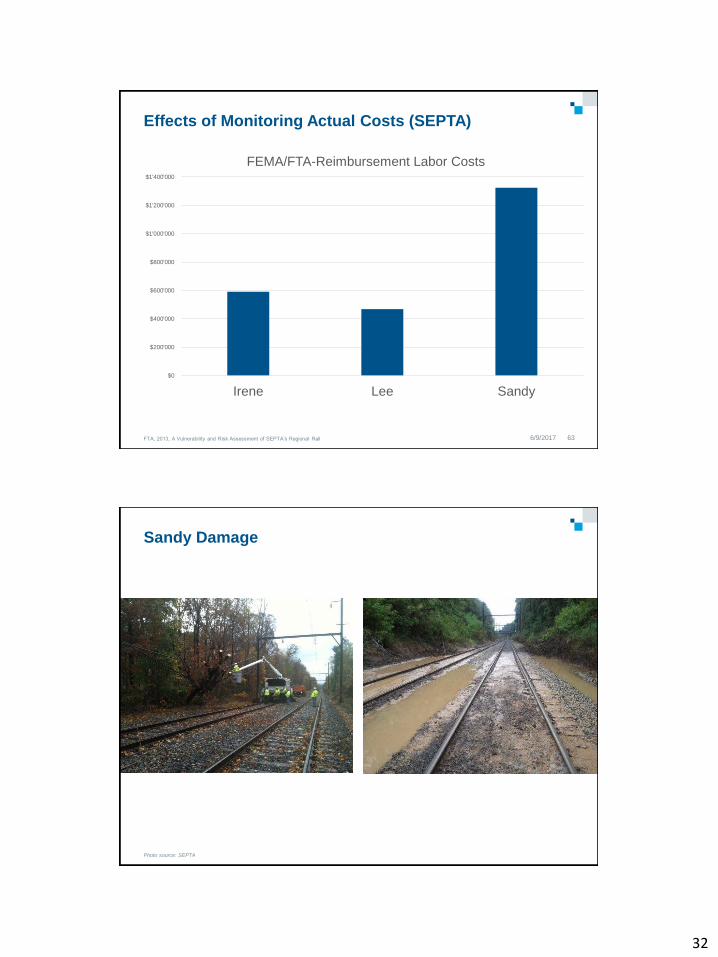
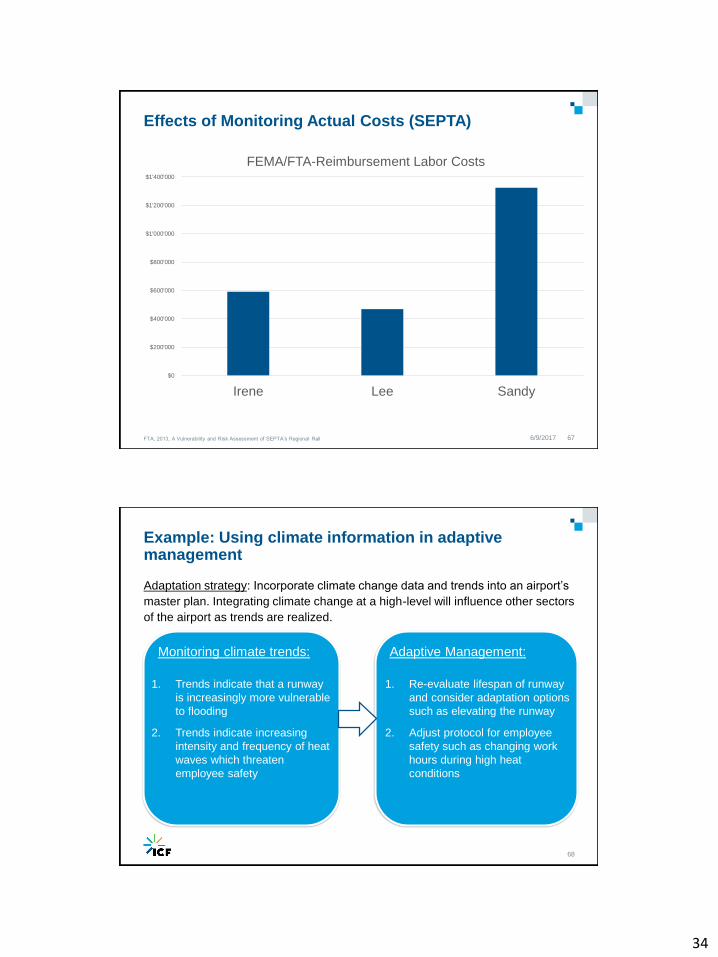
Effects of Monitoring Actual Costs (SEPTA)
6/9/2017 63FTA, 2013, A Vulnerability and Risk Assessment of SEPTA’s Regional Rail
$0
$200'000
$400'000
$600'000
$800'000
$1'000'000
$1'200'000
$1'400'000
Irene Lee Sandy
FEMA/FTA-Reimbursement Labor Costs
Sandy Damage
Photo source: SEPTA
33
Irene Damage
Photo: SEPTA
Lee Damage
Photo: SEPTA
34
Effects of Monitoring Actual Costs (SEPTA)
6/9/2017 67FTA, 2013, A Vulnerability and Risk Assessment of SEPTA’s Regional Rail
$0
$200'000
$400'000
$600'000
$800'000
$1'000'000
$1'200'000
$1'400'000
Irene Lee Sandy
FEMA/FTA-Reimbursement Labor Costs
Example: Using climate information in adaptive management
68
Adaptation strategy: Incorporate climate change data and trends into an airport’s
master plan. Integrating climate change at a high-level will influence other sectors
of the airport as trends are realized.
Monitoring climate trends: Adaptive Management:
1. Trends indicate that a runway
is increasingly more vulnerable
to flooding
2. Trends indicate increasing
intensity and frequency of heat
waves which threaten
employee safety
1. Re-evaluate lifespan of runway
and consider adaptation options
such as elevating the runway
2. Adjust protocol for employee
safety such as changing work
hours during high heat
conditions
35
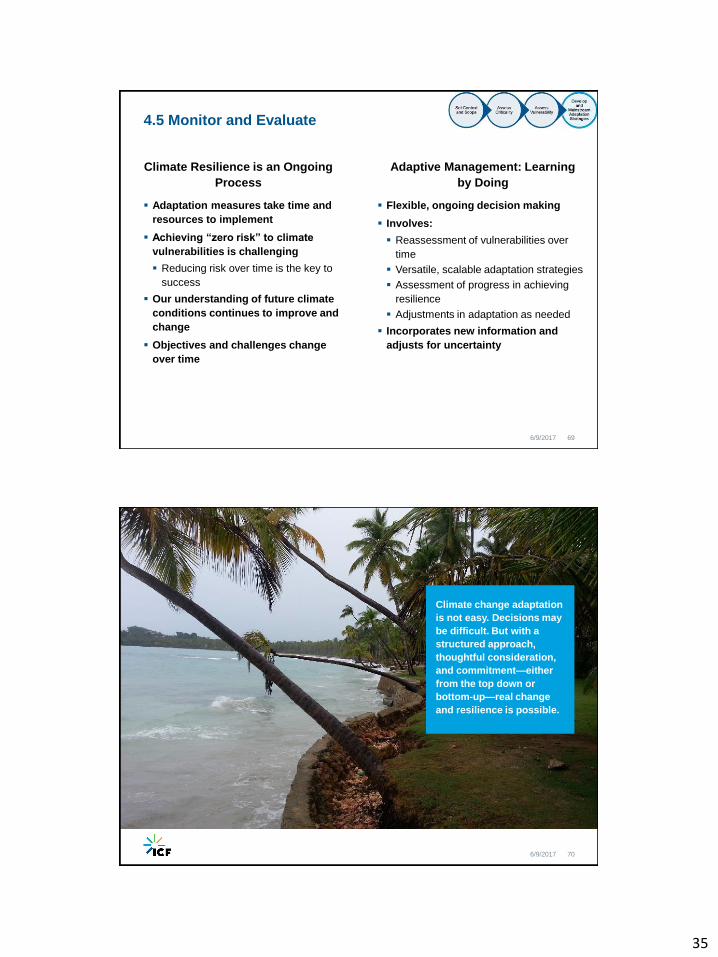
4.5 Monitor and Evaluate
6/9/2017 69
Adaptive Management: Learning
by Doing
▪ Flexible, ongoing decision making
▪ Involves:
▪ Reassessment of vulnerabilities over
time
▪ Versatile, scalable adaptation strategies
▪ Assessment of progress in achieving
resilience
▪ Adjustments in adaptation as needed
▪ Incorporates new information and
adjusts for uncertainty
Climate Resilience is an Ongoing
Process
▪ Adaptation measures take time and
resources to implement
▪ Achieving “zero risk” to climate
vulnerabilities is challenging
▪ Reducing risk over time is the key to
success
▪ Our understanding of future climate
conditions continues to improve and
change
▪ Objectives and challenges change
over time
6/9/2017 70
Climate change adaptation
is not easy. Decisions may
be difficult. But with a
structured approach,
thoughtful consideration,
and commitment—either
from the top down or
bottom-up—real change
and resilience is possible.
36
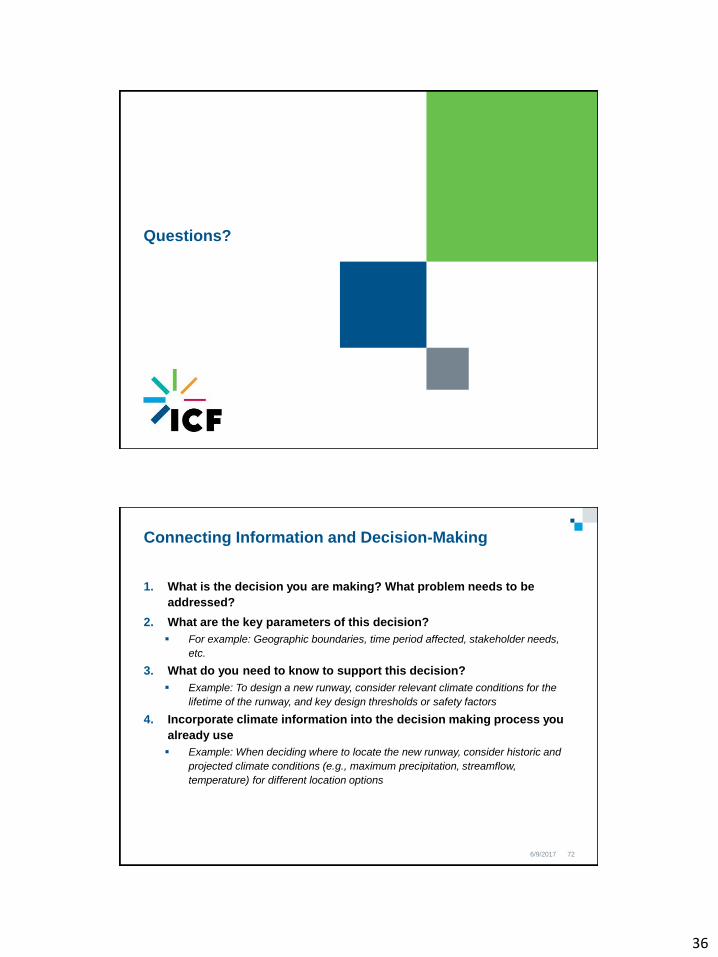
Questions?
Connecting Information and Decision-Making
1. What is the decision you are making? What problem needs to be
addressed?
2. What are the key parameters of this decision?
▪ For example: Geographic boundaries, time period affected, stakeholder needs,
etc.
3. What do you need to know to support this decision?
▪ Example: To design a new runway, consider relevant climate conditions for the
lifetime of the runway, and key design thresholds or safety factors
4. Incorporate climate information into the decision making process you
already use
▪ Example: When deciding where to locate the new runway, consider historic and
projected climate conditions (e.g., maximum precipitation, streamflow,
temperature) for different location options
6/9/2017 72
37
Example Decisions
▪ We are planning to build a new runway to accommodate higher expected
traffic. How long should the runway be? What elevation should it be? How
much drainage capacity is needed?
▪ Should we update our annual emergency management exercises so that
our worst-case scenario for storm surge accounts for recent and
expected sea level rise?
▪ Should I change anything about how I maintain my pavement or other
infrastructure?
▪ Will climate change affect any of the projects in our strategic or master
plan?
▪ Do we need back-up or redundant transportation modes?
▪ Will climate change affect expected demand for tourism to the island?
▪ Do I need to create other coastal protections?
6/9/2017 73


