

Understanding Emissions and Tropospheric Chemistry using NUCAPS and VIIRS
NOAA OAR ESRL: G. Frost, S. McKeen, S.-W. Kim, R. Ahmadov, M. Trainer, Y. Cui, W. Angevine, T. Ryerson, J. Roberts, C. Warneke, C. Granier, K. Rosenlof, J. Brioude STC: C. Barnet, N. Smith, A. Gambacorta NOAA NESDIS STAR: R. B. Pierce NOAA NESDIS NCEI: C. Elvidge
A JPSS Proving Ground/Risk Reduction Project

Project Overview Goal: Use aircraft data and atmospheric models to characterize NUCAPS CH4 and CO retrievals
Objectives: • Validate atmospheric chemical-transport models with aircraft
observations • Simulate spatial and temporal variability of CH4 and CO • Evaluate NUCAPS CH4 and CO retrievals with validated model • Assess ability of JPSS datasets to constrain modeled CH4 and CO
End Users: Researchers and forecasters at NOAA and elsewhere
Close collaboration of NOAA ESRL team with STC NUCAPS retrieval team and NESDIS STAR analysis team is absolutely critical to this project’s success and adds value to PGRR investment
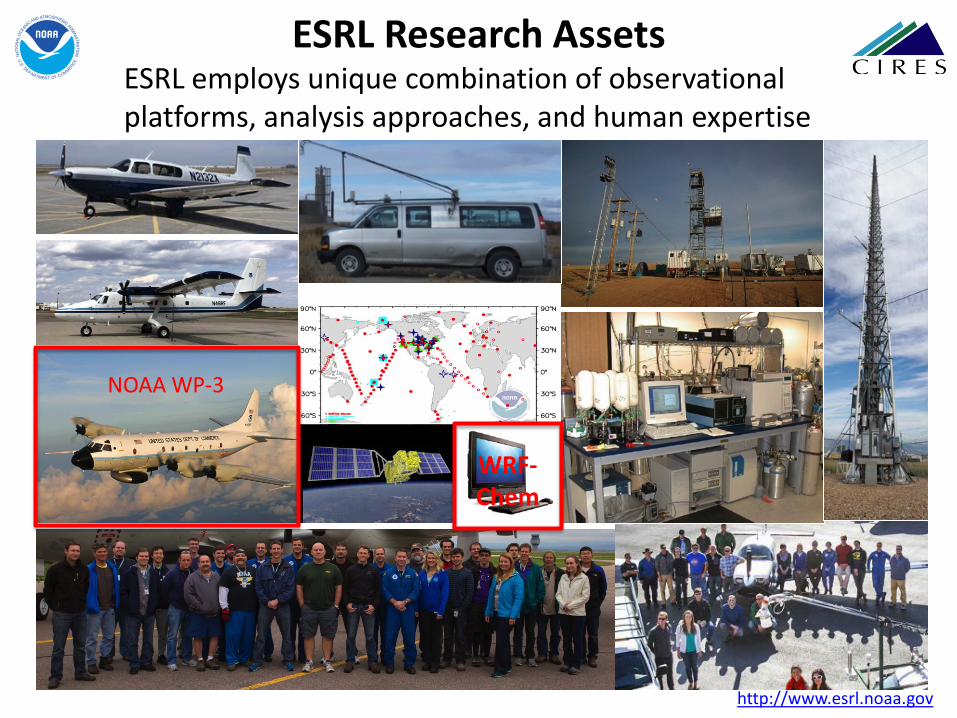
ESRL employs unique combination of observational platforms, analysis approaches, and human expertise
ESRL Research Assets
NOAA WP-3
http://www.esrl.noaa.gov
WRF-Chem
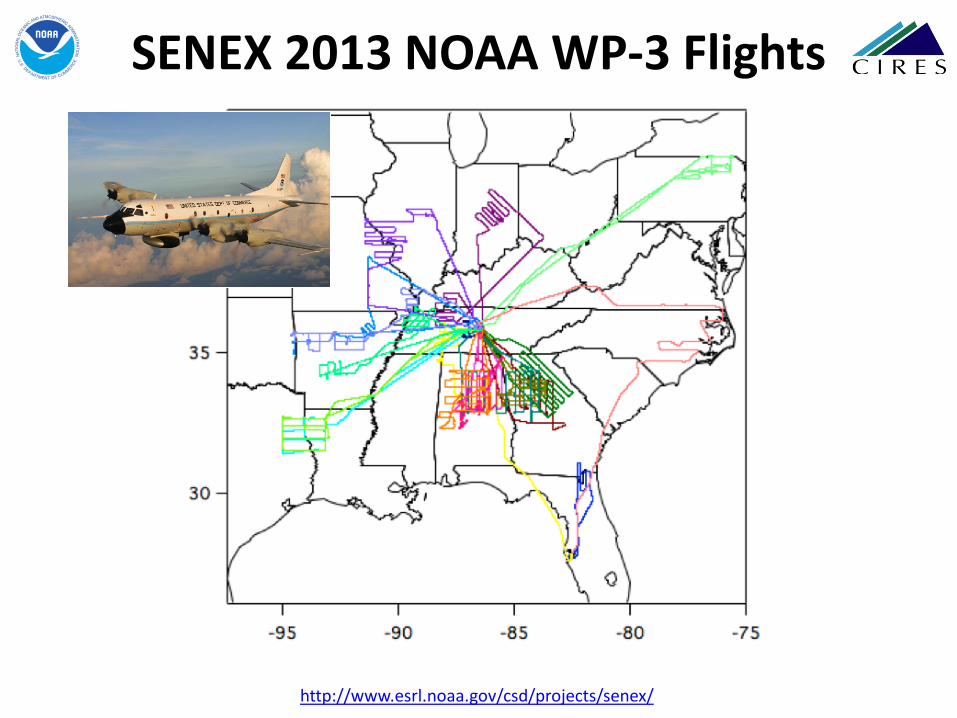
SENEX 2013 NOAA WP-3 Flights
http://www.esrl.noaa.gov/csd/projects/senex/

Detecting Source Signatures with Aircraft Data
Stuart McKeen

CrIS CH4 Vertical Sensitivity
Xiaozhen Xiong et al., CrIS Trace Gas Data Users Workshop, 18 Sept 2014

NUCAPS vs. WRF-Chem Model Comparison
Brad Pierce, Stuart McKeen

NUCAPS CH4 Science Retrievals: Initial Data Processing Issues
• Many granules not processed due to failures in pre-processor code, possibly from too stringent ATMS QC threshold
• “Acceptable” QC (QC = 0): Daytime data rejection >> nighttime over land, likely from too stringent CrIS QC threshold
• Very noisy CH4 signal. Noise filter or averaging may be needed.
• CrIS averaging kernels not initially available Chris Barnet

Improved NUCAPS Science Code Quality Control Thresholds
Nadia Smith
Before QC Changes After QC Changes
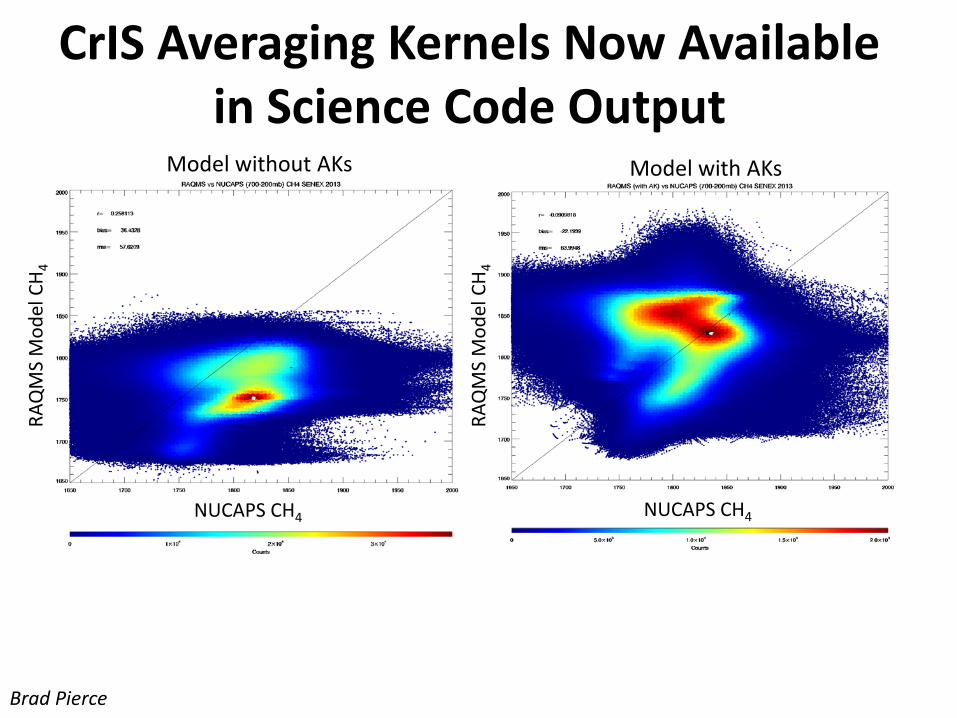
CrIS Averaging Kernels Now Available in Science Code Output
Model without AKs
Brad Pierce
Model with AKs
RAQ
MS
Mod
el C
H 4
NUCAPS CH4 RA
QM
S M
odel
CH 4
NUCAPS CH4

Analyzing Scale Dependence of Variance Compare SENEX-2013 aircraft and WRF-Chem model CO
5–30 km scale: combustion source areas (cities and towns) 1-2km scale: Agricultural burn plumes
Model spectra somewhat similar to observations for length scales > 4ΔX
Length Scale
Power Spectra of CO depends on both emissions and transport
Urban Plumes: 15:50 Raleigh/Durham 16:20 Greenville 17:10 Fayetteville Burning Plumes: Throughout transect
Stuart McKeen
Fourier Transform Power Spectra
Time Series
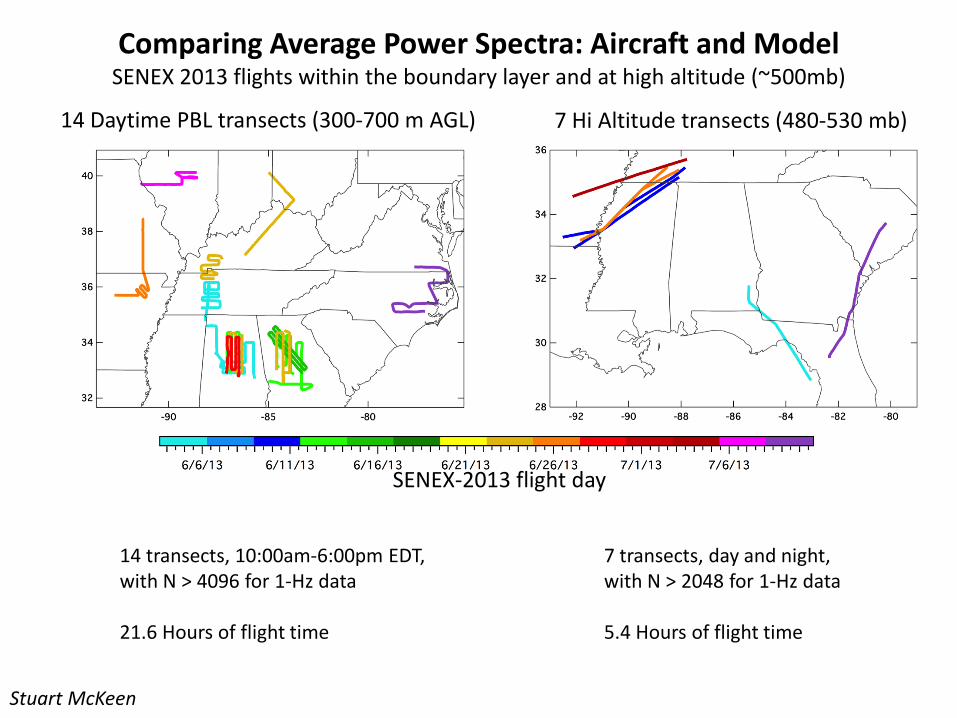
Comparing Average Power Spectra: Aircraft and Model SENEX 2013 flights within the boundary layer and at high altitude (~500mb)
14 Daytime PBL transects (300-700 m AGL) 7 Hi Altitude transects (480-530 mb)
14 transects, 10:00am-6:00pm EDT, with N > 4096 for 1-Hz data 21.6 Hours of flight time
7 transects, day and night, with N > 2048 for 1-Hz data 5.4 Hours of flight time
SENEX-2013 flight day
Stuart McKeen

Comparing Average Power Spectra: Aircraft and Model CH4 and H2O mixing ratios within the boundary layer and at high altitude (~500mb)
100.km 3.3km 10.km 410.km 33.km 100.km 3.3km 10.km 200.km 33.km 14 Daytime PBL transects (300-700 m AGL) 7 Hi Altitude transects (480-530 mb)
Power spectra for CH4 and H2O show similar slopes and tendencies. At high altitude the slope is about -5/3 for longer (>50 km) length scales. Model H2O vapor captures variability for length scales > 3ΔX in the PBL, > 7ΔX at 500mb. Adding/Removing model Oil/Gas emissions impacts CH4 power spectra for both the PBL and high altitude transects.
Stuart McKeen

Comparing Average Power Spectra: Aircraft and Model Data at high altitude (~500mb)
Stuart McKeen
Aircraft power spectral slopes
Aircraft
Model

Comparing Average Power Spectra: NUCAPS and Model Total precipitable water (TPW) data, 6/10/13
Stuart McKeen
NUCAPS
WRF-Chem Model
TPW time series from NUCAPS and Model
Power spectra of TPW from NUCAPS and Model

Comparing Average Power Spectra: NUCAPS and Model TPW and CH4 data, 13 days between 6/10/13-7/10/13
Stuart McKeen

Comparing Average Power Spectra: NUCAPS and Model 6/10/13-7/10/13
Stuart McKeen

Some Next Steps
• Use averaging kernels to scale model vertical sensitivity to match CrIS
• Incorporate updated NUCAPS data from science code processing and filter with revised quality control flags
• Examine alternative scale variance approaches beyond Fourier analysis to evaluate NUCAPS data
• Examine NUCAPS CH4 and CO during other recent aircraft field experiments (2015 and beyond)


