

FEATURE ARTICLE
1 Hong Kong monETARy AUTHoRITy QUARTERLy BULLETIn mARCH 2018
By Monetary Management Department
Understanding Foreign Exchange Derivatives Using Trade Repository Data: The non-deliverable Forward market
1 BasedonturnoverstatisticsfromBankforInternationalSettlements(BIS)(2016),TriennialCentralBankSurvey–ForeignExchangeTurnoverinApril2016(www.bis.org/publ/rpfx16fx.pdf)andinternalcalculationsusingHKTRdata.
2 Formoreinformationonthedatausedinthisarticle,seeBox3:Traderepositoriesasadatasource.
1. Introduction
Inrecentyears,HongKonghasestablishedaregulatoryframeworkforover-the-counter(OTC)derivativesconsistentwithglobalstandards,andimplementedreformsinregulatoryreporting,centralclearing,aswellascapitalandmarginrequirementsonunclearedderivatives.ThesedevelopmentsareinlinewiththeG20commitmentin2009toenhancetransparencyandreducesystemicriskintheOTCderivativesmarket.
StartingfromJuly2017,undertherequirementofregulatoryreporting,allentitiessupervisedbytheHKMAorregulatedbytheSecuritiesandFuturesCommission(SFC),andcertaincentralcounterparties(CCPs),havetoreporttheirOTCderivativestransactionsinthefiveassetclassesofinterestrate,foreignexchange(FX),credit,equityandcommodity.Amongtheseassetclasses,themandatoryreportingofinterestrateswapsandFXnon-deliverableforwards(NDFs)startedtwoyearsearlierinJuly2015.
HongKongisamajortradingcentreforFXderivatives,andNDFsinparticular,withanestimated10%ofglobalturnoverofFXderivativestradingand30%ofNDFtrading.1SimilartootherFXderivatives,theNDFisaforwardcontractforhedgingcurrencyriskorprofitingfromcurrencyvolatility,albeitsubjecttoadifferentsettlementprocessthatmakesitsuseattractiveforcertaincurrencies(seeBox1formoredetail).NDFsrepresentanestimated16%oftheoverallFXderivativesmarketinHongKongbygrossnotionalvalue.
ThisarticlepresentsadescriptionoftheNDFmarketasseenthroughthedatacollectedinHongKongatthebeginningof2018,andsetsoutthemajordevelopmentsinthemarketoverthetwoyearsof2016–2017.Theresultsarederivedfromanalysisoftrade-leveldatareportedtotheHongKongTradeRepository(HKTR).2Intermsofmarketstructure,theNDFmarketismostlytradedatveryshortmaturities.Themajornon-deliverablecurrenciesaretheTaiwanesedollar,theKoreanwonandtherenminbi.Mostoftheoutstandingpositionsareheldbybanksandotherfinancialentities.Overthepasttwoyears,theNDFmarketexperiencedthreemajorchanges:amarkedincreaseincentralclearing;achangeincurrencycomposition;andanincreasinginvolvementbyotherfinancialinstitutionsrelativetobanks.
Box 1
nDF: What is it?
TheNDFisaforwardcontractwithadifferentsettlementprocess.Asinastandardforwardcontract,twocounterpartiesagreetobuy/sellacurrencyataspecifiedfuturedateatanagreedexchangerate.Thepurposeistolockinanexchangerateforacertainperiodinthefuture.Atsettlement,insteadofexchangingtheunderlyingcurrencies,NDFcounterpartiessettlethetrade’sprofitorlossinawidelytraded(“deliverable”)currency,mostoftentheUSdollar.Theamountsettledisthedifferencebetweentheexchangerateagreedinthecontractandtheprevailingexchangerateobservedataspecifiedfuturedate,multipliedbytheagreednotionalamount.Themostprevalentnon-deliverablecurrenciesareAsianandLatinAmericancurrencies.
2 Hong Kong monETARy AUTHoRITy QUARTERLy BULLETIn mARCH 2018
FEATURE ARTICLEFEATURE ARTICLE UnDERsTAnDIng FoREIgn ExCHAngE DERIvATIvEs UsIng TRADE REposIToRy DATA: THE non-DELIvERABLE FoRWARD mARKET
2. StylisedfactsontheNDFmarket
a. SizeoftheNDFmarket
On31January2018,theHKTRcontainedtrade-levelinformationon130,993NDFoutstandingpositions.TheirgrossnotionalvaluewasUS$1,265billionafterremovingdoublecountingfromtradesreportedbybothcounterparties.
Chart1illustratesthechangeofNDFoutstandingpositionsovertime.During2016–2017,thegrossnotionalvalueofNDFoutstandingpositionsfluctuatedbetweenapeakofUS$1,503billioninMarch2016andatroughofUS$1,028billioninDecember2017(whichpointstoapotentialseasonaleffectatyearend).3FromJanuary2016toJanuary2018,theNDFgrossnotionaloutstandingwasonaverageUS$1,191billion.
CHART 1
gross notional value of nDF outstanding positions
0
500
1,000
2,000
1,500
US$ bn
Jan2016
Jul Jan2017
Jul Jan2018
Source:HKTRpositionsforpublicdisclosure.
Note:Tradesreportedbybothpartiesarecountedonlyonce.
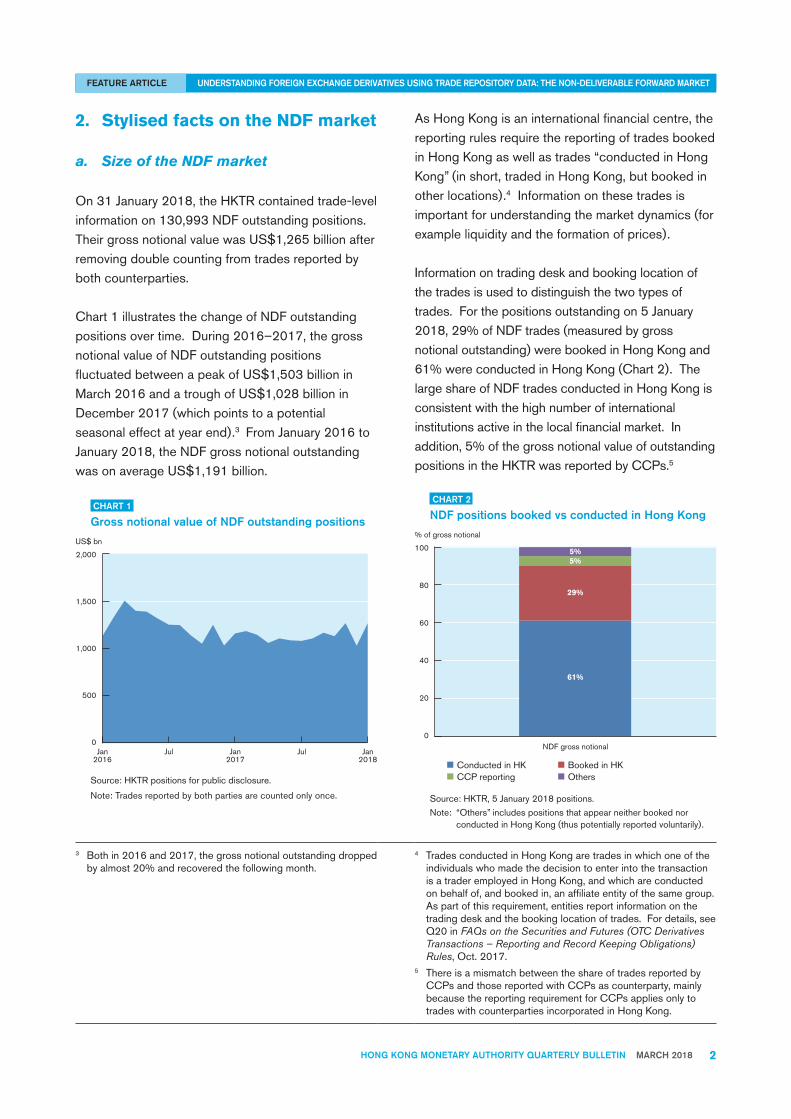
AsHongKongisaninternationalfinancialcentre,thereportingrulesrequirethereportingoftradesbookedinHongKongaswellastrades“conductedinHongKong”(inshort,tradedinHongKong,butbookedinotherlocations).4Informationonthesetradesisimportantforunderstandingthemarketdynamics(forexampleliquidityandtheformationofprices).
Informationontradingdeskandbookinglocationofthetradesisusedtodistinguishthetwotypesoftrades.Forthepositionsoutstandingon5January2018,29%ofNDFtrades(measuredbygrossnotionaloutstanding)werebookedinHongKongand61%wereconductedinHongKong(Chart2).ThelargeshareofNDFtradesconductedinHongKongisconsistentwiththehighnumberofinternationalinstitutionsactiveinthelocalfinancialmarket.Inaddition,5%ofthegrossnotionalvalueofoutstandingpositionsintheHKTRwasreportedbyCCPs.5
CHART 2
nDF positions booked vs conducted in Hong Kong
0
20
40
60
80
100 5%
61%
29%
5%
% of gross notional
Conducted in HK Booked in HKCCP reporting Others
NDF gross notional
Source:HKTR,5January2018positions.
Note: “Others”includespositionsthatappearneitherbookednorconductedinHongKong(thuspotentiallyreportedvoluntarily).
3 Bothin2016and2017,thegrossnotionaloutstandingdroppedbyalmost20%andrecoveredthefollowingmonth.
4 TradesconductedinHongKongaretradesinwhichoneoftheindividualswhomadethedecisiontoenterintothetransactionisatraderemployedinHongKong,andwhichareconductedonbehalfof,andbookedin,anaffiliateentityofthesamegroup.Aspartofthisrequirement,entitiesreportinformationonthetradingdeskandthebookinglocationoftrades.Fordetails,seeQ20inFAQs on the Securities and Futures (OTC Derivatives Transactions – Reporting and Record Keeping Obligations) Rules,Oct.2017.
5 ThereisamismatchbetweentheshareoftradesreportedbyCCPsandthosereportedwithCCPsascounterparty,mainlybecausethereportingrequirementforCCPsappliesonlytotradeswithcounterpartiesincorporatedinHongKong.

FEATURE ARTICLE
3 Hong Kong monETARy AUTHoRITy QUARTERLy BULLETIn mARCH 2018
FEATURE ARTICLE UnDERsTAnDIng FoREIgn ExCHAngE DERIvATIvEs UsIng TRADE REposIToRy DATA: THE non-DELIvERABLE FoRWARD mARKET
6 Globally,LatinAmericancurrenciesrepresentanimportantclusterofnon-deliverablecurrencies,buttheyarenotheavilytradedinHongKong,likelyduetotimezonedifferences.
7 “Unidentified”entitiesarethosethatareunabletobeclassifiedintermsofsectorofactivityandcountryofincorporation.
b. Currenciesandmaturities
Unsurprisingly,Asiancurrenciesrepresentthelion’sshareofnon-deliverablecurrenciestradedinHongKong.InJanuary2018,theTaiwanesedollarwasthemostprevalentnon-deliverablecurrency,accountingfor26%oftheoutstandinggrossnotional(Chart3).Othermajornon-deliverablecurrenciesweretheKoreanwon(25%ofgrossnotional),therenminbi(23%),theIndianrupee(15%)andtheMalaysianringgit(2%).Theremaining9%ofgrossnotionalwascomprisedofaverybroadrangeofcurrencies,includinganumberofLatinAmericancurrencies,eachaccountingforlessthan2%ofthegrossnotional.6USdollarwasthesettlementcurrencyinnearlyalloftheNDFtrades(99%ofthegrossnotional).
ThematurityofNDFtradestendstoberelativelyshort.OverthreequartersoftheNDFoutstandingtrades,measuredbygrossnotionalvalue,hadaresidualmaturityofuptothreemonths(Chart3).Maturitiesbetweenthreemonthsandoneyearaccountedforanother23%.NDFtradeswitharemainingmaturityoveroneyearaccountedforlessthan2%.
CHART 3
Currency and maturity breakdown of nDF positions
0
20
40
60
80
100%
By non-deliverable currency By residual maturity
TWD 26%
KRW 25%
CNY 23%
IND 15%
MYR 2%
Others 10%
0-3M 76%
3-6M 12%
6-9M 6%9-12M 5%
12M+ 2%
Source:HKTR,5January2018positions.
Note: Percentagesdonotsumto100duetoroundingeffects.
c. Marketparticipants
InlinewiththeOTCderivativesmarketingeneral,theNDFmarketisrelativelyconcentratedaroundthetopdealers.AsshownintheHKTRdataasat5January2018,129financialentities(whichbelongto70groups)reportedNDFtradestotheHKTR.Thetopfiveinstitutionsaccountedfor48%oftheoutstandinggrossnotionalwhilethetoptenentitiesaccountedfor64%ofthegrossnotional(Chart4).
CHART 4
market participants subject to mandatory reporting
%
0
25
50
75
100
NDF gross notional
Others:36%
Top 10entities:
64%
Top 6-10entities:
16%
Top 5entities:
48%
Source:HKTR,5January2018positions.
Note:ExcludesCCPs.
Tradecounterpartiesaresignificantlymorediverse.Asshowninthesamesetofdata,2,400distinctentities,whichbelongtoaround1,600groups,wereidentified.Chart5presentsabreakdownoftradecounterpartiesbysector.In48%ofthetrades(byoutstandinggrossnotional),bankswerethecounterparty.Thenon-bankfinancialsector(whichincludesinvestmentbanks,assetmanagers,hedgefundsandinsurers)wascounterpartyto22%oftheoutstandinggrossnotional.CCPswerecounterpartyto23%oftrades(byoutstandinggrossnotional),reflectingtheirincreasinginvolvementinprovidingcentralclearingtotheNDFmarket.Thecorporatenon-financialsectoraccountedfor2%oftheoutstandinggrossnotional,whilepublicsectorinstitutions,privateindividualsandunidentifiedentitiesaccountedfortheremaining5%.7

4 Hong Kong monETARy AUTHoRITy QUARTERLy BULLETIn mARCH 2018
FEATURE ARTICLEFEATURE ARTICLE UnDERsTAnDIng FoREIgn ExCHAngE DERIvATIvEs UsIng TRADE REposIToRy DATA: THE non-DELIvERABLE FoRWARD mARKET
CHART 5
sectoral breakdown of market participants on the counterparty side
4%
1%
2%
23%
22%
48%
0 10 20 30 40 50% of gross notional
Individual/Unidentified
Non-financial firms
Public sector
CCPs
Other financial entities
Banks
Source:HKTR,5January2018positions.
Geographically,tradecounterpartiesweredomiciledmainlyintheUKandtheUS,representing28%and19%oftheoutstandinggrossnotionalrespectively(Chart6).CounterpartiesdomiciledinHongKongmadeup10%ofthegrossnotional,whileFrancetookup7%oftheshare,andAustraliaandTaiwaneachconstituted5%.Alargenumberofothercountries,eachcontributingsmallshares,accountedfortheremainderoftheoutstandinggrossnotional.
CHART 6
geographical split of market participants on the counterparty side
UK28%
US19%
HK10%
FR7%
AU5%
TW5%
DE4%
CH4%
SG4%
JP3%
Others12%
% of gross notional
Source:HKTR,5January2018positions.
Note: ExcludesCCPs.“Other”includesUnidentifiedcounterparties,whichaccountfor5%.
d. Currencyrisktransferbyeconomicsectorofcounterparties
FXforwards,includingNDFs,havetheprimarypurposeoftransferringcurrencyriskbetweentwocounterpartiesbylockinginanexchangerateforacertainperiodinthefuture.Basedontheexchangerateprevailinginthemarketatthespecifiedfuturedate,onecounterpartywillgainaprofitandtheotherwillexperiencealoss.
MarketparticipantsentertheNDFmarketfordifferentreasons.SomemarketparticipantsuseNDFstooffload(“hedge”)thecurrencyriskarisingfromeitherlongorshortcurrencypositionslinkedtobusinessactivitiesandinvolvinganon-deliverablecurrency.Thecurrencyriskisacquiredbytheirtradecounterparties,whodosopossiblytospeculateonthefuturemovementoftheexchangerate,ortoarbitragebetweenratesinthespotandforwardmarkets,ortohedgeotherpositions.
ThequestionariseswhetherNDFmarketparticipantsbelongingtodifferentsectorstakesystematicpositionsinonedirectionortheother.Asa“thoughtexperiment”,weplotthenetnotionalvalueofpositionsatthesectorallevel(Chart7).Thisiscomputedbyconvertingallpositionsinacommoncurrency(USdollar)andoffsettingshortandlongpositionsacrossentitieswithinthesamesector.Theresultshowsthat,onasectoralbasis,non-financialfirmsandthepublicsectortendtotakenetpositionsaimedatoffloadingcurrencyriskfromnon-deliverablecurrencies.ThisisconsistentwiththeNDFmarketservingaprimaryeconomicfunctionofhedging.Ontheotherhand,banksandotherfinancialentitiestendtoacquirecurrencyrisk.TheyareeffectivelytheprovidersofmarketliquidityforthisOTCderivativeproduct.

FEATURE ARTICLE
5 Hong Kong monETARy AUTHoRITy QUARTERLy BULLETIn mARCH 2018
FEATURE ARTICLE UnDERsTAnDIng FoREIgn ExCHAngE DERIvATIvEs UsIng TRADE REposIToRy DATA: THE non-DELIvERABLE FoRWARD mARKET
CHART 7
Currency risk transfer in the nDF market by types of counterparty(Netnotionalpositionsinnon-deliverablecurrenciesbysector)
-20
-10
-15
-5
0
5
Sell non-deliverable currencyBuy deliverable currencySell deliverable currencyBuy non-deliverable currency
Non-financialfirms
Publicsector
Other financialentities
Unidentified
Banks
US$ bn
Source:HKTR,5January2018positions.
Notes:
1. ExcludesCCPsandIndividuals.2. Whilenetnotionalpositionscomputedacrossthewholemarketby
definitionoffseteachother,inthecharttheorangeandbluebarsdonothavetooffseteachotherinsize.EachsectorhasentitiesengaginginbothsidesofNDFtrades.Thesizeofthebarisfromoffsettinglongandshortpositionswithinthesamesector,whereasinrealitymanyNDFtradesarebetweenentitiesfromdifferentsectors.
3. ChangesinthestructureoftheNDFmarket
TheanalysisofHKTRdatasuggeststhatduring2016–2017,theNDFmarketstructurechangedalongthreedimensions:
• SharpincreaseofcentralclearingofNDFs;• ChangeinthecurrencycompositionofNDFs;
and• ShiftofsomeNDFactivitiesfrombankstoother
financialinstitutions.
a. SharpincreaseofcentralclearingofNDFs
During2016–2017,theNDFmarketexperiencedamarkedincreaseinNDFtradesbeingclearedthroughcentralcounterparties(Chart8).ThisisconsistentwithothermarketreportsanalysingCCPs’publicdisclosures.8TheriseincentralclearingintheNDFmarketisvoluntaryascentralclearingofNDFisnotmandatedinanymajorjurisdiction.
CHART 8
gross notional value of outstanding nDF positions being centrally cleared
0
500
1,500
1,000
2,000
US$ bn
NDF - intended to clearNDF - positions
NDF - not intended to clear
Jan2016
Jul Jan2017
Jul Jan2018
Source:HKTRpositionsforpublicdisclosure.
Note: “Intendedtoclear”isafieldreportedbythereportingentity.Tradesreportedbybothpartiesarecountedonlyonce.
AsshownintheHKTRdataasat31January2018,thegrossnotionaloutstandingintendedforcentralclearing(whichincludestradesthathadbeenclearedaswellasbilateraltradesthatwereexpectedtogothroughcentralclearing)wasUS$372billion,upfromUS$181billionayearearlierandfromUS$56billiontwoyearsearlier.
8 ChrisBarnes(2017),FX Clearing–The$750BNmarketthatkeepsgrowing,Clarus FT(www.clarusft.com/fx-clearing-the-750bn-market-that-keeps-growing).

6 Hong Kong monETARy AUTHoRITy QUARTERLy BULLETIn mARCH 2018
FEATURE ARTICLEFEATURE ARTICLE UnDERsTAnDIng FoREIgn ExCHAngE DERIvATIvEs UsIng TRADE REposIToRy DATA: THE non-DELIvERABLE FoRWARD mARKET
Thepercentageofnewtradesbeingclearedcentrally,whichwaspreviouslystableataround2%to4%levels,rosesharplyto12%inthefourthquarterof2016(Chart9).Itcontinuedtoriseandreached29%inthefourthquarterof2017.TakingintoaccountalloutstandingpositionsatthebeginningofJanuary2018,24%ofthetotaloutstandinggrossnotionalwascentrallycleared.
CHART 9
percentage of cleared nDF positions
24%
3%2%
4%
12%
15%
19%
22%
29%
0
35
30
25
20
15
10
5
% gross notional cleared
Cleared new tradesCleared positions
Q12016
Q2 Q3 Q4 Q2 Q3 Q4Q12017
Source:HKTR.
Note: Theredlinereferstonewtradesoriginatedin2016–2017.Thegreybarreferstooutstandingpositionson5January2018.
ClearingisnotequallycommonacrossAsiancurrencies.Inthepositionsoutstandingon5January2018,thecurrencieswiththelargestclearedvolumesweretheTaiwanesedollar,therenminbi,theIndianrupeeandtheKoreanwon(Chart10).Amongthesecurrencies,theclearingratewas27%fortheTaiwanesedollarandtheIndianrupee,22%forthe
renminbiand15%fortheKoreanwon.ThePhilippinepeso,theIndonesianrupiahandtheMalaysianringgithadsignificantlysmallerclearedvolumesandarangeofclearingrates.ThePhilippinepesohadthehighestpercentageofclearedtradesamongallAsiancurrenciesat31%.
CHART 10
Cleared nDF positions by currency
0
20
40
60
80
100
120
0
5
10
15
20
25
30
35
27%
22%
27%
15%
31%
22%
15%
US$ bn
% cleared positions (rhs)Cleared positions, gross notional outstanding (lhs)
TWD CNY INR KRW PHP IDR MYR
% gross notional
Source:HKTR,5January2018positions.
OnedriverofthevoluntaryincreaseincentralclearingofNDFsislikelytohavebeentheimplementationofreformsonmarginrequirements,whichalteredtherelativepricesofclearedandunclearedderivatives.Box2outlineshowmarginrequirementswereimplementedinmajorjurisdictionsandhow,bymakingitmorecostlytoholdunclearedOTCderivatives,thereformhascreatedincentivesforvoluntaryclearing.

FEATURE ARTICLE
7 Hong Kong monETARy AUTHoRITy QUARTERLy BULLETIn mARCH 2018
FEATURE ARTICLE UnDERsTAnDIng FoREIgn ExCHAngE DERIvATIvEs UsIng TRADE REposIToRy DATA: THE non-DELIvERABLE FoRWARD mARKET
Box 2
How reforms on margin requirements affected the nDF market
Theyears2016–2017sawtheintroductionoftwonewmajorpoliciesintheOTCderivativesmarket:mandatoryclearingofcertainproductsandmarginrequirementsonunclearedderivatives.Thelatterreferstotherequirementthatcounterpartiespostcollateraltoeachotherinrelationtoderivativesthatarenotcentrallycleared.TheaimofbothpoliciesistoincreasetheclearingoftradesthroughcentralcounterpartiestoreducethelevelofbilateralcounterpartyriskintheOTCderivativesmarket.
Thetwopoliciesactthroughdifferentchannels.Mandatoryclearingrequirestheclearingofcertainproductsdeemedliquidbyregulators.Marginrequirementsoperatethroughprivateincentivesbychangingtherelativepricesofclearedandunclearedderivatives.9
During2016–2017,FXproductswerenotcoveredbymandatoryclearinginanyofthemajorjurisdictions.MarginrequirementsappliedinsteadtonewOTCderivativestradesinallassetclasses,withminorexclusionswhichdidnotaffectNDFs.
ThemajorjurisdictionsimplementedmarginrequirementsbetweenSeptember2016andSeptember2017.Theexacttimingvaried(Table1).Asaresult,HKTRdatafor2016–2017includedanincreasingnumberoftradessubjecttomarginrequirements,forwhichtherelativecostofholdinganunclearedderivativewouldhaverisen,allelsebeingequal.
TABLE 1
Timeline of implementation of margin requirements in major jurisdictions
1 Sep 2016 4 Feb 2017 1 Mar 2017 1 Sep 2017
USCanadaJapan
EU
Initial Margin (IM)
Korea
Variation Margin (VM)All the above
countries
Hong KongAustraliaSingapore
Note:Doesnotincludetransitionalarrangementsappliedincertainjurisdictions.
9 Marginrequirementshavetwocomponents:anInitialMargin,postedbyeachpartyatthestartofatradetoprovidecollateraltooffsetlossescausedbyitsownpotentialfuturedefault,andaVariationMargin,exchangeddailyasafunctionofthemark-to-marketvalueofthederivative.

8 Hong Kong monETARy AUTHoRITy QUARTERLy BULLETIn mARCH 2018
FEATURE ARTICLEFEATURE ARTICLE UnDERsTAnDIng FoREIgn ExCHAngE DERIvATIvEs UsIng TRADE REposIToRy DATA: THE non-DELIvERABLE FoRWARD mARKET
b. ChangeincurrencycompositionofNDFs
The2016BISTriennialsurveyhighlightedareshuffleinthecurrencycompositionofNDFsovertheperiod2013–2016,withariseinNDFsintheKoreanwonandtheTaiwanesedollar,andareductioninNDFsintherenminbi,whichwasmainlyattributabletotheincreasinguseofthedeliverableforwardmarket.10
Chart11plotsthecurrencycompositionofNDFsasshownintheHKTRdataatthreepointsintime.ThetrendsareconsistentwiththeearliertrendshighlightedbytheBISTriennialSurvey.InJanuary2018,theTaiwanesedollarandtheKoreanwonwerethelargestnon-deliverablecurrencies,followedbytherenminbi.Whiletherenminbiwasstillthelargestnon-deliverablecurrencyin2016asshownintheHKTRdata,itsuseintheNDFmarketdeclinedby32%during2017.Ontheotherhand,theTaiwanesedollargrewby89%,theKoreanwonby11%andtheIndianrupeeby76%betweenJanuary2016andJanuary2018.
CHART 11
Change in non-deliverable currencies
0
100
200
300
400
15 Jan 2016 6 Jan 2017 5 Jan 2018
TWD KRW CNY INR MYR Others
US$ bn
Source:HKTR,positionsat15January2016,6January2017and5January2018.
AnotherdevelopmentinthemarketistheemergenceofNDFsthatusedeliverablecurrenciesonbothsidesofthetrade.WhiletheseaccountedforonlyanegligibleshareofgrossnotionaloutstandingintheHKTRdatafornow,marketreportssuggestthattheiruseisgrowingforriskmanagementpurposesunderthenewlyimplementedpolicyofmarginrequirements.11
c. ShiftofsomeNDFactivitiesfrombankstootherfinancialinstitutions
ThethirdchangethattookplaceinthemarketstructureofNDFsover2016–2017wastherelativedeclineofNDFpositionsbybanksandtheincreaseinpositionsbyotherfinancialentities.Theseincludedinvestmentbanks,assetmanagers,hedgefundsandinsurers.Amongreportingentities,therelativeshareofbanksfellfrom85%inthefirstquarterof2016to63%inthefourthquarterof2017(Chart12).Correspondingly,theshareofotherfinancialentities(relativetobanks)increasedfrom15%to37%.
CHART 12
nDF gross notional reported by banks vs other financial entities
0
25
50
75
100
%
Q12016
Q2 Q3 Q4 Q2 Q3 Q4Q12017
2016Q1:15%
2017Q1: 28%
2017 Q4:37%
2016 Q1:85%
2017 Q1:72%
2017 Q4:63%
Banks
Other financial entities
Other financial entities Banks
Source:HKTR,5January2018positions.
Note: ThetotalistheoutstandingNDFgrossnotionalreportedatapointintimebybanksorbyotherfinancialinstitutions.Excludestradesreportedbyotherentitiesaswellasintragrouptrades.Thesharesarebasedonwhoreportedthepositions.
10McCauleyRandCShu(2016),“Non-deliverableforwards:impactofcurrencyinternationalisationandderivativesreform”,Quarterly Review, Bank for International Settlements,December(www.bis.org/publ/qtrpdf/r_qt1612h.pdf).
11ChrisBarnes(2017),G10FXNDFClearing,Clarus FT(www.clarusft.com/g10-fx-ndf-clearing).

FEATURE ARTICLE
9 Hong Kong monETARy AUTHoRITy QUARTERLy BULLETIn mARCH 2018
FEATURE ARTICLE UnDERsTAnDIng FoREIgn ExCHAngE DERIvATIvEs UsIng TRADE REposIToRy DATA: THE non-DELIvERABLE FoRWARD mARKET
Non-bankfinancialentitiescontributedsignificantlytotheincreaseinclearingintheNDFmarket.Inthefourthquarterof2017,theyclearedonaverage47%oftheirownnewtrades,ascomparedwith27%bybanks(Chart13).
CHART 13
percentage of cleared new nDF trades by banks vs other financial entities
12%14% 15%
19%
27%
5%
23%
28%
35%37%
47%
0
50
40
30
20
10
%
Other financial entitiesBanks
Q12016
Q2 Q3 Q4 Q2 Q3 Q4Q12017
Source:HKTR,newtradesoriginatedin2016–2017.
Note: Basedonwhoreportedthetrades.Thegreylinerepresentstheshareofclearedtradesreportedbybanksoutofthetotalgrossnotionalofnewtradesreportedbybanks.Theredlinedoesthesameforotherfinancialentities.
4. Conclusion
ThisarticlepresentsananalysisoftheNDFmarketusingdatafromtheHKTR.NDFisatypeofforwardcontractsforhedgingcurrencyriskorprofitingfromcurrencyvolatility,withasettlementprocessthatmakesitsuseattractive,inparticular,forAsianandLatinAmericancurrencies.
Intermsofmarketstructure,theNDFmarketismostlytradedatveryshortmaturities.ThemajorcurrenciestradedinHongKongaretheTaiwanesedollar,theKoreanwonandtherenminbi.Mostoftheoutstandingpositionsareheldbybanksandotherfinancialentities.Whilenon-financialcompaniesarelessintensiveusersofNDFs,theyareimportantholdersofnetpositionsinNDFs,typicallytooffloadthecurrencyriskfromnon-deliverablecurrencies.
Overthepasttwoyears,theNDFmarketexperiencedthreemajorchanges:amarkedincreaseincentralclearing;achangeincurrencycomposition;andincreasinginvolvementbyotherfinancialinstitutionsrelativetobanks.ThemagnitudeandspeedoftheincreaseinvoluntaryclearingofNDFsaresignificant.Reformsonmarginrequirementsareaplausibledriverofthisphenomenon.BymakingitmorecostlytoholdunclearedOTCderivatives,thereformislikelytohavecreatedincentivesforvoluntaryclearing.
Box 3
Trade repositories as a data source
ThedatausedforthisarticlearefromtheHKTR,thetraderepositoryforOTCderivativessetupinHongKongaspartoftheframeworkformandatoryreportingofOTCderivatives.
Traderepositorydataareeffectivelyaformof“bigdata”onbanksandotherentitiesoperatingintheOTCderivativesmarket.DataarecollectedcontinuouslyfromreportingentitiesontradesandpositionsinthevariousOTCderivativeproductssubjecttomandatoryreporting.Thelargevolumeofdatarequiressuitableanalyticalmethodsfordetailedexamination.
Exploitingthisnewsourceofdataallowsregulatorstoanalysethedatainaflexibleway,testhypothesesandmapconcentrationsandinterconnections.


