
The author(s) shown below used Federal funds provided by the U.S. Department of Justice and prepared the following final report: Document Title: Understanding Influence Across Justice
Agencies: The Spread of “Community Reforms” from Law Enforcement to Prosecutor Organizations
Author(s): Matthew J. Giblin Document No.: 245945 Date Received: April 2014 Award Number: 2012-R2-CX-0022 This report has not been published by the U.S. Department of Justice. To provide better customer service, NCJRS has made this Federally-funded grant report available electronically.
Opinions or points of view expressed are those of the author(s) and do not necessarily reflect
the official position or policies of the U.S. Department of Justice.
Understanding Influence Across Justice Agencies: The Spread of “Community Reforms” from Law Enforcement
to Prosecutor Organizations
Final Report
Matthew J. Giblin Dept. of Criminology and Criminal Justice
Southern Illinois University Mail Code 4504
Carbondale, IL 62901 (P) 618-453-6360; (F) 618-453-6377
This project was supported by Grant No. 2012-R2-CX-0022 awarded by the National Institute of Justice, Office
of Justice Programs, U.S. Department of Justice. Points of view in this document are those of the authors and
do not necessarily represent the official position or policies of the U.S. Department of Justice.
March 2014
This document is a research report submitted to the U.S. Department of Justice. This report has not been published by the Department. Opinions or points of view expressed are those of the author(s)
and do not necessarily reflect the official position or policies of the U.S. Department of Justice.
ii
TABLE OF CONTENTS
Acknowledgements ..................................................................................................................................... iv Abstract ......................................................................................................................................................... v Executive summary ..................................................................................................................................... vi I. Introduction .......................................................................................................................................... 1
II. Literature review .................................................................................................................................. 6 Community policing .............................................................................................................................. 7 Community prosecution ...................................................................................................................... 10 Connecting community policing and prosecution .............................................................................. 13 III. Data ..................................................................................................................................................... 16 Overview of datasets ........................................................................................................................... 16 Merging datasets ................................................................................................................................. 19 IV. Measurement ..................................................................................................................................... 22 Prior measures of community reforms ............................................................................................... 22 Analytical strategy ............................................................................................................................... 27 Measuring community policing in the current study .......................................................................... 29 Measuring community prosecution in the current study ................................................................... 34 Summary of measurement model findings ......................................................................................... 39 Control variables ................................................................................................................................. 40 V. Predicting community prosecution .................................................................................................... 44 Community prosecution, 2001 (2001 analyses) .................................................................................. 44 Community prosecution, 2005 (2005 analyses) .................................................................................. 49 VI. Conclusions and discussion ................................................................................................................ 54 Review ................................................................................................................................................. 54 Limitations ........................................................................................................................................... 56 Discussion ............................................................................................................................................ 58 References .................................................................................................................................................. 62 Appendix A: Matching notes ....................................................................................................................... 69 Appendix B: Connecticut towns and judicial districts ................................................................................. 74 Appendix C: Correlation matrix for police measurement models .............................................................. 75 Appendix D: Correlation matrix for prosecution measurement models .................................................... 77 Appendix E: Relationship between police and prosecutor homeland security activities ........................... 78
This document is a research report submitted to the U.S. Department of Justice. This report has not been published by the Department. Opinions or points of view expressed are those of the author(s)
and do not necessarily reflect the official position or policies of the U.S. Department of Justice.

iii
TABLES & FIGURES
Table 1: Common elements associated with community prosecution .................................................. 12
Figure 1: Wilson’s (2005, 2006) measurement model of community policing implementation derived from LEMAS 1997 and LEMAS 1999 data ................................................................................. 25
Table 2: Descriptive statistics for indicators used in community policing measurement model, 2000 LEMAS data ............................................................................................................................... 31
Table 3: Descriptive statistics for indicators used in community policing measurement model, 2003 LEMAS data ............................................................................................................................... 32
Figure 2: Standardized factor loadings and fit indices for measurement model of community policing implementation using LEMAS 2000 data .................................................................................. 33
Figure 3: Standardized factor loadings and fit indices for measurement model of community policing implementation using LEMAS 2003 data .................................................................................. 34
Figure 4: Conceptual model of community prosecution ......................................................................... 35
Table 4: Descriptive statistics for indicators used in community prosecution measurement model, 2001 NPS data ........................................................................................................................... 36
Table 5: Descriptive statistics for indicators used in community prosecution measurement model, 2005 NPS data ........................................................................................................................... 36
Figure 5: Standardized factor loadings and fit indices for measurement model of community prosecution implementation using NPS 2001 data .................................................................. 38
Figure 6: Standardized factor loadings and fit indices for measurement model of community prosecution implementation using NPS 2005 data .................................................................. 39
Table 6: Control variables used in prediction models ............................................................................ 41
Figure 7: Scatterplot, regression fit line, and confidence interval for relationship between community policing and community prosecution (large agency analysis), 2001 ........................................ 45
Figure 8: Scatterplot, regression fit line, and confidence interval for relationship between community policing and community prosecution (pooled agency analysis), 2001 ..................................... 45
Table 7: Standardized regression coefficients for models predicting the community prosecution scores (2001), original, misdemeanor variables omitted, and imputed datasets (large agency analysis) ..................................................................................................................................... 48
Table 8: Standardized regression coefficients for models predicting the community prosecution scores (2001), original, misdemeanor variables omitted, and imputed datasets (pooled agency analysis) ..................................................................................................................................... 49
Figure 9: Scatterplot, regression fit line, and confidence interval for relationship between community policing and community prosecution (large agency analysis), 2005 ........................................ 50
Figure 10: Scatterplot, regression fit line, and confidence interval for relationship between community policing and community prosecution (pooled agency analysis), 2005 ..................................... 50
Table 9: Standardized regression coefficients for models predicting the community prosecution scores (2005), original, misdemeanor variables omitted, and imputed datasets (large agency analysis) ..................................................................................................................................... 52
Table 10: Standardized regression coefficients for models predicting the community prosecution scores (2005), original, misdemeanor variables omitted, and imputed datasets (pooled agency analysis) ..................................................................................................................................... 53
This document is a research report submitted to the U.S. Department of Justice. This report has not been published by the Department. Opinions or points of view expressed are those of the author(s)
and do not necessarily reflect the official position or policies of the U.S. Department of Justice.

iv
ACKNOWLEDGEMENTS
I extend my sincere appreciation to a number of individuals for their contributions during the course of
this project. Melissa Haynes offered research assistance during the early stages of this project and both
Lisa Stone and Melanie Terbrak provided support with administrative and budgetary matters. The
technical report peer reviewers offered valuable suggestions that helped shape the final report. Finally,
Patrick Clark (National Institute of Justice) provided guidance whenever requested and helped ensure
that the project was executed as intended.
This document is a research report submitted to the U.S. Department of Justice. This report has not been published by the Department. Opinions or points of view expressed are those of the author(s)
and do not necessarily reflect the official position or policies of the U.S. Department of Justice.

v
ABSTRACT
Within the last few decades, police departments and prosecutors’ offices innovated with new policies
and practices, particularly those stressing the community (i.e., community policing, community prosecution).
Although organizational innovation has been empirically researched within the discipline of criminal justice,
most of these studies focused on the police in isolation from the other components of the criminal justice
system. These valuable studies have identified several factors that are associated with innovation including
those both internal and external to organizations, but researchers have rarely considered the influence of the
policies and practices of other criminal justice agencies. Police and prosecutors, even though interconnected
and part of the same system, are studied individually and the cross-component effects of other agencies within
the criminal justice system have not received much attention in the literature. This study explores the
innovation of community prosecution using organizational predictors typically associated with innovation
while also including measures of community policing within the jurisdiction of the prosecutors’ offices.
Community policing practices of the agencies within the jurisdiction are potentially powerful influences on
community prosecution. Using data from the 2001 and 2005 waves of the National Prosecutors Survey and the
2000 and 2003 waves of the Law Enforcement Management and Administrative Statistics survey, analyses
show that community reforms are not connected across system components. Several possible explanations
are offered to account for these findings.
This document is a research report submitted to the U.S. Department of Justice. This report has not been published by the Department. Opinions or points of view expressed are those of the author(s)
and do not necessarily reflect the official position or policies of the U.S. Department of Justice.

vi
EXECUTIVE SUMMARY
Many police and prosecutors’ organizations have adopted “community” reforms over the past 30 years.
These reforms, falling under the headings of community policing and community prosecution, share many
common attributes. Organizations become increasingly responsive to and encourage input from the
community, adopt a problem-solving orientation to address community problems, take a broader view of
success (e.g., not just about arrests and convictions), and partner with other agencies to improve overall
neighborhood quality of life. The fact that these reforms developed almost simultaneously—the attention
devoted to community prosecution trailed community policing—led some to examine the relationship
between the two reforms. Anecdotal and case study evidence from multiple sites suggest that some
prosecutors not only supported the local police department’s move to community policing, but were actually
compelled to adopt community prosecution as a result. However, the relationship between community
policing and prosecution has not been systematically examined using larger samples.
The current study addresses this question using police data from the Law Enforcement Management and
Administrative Statistics Survey (2000 and 2003) and the National Prosecutors Survey (2001 and 2005).
Specifically, models are produced to predict community prosecution implementation in 2001 (using
community policing implementation in 2000, among other variables) and community prosecution
implementation in 2005 (using community policing implementation in 2003, among other variables). In the
latter set of analyses, controls are also introduced for prior (2001) levels of community prosecution
implementation. Among the key findings:
Community prosecution can be measured using a model derived from National Prosecutors Survey data. The model includes five elements: using the community to identify crime problems, assigning prosecutors to geographic areas, using tools other than criminal prosecution, establishing relationships with other parties, and holding regular meetings with constituent groups.
Community policing implementation was unrelated to community prosecution implementation in all models.
This document is a research report submitted to the U.S. Department of Justice. This report has not been published by the Department. Opinions or points of view expressed are those of the author(s)
and do not necessarily reflect the official position or policies of the U.S. Department of Justice.

vii
Four variables emerged as predictors in more than two models: organizational size, functional differentiation, formalization, and prosecutors’ tenure. Larger, more complex organizations tend to be more innovative (adopt community prosecution). Contrary to the innovative literature, more formalized or rule-bound organizations also tend to implement community prosecution. Finally, implementation is inversely related to the tenure of the chief prosecutor.
The results suggest that prosecutors’ offices and police chiefs may respond to their respective institutional
environments. While both community policing and community prosecution received attention during the
1990s and 2000s, adoption of either reform was likely to occur if organizational leaders were plugged into
institutional networks. Evidence from police organizations supports this contention; additional research is
needed to understand whether prosecutors are similarly influenced by broader forces such as conferences,
publications, and other organizations.
The key is that local leadership matters and can ultimately mitigate the effects of organizational and
environmental factors. An organization that is structurally amendable to innovation may nevertheless
abandon reform if prosecutors adhere to traditional practices or view innovations as fads. Likewise, a
prosecutor who champions reform may be able to implement changes, even in the face of resistance.
This document is a research report submitted to the U.S. Department of Justice. This report has not been published by the Department. Opinions or points of view expressed are those of the author(s)
and do not necessarily reflect the official position or policies of the U.S. Department of Justice.

1
CHAPTER I: INTRODUCTION
Considerable innovation has occurred within criminal justice organizations over the past 30 years.
Police departments, prosecutor and public defenders’ offices, courts, and correctional institutions have
adopted new and emergent philosophies, technologies, policies, and practices including, but not limited
to, Compstat, focused deterrence strategies, problem-solving courts, and reentry initiatives (see, for
example, Anderson, 1997; Berman & Fox, 2010; Fox & Gold, 2010; Weisburd & Braga, 2006). As
organizations changed, scholars sought to explain these innovations, specifically why reforms were
penetrating some organizations but largely ignored by others.
Although organizational innovation has been empirically researched within the discipline of criminal
justice, most of these studies have concentrated on changes within police agencies (for example,
Chamard, 2004; Giblin, 2006; King, 2000; Morabito, 2010; Skogan & Hartnett, 2005; Weisburd & Lum,
2005). The literature on innovation adoption outside of policing is largely missing two critical elements.
First, although works include discussions about the general causes of innovation (e.g., rising crime rates,
overcrowded prisons, and community demands), factors are addressed in more global terms and rarely
subjected to empirical scrutiny at the jurisdictional or organizational level. For example, the growth of
drug courts is often attributed to the volume of drug offenders within the court system; specialized
courts, including drug courts, are viewed as a way to alleviate the crowding (Finn & Newlyn, 1993).
While true in the general sense, is courtroom crowding a jurisdiction-level explanation that would
account for the adoption of over 1,000 courts nationwide and, conversely, the absence of drug courts in
other jurisdictions? Similarly, sentencing guidelines were designed to reduce disparity in punishments
by curtailing judicial discretion (Spohn, 2002). Did the diffusion of guidelines across the states begin in
jurisdictions with the greatest disparities? These questions deal with the causes of innovation but move
This document is a research report submitted to the U.S. Department of Justice. This report has not been published by the Department. Opinions or points of view expressed are those of the author(s)
and do not necessarily reflect the official position or policies of the U.S. Department of Justice.
2
beyond conjecture and demand research at the jurisdiction level to explain variation in adoption at the
local level.
Studies of innovation, including police innovation, are incomplete for a second reason. While
scholars have made valuable contributions to the field, identifying internal and external agency factors
associated with innovation (e.g., organizational size, structure, external funding), they have rarely
considered the influence of changes in other criminal justice agencies. Police, prosecutor, and
correctional organizations, even though interconnected and part of the same system, are studied
individually and the cross-component effects within the criminal justice system have largely been
ignored (for an exception, see Jacoby, Gramckow, & Ratledge, 1995). This omission is noteworthy,
especially given the congruence of certain reforms over the past three decades (e.g., broken windows
policing and community courts in New York City both focus on quality of life offenses).
Two major police and prosecutorial reforms provide a perfect opportunity to examine the influence
of innovation across criminal justice system components. The two innovations—community policing
and community prosecution—are remarkably similar in their core characteristics: greater agency
responsiveness to citizen input, a focus on problem solving using an expanded range of options (e.g.,
responses other than arrest or prosecution), broader measures of success (e.g., reduced fear, improved
quality of life), and collaborative partnerships with other public and private organizations.
While both innovations received significant attention among researchers, policymakers, and
practitioners during the 1990s, they did not emerge concurrently. The seeds of community policing can
be traced to community relations units in the 1960s and team policing units in the 1970s. Early
experiments with foot patrol, fear reduction, and problem solving in places like Flint (MI), Houston (TX),
Newark (NJ), and Newport News (VA) proved to be the first generation of community policing sites
during the late 1970s and early 1980s (Oliver, 2000). Widespread adoption and institutionalization
would come during the 1990s, facilitated in part by funding from the federal Office of Community
This document is a research report submitted to the U.S. Department of Justice. This report has not been published by the Department. Opinions or points of view expressed are those of the author(s)
and do not necessarily reflect the official position or policies of the U.S. Department of Justice.
3
Oriented Policing Services (Hickman & Reaves, 2001; Oliver, 2000). For example, within a two-year
period at the end of the 1990s, the proportion of law enforcement agencies employing community
policing officers nearly doubled to 64 percent (Hickman & Reaves, 2001).
Although prosecutors’ offices were experimenting with community prosecution in the 1980s,
community reforms in prosecution generally trailed those in policing (Boland, 1996; Goldkamp, Irons-
Guynn, & Weiland, 2003; Gray, 2008). The separate, isolated reforms of a few innovative chief
prosecutors would ultimately coalesce into a unified idea, community prosecution, during the 1990s
(Coles, 2000). According to Kuykendall (2004), “as recently as 1995, less than ten jurisdictions
throughout the United States engaged in community prosecution, and then only in urban settings” (p.
1). A decade later, nearly 40 percent of prosecutors’ offices self-defined as community prosecution sites
(Perry, 2006) and many others engaged in strategies (e.g., involving the community in problem
identification) consistent with the reform (DeFrances, 2002; Kuykendall, 2004; Perry, 2006). While the
level of implementation of and attention given to community prosecution may never have reached the
level of community policing, it was clearly a significant reform.
There is some limited anecdotal and case study evidence that the spread of community prosecution
was connected to the institutionalization of community policing (Coles, Kelling, & Moore, 1998). Indeed,
former Marion County (IN) prosecution Scott Newman explicitly mentioned community policing in his
rationale for adopting community prosecution in the Indianapolis metropolitan area:
I felt instinctively that, as community policing was being implemented in Indianapolis…what would happen to me if I didn’t change the way I did business was the community would draw closer to the police department. And the community and the police department, together, would come to despise my office…and…tend to blame [failures] on me as the most visible proponent of the criminal justice system. (Coles, Kelling, & Moore, 1998, p. 73)
Although police officers were more often in attendance at community meetings in Indianapolis (at least
in the neighborhoods studied), a community prosecutor was quite visible, attending approximately 30
percent of meetings (Duffee, Renauer, Scott, Chermak, & McGarrell, 2001). Prosecutors were well
This document is a research report submitted to the U.S. Department of Justice. This report has not been published by the Department. Opinions or points of view expressed are those of the author(s)
and do not necessarily reflect the official position or policies of the U.S. Department of Justice.
4
aware of the attention given to other justice agencies embracing community justice principles through
the adoption of community policing and community courts (Coles, 2000; Karp & Clear, 2000).
The spread of community reforms from one component (police) to another (prosecution) is a
reasonable assumption but is, at the present, based on limited evidence. It is clear that the reforms
overlapped and garnered heightened attention at approximately the same time. The quote by Scott
Newman above suggests that he quite possibly had to align with the “community” ideal evident in the
Indianapolis Police Department’s community policing approach by implementing community
prosecution within his own office. The influence of the police on the prosecutor’s office is potentially
powerful if the potential for cross-component effects is recognized.
The problem is that the link between the various systems of the criminal justice system has largely
been neglected empirically when it comes to explaining organizational innovations. We have only
anecdotal or small sample evidence that cross-component pollination of ideas is actually occurring (see,
for example, Coles, Kelling, & Moore, 1998). Much of the research studying innovation has focused on
policing and considered characteristics of the organization itself (e.g., size, organizational budgets) or
factors external to the organization (e.g., crime rates, external funding) as facilitators and inhibitors.
Similar research examining the determinants of innovation in prosecutors’ offices, the judiciary, prisons,
jails, and probation/parole is lacking, a surprise given that many of these organizations have been
similarly innovative over the past several decades (e.g., community prosecution, reentry programs,
electronic monitoring, problem-solving courts, intensive supervised probation/parole). The current
study examines the impact of community policing activities in large local police departments on
community prosecution activities in prosecutors’ offices in 2001 and 2005. In doing so, it addresses two
key objectives:
1. It extends the study of organizational innovation beyond the singular focus on police organizations currently dominating the literature by addressing innovation in prosecutors’ offices.
This document is a research report submitted to the U.S. Department of Justice. This report has not been published by the Department. Opinions or points of view expressed are those of the author(s)
and do not necessarily reflect the official position or policies of the U.S. Department of Justice.

5
2. It assesses the importance of other criminal justice components on innovation adoption. As noted, most research addresses the focal organization in isolation. The proposed study measures the influence of one component (police) on the innovation level of another (prosecution).
This document is a research report submitted to the U.S. Department of Justice. This report has not been published by the Department. Opinions or points of view expressed are those of the author(s)
and do not necessarily reflect the official position or policies of the U.S. Department of Justice.

6
CHAPTER II: LITERATURE REVIEW
The connection between community policing and community prosecution, and police and
prosecutors more generally, is largely predicated on how one views the overall criminal justice system.
Since the 1950s, scholars have used the system metaphor to describe the administration of justice in the
United States (President’s Commission, 1968; Walker, 1992). Accordingly, “the various criminal justice
agencies were interrelated in such a way that constituted a criminal justice system” (Walker, 1992, p.
59) where the “whole system was more than the sum of its parts” (Bernard, Paoline, & Pare, 2005, p.
204). The system processes cases and the parts significantly affect each other; “output from one agency
is input to the next” (Bernard, Paoline, & Pare, 2005, p. 203). For example, a dramatic shift in arrests—
the outputs from a local police department—likely shapes the charging decisions of the local prosecutor.
Likewise, researchers have shown interest in what has been described as criminal justice
thermodynamics or the hydraulic displacement of discretion, asking whether discretion shifts from one
organization/actor to another as constraints are imposed (Miethe, 1987; Walker, 1998).
Others have questioned this system (coordinated, interrelated) paradigm. For example, Campbell,
Sahid, and Stang (1970) argued that offenders pass through a series of stages but, due to a number of
factors, the process may best be described as a “fragmented and often hostile amalgamation of criminal
justice agencies” (p. 267). The components of the criminal justice system often blame each other for
failures (e.g., police blame prosecutors for dropping charges; community correctional officials blame
police for harassing probationers) and they typically compete for a common pool of finite resources.
Moreover, communities often lack any type of overall criminal justice system coordination authority;
each organization operates largely independent of the others.
In between these two perspectives is John Hagan’s (1989) view of the criminal justice system as a
loosely coupled system that becomes more tightly connected in certain situations. Loosely coupled
This document is a research report submitted to the U.S. Department of Justice. This report has not been published by the Department. Opinions or points of view expressed are those of the author(s)
and do not necessarily reflect the official position or policies of the U.S. Department of Justice.

7
organizations “are responsive to one another, while still maintaining independent identities and some
evidence of physical or logical separateness” (Hagan, 1989, p. 119). Under some conditions, however,
agencies become more aligned in their activities, or tightly coupled, and dependent upon the other
components. For example, proactive drug enforcement efforts may require increased coordination
between police and prosecutors when it comes to offering plea bargains to offenders in exchange for
useful information resulting in more severe charges for larger-scale distributors (Hagan, 1989).
The spread of ideas is theoretically consistent with the metaphor of the police and prosecutors as
loosely connected components becoming tightly coupled. Anecdotal and case study evidence presented
below suggests that police departments and prosecutors’ offices, even if loosely connected more
generally, became tightly aligned as the former implemented community policing reforms. Police
departments received attention through innovation, community residents placed demands on criminal
justice officials, and the broader community justice movement was taking hold. As a result, it is
hypothesized that prosecutors in jurisdictions characterized by deeper community policing
implementation were more likely to adopt community prosecution.
COMMUNITY POLICING Police organizations have adopted a range of innovations over the past 30 years but community
policing is “arguably the most important development in policing in the past quarter century,” receiving
tremendous attention and widely adopted (see Skogan & Frydl, 2004, p. 85; Weisburd & Braga, 2006).
The factors contributing to community policing reform are many: community alienation associated with
the professional model of policing, Supreme Court decisions restricting police actions, civil unrest in the
1960s, research questioning professional model strategies, innovative strategies in the 1970s and 1980s
(e.g., team policing, foot patrol, fear reduction), and the publication of influenial articles related to
broken windows and problem-oriented policing (see, for example, Oliver, 2000; Pelfrey, 2000). While
This document is a research report submitted to the U.S. Department of Justice. This report has not been published by the Department. Opinions or points of view expressed are those of the author(s)
and do not necessarily reflect the official position or policies of the U.S. Department of Justice.

8
the definitions of community policing vary (see Bayley, 1994; Cordner, 2000; Eck & Rosenbaum, 1994;
Skogan, 2006; Trojanowicz & Bucqueroux, 1990), several common themes are evident: greater
community input, a broad police function, a problem-solving orientation, and partnerships with outside
organizations.
Community policing encourages the police to share power with the community, becoming “co-
producers” of public safety (Bayley, 1994, p. 106; Eck & Rosenbaum, 1994). In practice, this means
providing opportunities for citizen input and being responsive to those needs, what Bayley (1994)
described as consultation and adaptation (see, also, Cordner, 2000; Skogan, 2006; Skogan & Frydl,
2004). Police officers take steps to ensure positive interactions with citizens, not just contacts with
individuals as victims, witnesses, or suspects (Cordner, 2000). Such contact—through community
meetings, walking the beat, substations, and other strategies—helps develop trust and theoretically
fosters a strong working relationship between the police and the public, allowing them to address
matters of mutual concern (Cordner, 2000; Eck & Rosenbaum, 1994).
Cordner (2000) also argued that community policing requires the police to assume a broader
function beyond just law enforcement. While police have always handled order maintenance and
service responsibilities, community policing recognizes the value of these functions. As Skogan and Frydl
(2004) noted,
Controlling serious crime remains the first priority of policing, and enforcing the criminal law remains the primary and distinctive method of the police in accomplishing that important objective. But instead of seeing the policing exclusively in these terms and viewing any activities that depart from direct efforts to control serious crime by threatening and making arrests of offenders as a distraction from the fundamental mission of the police and a waste of police resources, those who embrace community policing recognize that the police have other additional functions to perform and other ways than making arrests of controlling crime and enhancing security. (pp. 85-86)
Serious crime is not the only concern. Citizens are concerned about other matters and police can play a
role in reducing disorder and fear and improving overall neighborhood quality of life. Thus, the
measures of success move beyond counting arrests or tracking crime rates.
This document is a research report submitted to the U.S. Department of Justice. This report has not been published by the Department. Opinions or points of view expressed are those of the author(s)
and do not necessarily reflect the official position or policies of the U.S. Department of Justice.

9
Community policing also draws heavily on Goldstein’s (1979) problem-solving orientation. Police
are supposed to view calls for service in terms of problems and search for solutions to those problems
using an expanded toolkit. That is, rather than rely solely upon arrests of lawbreakers to handle calls,
police can look at alternative solutions such as civil remedies, third party policing efforts, outside agency
assistance, environmental design strategies, or others.
There is also an explicit recognition that the police cannot fight crime, eliminate disorder, reduce
fear, and improve community quality of life absent collaborations with other public and private
organizations. Eck and Rosenbaum (1994) suggest that the resource base available to police
departments is expanded beyond what is included in department budget lines. For example, police can
draw upon the sanitation or health department when a blighted property becomes a crime or disorder
problem in a community.
Community policing spread throughout the law enforcement industry throughout the 1990s,
facilitated in part by funding from the Office of Community Oriented Policing Services (Oliver, 2000). For
example, Worrall and Zhao (2003) found that grant funding, more than any other predictor included in
their models (e.g., crime rates, department size, region), was associated with their outcome measure of
community policing (an index). By 2000, almost three quarters of police agencies participating in the
periodic LEMAS survey reported having at least one full-time sworn officer regularly engaged in
community policing activities (e.g., Burruss & Giblin, 2014; Worrall & Zhao, 2003; Zhao, 1996). Although
both scholarly and popular media attention devoted to community policing has waned in recent years,
perhaps due to a shift toward homeland security policing (see Oliver, 2006), community policing is still
prevalent in local police departments. According to a 2007 survey, 47 percent of police departments still
use full-time community policing officers and 53 percent included a mission statement with a
community policing component (Reaves, 2010).
This document is a research report submitted to the U.S. Department of Justice. This report has not been published by the Department. Opinions or points of view expressed are those of the author(s)
and do not necessarily reflect the official position or policies of the U.S. Department of Justice.

10
COMMUNITY PROSECUTION
As community policing was taking shape, innovative state prosecutors were experimenting with
new strategies designed to address longstanding problems, particularly those associated with the drug
trade. The experimentation was noteworthy given that prosecutors have changed very little over the
past century relative to police organizations (Forst, 2002):
Prosecutors are not more inherently resistant to change than others…Still, as elected officials, district attorneys aim to avoid embarrassment. This is usually accomplished by keeping the bulk of their work below the horizon, staying away from risky ventures and drastic departures from conventional modes of office management and from collaborations with researchers on the assessment of policies, procedures, or performance, assessments that could show up as tomorrow’s negative headline. (p. 525)
Gray (2008) indicated that prosecutors were experimenting as early as the mid-1980s and
Goldstock (1992) documented some of these “nontraditional” approaches, including greater use of civil
remedies and crime prevention measures to address crime and public meetings to garner support.1
Boland (1996) offered the brief case study of Multnomah County, Oregon as an example of the reforms
that were emerging in many prosecutors’ offices in the 1990s. In Multnomah County, the prosecutor
responded to business leaders in one area of the city, recognizing that citizens were concerned about
more immediate problems of disorder rather than serious incidents of crime—akin to the notion of
broken windows (Wilson & Kelling, 1982). A neighborhood district attorney (NDA) was assigned to the
area to work with neighborhood residents and the business community to solve community crime and
disorder problems. As Boland (1996) explained, “an important part of the NDAs’ role is to provide
answers, feedback, and explanations—especially explanations of legal constraints that prohibit the
police from doing what citizens think they ought to do to deal with certain conditions. The NDAs’ core
activity, however, is devising alternative responses” (p. 37).
1 For example, Goldkamp, Irons-Guynn, and Weiland (2003) place the start of community prosecution in Manhattan (NYC) at 1985 (see, also, Boland, 1998).
This document is a research report submitted to the U.S. Department of Justice. This report has not been published by the Department. Opinions or points of view expressed are those of the author(s)
and do not necessarily reflect the official position or policies of the U.S. Department of Justice.
11
Projects like the one in Multnomah County would spread across the United States throughout the
1990s—for example, to Philadelphia (Goldkamp, Irons-Guynn, & Weiland, 2003), Washington, D.C.
(Boland, 2001), Boston (Coles, Kelling, & Moore, 1998), and elsewhere (Wolf & Worrall, 2004). The
ideas would converge into the philosophy or process of community prosecution (Coles, 2000) and would
typically be contrasted with traditional prosecution strategies (the felony case processor strategy)
(Coles, 2000, 2008; Coles & Kelling, 1999; see, also, Nugent, Fanflik, & Bromirski, 2004). Specifically,
community prosecution has been defined, as “a long term, proactive strategy involving a partnership
among the prosecutor’s office, law enforcement, the community and public and private organizations
whereby the authority of the prosecutor’s office is used to solve and improve public safety and the
quality of life in an identified community” (Stevens, 1994 as cited in Forst, 2002, p. 529). As noted
earlier, the elements of community prosecution that emerged through meetings of constituent groups
during the 1990s (e.g., American Prosecutors Research Institute, Bureau of Justice Assistance) are
remarkably similar to the major dimensions of community policing (see Table 1 for common elements
offered by others): partnering with and responsiveness to the public, moving beyond convictions to
include a concern for community quality of life, a problem-solving orientation, and collaborations with
other agencies (Coles, 2000; Nugent-Borakove & Fanflik, 2008; Rainville & Nugent, 2002; Weinstein,
1998).
This document is a research report submitted to the U.S. Department of Justice. This report has not been published by the Department. Opinions or points of view expressed are those of the author(s)
and do not necessarily reflect the official position or policies of the U.S. Department of Justice.

12
The focus on felony cases results in a hierarchically organized prosecutor’s office intent on
disposing of cases brought to it by the police. Traditionally, outcomes have included, “the number of
trials (particularly involving Part I crimes), convictions, and length of sentences [and the] ability to
prosecute cases successfully” (Coles, 2008, p. 186). Under a community prosecution philosophy,
prosecutors expand their focus to address larger community safety and quality of life concerns: fear,
disorder, crime, and other concerns. Like community policing, citizens provide input and participate in
strategies to improve their own neighborhoods. While the felony case process relies primarily on the
criminal law and prosecution, the community prosecutor uses a more diverse range of options to solve
problems: civil law, code enforcement, and community education among them (Boland, 1996; Coles,
2008). Finally, prosecutors work outside of the central office in order to learn about community
concerns and interact with neighborhood groups and other agencies to solve neighborhood problems.
By 2001, many prosecutors nationwide had implemented strategies consistent with community
prosecution and those persisted into the middle part of the decade (DeFrances, 2002; Perry, 2006). For
example, more than half of prosecutors’ offices nationwide (55%) involved the community in identifying
This document is a research report submitted to the U.S. Department of Justice. This report has not been published by the Department. Opinions or points of view expressed are those of the author(s)
and do not necessarily reflect the official position or policies of the U.S. Department of Justice.

13
problem areas or crimes and two-thirds (69%) had informal or formal relationships with community
organizations. Interestingly, while some of the factors that encouraged the adoption of community
policing are well known (e.g., COPS funding), few researchers have examined the spread of community
prosecution. In general terms, three factors stimulated innovation among prosecutors’ offices: rising
crime and disorder, increasing citizen demands, and larger changes within the criminal justice system
(Coles, 2000). Innovative prosecutors began taking problem-oriented approaches to address problem
behavior, particularly drug crimes. Citizens “were becoming increasingly vocal in demanding something
more than arrests, prosecution, and incarceration as a response to and remedy for crime problems”
(Coles, 2000, p. 16). Only one study (Cunningham, Renauer, & Khalifa, 2006) has addressed the
determinants of community prosecution using a large sample. They found that innovation is largely
related to internal organizational characteristics—size, decentralization, functional and occupational
differentiation, and formalization—factors that are commonly associated with innovation more
generally.
CONNECTING COMMUNITY POLICING AND PROSECUTION
Prosecutors were aware of the attention given to other justice agencies embracing community
justice principles through the adoption of community policing and community courts (Coles, 2000; Karp
& Clear, 2000). In Multnomah County, an early community policing site, “the District Attorney formed
not only a partnership with the police department but developed his own community prosecution effort
by assigning Deputy District Attorneys to neighborhoods” (Jacoby, Gramckow, & Ratledge, 1995, p. 12).
Analyses from four other sites (Austin, TX, Boston, MA, Indianapolis, IN, and Kansas City, MO) revealed
considerable congruence between the innovative prosecutorial strategy and community policing (Coles,
Kelling, & Moore, 1998). More importantly for the present study, it is quite possible that community
policing provided the impetus for community prosecution adoption at the jurisdictional level:
This document is a research report submitted to the U.S. Department of Justice. This report has not been published by the Department. Opinions or points of view expressed are those of the author(s)
and do not necessarily reflect the official position or policies of the U.S. Department of Justice.

14
Both in the local context, and as a development around the country that had gained significant national attention, community policing provided a model and in some cases put pressure on prosecutors. The example of community policing “wins,” the growing use of problem-solving tactics by police, the popularity of community policing with the public, and the increase in the number of police available, all were apparent at the national level if not in every locality. (Coles, Kelling, & Moore, 1998, p. 41)
The former director of the National Institute of Justice further described the importance of community
policing by stating, “once police return to communities, they are the magnets that draw prosecutors into
the community as well” (Coles & Kelling, 1999, p. 73).
Forst (2002) argued that both community policing and community prosecution are linked by trends
emphasizing service delivery (see, for example, Osborne & Gaebler, 1992) and communitarianism (see
Crank, 1994, for a discussion of “community” in policing). Others see community prosecution as a
complement to community policing efforts; comments from police officials note that “community
prosecution is the missing link in community policing and problem solving” and “community prosecution
is what makes community policing work” (Coles, 2002, p. 2).
Clearly, the two reforms are similar and anecdotal evidence (e.g., Marion County Prosecutor Scott
Newman’s quote in the introduction) supports the contention that community policing implementation
was at least a partial determinant of community prosecution implementation. Yet, other evidence
points to negligible effects of community policing adoption. For example, a chief prosecutor in Pima
County, Arizona offered no opinion on the Tucson Police Department’s approach to community policing
but saw “the present emphasis on community service as counter-productive to effective traditional law
enforcement” (Jacoby, Gramckow, & Ratledge, 1995, p. 80). These accounts do not provide enough
evidence to know whether cross-component effects matter at the jurisdictional (i.e., county) level.
Scholars addressing criminal justice innovation have tended to examine internal organizational
characteristics or larger environmental factors (e.g., community characteristics or external funding) but
not the influence of upstream or downstream system components. As case study evidence suggests,
other system components may be powerful influences on organizational innovation. The focus of the
This document is a research report submitted to the U.S. Department of Justice. This report has not been published by the Department. Opinions or points of view expressed are those of the author(s)
and do not necessarily reflect the official position or policies of the U.S. Department of Justice.

15
present research is to begin to fill this gap in the criminal justice innovation literature, to move beyond a
policing focus and to incorporate a multi-component perspective. Specifically, the study addresses the
question: Did community policing implementation influence community prosecution implementation at
the jurisdiction level?
This document is a research report submitted to the U.S. Department of Justice. This report has not been published by the Department. Opinions or points of view expressed are those of the author(s)
and do not necessarily reflect the official position or policies of the U.S. Department of Justice.

16
CHAPTER III: DATA
The research will proceed by examining whether community policing implementation in local police
departments predicts community prosecution implementation in local prosecutors’ offices. Specifically,
models will be constructed to explain community prosecution implementation in 2001 and 2005. The
key difference between the two is that the 2005 model provides a stronger test, albeit with a smaller
sample, by controlling for prior levels of community prosecution activities and assuring the temporal
ordering of control variables. This chapter provides an overview of the police and prosecution datasets
and a summary of the merging process.
OVERVIEW OF DATASETS National Prosecutors Survey Indicators of community prosecution implementation and characteristics of prosecutors’ offices
(discussed in Chapter IV) were derived from two waves of the National Prosecutors Survey (NPS). The
survey, a project of the Bureau of Justice Statistics, is designed, “to obtain detailed information on
prosecutors’ offices, as well as information on their policies and practices” (U.S. DOJ, 2012, p. 4). As
such, the NPS is an organization-level survey addressing issues such as personnel, workload, funding,
homeland security, and community prosecution-related activities. The dataset lacks information on
case-level or person-level variables, with the exception of limited descriptors about the chief prosecutor
within each jurisdiction.
At present, seven waves of the NPS are publicly archived with the National Archive of Criminal
Justice Data (NACJD). The survey has been administered at irregular two to five year intervals from 1990
through 2007; the 2001 and 2007 versions were sent to a census of all prosecutors’ offices nationwide
while the remaining iterations relied upon sampling approaches. Response rates to the survey are
consistently high in sample and census years: 99 percent in 2005 (Perry, 2006), 96 percent in 2001
This document is a research report submitted to the U.S. Department of Justice. This report has not been published by the Department. Opinions or points of view expressed are those of the author(s)
and do not necessarily reflect the official position or policies of the U.S. Department of Justice.

17
(DeFrances, 2002), 88 percent in 1996 (DeFrances & Steadman, 1998), and 90 percent in 1994
(DeFrances, Smith, & van der Does, 1996).
In spite of the wealth of organizational data collected, the NPS has only been used sporadically
beyond the Prosecutors in State Courts series and other similar Bureau of Justice Statistics-produced
descriptive reports (e.g., DeFrances, 2002; Perry, 2006; Perry, Malega, & Banks, 2011). That said, others
have used measures derived from the NPS as predictor or outcome variables in explanatory studies.
Consider the following examples:
Baumer, Messner, and Felson’s (2000) study of murder case outcomes in 33 counties: NPS 1990 measure of dominant case screening mechanism (i.e., grand jury indictment or other) in each prosecutors’ office.
King, Messner, and Baller’s (2009) study of hate crime enforcement: NPS 2001 measure of whether office prosecuted a hate crime in prior year.
Rasmusen, Raghav, and Ramseyer’s (2009) study of conviction rates: NPS 2001 measures of conviction rates (dependent variable), budget, dispositions, salaries, prosecutorial selection method, and length of service (dependent variables).
Scholars interested in organizational features of prosecutors’ offices across years confront challenges in
working with the NPS. Not only is the survey administered at irregular intervals, some of the content
changes from one wave to the next. Groves and Cork (2009) pointed out, for example, that “BJS scaled
back the level of information requested in the most recent [2007/2008 survey], with the objective of
capping the burden on responding prosecutor offices at 30 minutes” (p. 128). Consequently, some
topics—community prosecution, for example—that had appeared in 2001 and 2005, were omitted in
2007. Nevertheless, as discussed below, the 2001 and 2005 waves provide relevant data for answering
the key research questions.
This document is a research report submitted to the U.S. Department of Justice. This report has not been published by the Department. Opinions or points of view expressed are those of the author(s)
and do not necessarily reflect the official position or policies of the U.S. Department of Justice.

18
Law Enforcement Management and Administrative Statistics Like the NPS, the Law Enforcement Management and Administrative Statistics (LEMAS) survey
collects organizational-level data related to the functions, responsibilities, operations, administration,
personnel, policies, expenditures, and, since 1997, community policing. The LEMAS effort predates the
NPS by three years, beginning in 1987, and has been administered at roughly three year intervals since.2
The survey is mailed to the chief executive of approximately 3,000 law enforcement agencies—generally
each of the largest agencies (employing 100 or more full-time sworn officers) and a sample of smaller
agencies. The unit of analysis is the law enforcement agency and the sampling frame includes all
publicly funded local and state law enforcement agencies within the United States with at least one full-
time or part-time officer. Sheriffs’ departments with a primary law enforcement function are also
included and special jurisdiction agencies (e.g., campus or park police) have been included periodically.
Survey response rates generally exceed 90 percent across LEMAS administrations; the difference in
response rates for large agencies (all surveyed) and smaller agencies (sampled) is negligible (92.5% vs.
91.4%) (Langworthy, 2002; Reaves, 2010).
Although there are weaknesses with the LEMAS program (e.g., missing outcome or process
measures such as calls for service; reliability of certain items), it is by far the best data set available for
cross-agency comparisons of law enforcement departments nationwide (Langworthy, 2002). In contrast
to the NPS, LEMAS data is widely used in law enforcement research. For example:
Worrall (1998) used departmental training and educational requirements from the 1993 LEMAS to predict the number of civil liability lawsuits (outcome variable from a source merged with the LEMAS).
Maguire (2009) created a number of structural measures using 1987 LEMAS data including formalization and administrative intensity to explain the proportion of child sexual abuse cases closed by arrest (the outcome variable from a source merged with the LEMAS).
2 The time between LEMAS administrations has been as short as a single year (1999 to 2000) and as long as four years (1993 to 1997 and 2003 to 2007).
This document is a research report submitted to the U.S. Department of Justice. This report has not been published by the Department. Opinions or points of view expressed are those of the author(s)
and do not necessarily reflect the official position or policies of the U.S. Department of Justice.
19
As these examples show, LEMAS datasets, alone or in combination with other datasets, are well suited
for examining research questions addressing features of law enforcement organizations. For the
purposes of the present study, the LEMAS dataset is critical for both developing the analysis sample and
for producing measures of community policing implementation and organizational size.
MERGING DATASETS 2001 Analysis
The shorthand “2001 analysis” is used to describe the set of models predicting community
prosecution implementation in 2001. The 2001 NPS dataset included data on a census of 2,341
prosecutors’ offices, a 96 percent response rate (DeFrances, 2002). As discussed in the next two
chapters, the 2001 NPS is the source of the community prosecution implementation measures as well as
controls such as caseload, organizational size, and tenure of the prosecutor. The community policing
implementation measure is derived from the 2000 LEMAS dataset. While the project gathered
responses from 2,985 state, county, and local agencies of all sizes, the focus of this project is on large
law enforcement agencies (municipal or county) with 100 or more full-time sworn officers. The LEMAS
dataset includes a census of these agencies as large departments are included in each wave of the
survey and participate with extremely high (90% or higher) response rates. In 2001, 803 agencies met
the size/agency type criteria.
The 803 law enforcement agencies were matched to the prosecutor’s office in the same county
using county-level federal information processing standards (FIPS) codes included in each dataset.3,4
This process resulted in successful matches of 792 (98.6%) of the LEMAS agencies with 391 unique
3 Each law enforcement agency was assigned a single FIPS codes. Prosecutors’ officers were assigned one or more FIPS codes depending upon the extent of their jurisdiction. Some offices served multiple counties. 4 Connecticut court jurisdictions do not correspond with county boundaries so FIPS code matching would result in errors. Police departments were manually matched to Connecticut courts based on maps available from the Connecticut Judicial Branch. Appendix B identifies the city-judicial district match relevant for both the 2001 and 2005 analyses.
This document is a research report submitted to the U.S. Department of Justice. This report has not been published by the Department. Opinions or points of view expressed are those of the author(s)
and do not necessarily reflect the official position or policies of the U.S. Department of Justice.
20
prosecutors’ offices. Some offices were matched to multiple law enforcement agencies (m=2.03,
sd=1.62, min=1, max=17), an issue that will be addressed by pooling implementation scores in later
analyses. As shown in Appendix A, 11 police departments could not be matched for the following
reasons:
The NPS provides statewide data for courts in Alaska, Rhode Island, and Delaware. Such data are not appropriate for examining practices at the county level. This resulted in the elimination of seven cases.
Jefferson County (AL) is served by two separate prosecutors’ offices/courts. The Jefferson County Sheriff and Hoover Police Department may file cases in both courts.5 Tom Green County (TX) is similarly served by two offices, preventing a match with the San Angelo Police Department. These three law enforcement agencies were not matched.
Connecticut judicial boundaries do not correspond to counties. Consequently, the New Haven County Sheriff’s Department jurisdiction crosses court lines and was not matched to any one prosecutors’ office.
For the purposes of the 2001 analysis, the goal is to explain community prosecution adoption in the 391
prosecutors’ offices.
2005 Analysis
The 2005 NPS served as the source of data for the 2005 analysis (“2005 analysis” serves as
shorthand for the set of models predicting community prosecution adoption in 2005), including the
community prosecution implementation measure. Unlike the 2001 NPS, the 2005 NPS included a
sample, rather than a census, of 307 offices nationwide, a 99 percent response rate (Perry, 2006). The
population of prosecutors’ offices was first divided into five strata based on jurisdiction size and offices
were selected from each strata in order to maximize variation. Prosecutors’ offices serving larger
jurisdictions were oversampled relative to their representation in the overall population. The 2003
LEMAS dataset, the next wave in the series, served as the source of data for the community policing
5In contrast, the Bessemer and Birmingham police departments, both in Jefferson County, file exclusively in one court or the other. This was confirmed by a representative with the Alabama Administrative Office of Courts.
This document is a research report submitted to the U.S. Department of Justice. This report has not been published by the Department. Opinions or points of view expressed are those of the author(s)
and do not necessarily reflect the official position or policies of the U.S. Department of Justice.

21
implementation measure. The 2003 LEMAS dataset includes data on 2,859 state and local law
enforcement agencies.
As with the 2001 analysis, the dataset was filtered based on two criteria: agencies must be either
municipal police or county (police or sheriff) departments and employ 100 or more full-time sworn
officers. The 822 police departments were merged with the 307 prosecutors’ offices in the NPS,
resulting in 481 matched pairs of police departments and prosecutors’ offices.6 Specifically, the 481 law
enforcement agencies matched with 182 separate prosecutors’ offices (of the 307 in the dataset).
Recall, some prosecutors’ offices serve jurisdictions with more than one large law enforcement
organization (m=2.64, sd=2.17, min=1, max=17).
The final step in the merging process was to add prosecution data from the 2001 NPS. This
strengthens the analysis in two ways.7 First, it permits controls for prior community prosecution
implementation. That is, it allows for the examination of the influence of community prosecution
implementation in 2001 on the level of implementation in 2005. Second, it allows for the control
variables discussed in the next chapter to be measured in such a way that temporal order is assured
(independent variables are captured in 2001 while the dependent measure is captured in 2005). Since
the 2001 NPS was a census, adding variables did not change the dataset size: 481 law enforcement
agencies matched to 182 separate prosecutors’ offices. The models in Chapter V attempt to predict
community prosecution adoption in these 182 prosecutors’ offices.
6 FIPS codes were again used to match agencies with one another. The same problems occurred matching 2003 LEMAS and 2005 NPS data as occurred when matching 2000 LEMAS with 2001 NPS data: Connecticut courts needed to be matched manually, Alaska, Rhode Island, and Delaware prosecutors’ offices (and, by implication, associated police agencies) were excluded, and two police agencies (Hoover, AL and Jefferson County, AL Sheriff) matched to multiple prosecutors’ offices and were subsequently excluded. See Appendix A. 7 Interestingly, even though both the 2001 and 2005 waves of the NPS include an identification variable (su_id) of similar length, the number is not the same across waves. Using this variable to merge datasets will produce erroneous matches. It is possible to merge based on FIPS codes though the process is tedious given that some offices serve multiple counties. Instead, matching was accomplished using the unique (and consistent across waves) district number (distnum) variable.
This document is a research report submitted to the U.S. Department of Justice. This report has not been published by the Department. Opinions or points of view expressed are those of the author(s)
and do not necessarily reflect the official position or policies of the U.S. Department of Justice.

22
CHAPTER IV: MEASUREMENT
In order to examine the influence of community reforms across criminal justice system
components, it is necessary to first adequately measure two key concepts: community policing and
community prosecution. This section provides a review of the literature addressing measurement of
community innovation in policing and prosecution and proceeds to a discussion of measurement in the
current context. Although community prosecution is the dependent variable of interest, the section
commences with an overview of the measurement of community policing. The literature on community
policing, particularly large sample studies, is more fully developed, and the procedures for measuring
community prosecution in the current study are largely informed by this literature. The chapter
concludes with a description of control variables included in later models.
PRIOR MEASURES OF COMMUNITY REFORMS Community Policing There is no shortage of research examining community policing, either as a dependent variable or
as a predictor of some other outcome (e.g., crime) (see, for example, Morabito, 2010; Zhao, Lovrich, &
Robinson, 2001). Within these models, community policing is generally captured using some
dichotomous or composite indicator. These measures, drawn from available data or new surveys,
attempt to capture the complexity of community policing (content validity), usually via a checklist of
practices. They are widely used in the law enforcement literature even if the measures omit specific
indicators representative of community policing (for example, do they capture underlying department
philosophies or the depth, rather than the range, of activities?).
Maguire, Kuhns, Uchida, and Cox (1997), for example, used data from applications for Office of
Community Oriented Police Services (COPS) funding to assess implementation; applicants were asked to
This document is a research report submitted to the U.S. Department of Justice. This report has not been published by the Department. Opinions or points of view expressed are those of the author(s)
and do not necessarily reflect the official position or policies of the U.S. Department of Justice.

23
identify community policing-related activities currently practiced. Responses from the 31 items (e.g.,
citizens participating in neighborhood watch, agency identifying problems by looking at crime trends,
and presence of citizen advisory groups) were summed (med.=13) to create a community policing score
“gauging the extent to which departments were involved in a broad array of community policing
activities” (p. 379).8 In contrast, King (2000) developed an indicator from two items from the 1993
Police Foundation survey of community policing practices: the department self-reported adopting
community policing and implementing or planning to implement a beat integrity policy. The latter
question served as a check on the first by requiring at least some action related to community policing.
MacDonald (2002) and others (Morabito, 2010; Randol, 2012) created measures of community
policing adoption from waves of the Law Enforcement Management and Administrative Statistics
survey. A series of community policing-related questions was introduced into the survey beginning with
the fourth wave (1997) and, with slight modifications, has remained through the most recent publicly
archived dataset (2007). In general, the items address the presence of a community policing plan,
training provided to new recruits, in-service officers, and civilian personnel, meetings with various
organized constituents (e.g., neighborhood or business groups), and a number of other community
policing-related items (e.g., encourage problem-solving, permanent assignment of officers to geographic
areas, include problem-solving in officer evaluations). There is some variation in the literature as to the
items included in the indices. For example, MacDonald (2002) included indicators of community policing
training for both in-service personnel and new-recruits, Randol (2012) also includes training for civilians,
and Morabito (2010) omits training altogether. Morabito’s index does, however, include technological-
8 In subsequent analyses, the scores were broken into six categories (0-5, 6-10, etc.) and three categories (0-10, 11-20, 21-31).
This document is a research report submitted to the U.S. Department of Justice. This report has not been published by the Department. Opinions or points of view expressed are those of the author(s)
and do not necessarily reflect the official position or policies of the U.S. Department of Justice.

24
oriented measures related to crime analysis, indicators left out of the other two indices.9 Regardless of
the precise measure, the LEMAS dataset provides a range of measurement options.
Worrall and Zhao (2003) similarly created an index, this time using data from the 1998 Police Issues
Survey, a study of over 400 large municipal and county agencies (representing a 60 percent response
rate). Unlike the previous measures, however, the authors, recognizing the multi-dimensional nature of
community policing, captured both the internal and external innovations associated with reform. Eleven
dichotomous items represented internally-focused change (management-related reforms such as
incorporating community policing into the mission statement and reducing managerial positions) and 14
measured externally-focused change (changes affecting the organization’s connection to the outside
such as new strategies [foot patrol, special units] or police substations).
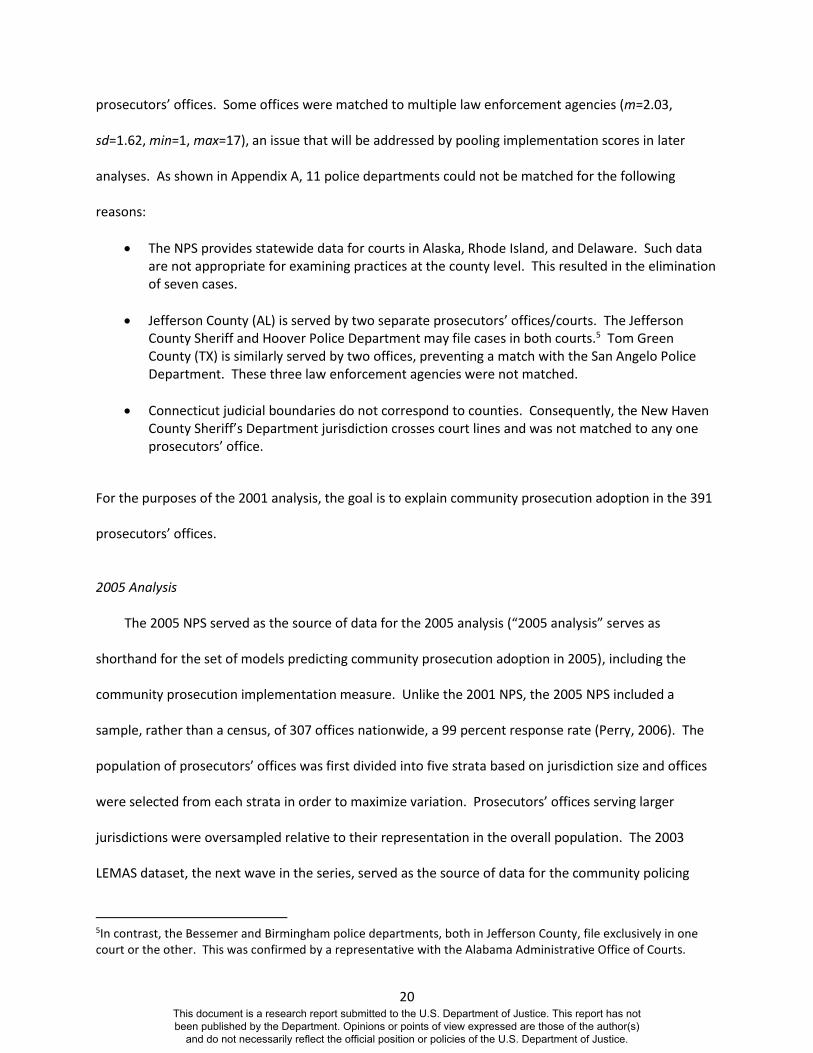
Wilson (2005, 2006) produced a measurement model of community policing implementation using
1997 and 1999 LEMAS measures (see Figure 1). The model draws upon many of the same indicators as
others who have used LEMAS data (MacDonald, 2002; Morabito, 2010; Randol, 2012) and, like Worrall
and Zhao (2003), views community policing as a multidimensional construct. Nevertheless, there are
some important distinctions. First, the measurement model recognizes that some indicators may reflect
the underlying construct (i.e., community policing) better than others. For example, Wilson (2006)
found that community policing implementation in 1997 was more closely associated with a problem-
solving observed measure and a citizen interaction latent construct than other indicators. In situations
where additive indices are used—for example, summing dichotomously coded items—each item is given
equal weight (e.g., the presence of a police academy is equivalent to beat integrity policies as they relate
to community policing).10 Second, and more substantively, measurement models incorporate
9 Some of the variation in the composition of the indices is related to disagreements as to what indicators appropriately represent community policing. In addition, data availability also likely played some role as indicators were included or omitted from LEMAS waves. 10 Where the index comprises a mix of dichotomous and ordinal indicators, the ordinal indicators actually are given more weight. For example, MacDonald (2002) included two indicators related to training recruits and in-service
This document is a research report submitted to the U.S. Department of Justice. This report has not been published by the Department. Opinions or points of view expressed are those of the author(s)
and do not necessarily reflect the official position or policies of the U.S. Department of Justice.
25
measurement error into analyses. Indices implicitly (or explicitly) assume that the construct is perfectly
measured, a tenable assumption. Measurement models are generally reflective; that is, variation in
some underlying latent construct (e.g., community policing) and measurement error is assumed to
produce variation in observed indicators (e.g., presence of a community policing plan) (Edwards &
Bagozzi, 2000). Given these two issues, community policing will be measured using a slightly modified
version of Wilson’s (2005, 2006) model.
Figure 1. Wilson’s (2005, 2006) measurement model of community policing implementation derived from LEMAS 1997 and LEMAS 1999 data.
personnel in community policing activities (coded 0=none, 1=less than half, 2=more than half). These two items are treated equally in the overall community policing index. However, the other items within the index (e.g., include problem solving in evaluations) are all dichotomous indicators. Thus, the training indicators are mathematically given more weight when compared to another indicator.
This document is a research report submitted to the U.S. Department of Justice. This report has not been published by the Department. Opinions or points of view expressed are those of the author(s)
and do not necessarily reflect the official position or policies of the U.S. Department of Justice.

26
Community Prosecution
Unlike the community policing literature, the community prosecution literature is, with few
exceptions, characterized more by descriptive research than explanatory research.11 Consequently,
there are plenty of survey items addressing specific community prosecution-related items, but these
have rarely been combined to produce a single community prosecution score. For example, Nugent,
Fanflik, and Bromirski (2004) summarized findings from a survey of 879 prosecutors’ offices.
Respondents were asked whether they practiced any of key elements of reform including a focus on
problem solving, partnering with other agencies, an expanded toolkit (e.g., enforcement and
prevention), a clearly defined focus area, and use of both proactive and reactive strategies. Offices were
classified as to how many of the six elements they practiced. Other measures were similarly offered
(e.g., the specific groups partnering with the prosecutor’s office). The authors then compared these
measures across traditional and community prosecution (self-reported) offices.
Rainville and Nugent (2002) surveyed prosecutors in Georgia in order to examine the time spent on
community outreach (a community prosecution function) and law enforcement coordination (a
traditional prosecution function). In their study, the measure moved beyond just engaging in the
activity; community outreach activities including time spent on tasks such as meeting with community
groups, making referrals, and performing crime prevention activities. More recently, Cunningham,
Renauer, and Khalifa (2006) used data from the 2001 National Prosecutors Survey to explain the
adoption of community prosecution in a sample of 749 offices. Four dichotomous items were summed
to create a community prosecution index: involved the community in identifying crime/problem areas,
assigned prosecutors to specific geographic areas, used tools other than criminal prosecution to address
community problems, and assigned prosecutors to handle community-related activities. Curiously, and
without explanation, the authors omitted items related to relationships with outside agencies and
11 In this context, explanatory research is viewed as research that models a relationship between multiple independent variables and a dependent variable rather than just an examination of bivariate relationships.
This document is a research report submitted to the U.S. Department of Justice. This report has not been published by the Department. Opinions or points of view expressed are those of the author(s)
and do not necessarily reflect the official position or policies of the U.S. Department of Justice.

27
meeting with community groups from the community prosecution index even though these items are
both theoretically relevant and available in the 2001 NPS dataset.
What these studies show is that there is indeed some overlap in how community prosecution is
conceptually defined, just little agreement in how to operationally measure it. In the current study, the
2001 and 2005 NPS datasets are used and, similar to Wilson’s approach with community policing, a
measurement model is developed. The model incorporates the multiple dimensions of community
prosecution and incorporates measurement error.
ANALYTICAL STRATEGY
Both community policing and community prosecution are captured using measurement models
(i.e., confirmatory factor analysis) as detailed below. Once the model is confirmed, factors scores are
saved and used in subsequent analyses. Observed indicators are used to measure latent (or
unobserved) constructs such as citizen interaction, training, community policing implementation, and
community prosecution implementation. Consequently, it is critical to establish the validity of these
models—to ensure that the observed indicators actually measure the latent constructs they are
hypothesized to measure (Anderson & Gerbing, 1988). This is accomplished using Mplus software, a
common structural equation modeling program.12
The decision to separate the measurement model from the prediction model is based on the
overall purpose of the research. A full structural equation model combining both the measurement and
prediction portions is designed to assess model fit. While individual parameters can be examined (i.e.,
the significance of individual predictors), the stability of the parameter estimates is based on the overall
model fit. In cases where a model is improperly specified or incomplete, overall model fit statistics
12 Mplus is one of a number of commercially available structural equation modeling software programs on the market. Mplus is capable of assessing models using an appropriate estimator when most of the observed indicators are categorical as they are in the present study.
This document is a research report submitted to the U.S. Department of Justice. This report has not been published by the Department. Opinions or points of view expressed are those of the author(s)
and do not necessarily reflect the official position or policies of the U.S. Department of Justice.

28
might preclude an interpretation of individual parameters. In the present study, based on available
data, the primary goal is to examine the influence of community policing on community prosecution. A
regression model allows for an assessment of individual parameters while acknowledging that the
overall prediction model is likely omitting variables.
The analysis of the measurement models proceeds in two steps. First, the significance levels
associated with individual paths (i.e., a latent construct to indicator) are examined to determine
whether the indicators appropriately reflect the underlying construct. Second, the overall measurement
model is assessed using goodness-of-fit indices and statistics (Marsh & Hau, 1996). As noted elsewhere,
“these indices relevant to SEM provide a useful gauge of how well the specified, theoretically-derived
model describes the covariation in the sample data” (Hoelter, 1983, p. 328). The measurement models
will be assessed using the comparative fit index (CFI), the Tucker-Lewis Index (TLI), and the root mean
square error of approximation (RMSEA). Gau (2010) has summarized these measures and, more
importantly, the cut-off criteria suggestive of a good fit between the hypothesized model and the data.
For example, CFI and TLI values above 0.95 are said to represent a good fit, though TLI values of 0.90 are
acceptable (Hu & Bentler, 1999; Schumacker & Lomax, 2010). The RMSEA lacks an agreed-upon cut-off
though values under 0.06 or 0.08 are said to indicate a good model fit (Hu & Bentler, 1999; Schumacker
& Lomax, 2010).13
The remainder of this chapter details the operationalization and analysis of the community policing
and community prosecution measurement models used in the current study. These models are then
used in predictive analyses in Chapter V.
13 It is customary to report a chi-square test statistic when assessing models. The statistic tests whether there is a difference between the hypothesized and observed data covariance matrices; a non-significant value (no difference) indicates a good model fit. However, the chi-square statistic is sensitive to sample size and may suggest significant differences even when the hypothesized model fits the data. Gau (2010) advises, “[the chi-square statistic] should not be given much weight” (p. 144).
This document is a research report submitted to the U.S. Department of Justice. This report has not been published by the Department. Opinions or points of view expressed are those of the author(s)
and do not necessarily reflect the official position or policies of the U.S. Department of Justice.
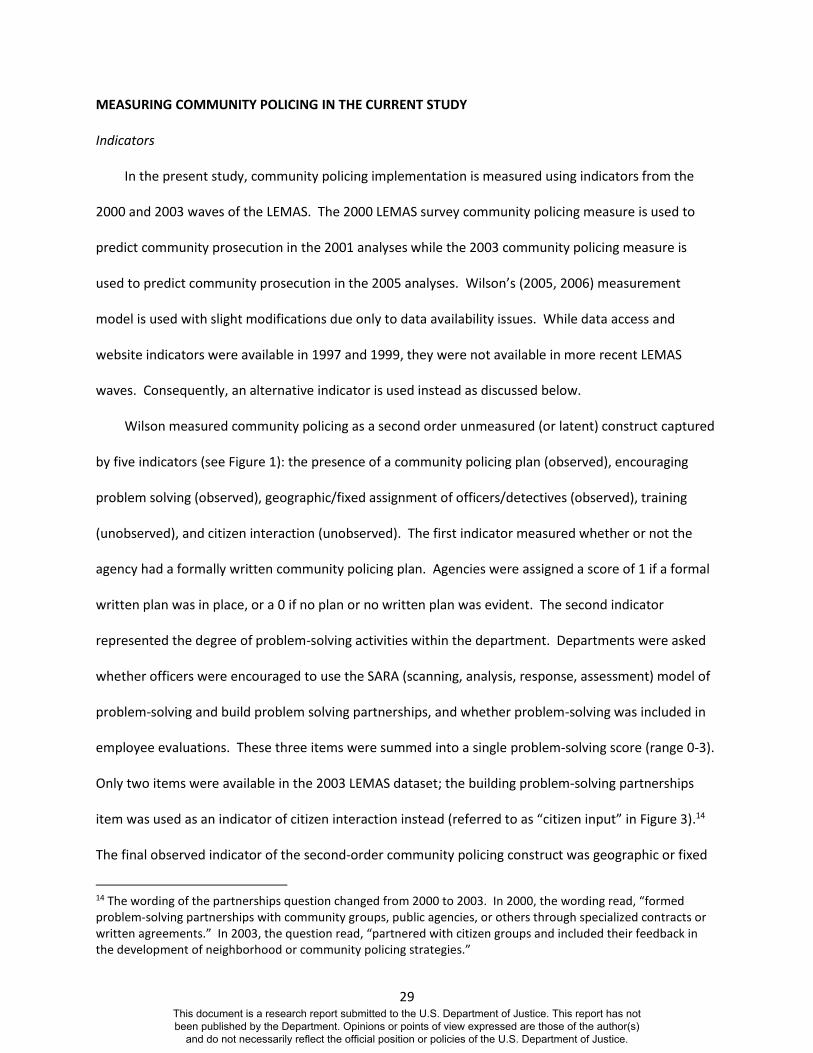
29
MEASURING COMMUNITY POLICING IN THE CURRENT STUDY
Indicators
In the present study, community policing implementation is measured using indicators from the
2000 and 2003 waves of the LEMAS. The 2000 LEMAS survey community policing measure is used to
predict community prosecution in the 2001 analyses while the 2003 community policing measure is
used to predict community prosecution in the 2005 analyses. Wilson’s (2005, 2006) measurement
model is used with slight modifications due only to data availability issues. While data access and
website indicators were available in 1997 and 1999, they were not available in more recent LEMAS
waves. Consequently, an alternative indicator is used instead as discussed below.
Wilson measured community policing as a second order unmeasured (or latent) construct captured
by five indicators (see Figure 1): the presence of a community policing plan (observed), encouraging
problem solving (observed), geographic/fixed assignment of officers/detectives (observed), training
(unobserved), and citizen interaction (unobserved). The first indicator measured whether or not the
agency had a formally written community policing plan. Agencies were assigned a score of 1 if a formal
written plan was in place, or a 0 if no plan or no written plan was evident. The second indicator
represented the degree of problem-solving activities within the department. Departments were asked
whether officers were encouraged to use the SARA (scanning, analysis, response, assessment) model of
problem-solving and build problem solving partnerships, and whether problem-solving was included in
employee evaluations. These three items were summed into a single problem-solving score (range 0-3).
Only two items were available in the 2003 LEMAS dataset; the building problem-solving partnerships
item was used as an indicator of citizen interaction instead (referred to as “citizen input” in Figure 3).14
The final observed indicator of the second-order community policing construct was geographic or fixed
14 The wording of the partnerships question changed from 2000 to 2003. In 2000, the wording read, “formed problem-solving partnerships with community groups, public agencies, or others through specialized contracts or written agreements.” In 2003, the question read, “partnered with citizen groups and included their feedback in the development of neighborhood or community policing strategies.”
This document is a research report submitted to the U.S. Department of Justice. This report has not been published by the Department. Opinions or points of view expressed are those of the author(s)
and do not necessarily reflect the official position or policies of the U.S. Department of Justice.

30
assignment. LEMAS respondents were asked to report whether detectives and officers were assigned
geographically. A score of 2 indicates that departments deploy both detectives and officers to largely
fixed geographic assignments (1= detectives or officers; 0= neither detectives nor officers).15
Community policing implementation, as noted, was also measured by two first-order latent
constructs. The training construct was indicated by three variables. Organizations were asked to report
the proportion of new recruits, in-service officers, and non-sworn personnel trained in community
policing. For each of the three indicators, agencies were assigned scores of 3 (all), 2 (more than half), 1
(less than half), or 0 (none) to reflect the level of training provided.
The citizen interaction construct included three indicators in 2000 and four in 2003.16 The first two,
both dichotomous, indicated whether the department trained citizens in community policing and
whether it ran a citizen police academy. The third indicator was an additive index representing the
number of different groups (e.g., religious groups, senior citizens’ groups, business groups) the
department met with on a regular basis during the previous year. The 2000 LEMAS survey included 10
options while the 2003 LEMAS included 9 groups.17 While there is minor variation in the composition of
the index and wording, it does not affect the overall measurement of community policing
implementation.18,19 In the 2003 measurement model, a fourth indicator was included that reflected
citizen input (see footnote 15).
15 The question addressing detective assignment was not included in the 2003 LEMAS survey. As such, only the officer indicator is used in the model based on 2003 LEMAS data discussed below. 16 As noted earlier, the website and data access indicators used in Wilson’s original model were not available in later LEMAS waves. These were omitted but a citizen academy indicator was added due to its relationship to overall citizen interaction. 17 Both waves included items addressing advocacy groups, business groups, neighborhood associations, local public agencies (called local government agencies in 2003), religious groups (called faith based-organizations in 2003), school groups, senior citizen groups, and youth service organizations. The 2000 LEMAS asked about meetings with tenants’ associations and domestic violence groups. Neither of those groups were addressed in 2003. 18 The measurement model accounts for measurement error in both the observed indicators and the latent constructs such as citizen interaction. Interestingly, the variable descriptions in the 2003 LEMAS dataset use the phrasing “met” to describe the variables even though the actual instrument refers to partnerships and written agreements.
This document is a research report submitted to the U.S. Department of Justice. This report has not been published by the Department. Opinions or points of view expressed are those of the author(s)
and do not necessarily reflect the official position or policies of the U.S. Department of Justice.

31
The analysis of the two community policing measurement models included all law enforcement
agencies matched to at least one NPS prosecutor’s office (n=792 from 2000 LEMAS and n=481 from
2003 LEMAS). The analysis was not limited to a single law enforcement agency for each prosecutors’
office. Descriptive statistics for all items used in the community policing measurement models are
shown in Tables 2 and 3.20
19 The 2003 LEMAS asked respondents about meetings with other law enforcement agencies, an item not addressed in 2000. Moreover, the 2003 question addresses partnerships and agreements more than meetings. Nevertheless, both years suggest interaction between the police and the groups identified. 20 Correlation matrices are shown in Appendix C.
Table 2.
Descriptive s tatis tics for indicators used in community pol icing measurement model , 2000 LEMAS data
n m sd range n m sd range
778 0.515 0.500 0-1 778 0.515 0.500 0-1
792 1.347 1.063 0-3 778 1.372 1.057 0-3
Encourages prob. solv. projects 792 0.548 0.498 0-1 778 0.558 0.497 0-1
Formed problem solving groups 792 0.481 0.500 0-1 778 0.490 0.500 0-1
Includes problem solving in evals . 792 0.318 0.466 0-1 778 0.324 0.468 0-1
792 1.287 0.702 0-2 778 1.310 0.687 0-2
Detectives ass igned geographica l ly 792 0.450 0.498 0-1 778 0.458 0.499 0-1
Officers ass igned to speci fic areas 792 0.837 0.369 0-1 778 0.852 0.355 0-1
778 2.279 1.190 0-3 778 2.279 1.190 0-3
778 1.505 1.071 0-3 778 1.505 1.071 0-3
778 0.584 0.890 0-3 778 0.584 0.890 0-3
792 0.514 0.500 0-1 778 0.523 0.500 0-1
792 0.605 0.489 0-1 778 0.616 0.487 0-1
792 6.027 3.060 0-10 778 6.135 2.978 0-10
Advocacy groups 792 0.520 0.500 0-1 778 0.530 0.500 0-1
Bus iness groups 792 0.670 0.470 0-1 778 0.680 0.465 0-1
Domestic violence groups 792 0.610 0.488 0-1 778 0.620 0.485 0-1
Local publ ic agencies 792 0.610 0.488 0-1 778 0.620 0.486 0-1
Neighborhood associations 792 0.860 0.342 0-1 778 0.880 0.325 0-1
Rel igious groups 792 0.450 0.498 0-1 778 0.460 0.499 0-1
School groups 792 0.770 0.420 0-1 778 0.790 0.411 0-1
Senior ci tizen groups 792 0.590 0.492 0-1 778 0.600 0.490 0-1
Tenants associations 792 0.430 0.495 0-1 778 0.430 0.496 0-1
Youth service organizations 792 0.520 0.500 0-1 778 0.530 0.500 0-1
Tra in sworn officers in CP
Tra in civi l ians in CP
Citizen tra ining in CP
Hold ci tizens academy
Group meetings
Tra in recruits in CP
Overal l Sample Matched with NPS Measurement Model Sample
Presence of community pol icing plan
Agency problem solving
Geographic ass ignment
This document is a research report submitted to the U.S. Department of Justice. This report has not been published by the Department. Opinions or points of view expressed are those of the author(s)
and do not necessarily reflect the official position or policies of the U.S. Department of Justice.

32
Assessing the Validity of the Policing Measurement Model (2000 LEMAS Data)
As shown in Figure 2, the hypothesized model of community policing implementation (based on
Wilson’s model) fits the 2000 LEMAS data well according to the three major fit indices (CFI=0.989;
TLI=0.992; RMSEA=0.031). The two first-order latent constructs, training and citizen interaction, explain
between 33.8 and 67.5 percent of the variance in observed indicators. In Wilson’s (2006) original
analysis, the data access and website indicators had the lowest standardized coefficients (the citizen
interaction latent construct did not explain as much variance). While those measures were absent in the
2000 LEMAS, the citizen academy indicator proved to be a viable replacement (β=0.584; R2=0.341). One
of the benefits of structural equation modeling is the ability to assess each indicator’s relative
relationship to the underlying construct. The second-order community policing implementation
Table 3.
Descriptive s tatis tics for indicators used in community pol icing measurement model , 2003 LEMAS data
n m sd range n m sd range
479 0.464 0.499 0-1 436 0.477 0.500 0-1
479 0.908 0.828 0-2 436 0.950 0.829 0-2
Encourages prob. solv. projects 479 0.560 0.497 0-1 436 0.585 0.493 0-1
Includes problem solving in evals . 479 0.349 0.477 0-1 436 0.365 0.482 0-1
479 0.789 0.408 0-1 436 0.810 0.393 0-1
447 2.266 1.216 0-3 436 2.273 1.212 0-3
475 1.131 1.051 0-3 436 1.154 1.051 0-3
470 0.445 0.753 0-3 436 0.463 0.759 0-3
479 0.549 0.498 0-1 436 0.567 0.496 0-1
479 0.647 0.478 0-1 436 0.663 0.473 0-1
Partnered with ci tizens/included feedback 479 0.752 0.433 0-1 436 0.768 0.422 0-1
477 4.887 2.970 1-9 436 4.961 2.959 1-9
Advocacy groups 477 0.450 0.498 0-1 436 0.460 0.499 0-1
Bus iness groups 477 0.500 0.501 0-1 436 0.520 0.500 0-1
Faith-based organizations 477 0.380 0.485 0-1 436 0.390 0.488 0-1
Local government agencies 477 0.590 0.493 0-1 436 0.590 0.492 0-1
Other law enforcement 477 0.660 0.475 0-1 436 0.670 0.471 0-1
Neighborhood associations 477 0.660 0.475 0-1 436 0.670 0.469 0-1
Senior ci tizen groups 477 0.450 0.498 0-1 436 0.460 0.499 0-1
School groups 477 0.610 0.487 0-1 436 0.630 0.483 0-1
Youth service organizations 477 0.470 0.500 0-1 436 0.470 0.500 0-1
Tra in sworn officers in CP
Tra in civi l ians in CP
Citizen tra ining in CP
Hold ci tizens academy
Partnerships/written agreements
Tra in recruits in CP
Overal l Sample Matched with NPS Measurement Model Sample
Presence of community pol icing plan
Agency problem solving
Geographic ass ignment- officers
This document is a research report submitted to the U.S. Department of Justice. This report has not been published by the Department. Opinions or points of view expressed are those of the author(s)
and do not necessarily reflect the official position or policies of the U.S. Department of Justice.

33
construct was most closely connected to citizen interaction (β=0.897), problem-solving (β=0.798), and
training (β=0.707). This pattern closely approximated Wilson’s (2006) findings based on 1997 LEMAS
data.
Figure 2. Standardized factor loadings and fit indices for measurement model of community policing implementation using LEMAS 2000 data Assessing the Validity of the Policing Measurement Model (2003 LEMAS Data)
The hypothesized model did not fit the 2003 LEMAS data as well (see Figure 3). Goodness-of-fit
indices (CFI=0.939; TLI=0.944; RMSEA=0.070) point to a marginal fit, at best, according to common
thresholds (see Gau, 2010; Hu & Bentler, 1999; Schumacker & Lomax, 2010). One possible reason for
the change in model fit is the change in measurement of indicators from 2000 to 2003. For example, as
noted above, one of the indicators of citizen interaction shifted from regular meetings with various
groups (2000) to partnerships and agreements with many of those same groups (2003). Likewise, the
This document is a research report submitted to the U.S. Department of Justice. This report has not been published by the Department. Opinions or points of view expressed are those of the author(s)
and do not necessarily reflect the official position or policies of the U.S. Department of Justice.
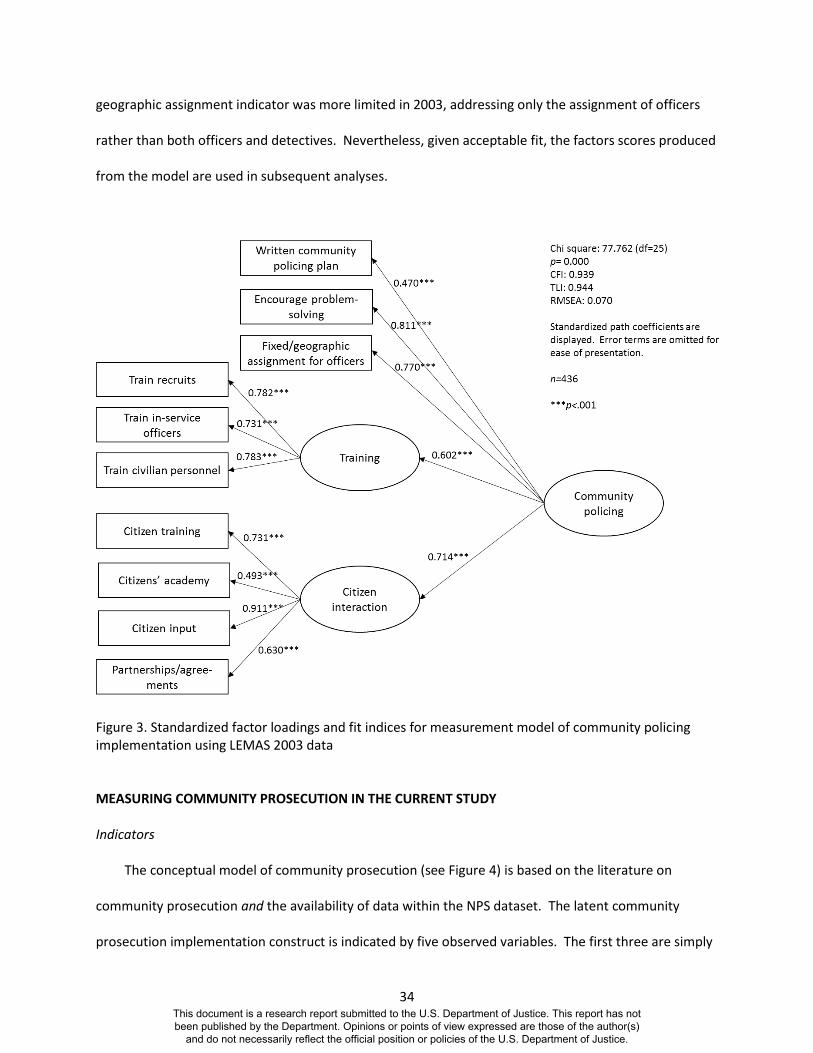
34
geographic assignment indicator was more limited in 2003, addressing only the assignment of officers
rather than both officers and detectives. Nevertheless, given acceptable fit, the factors scores produced
from the model are used in subsequent analyses.
Figure 3. Standardized factor loadings and fit indices for measurement model of community policing implementation using LEMAS 2003 data
MEASURING COMMUNITY PROSECUTION IN THE CURRENT STUDY
Indicators
The conceptual model of community prosecution (see Figure 4) is based on the literature on
community prosecution and the availability of data within the NPS dataset. The latent community
prosecution implementation construct is indicated by five observed variables. The first three are simply
This document is a research report submitted to the U.S. Department of Justice. This report has not been published by the Department. Opinions or points of view expressed are those of the author(s)
and do not necessarily reflect the official position or policies of the U.S. Department of Justice.

35
dichotomous measures addressing community prosecution-related activities: using the community to
help identify crime problems, assigning prosecutors to geographic areas, and using tools other than
criminal prosecution. The relationships indicator is an ordinal measure combining responses to an NPS
survey item: at any time during the past 12 months, did your office have a formal and/or informal
relationship with any of the following? Options included law enforcement agencies, other government
agencies, private organizations, and community associations. Relationship scores theoretically ranged
from 0 to 4. Finally, respondents were asked to indicate whether staff members regularly met with
various groups during the prior 12-month period. Similar to the community policing meetings index,
possible groups included neighborhood associations, tenants’ associations, youth service organizations,
advocacy groups, business groups, religious groups, and school groups. Affirmative responses were
summed into a single meetings index with scores ranging from 0 to 7. Indicators were identical for 2001
and 2005 NPS data. Descriptive statistics are presented in Tables 4 and 5.21
Figure 4. Conceptual model of community prosecution
21 Correlation matrices are shown in Appendix D.
This document is a research report submitted to the U.S. Department of Justice. This report has not been published by the Department. Opinions or points of view expressed are those of the author(s)
and do not necessarily reflect the official position or policies of the U.S. Department of Justice.

36
Table 4.
Descriptive s tatis tics for indicators used in community prosecution measurement model , 2001 NPS data
n m sd range n m sd range
364 3.539 0.831 1-4 291 3.619 0.763 1-4
With law enforcement agencies 364 1.000 0.000 1-1 291 1.000 0.000 1-1
With other gov't agencies 364 0.900 0.295 0-1 291 0.930 0.259 0-1
With private organizations 364 0.790 0.411 0-1 291 0.810 0.392 0-1
With community associations 364 0.850 0.359 0-1 291 0.880 0.326 0-1
351 4.293 2.020 0-7 291 4.395 2.015 0-7
With neighborhood associations 351 0.650 0.478 0-1 291 0.670 0.471 0-1
With tenants associations 351 0.250 0.434 0-1 291 0.270 0.447 0-1
With youth services associations 351 0.610 0.489 0-1 291 0.630 0.485 0-1
With advocacy groups 351 0.830 0.372 0-1 291 0.840 0.369 0-1
With bus iness groups 351 0.680 0.469 0-1 291 0.700 0.460 0-1
With rel igious groups 351 0.470 0.500 0-1 291 0.480 0.501 0-1
With school groups 351 0.800 0.400 0-1 291 0.800 0.398 0-1291
339 0.750 0.436 0-1 291 0.730 0.447 0-1291
320 0.390 0.489 0-1 291 0.390 0.488 0-1291
348 0.820 0.386 0-1 291 0.800 0.398 0-1Use non-prosecution tools
Overa l l Sample Matched with LEMAS Measurement Model Sample
Formal and informal relationships
with other groups
Regular meetings with other groups
Involve community in problem
identi fication
Ass ign prosecutions to geographic
areas
Table 5.
Descriptive s tatis tics for indicators used in community prosecution measurement model , 2005 NPS data
n m sd range n m sd range
166 3.476 0.919 1-4 162 3.488 0.907 1-4
With law enforcement agencies 166 1.000 0.000 1-1 162 1.000 0.000 1-1
With other gov't agencies 166 0.900 0.296 0-1 162 0.910 0.291 0-1
With private organizations 166 0.750 0.433 0-1 162 0.760 0.429 0-1
With community associations 166 0.820 0.386 0-1 162 0.820 0.385 0-1
165 4.515 2.149 0-7 162 4.537 2.156 0-7
With neighborhood associations 165 0.700 0.458 0-1 162 0.700 0.458 0-1
With tenants associations 165 0.320 0.466 0-1 162 0.310 0.466 0-1
With youth services associations 165 0.680 0.466 0-1 162 0.690 0.463 0-1
With advocacy groups 165 0.800 0.401 0-1 162 0.810 0.395 0-1
With bus iness groups 165 0.680 0.466 0-1 162 0.690 0.466 0-1
With rel igious groups 165 0.520 0.501 0-1 162 0.520 0.501 0-1
With school groups 165 0.810 0.392 0-1 162 0.810 0.395 0-1291
164 0.800 0.398 0-1 162 0.800 0.399 0-1291
165 0.450 0.499 0-1 162 0.460 0.500 0-1291
165 0.830 0.377 0-1 162 0.830 0.379 0-1Use non-prosecution tools
Overa l l Sample Matched with LEMAS Measurement Model Sample
Formal and informal relationships
with other groups
Regular meetings with other groups
Involve community in problem
identi fication
Ass ign prosecutions to geographic
areas
This document is a research report submitted to the U.S. Department of Justice. This report has not been published by the Department. Opinions or points of view expressed are those of the author(s)
and do not necessarily reflect the official position or policies of the U.S. Department of Justice.

37
Assessing the Validity of the Prosecution Measurement Model (2001 NPS Data)
The goodness-of-fit indices suggest that the hypothesized model of community prosecution
implementation fits the 2001 NPS data well (CFI=0.976; TLI=0.966; RMSEA=0.071). Based on the
standardized path coefficients (see Figure 5), community prosecution is most closely associated with
using the community in the identification of crime problems (β=0.880) and using tools other than
criminal prosecution to solve problems (β=0.842). The model is consistent with the hypothesized model
depicted in Figure 4. However, it omits the only remaining community prosecution indicator available in
the NPS dataset: assigning prosecutors to handle community prosecution activities. This indicator was
included in the composite measure developed by Cunningham, Renauer, and Khalifa (2006); recall,
however, that they neither measured community meetings nor relations. A separate measurement
model was assessed (not shown) that included the five indicators shown in Figure 4 plus the assigning
prosecutors variable. This revised model did not fit the data as well as the original model (CFI=0.955;
TLI=0.944; RMSEA=0.093). Thus, the five-indicator model forms the basis for the predictor models in
Chapter V.
This document is a research report submitted to the U.S. Department of Justice. This report has not been published by the Department. Opinions or points of view expressed are those of the author(s)
and do not necessarily reflect the official position or policies of the U.S. Department of Justice.

38
Figure 5. Standardized factor loadings and fit indices for measurement model of community prosecution implementation using NPS 2001 data
Assessing the Validity of the Prosecution Measurement Model (2005 NPS Data)
The hypothesized measurement model also fits the 2005 NPS data well (CFI=0.993; TLI=0.988;
RMSEA=0.064). As shown in Figure 6, community prosecution is again most closely associated with
using the community to identify crime problems (β=0.911) and using tools other than criminal
prosecution (β=0.852). Overall, the community prosecution latent construct explains between 31
percent (assigning prosecutors to geographic areas) and 83 percent (using community to identify
problems) of the variation in the observed indicators.
This document is a research report submitted to the U.S. Department of Justice. This report has not been published by the Department. Opinions or points of view expressed are those of the author(s)
and do not necessarily reflect the official position or policies of the U.S. Department of Justice.
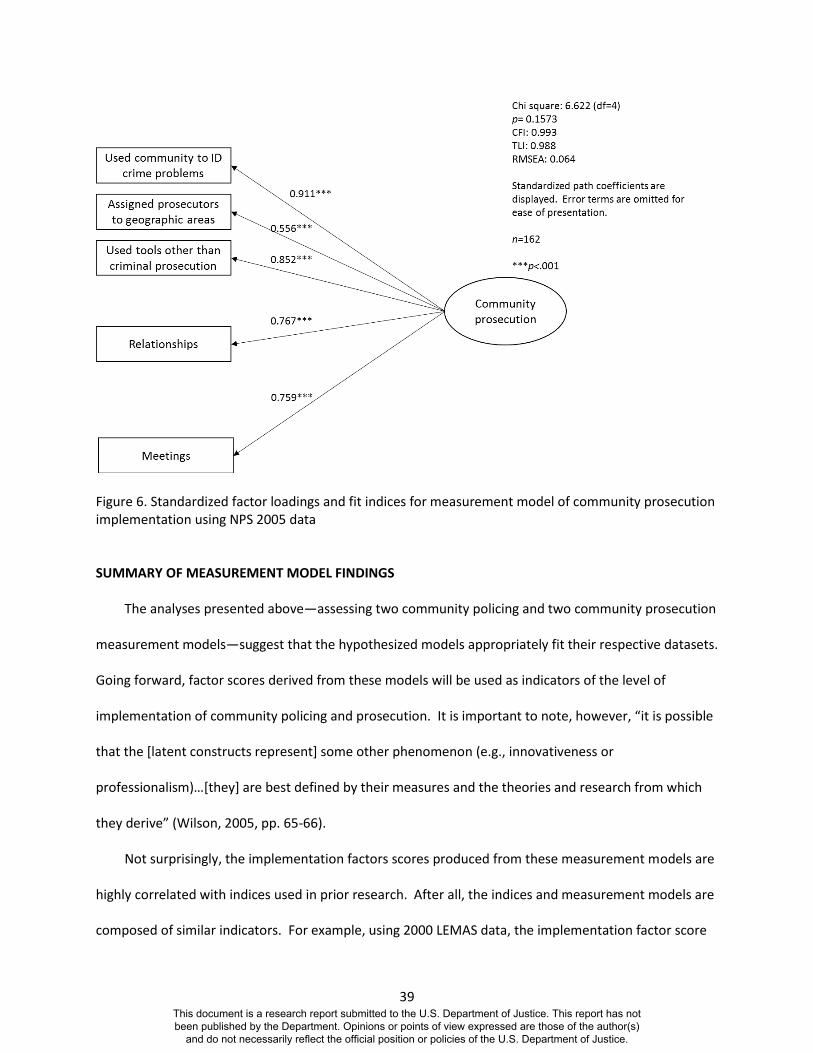
39
Figure 6. Standardized factor loadings and fit indices for measurement model of community prosecution implementation using NPS 2005 data
SUMMARY OF MEASUREMENT MODEL FINDINGS
The analyses presented above—assessing two community policing and two community prosecution
measurement models—suggest that the hypothesized models appropriately fit their respective datasets.
Going forward, factor scores derived from these models will be used as indicators of the level of
implementation of community policing and prosecution. It is important to note, however, “it is possible
that the [latent constructs represent] some other phenomenon (e.g., innovativeness or
professionalism)…[they] are best defined by their measures and the theories and research from which
they derive” (Wilson, 2005, pp. 65-66).
Not surprisingly, the implementation factors scores produced from these measurement models are
highly correlated with indices used in prior research. After all, the indices and measurement models are
composed of similar indicators. For example, using 2000 LEMAS data, the implementation factor score
This document is a research report submitted to the U.S. Department of Justice. This report has not been published by the Department. Opinions or points of view expressed are those of the author(s)
and do not necessarily reflect the official position or policies of the U.S. Department of Justice.

40
was correlated with MacDonald’s (2002) dichotomous formal plan/no formal plan measure of
community policing (r=0.530) and the more inclusive index (r=0.894). Similarly, the community
prosecution implementation scores are highly correlated with Cunningham, Renauer, and Khalifa’s
(2006) four-item index (r=0.848).22
CONTROL VARIABLES
Several control variables are introduced in the models presented in Chapter V. These variables are
derived from the general organizational innovation literature and the limited literature on community
prosecution adoption (Cunningham, Renauer, & Khalifa, 2006; Damanpour, 1987, 1991; King, 2000).
Unless otherwise noted, the NPS 2001 dataset is the source of all control variables for both the 2001 and
2003 analyses.23 The fourteen variables are described in Table 6 below.24 Damanpour (1991), for
example, summarized the innovation literature and described the importance of organizational
structure in shaping the adoption of innovation. In the present study, four structural characteristics—
occupational differentiation, functional differentiation, formalization, and decentralization—are
measured. Damanpour (1991) suggested that the division of work—either individually or into special
units—promotes specialization; “a greater variety of specialists would provide a broader knowledge
base and increase the cross-fertilization of ideas” (p. 558). In contrast, formal, rule-bound organizations
with centralized control are likely to stifle innovation. Employees lose flexibility in decision-making both
because of the need to adhere to written rules and management authority.
22 An additional advantage of the factor score approach is the greater precision in measurement. That is, there is greater variation in the factor score variables compared to the more restricted indices. 23 In the 2001 analysis, the control variables (independent variables) are measured at the same time as community prosecution making time ordering a concern. In the 2005 analysis, the use of 2001 variables ensures the temporal ordering of relevant variables. Of course, a related concern is that some of the characteristics of prosecutors’ offices changed from 2001 to 2005. The analysis assumes some degree of stability in favor of ensuring proper ordering of variables. 24 Most of the variables are skewed and were log transformed prior to analysis. Table 7 shows non-transformed descriptive statistics.
This document is a research report submitted to the U.S. Department of Justice. This report has not been published by the Department. Opinions or points of view expressed are those of the author(s)
and do not necessarily reflect the official position or policies of the U.S. Department of Justice.
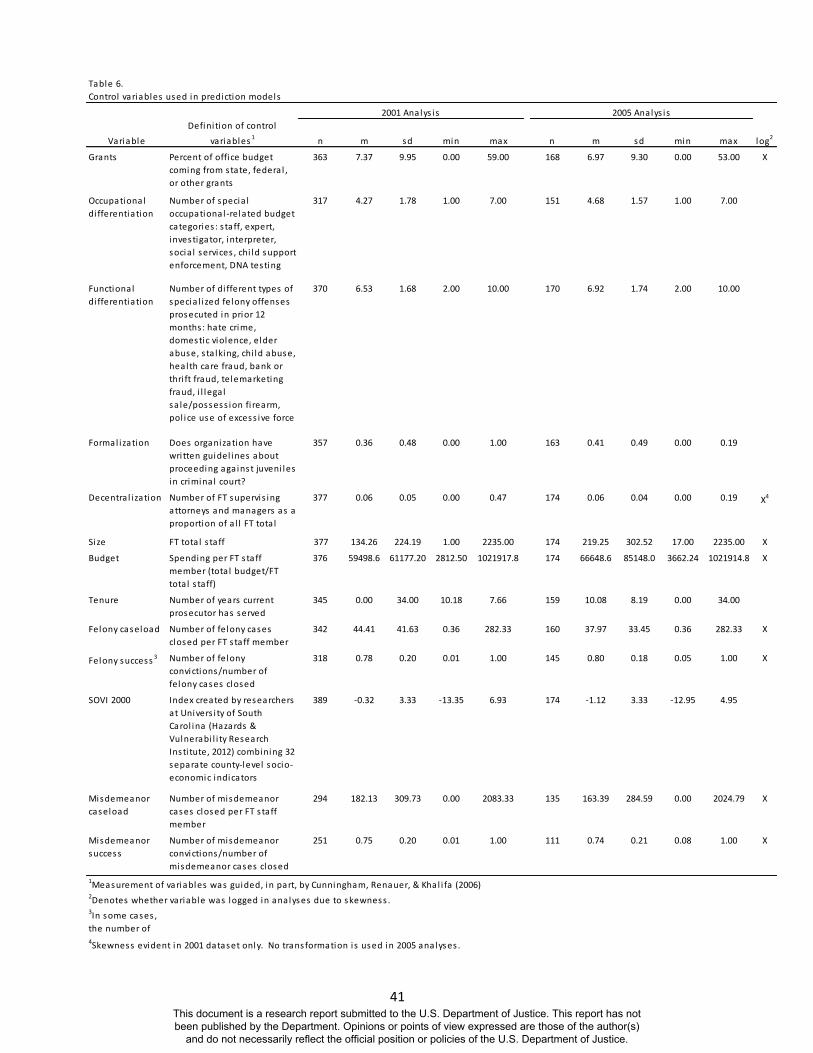
41
Table 6.
Control variables used in prediction models
Variable
Defini tion of control
variables1
n m sd min max n m sd min max log2
Grants Percent of office budget
coming from state, federa l ,
or other grants
363 7.37 9.95 0.00 59.00 168 6.97 9.30 0.00 53.00 X
Occupational
di fferentiation
Number of specia l
occupational -related budget
categories : s taff, expert,
investigator, interpreter,
socia l services , chi ld support
enforcement, DNA testing
317 4.27 1.78 1.00 7.00 151 4.68 1.57 1.00 7.00
Functional
di fferentiation
Number of di fferent types of
specia l i zed felony offenses
prosecuted in prior 12
months : hate crime,
domestic violence, elder
abuse, s ta lking, chi ld abuse,
health care fraud, bank or
thri ft fraud, telemarketing
fraud, i l lega l
sa le/possess ion fi rearm,
pol ice use of excess ive force
370 6.53 1.68 2.00 10.00 170 6.92 1.74 2.00 10.00
Formal ization Does organization have
wri tten guidel ines about
proceeding against juveni les
in criminal court?
357 0.36 0.48 0.00 1.00 163 0.41 0.49 0.00 0.19
Decentra l i zation Number of FT supervis ing
attorneys and managers as a
proportion of a l l FT tota l
s taff (a l ternatively,
377 0.06 0.05 0.00 0.47 174 0.06 0.04 0.00 0.19 X4
Size FT tota l s taff 377 134.26 224.19 1.00 2235.00 174 219.25 302.52 17.00 2235.00 X
Budget Spending per FT s taff
member (tota l budget/FT
tota l s taff)
376 59498.6 61177.20 2812.50 1021917.8 174 66648.6 85148.0 3662.24 1021914.8 X
Tenure Number of years current
prosecutor has served
345 0.00 34.00 10.18 7.66 159 10.08 8.19 0.00 34.00
Felony caseload Number of felony cases
closed per FT s taff member
342 44.41 41.63 0.36 282.33 160 37.97 33.45 0.36 282.33 X
Felony success3 Number of felony
convictions/number of
felony cases closed
318 0.78 0.20 0.01 1.00 145 0.80 0.18 0.05 1.00 X
SOVI 2000 Index created by researchers
at Univers i ty of South
Carol ina (Hazards &
Vulnerabi l i ty Research
Insti tute, 2012) combining 32
separate county-level socio-
economic indicators
389 -0.32 3.33 -13.35 6.93 174 -1.12 3.33 -12.95 4.95
Misdemeanor
caseload
Number of misdemeanor
cases closed per FT s taff
member
294 182.13 309.73 0.00 2083.33 135 163.39 284.59 0.00 2024.79 X
Misdemeanor
success
Number of misdemeanor
convictions/number of
misdemeanor cases closed
251 0.75 0.20 0.01 1.00 111 0.74 0.21 0.08 1.00 X
1Measurement of variables was guided, in part, by Cunningham, Renauer, & Khal i fa (2006)2Denotes whether variable was logged in analyses due to skewness . 3In some cases ,
the number of
convictions 4Skewness evident in 2001 dataset only. No transformation is used in 2005 analyses .
2001 Analys is 2005 Analys is
This document is a research report submitted to the U.S. Department of Justice. This report has not been published by the Department. Opinions or points of view expressed are those of the author(s)
and do not necessarily reflect the official position or policies of the U.S. Department of Justice.

42
Two resource-related variables are also included. The first, budget per staff member, provides a
general view of the organizations resource base. In practice, it is likely that slack resources matter more
(Damanpour, 1991; King, 1998). Slack resources are an organization’s resources that are not committed
to salaries and other non-discretionary expenses; presumably, greater slack allows for greater
innovation. The NPS datasets do not allow for the measurement of slack resources so overall budget
per employee is used as a proxy.25 The second measure captures the proportion of the overall budget
coming from external grant funding. Considerable evidence backed by organizational theory (resource
dependence) points to the importance of external resource flows in promoting innovation (see, for
example, Pfeffer & Salancik, 1978; Worrall & Zhao, 2003). While it is impossible to determine the source
or purpose of the grant funds, it is hypothesized that external funding is associated with community
prosecution implementation.
Several additional variables are used to address workload-related issues. For example, two
measures of caseload (felony, misdemeanor) are included under the assumption that prosecutors may
innovate to address problematic work demands (e.g., use community prosecution to problem-solve).
Similarly, community prosecution may be adopted in agencies with lower conviction rates, perhaps as a
means of encouraging community cooperation. Thus, two conviction rate measures are introduced in
the analyses.
Three final measures are included. Organization size is a common correlate of innovation; indeed,
it is one of the strongest predictors of many police innovations (King, 1998). The tenure (number of
years served) of the chief prosecutor is measured in order to examine the possibility that recently
elected (or appointed) prosecutors are more likely to introduce new ideas to the office. Finally, the
overall community environment is measured using the Social Vulnerability Index (SoVI), a county-level
measure produced by the Hazards and Vulnerability Research Institute at the University of South
25 LEMAS datasets, for example, separate budget items by salary, equipment, and other items.
This document is a research report submitted to the U.S. Department of Justice. This report has not been published by the Department. Opinions or points of view expressed are those of the author(s)
and do not necessarily reflect the official position or policies of the U.S. Department of Justice.

43
Carolina (2012). The SoVI combines 32 separate 2000 Census variables together into a single score
indicative of a community’s vulnerability to natural and intentional (e.g., terrorism) hazards (e.g., older
population more susceptible to harms). It is used here as a measure of a county’s demographic and
socioeconomic structure.
This document is a research report submitted to the U.S. Department of Justice. This report has not been published by the Department. Opinions or points of view expressed are those of the author(s)
and do not necessarily reflect the official position or policies of the U.S. Department of Justice.

44
CHAPTER V: PREDICTING COMMUNITY
PROSECUTION
COMMUNITY PROSECUTION, 2001 (2001 ANALYSES) The first step in the analysis is to consider the bivariate relationship between community policing
implementation and community prosecution implementation. Two sets of analyses are presented
below. The first set examines the relationship between prosecutors’ offices and the single largest police
department in each jurisdiction. That is, these analyses, referred to as the “large agency analyses,”
assess the influence of the most influential law enforcement agency as indicated by the number of FT
sworn officers. Recall from Chapter III that some prosecutors had as many as 17 matched LEMAS
agencies operating within their jurisdiction. To address this fact, the second set of analyses, referred to
as the “pooled agency analyses,” averages the community policing implementation scores for all law
enforcement agencies within a jurisdiction. Stated differently, these analyses examine the general level
of community policing across all law enforcement agencies (100 or more FT sworn officers) within a
prosecutor’s jurisdiction.
Regardless of the analysis, community policing implementation is only weakly related to
community prosecution implementation in 2001 (r=0.056 in large agency analysis; r=0.049 in pooled
agency analysis; see Figures 7 and 8). If community policing implementation does not significantly
predict community prosecution implementation, what factors do matter? Answering this question is no
simple task. Although there are a total of 391 prosecutors’ offices in the 2001 datasets (both large
agency and pooled), a model using all of the independent variables shown in Table 6 would result in a
substantial loss of cases.26 Specifically, listwise deletion would result in a model sample of 158 cases,
approximately 40 percent of the offices in the 2001 NPS that were matched with LEMAS agencies. Table
26 As shown in Table 6, missing values occur on most NPS variables.
This document is a research report submitted to the U.S. Department of Justice. This report has not been published by the Department. Opinions or points of view expressed are those of the author(s)
and do not necessarily reflect the official position or policies of the U.S. Department of Justice.

45
7 offers three large agency analysis models and Table 8 offers three pooled agency analysis models. The
models address missing values issue in different ways.
Figure 7. Scatterplot, regression fit line, and confidence interval for relationship between community policing and community prosecution (large agency analysis), 2001
Figure 8. Scatterplot, regression fit line, and confidence interval for relationship between community policing and community prosecution (pooled agency analysis), 2001
-1.5
-1-.
50
.51
Co
mm
un
ity P
rosecution
Im
ple
me
nta
tio
n S
core
s 2
00
1
-1.5 -1 -.5 0 .5 1Community Policing Implementation Scores 2000
95% CI Fitted values
-1.5
-1-.
50
.51
Co
mm
un
ity P
rosecution
Im
ple
me
nta
tio
n S
core
s 2
00
1
-1.5 -1 -.5 0 .5 1Community Policing Implementation Scores 2000
95% CI Fitted values
This document is a research report submitted to the U.S. Department of Justice. This report has not been published by the Department. Opinions or points of view expressed are those of the author(s)
and do not necessarily reflect the official position or policies of the U.S. Department of Justice.
46
Table 7 shows the results of the analyses that limit the influence of community policing to the
single largest law enforcement agency in each prosecutorial jurisdiction (large agency analysis). The first
analysis regresses community prosecution implementation on the community policing implementation
and the 13 other independent variables. Listwise deletion resulted in a final n of 158 cases. Two
variables—tenure (p=0.009) and formalization (p=0.025)—reached conventional significance levels.
Longer-serving prosecutors lead organizations with less developed community prosecution efforts and
the innovation is likely to occur in organizations that are considered more rule-bound (at least as
evident by written rules for handling juveniles). Although not significant by conventional standards,
functional differentiation approaches conventional thresholds. More divided (specialized case types)
organizations are more likely to adopt community prosecution.
The second model in Table 7 omits the two misdemeanor-related variables (caseload and success),
resulting in an additional 43 cases (still only 51% of the 2001 NPS total). Tenure (p=0.009), size
(p=0.023), and functional differentiation (p=0.017) are all significant. Larger, more differentiated
prosecutors’ offices with shorter serving chief prosecutors are more likely to adopt community
prosecution-related strategies.
The final model boosts the analytical sample to 357 cases, 91 percent of the 2001 NPS total, by
using multiple imputation. Multiple imputation is a method of estimating missing data using known
data from a dataset (see Rubin, 1987). Unlike other common procedures for addressing missing data
(e.g., mean replacement, hot deck replacement), multiple imputation essentially generates multiple
estimates (e.g., new, filled-in datasets) that are used in subsequent estimations. In the present study, all
dependent and independent variables plus a series of other measures included in the NPS with low
missing rates were used to predict missing values. Stata software was used to create 10 imputations
and these were then used to estimate regression models; beta coefficients and r-square values
This document is a research report submitted to the U.S. Department of Justice. This report has not been published by the Department. Opinions or points of view expressed are those of the author(s)
and do not necessarily reflect the official position or policies of the U.S. Department of Justice.

47
represent the average estimated coefficients across these 10 imputed datasets.27 With the larger
dataset, variables that were significant or approached significance in the first two models—functional
differentiation, formalization, size, and tenure—were significant at the 0.05 level. In addition, the grants
variable proved relevant here (it approached the 0.05 level in the second model). Community
prosecution implementation was more likely as the proportion of the office’s budget from grant funding
increased.28
27 Stata’s chained equation imputation function was used. All variables except formalization were imputed using an OLS regression function. Formalization, due to its dichotomous nature, was imputed using a logistic regression function. 28 It is possible that the relationship between community policing and community prosecution implementation is conditioned by the nature of the relationship between police and prosecutor organizations. Using the large agency analysis data, the community policing implementation scores were recoded into four groups based on quartiles (an equal number of departments fell into each group). A second variable, unit, was included to capture whether the law enforcement agency had a formal prosecutor relations unit (ordinal variable with categories: special unit, designated personnel, policies, task not official addressed). The relationship between these two measures and community prosecution implementation was examined using a factorial ANOVA. Neither the main effects (community policing implementation, p=0.118; prosecutor relations unit, p=0.176) nor the interaction (p<0.645) were significant.
This document is a research report submitted to the U.S. Department of Justice. This report has not been published by the Department. Opinions or points of view expressed are those of the author(s)
and do not necessarily reflect the official position or policies of the U.S. Department of Justice.

48
The same procedures were used in the 2001 pooled agency analysis (see Table 8).29 When all
variables were entered and listwise deletion allowed, tenure (p=0.007) and formalization (p=0.020) were
the only significant predictors of community prosecution implementation. Once the misdemeanor
variables were omitted, tenure and formalization remained significant. Size (p=0.015) and functional
differentiation (p=0.017) also emerged as significant in the second model. In the imputed model,
functional differentiation, formalization, size, tenure, and grants were all significant.
Overall, the models show some volatility in terms of a straight significant/not significant distinction.
However, the models are largely consistent if the significant variables (even those where p<0.10) are
considered. Larger, more functionally differentiated and formalized organizations, with newer chief
29 The social vulnerability index (SOVI) measure was excluded from the pooled analysis. The SOVI is a county-level measure linked to the location of the law enforcement agency. The SOVI was not averaged together across agencies.
Table 7.
β Std. Err. p β Std. Err. p β Std. Err. p
Community pol icing, 2000 0.071 0.124 0.397 0.070 0.104 0.300 -0.029 0.081 0.588
Grants 0.110 0.105 0.168 0.134 0.092 0.052 0.122 0.075 0.030
Occupational di ff. 0.059 0.035 0.503 0.023 0.030 0.765 -0.041 0.030 0.610
Functional di ff. 0.151 0.034 0.063 0.172 0.028 0.017 0.191 0.024 0.001
Formal ization 0.193 0.123 0.025 0.134 0.100 0.059 0.136 0.082 0.020
Decentra l ization -0.008 2.749 0.919 0.002 2.372 0.973 0.059 1.954 0.313
Size 0.128 0.150 0.186 0.193 0.127 0.023 0.160 0.097 0.013
Budget 0.065 0.335 0.435 0.031 0.278 0.663 0.035 0.250 0.644
Tenure -0.196 0.007 0.009 -0.169 0.006 0.009 -0.199 0.005 0.001
Felony case -0.067 0.147 0.453 -0.077 0.121 0.313 -0.100 0.103 0.102
Felony succ. 0.102 0.984 0.243 0.049 0.774 0.471 0.057 0.727 0.412
SOVI 2000 -0.021 0.020 0.800 0.032 0.017 0.663 -0.016 0.013 0.811
Mis . case 0.037 0.104 0.660 -0.001 0.056 0.987
Mis . Succ. -0.108 0.928 0.204 -0.098 0.694 0.162
Adj. r2
0.18 Adj. r2
0.21 Adj. r2
0.21
Standardized regress ion coefficients for models predicting the community prosecution scores (2001), origina l , misdemeanor
variables omitted, and imputed datasets (large agency analys is )
Observed dataset (n =158)
Observed dataset, misd.
variables excluded (n =201)
Multiple imputed dataset
(n =357)1
1The model imputing miss ing variables included a l l i tems shown above as wel l as dichotomous indicators related to
jurisdiction(misdemeanors , misdemeanors with felonies , misdemeanor appeals , felony appeals , traffic violations , juveni le
matters , chi ld support enforcement, and civi l lawsuits ), problems recruiting s taff, problems retaining s taff, work-related threats ,
and securi ty (pol ice protection, bui lding guards , electronic survei l lance, metal detectors , electronic securi ty system). Al l of these
additional variables were complete in the 2001 NPS dataset so serve as useful additions to improve on the imputation.
This document is a research report submitted to the U.S. Department of Justice. This report has not been published by the Department. Opinions or points of view expressed are those of the author(s)
and do not necessarily reflect the official position or policies of the U.S. Department of Justice.
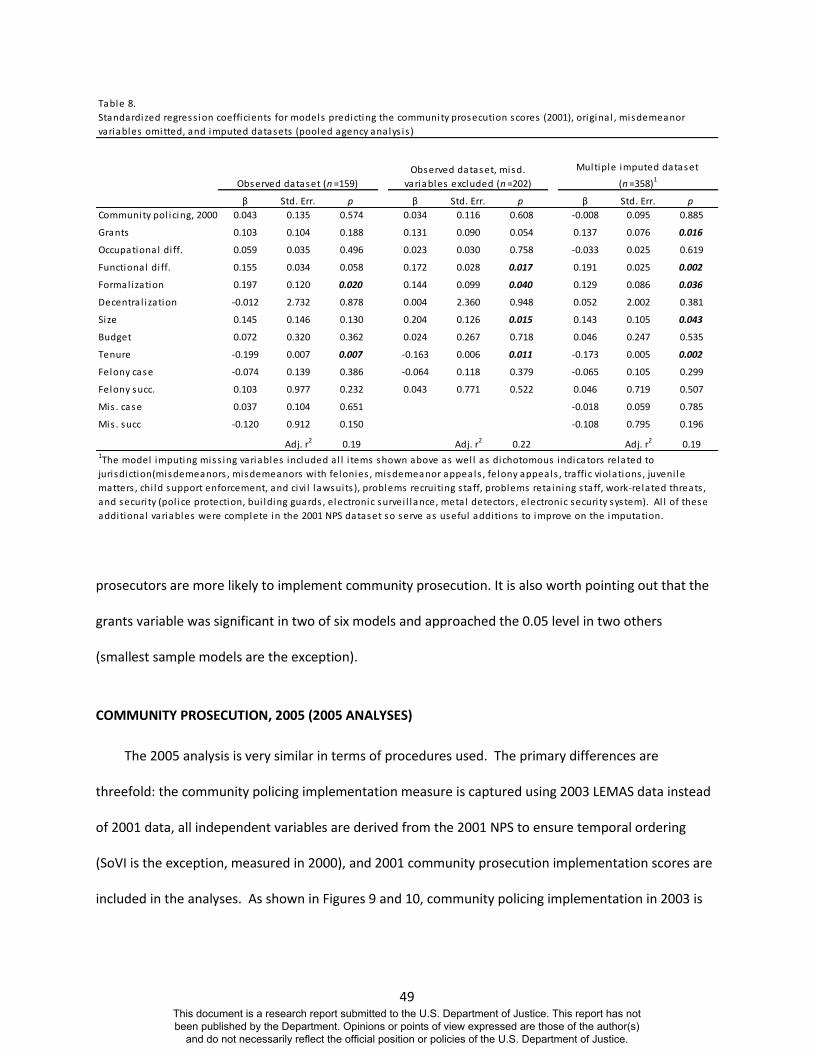
49
prosecutors are more likely to implement community prosecution. It is also worth pointing out that the
grants variable was significant in two of six models and approached the 0.05 level in two others
(smallest sample models are the exception).
COMMUNITY PROSECUTION, 2005 (2005 ANALYSES)
The 2005 analysis is very similar in terms of procedures used. The primary differences are
threefold: the community policing implementation measure is captured using 2003 LEMAS data instead
of 2001 data, all independent variables are derived from the 2001 NPS to ensure temporal ordering
(SoVI is the exception, measured in 2000), and 2001 community prosecution implementation scores are
included in the analyses. As shown in Figures 9 and 10, community policing implementation in 2003 is
Table 8.
β Std. Err. p β Std. Err. p β Std. Err. p
Community pol icing, 2000 0.043 0.135 0.574 0.034 0.116 0.608 -0.008 0.095 0.885
Grants 0.103 0.104 0.188 0.131 0.090 0.054 0.137 0.076 0.016
Occupational di ff. 0.059 0.035 0.496 0.023 0.030 0.758 -0.033 0.025 0.619
Functional di ff. 0.155 0.034 0.058 0.172 0.028 0.017 0.191 0.025 0.002
Formal ization 0.197 0.120 0.020 0.144 0.099 0.040 0.129 0.086 0.036
Decentra l ization -0.012 2.732 0.878 0.004 2.360 0.948 0.052 2.002 0.381
Size 0.145 0.146 0.130 0.204 0.126 0.015 0.143 0.105 0.043
Budget 0.072 0.320 0.362 0.024 0.267 0.718 0.046 0.247 0.535
Tenure -0.199 0.007 0.007 -0.163 0.006 0.011 -0.173 0.005 0.002
Felony case -0.074 0.139 0.386 -0.064 0.118 0.379 -0.065 0.105 0.299
Felony succ. 0.103 0.977 0.232 0.043 0.771 0.522 0.046 0.719 0.507
Mis . case 0.037 0.104 0.651 -0.018 0.059 0.785
Mis . succ -0.120 0.912 0.150 -0.108 0.795 0.196
Adj. r2 0.19 Adj. r2 0.22 Adj. r2 0.19
Standardized regress ion coefficients for models predicting the community prosecution scores (2001), origina l , misdemeanor
variables omitted, and imputed datasets (pooled agency analys is )
Observed dataset (n =159)
Observed dataset, misd.
variables excluded (n =202)
Multiple imputed dataset
(n =358)1
1The model imputing miss ing variables included a l l i tems shown above as wel l as dichotomous indicators related to
jurisdiction(misdemeanors , misdemeanors with felonies , misdemeanor appeals , felony appeals , traffic violations , juveni le
matters , chi ld support enforcement, and civi l lawsuits ), problems recruiting s taff, problems retaining s taff, work-related threats ,
and securi ty (pol ice protection, bui lding guards , electronic survei l lance, metal detectors , electronic securi ty system). Al l of these
additional variables were complete in the 2001 NPS dataset so serve as useful additions to improve on the imputation.
This document is a research report submitted to the U.S. Department of Justice. This report has not been published by the Department. Opinions or points of view expressed are those of the author(s)
and do not necessarily reflect the official position or policies of the U.S. Department of Justice.

50
not related to community prosecution implementation in 2005 in bivariate relationships limited to just
large agencies (r=0.022) or the pooled analysis (r=0.029).
Figure 9. Scatterplot, regression fit line, and confidence interval for relationship between community policing and community prosecution (large agency analysis), 2005
Figure 10. Scatterplot, regression fit line, and confidence interval for relationship between community policing and community prosecution (pooled agency analysis), 2005
-2-1
01
Co
mm
un
ity P
rosecution
Im
ple
me
nta
tio
n S
core
s 2
00
5
-1 -.5 0 .5 1Community Policing Implementation Scores 2003
95% CI Fitted values
-2-1
01
Com
mu
nity P
rose
cutio
n Im
ple
men
tation
Sco
res 2
005
-1 -.5 0 .5 1Community Policing Implementation Scores 2003
95% CI Fitted values
This document is a research report submitted to the U.S. Department of Justice. This report has not been published by the Department. Opinions or points of view expressed are those of the author(s)
and do not necessarily reflect the official position or policies of the U.S. Department of Justice.

51
The 2005 analyses (see Tables 9 and 10) show that community prosecution implementation in 2005
is largely predicted by the level of implementation in 2001. The R2 values in all six 2005 models are
substantially higher than the six 2001 models; community prosecution implementation in 2001 is, as
indicated by the standardized regression coefficients, driving the model. Suspecting that
multicollinearity might be an issue, variance inflation factors (VIFs) were examined. All VIF factors were
below 2.00 except for the size variable in the smallest sample models (VIF=2.13 in large agencies
analysis; VIF=2.26 in pooled sample analysis). Thus, although there are modest correlations among
independent variables, inertia seems to be driving community policing implementation in 2005
independent of other predictors. Only three other variables reach the 0.05 significance level in any of
the six models: decentralization in the large agency (p=0.020) and pooled agency analyses (p=0.033)
with misdemeanor variables excluded and budget in the pooled agency analysis (p=0.036) with multiple
imputation. These results suggest that decentralized prosecutors’ offices with smaller administrative
components (proportion of managers and supervisors) are more likely to adopt community prosecution.
In addition, offices with larger budgets exhibit a greater degree of community prosecution
implementation.
This document is a research report submitted to the U.S. Department of Justice. This report has not been published by the Department. Opinions or points of view expressed are those of the author(s)
and do not necessarily reflect the official position or policies of the U.S. Department of Justice.

52
Table 9.
β Std. Err. p β Std. Err. p β Std. Err. p
Comm. Prosecution, 2001 0.520 0.124 0.000 0.498 0.098 0.000 0.426 0.095 0.000
Community pol icing, 2003 -0.050 0.245 0.682 -0.099 0.187 0.280 -0.003 0.150 0.964
Grants 0.073 0.177 0.534 0.066 0.134 0.450 0.006 0.119 0.937
Occupational di ff. 0.065 0.060 0.603 0.090 0.046 0.333 0.112 0.043 0.222
Functional di ff. 0.059 0.049 0.650 0.058 0.037 0.545 0.001 0.037 0.999
Formal ization 0.117 0.180 0.360 0.138 0.131 0.136 0.146 0.125 0.079
Decentra l ization 0.140 1.879 0.250 0.197 1.325 0.020 0.034 1.267 0.633
Size 0.079 0.241 0.600 0.145 0.175 0.181 0.082 0.170 0.393
Budget 0.106 0.555 0.405 0.046 0.395 0.610 0.168 0.312 0.065
Tenure -0.007 0.010 0.953 -0.010 0.008 0.905 -0.088 0.008 0.286
Felony case 0.055 0.196 0.644 0.070 0.145 0.442 -0.013 0.162 0.901
Felony succ. 0.172 1.577 0.172 0.091 1.155 0.302 0.133 1.089 0.146
SOVI 2000 -0.127 0.027 0.267 -0.166 0.021 0.063 -0.074 0.019 0.366
Mis . case 0.035 0.156 0.765 0.067 0.080 0.420
Mis . succ -0.115 1.529 0.392 -0.162 0.997 0.139
Adj. r2
0.33 Adj. r2
0.47 Adj. r2
0.39
Standardized regress ion coefficients for models predicting the community prosecution scores (2005), origina l , misdemeanor
variables omitted, and imputed datasets (large agency analys is )
Observed dataset (n =65)
Observed dataset, misd.
variables excluded (n =91)
Multiple imputed dataset
(n =160)1
1The model imputing miss ing variables included a l l i tems shown above as wel l as dichotomous indicators related to
jurisdiction(misdemeanors , misdemeanors with felonies , misdemeanor appeals , felony appeals , traffic violations , juveni le
matters , chi ld support enforcement, and civi l lawsuits ), problems recruiting s taff, problems retaining s taff, work-related threats ,
and securi ty (pol ice protection, bui lding guards , electronic survei l lance, metal detectors , electronic securi ty system). Al l of these
additional variables were complete in the 2001 NPS dataset so serve as useful additions to improve on the imputation.
This document is a research report submitted to the U.S. Department of Justice. This report has not been published by the Department. Opinions or points of view expressed are those of the author(s)
and do not necessarily reflect the official position or policies of the U.S. Department of Justice.

53
Table 10.
β Std. Err. p β Std. Err. p β Std. Err. p
Comm. Prosecution, 2001 0.513 0.123 0.000 0.487 0.100 0.000 0.463 0.098 0.000
Community pol icing, 2003 -0.024 0.303 0.835 -0.015 0.238 0.862 0.024 0.216 0.754
Grants 0.054 0.170 0.634 0.060 0.133 0.500 0.016 0.110 0.822
Occupational di ff. 0.073 0.056 0.535 0.130 0.044 0.147 0.097 0.042 0.272
Functional di ff. 0.063 0.048 0.624 0.066 0.037 0.496 0.028 0.037 0.736
Formal ization 0.093 0.177 0.462 0.106 0.132 0.252 0.130 0.121 0.105
Decentra l ization 0.126 1.840 0.288 0.182 1.339 0.033 0.052 1.318 0.475
Size 0.087 0.238 0.568 0.167 0.175 0.133 0.083 0.157 0.351
Budget 0.131 0.546 0.294 0.067 0.394 0.442 0.177 0.289 0.036
Tenure -0.007 0.010 0.949 -0.020 0.008 0.814 -0.062 0.008 0.464
Felony case 0.019 0.188 0.867 0.021 0.142 0.814 -0.024 0.134 0.756
Felony succ. 0.179 1.564 0.153 0.087 1.180 0.339 0.129 1.068 0.144
Mis . case 0.025 0.155 0.827 0.071 0.079 0.388
Mis . succ -0.107 1.522 0.425 -0.105 0.952 0.308
Adj. r2 0.34 Adj. r2 0.45 Adj. r2 0.40
Standardized regress ion coefficients for models predicting the community prosecution scores (2005), origina l , misdemeanor
variables omitted, and imputed datasets (pooled agency analys is )
Observed dataset (n =66)
Observed dataset, misd.
variables excluded (n =87)
Multiple imputed dataset
(n =160)1
1The model imputing miss ing variables included a l l i tems shown above as wel l as dichotomous indicators related to
jurisdiction(misdemeanors , misdemeanors with felonies , misdemeanor appeals , felony appeals , traffic violations , juveni le
matters , chi ld support enforcement, and civi l lawsuits ), problems recruiting s taff, problems retaining s taff, work-related threats ,
and securi ty (pol ice protection, bui lding guards , electronic survei l lance, metal detectors , electronic securi ty system). Al l of these
additional variables were complete in the 2001 NPS dataset so serve as useful additions to improve on the imputation.
This document is a research report submitted to the U.S. Department of Justice. This report has not been published by the Department. Opinions or points of view expressed are those of the author(s)
and do not necessarily reflect the official position or policies of the U.S. Department of Justice.

54
CHAPTER VI: CONCLUSIONS & DISCUSSION
REVIEW The project was centered on the question of whether recent community reforms in policing and
prosecution were related at the local level. Specifically, did adoption of community policing by law
enforcement agencies (those with 100 or more FT sworn officers) lead to the adoption of community
prosecution in county prosecutors’ offices? Using measurement model-derived implementation scores
from the Law Enforcement Management and Administrative Statistics Survey (police) and National
Prosecutors Survey (prosecutors), analyses assessed the influence of community policing and other
predictors. In spite of some prior evidence pointing to the similarities and even connections between
the two reforms, the larger sample research presented here found no significant linkages between
community policing and prosecution.
The analyses predicting community prosecution implementation in 2001 revealed a number of
generally consistent factors associated with reform: size, functional differentiation, formalization,
prosecutor tenure, and, to a lesser extent, grants. The findings are largely consistent with the work of
Cunningham, Renauer, and Khalifa (2006), one of the few studies to address community prosecution
implementation. Moreover, the results are generally consistent with broader research on the adoption
of innovation. Larger organizations typically have more resources, can more readily take on new
programs, strategies, and practices, and can more easily absorb failed innovations (Damanpour, 1987).
Prosecutors’ offices may be no different. Forst (2002) stressed that prosecutors are risk adverse but
larger organizations can make evolutionary (Burke, 2002) or incremental (Nadler & Tushman, 1995)
changes without dramatically altering day-to-day activities (see Meyer & Rowan, 1977).
Structural characteristics of the organization also work to facilitate or impede innovation. The
employment of specialists, especially within distinct units or departments, encourages innovation as
This document is a research report submitted to the U.S. Department of Justice. This report has not been published by the Department. Opinions or points of view expressed are those of the author(s)
and do not necessarily reflect the official position or policies of the U.S. Department of Justice.

55
expert employees offer diverse perspectives to the organization (Damanpour, 1991; King, 1998).
Although the functional differentiation measure does not explicitly capture organizational units, it does
suggest the workforce is diverse in its capacity to handle different types of cases. The effect of
formalization is a bit curious. The relationship found in the models is positive; written rules regarding
juveniles in criminal court is associated with greater community prosecution innovation. The literature
points to an inverse relationship between formalization and innovation; rules stifle new ideas (see
Damanpour, 1991). Two possibilities are offered here. The first possibility is that the measurement of
formalization is weak. It only captures one type of rule which may not be enough to truly gauge the
level of formalization in an organization.30 The second possibility is that organizational leaders
promulgate rules to control lower-level workers when authority is decentralized toward the bottom of
organizations (Cunningham, Renauer, & Khalifa, 2006). It is difficult explain the anomalous finding
absent the ability to examine models with a more robust measure of formalization.
Damanpour and Schneider (2009) argued that individual managerial decisions also affect the
adoption of innovations. They suggest that the relationship between managerial tenure and innovation
is curvilinear; innovations increase as managers become acquainted with the job but decline as their
work becomes more routine and entrenched. The linear relationship observed in the models in Chapter
V lend support to the view that newer prosecutors may be more apt to embrace new ideas and, as
noted earlier, more likely to move beyond a traditional felony case processor approach.
Interestingly, the effects of all of the independent variables generally disappeared in the 2005
analyses once prior community prosecution implementation was considered. Community prosecution
in 2005 is largely predicted by prior levels of implementation. Offices were not likely to substantially
implement or significantly abandon community prosecution during the 4 year period between NPS
waves. The absence of any other consistent effects is not due to multicollinearity; diagnostics showed
30In contrast, researchers have developed a measure of formalization for police organizations using 10 or more items from the LEMAS survey addressing written rules and procedures.
This document is a research report submitted to the U.S. Department of Justice. This report has not been published by the Department. Opinions or points of view expressed are those of the author(s)
and do not necessarily reflect the official position or policies of the U.S. Department of Justice.
56
no problems associated with the inclusion of the community prosecution 2001 variable. These findings
suggest that the primary determinants of community prosecution implementation are factors not
considered or that were primarily influential in the pre-2001 period (see below).
LIMITATIONS The current study only reaffirms some of the challenges in working with existing datasets, many of
which have already been noted by others (see Groves & Cork, 2009; Langworthy, 2002). For example,
Groves and Cork (2009) recommended efforts designed to “facilitate linkage in existing datasets” (p.
138). While not a limitation per se, merging datasets in the present study was hampered by unique
prosecutors’ office identifiers that changed across NPS administrations. The su_id variable is included in
NPS datasets as an 8-digit unique identification code.31 If the su_id variable were used to match 2001
and 2005 NPS data, erroneous matches would occur (e.g., Alabama’s 16th Judicial Circuit prosecutor
would match the Randall County, TX prosecutor—both have an ID number of 10000170). Yet, the
district number, a unique identification number that does in fact permit matches across waves, is never
mentioned as a unique identifier.
The project is also hampered by changes in measurement from one wave to the next. Although the
LEMAS dataset is more consistent across iterations, the problem is actually most pronounced for the
LEMAS-derived measurement models of community policing implementation where survey items were
added, omitted, or altered between waves. As such, the factors scores derived from 2000 and 2003
LEMAS data are based on slightly different indicators. Wilson (2006) was able to assess the stability of
the policing measurement model, concluding that the model held from 1997 to 1999 (i.e., coefficients
were largely unchanged). Given the slight changes in measurement, model invariance is assumed.
31 The 2001 NPS codebook refers to the variable as a “preloaded district su_id.”
This document is a research report submitted to the U.S. Department of Justice. This report has not been published by the Department. Opinions or points of view expressed are those of the author(s)
and do not necessarily reflect the official position or policies of the U.S. Department of Justice.

57
A more significant challenge was the volume of missing cases in the analyses. The NPS, in spite of
survey response rates in excess of 90 percent each wave, deals with a substantial number of item non-
response issues. For example, 275 of the 307 prosecutors’ officers participating in the 2005 NPS noted
responsibility for handling misdemeanor cases. When asked about the number of case closures in the
past year, only 250 answered; 25 respondents should have provided an estimate or entered none but,
instead, left the response missing. Similar challenges are evident elsewhere in the survey. In BJS
reports, the hot deck method is used to fill in these missing values (a process of sorting to find similar
prosecutors’ offices and then imputing the value from that similar office). In the present study, multiple
imputation was used to address the missing values issue. The procedure estimates the missing data
using known data; estimates are produced by averaging across multiple imputations. Though useful, it is
important to recognize that data are still imputed rather than directly observed from respondents.
Some of the independent variables were also not ideally measured, a result of dataset limitations.
For example, the formalization measure includes a single indicator of the rule-bound nature of the
prosecutor’s office—the presence of guidelines for handling juveniles in criminal court. It says nothing
about other areas of the organization that may or may not be guided by rules (e.g., no drop policies for
intimate partner violence). Similarly, the functional differentiation measure addresses specialized
caseloads but does not directly measure how the organization handles the caseload. In other words, are
special units devoted to handling hate crimes, domestic violence, elder abuse, and other types of
offenses? If so, the organization is structurally differentiated along horizontal (functional) lines. If not,
individual prosecutors are handling the caseloads but, again, the data do not permit an understanding of
whether individual prosecutors are exclusively handling certain types of cases (indicative of
specialization).
Temporal ordering and timing, more generally, is also a concern. The independent and dependent
variables (the SoVI and community policing implementation variables excepted) are measured
This document is a research report submitted to the U.S. Department of Justice. This report has not been published by the Department. Opinions or points of view expressed are those of the author(s)
and do not necessarily reflect the official position or policies of the U.S. Department of Justice.
58
contemporaneously in the 2001 analyses. As such, it is impossible to know whether community
prosecution reforms preceded or followed the independent variables. Consider functional
differentiation. Does a differentiated organization encourage innovation? Alternatively, does an
innovative organization that adopts community prosecution create a special unit to handle the task?
Maguire (1997) found that police departments became more functionally differentiated during a period
of heightened community policing implementation. It is possible that organizations added a unit to deal
exclusively with community matters. The temporal ordering problem was addressed in the 2005
analyses. All independent variables were measured prior to the 2005 community prosecution
implementation measure.
DISCUSSION
The results illustrate very little congruence between police and prosecutors in the adoption of
community reforms. In jurisdictions where police departments embraced community policing,
prosecutors differentially implemented community prosecution? Why are the two organizations
disconnected? It is clear that they are only loosely coupled (Hagan, 1989). Indeed, they both operate in
separate institutional environments (DiMaggio & Powell, 1983; Meyer & Rowan, 1977). Police are highly
visible to outsiders, including citizens. They faced a legitimacy crisis in the 1960s and 1970s as a result of
clashes with the public, rising crime, criticisms from national commissions, and research findings
questioning the efficacy of police tactics (Crank, 1994; Worrall, 2008). Community policing was a way to
restore that legitimacy, to reestablish connections with the public. Prosecutors never faced the same
legitimacy crisis; “they were not compelled to ‘change their ways’ just to appease the public” (Worrall,
2008, p. 14). Their work is largely invisible to the everyday citizen. Even when prosecutors attend
community meetings as part of a community prosecution philosophy, they likely find themselves
interacting with a very small percentage of a neighborhood’s residents (Duffee, et al., 2001; Skogan &
This document is a research report submitted to the U.S. Department of Justice. This report has not been published by the Department. Opinions or points of view expressed are those of the author(s)
and do not necessarily reflect the official position or policies of the U.S. Department of Justice.
59
Hartnett, 1997). Consequently, the local forces that compelled change in policing may lack salience for
the nearby prosecutor.
Community policing implementation was also promoted by the wider institutional environment
(Burruss & Giblin, 2014; see, also, Burruss, Giblin, & Schafer, 2010). Community policing achieved a
status as the appropriate activity of law enforcement agencies. Conferences promoted the philosophy
(COPS conference; Problem-Oriented Policing Conference), funding agencies facilitated adoption, and
countless publications and research studies addressed the topic. A police chief, if intent on improving
his/her organization, need only look around to see that viability of community policing and the attention
it was receiving.
Community prosecution was also promoted by the wider environment but we know every little
about how the institutional environment effects organizations outside of policing (e.g., prosecutors’
offices, prisons). The key point, however, was the fact that it was not the same institutional
environment. For example, the federal government offered funding to support community prosecution
via the Byrne program (e.g., juvenile block grants) but the program provided support for much more
than just innovative prosecutorial programs (unlike the mission of the COPS office). Similarly, national
conferences were held and articles and books were published (albeit, much more limited in scope
compared to community policing). It is clear that these institutional networks are relevant to police
organizations (see Burruss & Giblin, 2014; Burruss, Giblin, & Schafer, 2010), but research has not
addressed whether prosecutors are affected by broader forces in their field. Additionally, there is no
reason to believe that a police chief and prosecutor would be simultaneously plugged into their
respective institutional networks simply by virtue of their geographic proximity to one another. That is,
other factors must matter.
The evidence points to the importance of leadership. Certain chief prosecutors—those in office for
fewer years—are more likely to implement community prosecution. In other words, characteristics of
This document is a research report submitted to the U.S. Department of Justice. This report has not been published by the Department. Opinions or points of view expressed are those of the author(s)
and do not necessarily reflect the official position or policies of the U.S. Department of Justice.

60
an organization’s executive can mitigate the effects of both organizational factors and institutional
forces. Forst (2000) illustrates this fact in his discussion of two similar counties in the mid-Atlantic
region: Montgomery County, MD and Fairfax County, VA. The Montgomery County prosecutor
developed an extensive community prosecution program in 1991 (Jacoby, Gramckow, & Ratledge,
1995). In contrast, the prosecutor in Fairfax County, like the chief prosecutor in Pima County, AZ,
adhered to a focus on traditional criminal prosecution. According to Forst (2000), “he [saw] community
prosecution as largely a fad” (p. 530). Prosecutors, unlike police, may actually have an easier time
ignoring community reforms; after all, as elected officials they are already accountable to the public in
ways that the police are not. Why the variation? The present study focused on organization-level
attributes but, clearly, leadership matters. The case study research indicates that individual prosecutors
may have their own perceptions of community prosecution and it is these perceptions that may affect
implementation. Indeed, individual perceptions might interact with connections to the broader
institutional environment, as noted above. Does a leader see value—actual (effect on crime/disorder)
or perceived (improved community relations/funding)—from its adoption? This is an important
empirical question that applies not just in the context of community prosecution innovation but all
innovation adoption (e.g., homeland security preparedness, Compstat, etc.).
Based on the evidence presented here, prosecutors are unlikely to innovate based on the practices
of local police.32 How can they be encouraged to adopt new practices, especially given the tendency for
routine (Forst, 2000)? Future research should address the salience of the institutional environment for
prosecutors. Evidence from policing suggests that conferences, professional networks, and publications
matter in shaping police practices, more so than considerations related to crime rates or other work-
related demands. Are prosecutors similarly influenced? That is an empirical question. More
32 The relationship does not just apply to policing either. As shown in a brief analysis presented in Appendix E, police homeland security preparedness in 2003 is not associated with prosecutorial preparedness activities in 2005.
This document is a research report submitted to the U.S. Department of Justice. This report has not been published by the Department. Opinions or points of view expressed are those of the author(s)
and do not necessarily reflect the official position or policies of the U.S. Department of Justice.

61
importantly, reform efforts must start with leadership. Chief prosecutors, as shown here and in prior
literature, make a difference when it comes to innovation. Their resistance is enough to stifle change
efforts. They must see the benefits of innovation and the absence of any risk (Forst, 2000).
This document is a research report submitted to the U.S. Department of Justice. This report has not been published by the Department. Opinions or points of view expressed are those of the author(s)
and do not necessarily reflect the official position or policies of the U.S. Department of Justice.

62
REFERENCES
Anderson, D. C. (1997). Public defenders in the neighborhood: A Harlem law office stresses teamwork, early investigation. Washington, D.C.: U.S. Department of Justice National Institute of Justice.
Anderson, J. C., & Gerbing, D. W. (1988). Structural equation modeling in practice: A review and
recommended two-step approach. Psychological Bulletin, 103, 411–423. Baumer, E. P., Messner, S. F., & Felson, R. B. (2000). The role of victim characteristics in the disposition
of murder cases. Justice Quarterly, 17(2), 281–307. Bayley, D. H. (1994). Police for the future. New York, NY: Oxford University Press. Berman, G., & Fox, A. (2010). Trial and error in criminal justice reform: Learning from failure.
Washington, D.C.: Urban Institute Press. Bernard, T. J., Paoline, E. A., & Pare, P. (2005). General systems theory and criminal justice. Journal of
Criminal Justice, 33(3), 203–211. Boland, B. (2001). Community prosecution in Washington, D.C.: The U.S. Attorney’s Fifth District pilot
project. Washington, D.C.: U.S. Department of Justice, National Institute of Justice. Boland, B. (1996). What is community prosecution? National Institute of Justice Journal, (231), 35–40. Boland, B. (1998). The Manhattan experiment: Community prosecution. In Crime and place: Plenary
papers of the 1997 Conference on Criminal Justice Research and Evaluation (pp. 51–68). Washington, D.C.: U.S. Department of Justice, National Institute of Justice.
Burke, W. W. (2002). Organizational change: Theory and practice. Thousand Oaks, CA: Sage. Burruss, G. W., & Giblin, M. J. (2014). Modeling isomorphism on policing innovation: The role of
institutional pressures in adopting community-oriented policing. Crime and Delinquency, 60, 331-355.
Burruss, G. W., Giblin, M. J., & Schafer, J. A. (2010). Threatened globally, acting locally: Modeling law
enforcement homeland security practices. Justice Quarterly, 27(1), 77–101. Campbell, J. S., Sahid, J. R., & Stang, D. P. (1970). Law and order reconsidered. New York, NY: Praeger. Chamard, S. (2004). Adoption of computerized crime mapping by municipal police departments in New
Jersey. Security Journal, 17(1), 51–59. Coles, C. (2002). Community prosecution: District attorneys, county prosecutors, and attorneys general.
Cambridge, MA: John F. Kennedy School of Government, Harvard University. Coles, C. M. (2000). Community prosecution, problem solving, and public accountability: The evolving
strategy of the American prosecutor (Working Paper No. 00-02-04). Cambridge, MA: Harvard University, John F. Kennedy School of Government.
This document is a research report submitted to the U.S. Department of Justice. This report has not been published by the Department. Opinions or points of view expressed are those of the author(s)
and do not necessarily reflect the official position or policies of the U.S. Department of Justice.

63
Coles, C. M. (2008). Evolving strategies in 20th-century American prosecution. In J. L. Worrall & M. E.
Nugent-Borakove (Eds.), The changing role of the American prosecutor (pp. 177–209). Albany, NY: SUNY Press.
Coles, C. M., & Kelling, G. L. (1999). Prevention through community prosecution. Public Interest, (136), 69–84.
Coles, C. M., Kelling, G. L., & Moore, M. H. (1998). Prosecution in the community: A study of emergent
strategies: A cross site analysis. Cambridge, MA: John F. Kennedy School of Government, Harvard University.
Cordner, G. W. (2000). Community policing: Elements and effects. In G. P. Alpert & A. R. Piquero (Eds.),
Community policing: Contemporary readings (2nd ed., pp. 45–62). Prospect Heights, IL: Waveland. Crank, J. P. (1994). Watchman and Community: Myth and Institutionalization in Policing. Law & Society
Review, 28(2), 325–351. Cunningham, W. S., Renauer, B. C., & Khalifa, C. (2006). Sharing the keys to the courthouse: Adoption of
community prosecution by state court prosecutors. Journal of Contemporary Criminal Justice, 22(3), 202–219.
Damanpour, F. (1987). The adoption of technological, administrative, and ancillary innovations: Impact
of organizational factors. Journal of Management, 13(4), 675 –688. Damanpour, F. (1991). Organizational innovation: A meta-analysis of effects of determinants and
moderators. The Academy of Management Journal, 34(3), 555–590. DeFrances, C. J. (2002). Prosecutors in state courts, 2001. Washington, D.C.: U.S. Department of Justice,
Bureau of Justice Statistics. DeFrances, C. J., Smith, S. K., & van der Does, L. (1996). Prosecutors in state courts, 1994. Washington,
D.C.: U.S. Department of Justice, Bureau of Justice Statistics. DeFrances, C. J., & Steadman, G. W. (1998). Prosecutors in state courts, 1996. Washington, D.C.: U.S.
Department of Justice. DiMaggio, P. J., & Powell, W. W. (1983). The iron cage revisited: Institutional isomorphism and collective
rationality in organizational fields. American Sociological Review, 48(2), 147–160. Duffee, D. E., Renauer, B. C., Scott, J. D., Chermak, S., & McGarrell, E. F. (2001). Community building
measures: How police and neighborhood groups can measure their collaboration. Washington, D.C.: U.S. Department of Justice, National Institute of Justice.
Eck, J. E., & Rosenbaum, D. P. (1994). The new police order: Effectiveness, equity, and efficiency in
community policing. In D. P. Rosenbaum (Ed.), The challenge of community policing: Testing the promises (pp. 3–26). London: Sage Publications.
This document is a research report submitted to the U.S. Department of Justice. This report has not been published by the Department. Opinions or points of view expressed are those of the author(s)
and do not necessarily reflect the official position or policies of the U.S. Department of Justice.

64
Edwards, J. R., & Bagozzi, R. P. (2000). On the nature and direction of relationships between constructs and measures. Psychological Methods, 5(2), 155–174.
Finn, P., & Newlyn, A. K. (1993). Miami’s “drug court”: A different approach. Washington, D.C.: U.S.
Department of Justice, National Institute of Justice. Forst, B. (2002). Prosecution. In J. Q. Wilson & J. Petersilia (Eds.), Crime: Public policies for crime control
(pp. 509–536). Oakland, CA: ICS Press. Fox, A., & Gold, E. (Eds.). (2010). Daring to fail: First-person stories of criminal justice reform. New York,
NY: Center for Court Innovation. Gau, J. M. (2010). Basic principles and practices of structural equation modeling in criminal justice and
criminology research. Journal of Criminal Justice Education, 21, 136–151. Giblin, M. J. (2006). Structural elaboration and institutional isomorphism: the case of crime analysis
units. Policing: An International Journal of Police Strategies and Management, 29(4), 643–664. Giblin, M. J., Burruss, G. W., & Schafer, J. A. (2014). A stone’s throw from the metropolis: Re-examining
small-agency homeland security practices. Justice Quarterly, 368-393. Goldkamp, J. S., Irons-Guynn, C., & Weiland, D. (2003). Community prosecution strategies. Washington,
D.C.: U.S. Department of Justice, Bureau of Justice Assistance. Goldstein, H. (1979). Improving policing: A problem-oriented approach. Crime & Delinquency, 25(2), 236
–258. Goldstock, R. (1992). The prosecutor as problem-solver: Leading and coordinating anticrime efforts.
Criminal Justice, 7(3), 3–9, 48–49. Gray, K. B. (2008). Community prosecution: After two decades, still new frontiers. Journal of the Legal
Profession, 32, 199–214. Groves, R. M., & Cork, D. L. (2009). Ensuring the quality, credibility, and relevance of U.S. justice
statistics. Washington, D.C.: National Academies Press. Hagan, J. (1989). Why is there so little criminal justice theory? Neglected macro- and micro-level links
between organization and power. Journal of Research in Crime and Delinquency, 26(2), 116–135. Hazards & Vulnerability Research Institute. (2012). Social vulnerability index. Retrieved from
http://webra.cas.sc.edu/hvri/products/sovi.aspx Hickman, M. J., & Reaves, B. A. (2001). Community policing in local police departments, 1997 and 1999.
Washington, D.C.: U.S. Department of Justice, Bureau of Justice Statistics. Hoelter, J. W. (1983). The analysis of covariance structures. Sociological Methods & Research, 11(3), 325-
344.
This document is a research report submitted to the U.S. Department of Justice. This report has not been published by the Department. Opinions or points of view expressed are those of the author(s)
and do not necessarily reflect the official position or policies of the U.S. Department of Justice.

65
Hu, L., & Bentler, P. M. (1999). Cutoff criteria for fit indexes in covariance structure analysis: Conventional criteria versus new alternatives. Structural Equation Modeling: A Multidisciplinary Journal, 6, 1–55.
Jacoby, J. E., Gramckow, H. P., & Ratledge, E. C. (1995). The impact of community policing on the criminal
justice system. Silver Spring, MD: Jefferson Institute for Justice Studies. Karp, D. R., & Clear, T. R. (2000). Community justice: A conceptual framework. In C. M. Friel (Ed.),
Criminal Justice 2000 (Vol. 2, pp. 323–368). Washington, D.C.: U.S. Department of Justice, National Institute of Justice.
King, R. D., Messner, S. F., & Baller, R. D. (2009). Contemporary hate crimes, law enforcement, and the
legacy of racial violence. American Sociological Review, 74(2), 291–315. King, W. R. (1998). Innovativeness in American municipal police organizations. Dissertation Abstracts
International. King, W. R. (2000). Measuring police innovation: Issues and measurement. Policing: An International
Journal of Police Strategies and Management, 23(3), 303–317. Kuykendall, M. R. (2004). From the courtroom to the community: Ethics and liability issues for the
community prosecutor. Alexandria, VA: American Prosecutors Research Institute. Langworthy, R. H. (2002). LEMAS: A comparative organizational research platform. Justice Research and
Policy, 4, 21–38. MacDonald, J. M. (2002). The effectiveness of community policing in reducing urban violence. Crime and
Delinquency, 48(4), 592–618. Maguire, E. R. (1997). Structural change in large municipal police organizations during the community
policing era. Justice Quarterly, 14(3), 547–576. Maguire, E. R. (2009). Police organizational structure and child sexual abuse case attrition. Policing: An
International Journal of Police Strategies & Management, 32(1), 157–179. Maguire, E. R., Kuhns, J. B., Uchida, C. D., & Cox, S. M. (1997). Patterns of Community Policing in
Nonurban America. Journal of Research in Crime and Delinquency, 34(3), 368–394. Marsh, H. W., & Hau, K. (1996). Assessing goodness of fit: Is parsimony always desirable? Journal of
Experimental Education, 64, 364–390. Meyer, J. W., & Rowan, B. (1977). Institutionalized organizations: Formal structure as myth and
ceremony. American Journal of Sociology, 83(2), 340–363. Miethe, T. D. (1987). Charging and plea bargaining practices under determinate sentencing: An
investigation of the hydraulic displacement of discretion. Journal of Criminal Law and Criminology, 78, 155–176.
This document is a research report submitted to the U.S. Department of Justice. This report has not been published by the Department. Opinions or points of view expressed are those of the author(s)
and do not necessarily reflect the official position or policies of the U.S. Department of Justice.

66
Morabito, M. S. (2010). Understanding community policing as an innovation: Patterns of adoption. Crime and Delinquency, 56(4), 564–587.
Nadler, D. A., & Tushman, M. L. (1995). Types of organizational change: From incremental improvement
to discontinuous transformation. In D. A. Nadler, R. B. Shaw, & A. E. Walton (Eds.), Discontinuous change: Leading organizational transformation (pp. 15–34). San Francisco, CA: Jossey-Bass.
Nugent, M. E. (2004). What does it mean to practice community prosecution? Organizational, functional,
and philosophical changes. Alexandria, VA: American Prosecutors Research Institute. Nugent, M. E., Fanflik, P. L., & Bromirski, D. (2004). The changing nature of prosecution: Community
prosecution vs. traditional prosecution approaches. Alexandria, VA: American Prosecutors Research Institute.
Nugent-Borakove, M. E., & Fanflik, P. L. (2008). Community prosecution: Rhetoric or reality? In J. L.
Worrall & M. E. Nugent-Borakove (Eds.), The changing role of the American prosecutor (pp. 211–230). Albany, NY: SUNY Press.
Oliver, W. M. (2000). The third generation of community policing: Moving through innovation, diffusion,
and institutionalization. Police Quarterly, 3(4), 367–388. Oliver, W. M. (2006). The fourth era of policing: Homeland security. International Review of Law,
Computers, and Technology, 20(1-2), 49–62. Osborne, D., & Gaebler, T. (1992). Reinventing government: How the entrepreneurial spirit is
transforming the public sector. Reading, MA: Addison-Wesley Publishing Co. Pelfrey, W. V. (2000). Precipitating factors of paradigmatic shift in policing: The origin of the community
policing era. In G. P. Alpert & A. R. Piquero (Eds.), Community policing: Contemporary readings (2nd ed., pp. 79–92). Prospect Heights, IL: Waveland Press.
Perry, S. W. (2006). Prosecutors in state courts, 2005. Washington, D.C.: U.S. Department of Justice,
Bureau of Justice Statistics. Perry, S. W., Malega, R., & Banks, D. (2011). State prosecutors’ offices with jurisdiction in Indian country,
2007. Washington, D.C.: U.S. Department of Justice, Bureau of Justice Statistics. Pfeffer, J., & Salancik, G. R. (1978). The external control of organizations: A resource dependence
perspective. New York: Harper and Row. President’s Commission on Law Enforcement and the Administration of Justice. (1968). The challenge of
crime in a free society. New York, NY: E.P. Dutton. Rainville, G., & Nugent, M. E. (2002). Community prosecution tenets and practices: The relative mix of
“community” and “prosecution.” American Journal of Criminal Justice, 26(2), 149–164. Randol, B. M. (2012). The organizational correlates of terrorism response preparedness in local police
departments. Criminal Justice Policy Review, 23(3), 304–326.
This document is a research report submitted to the U.S. Department of Justice. This report has not been published by the Department. Opinions or points of view expressed are those of the author(s)
and do not necessarily reflect the official position or policies of the U.S. Department of Justice.

67
Rasmusen, E., Raghav, M., & Ramseyer, M. (2009). Convictions versus conviction rates: The prosecutor’s
choice. American Law and Economics Review, 11(1), 47–78. Reaves, B. A. (2010). Local police departments, 2007. Washington, D.C.: U.S. Department of Justice,
Bureau of Justice Statistics. Rubin, D. B. (1987). Multiple imputation for nonresponse in surveys. New York, NY: John Wiley & Sons. Schumacker, R. E., & Lomax, R. G. (2010). A beginner’s guide to structural equation modeling (3rd ed.).
New York, NY: Routledge. Skogan, W., & Frydl, K. (Eds.). (2004). Fairness and effectiveness in policing: The evidence. Washington,
D.C.: National Academies Press. Skogan, W. G. (2006). The promise of community policing. In D. Weisburd & A. A. Braga (Eds.), Police
innovation: Contrasting perspectives (pp. 27–43). New York, NY: Cambridge University Press. Skogan, W. G., & Hartnett, S. M. (1997). Community policing, Chicago style. New York, NY: Oxford
University Press. Skogan, W. G., & Hartnett, S. M. (2005). The diffusion of information technology in policing. Police
Practice and Research: An International Journal, 6(5), 401–417. Spohn, C. C. (2002). How do judges decide? The search for fairness and justice in punishment. Thousand
Oaks, CA: Sage. Trojanowicz, R. (1990). Community policing: A contemporary perspective. Cincinnati, OH: Anderson. U.S. Department of Justice, Bureau of Justice Statistics. (2006). Law enforcement management and
administrative statistics (LEMAS), 2003 [Data file] (No. ICPSR 4411). Ann Arbor, MI: Inter-university Consortium for Political and Social Research.
U.S. Department of Justice, Bureau of Justice Statistics. (2008). Law enforcement management and
administrative statistics (LEMAS), 2000 [Data file] (No. ICPSR 3565). Ann Arbor, MI: Inter-university Consortium for Political and Social Research.
U.S. Department of Justice, Bureau of Justice Statistics. (2012). National prosecutors survey (census),
2007 [Data file] (No. ICPSR 33202). Ann Arbor, MI: Inter-university Consortium for Political and Social Research.
Walker, S. (1992). Origins of the contemporary criminal justice paradigm: The American Bar Foundation
Survey, 1953-1969. Justice Quarterly, 9, 47–76. Walker, S. (1998). Sense and nonsense about crime and drugs (4th ed.). New York, NY:
West/Wadsworth. Weinstein, S. P. (1998). Community prosecution: Community policing’s legal partner. FBI Law
Enforcement Bulletin, 67(4), 19–25.
This document is a research report submitted to the U.S. Department of Justice. This report has not been published by the Department. Opinions or points of view expressed are those of the author(s)
and do not necessarily reflect the official position or policies of the U.S. Department of Justice.
68
Weisburd, D., & Braga, A. A. (Eds.). (2006). Police innovation: Contrasting perspectives. New York, NY:
Cambridge University Press. Weisburd, D., & Lum, C. (2005). The diffusion of computerized crime mapping in policing: Linking
research and practice. Police Practice and Research, 6(5), 419–434. Wilson, J. M. (2005). Determinants of community policing: An open systems model of implementation.
Washington, D.C.: U.S. Department of Justice, National Institute of Justice. Wilson, J. M. (2006). Community policing in America. New York, NY: Routledge. Wilson, J. Q., & Kelling, G. L. (1982). Broken windows: The police and neighborhood safety. The Atlantic
Monthly, 249(3), 29–38. Wolf, R. V., & Worrall, J. L. (2004). Lessons from the field: Ten community prosecution leadership profiles.
Alexandria, VA: American Prosecutors Research Institute. Worrall, J. L. (1998). Administrative determinants of civil liability lawsuits against municipal police
departments: An exploratory analysis. Crime Delinquency, 44(2), 295–313. Worrall, J. L. (2008). Prosecution in America: A historical and comparative account. In J. L. Worrall & M.
E. Nugent-Borakove (Eds.), The changing role of the American prosecutor (pp. 3–27). Albany, NY: SUNY Press.
Worrall, J. L., & Zhao, J. (2003). The role of the COPS Office in community policing. Policing: An
International Journal of Police Strategies & Management, 26(1), 64–87. Zhao, J. (1996). Why police organizations change: A study of community-oriented policing. Washington,
D.C.: Police Executive Research Forum. Zhao, J., Lovrich, N. P., & Robinson, T. H. (2001). Community policing: Is it changing the basic functions of
policing? Findings from a longitudinal study of 200+ municipal police agencies. Journal of Criminal Justice, 29(5), 365–377.
This document is a research report submitted to the U.S. Department of Justice. This report has not been published by the Department. Opinions or points of view expressed are those of the author(s)
and do not necessarily reflect the official position or policies of the U.S. Department of Justice.

69
APPENDIX A: MATCHING NOTES
2001 COMMUNITY PROSECUTION ANALYSIS: LEMAS 2000-NPS 2001 MERGE
LEMAS large municipal, county, sheriff n = 803
NPS n= 2,341
Matched pairs after merge: 792 LEMAS agencies with corresponding NPS office.
LEMAS AGENCY ID AGENCY NAME REASON FOR EXCLUSION
0220020010260100 Anchorage Police Dept. NPS 2001 only reports statewide totals for AK.
0110370370270300 Jefferson County (AL) Sheriff
NPS 2001 reports two separate prosecutors’ offices for Jefferson County (AL).
0120378010260100 Hoover Police Department
NPS 2001 reports two separate prosecutors’ offices for Jefferson County (AL).
0810020020240200 New Castle County (DE)
Police Department
NPS 2001 only reports statewide totals for DE.
0820020090260100 Wilmington Police (DE)
Dept.
NPS 2001 only reports statewide totals for DE.
4020020010260100 Warwick Police Dept. NPS 2001 only reports statewide totals for RI.
4020040020260100 Cranston Police Dept. NPS 2001 only reports statewide totals for RI.
4020040030260100 Pawtucket Police Dept. NPS 2001 only reports statewide totals for RI.
4020040040260100 Providence Police Dept. NPS 2001 only reports statewide totals for RI.
0700000000201800 New Haven County
Sheriff’s Department
CT judicial districts do not perfectly correspond to
county jurisdictional boundaries.
4422260010250100 San Angelo Police
Department
NPS 2001 reports two separate prosecutors’ offices
for Tom Green County (TX).
LEMAS AGENCY ID AGENCY NAME REASON FOR MANUAL (NON-FIPS) MATCH
120370020250100 Bessemer Police
Department
Jefferson County (AL) is served by two separate
prosecutors’ offices. Alabama Administrative
Office of Courts states that Bessemer cases are
filed in the AL 10th Judicial Circuit-Bessemer
Division (NPS 2001 10000110).
This document is a research report submitted to the U.S. Department of Justice. This report has not been published by the Department. Opinions or points of view expressed are those of the author(s)
and do not necessarily reflect the official position or policies of the U.S. Department of Justice.

70
120370030250100 Birmingham Police
Department
Jefferson County (AL) is served by two separate
prosecutors’ offices. Alabama Administrative
Office of Courts states that Birmingham cases are
filed in the AL 10th Judicial Circuit-Birmingham
Division (NPS 2001 10000100).
720010010260100 Bridgeport Police
Department
Matches to Fairfield Judicial District (NPS 2001
10001800)
720010020260100 Danbury Police
Department
Matches to Danbury Judicial District (NPS 2001
10001790)
720010040260100 Norwalk Police
Department
Matches to Stamford/Norwalk Judicial District (NPS
2001 10001870)
720010060260100 Stamford Police
Department
Matches to Stamford/Norwalk Judicial District (NPS
2001 10001870)
720020010260100 Bristol Police
Department
Matches to New Britain Judicial District (NPS 2001
10001840)
720020020260100 Hartford Police
Department
Matches to Hartford Judicial District (NPS 2001
10001810)
720020030260100 New Britain Police
Department
Matches to New Britain Judicial District (NPS 2001
10001840)
720040020260100 Middletown Police
Department
Matches to Middlesex Judicial District (NPS 2001
10001830)
720050040260100 Meriden Police
Department
Matches to New Haven Judicial District (NPS 2001
10001850)
720050060260100 New Haven Police
Department
Matches to New Haven Judicial District (NPS 2001
10001850)
720050080260100 Waterbury Police
Department
Matches to Waterbury Judicial District (NPS 2001
10001890)
720055010260100 Milford Police
Department
Matches to Ansonia-Milford Judicial District (NPS
2001 10001780)
720055020260100 West Haven Police
Department
Matches to Ansonia-Milford Judicial District (NPS
2001 10001780)
This document is a research report submitted to the U.S. Department of Justice. This report has not been published by the Department. Opinions or points of view expressed are those of the author(s)
and do not necessarily reflect the official position or policies of the U.S. Department of Justice.

71
730010060260100 Fairfield Police
Department
Matches to Fairfield Judicial District (NPS 2001
10001800)
730010070260100 Greenwich Police
Department
Matches to Stamford/Norwalk Judicial District (NPS
2001 10001870)
730010150260100 Stratford Police
Department
Matches to Fairfield Judicial District (NPS 2001
10001800)
730020070260100 East Hartford Police
Department
Matches to Hartford Judicial District (NPS 2001
10001810)
730020140260100 Manchester Police
Department
Matches to Hartford Judicial District (NPS 2001
10001810)
730020230260100 West Hartford Police
Department
Matches to Hartford Judicial District (NPS 2001
10001810)
730050070260100 Hamden Police
Department
Matches to New Haven Judicial District (NPS 2001
10001850)
This document is a research report submitted to the U.S. Department of Justice. This report has not been published by the Department. Opinions or points of view expressed are those of the author(s)
and do not necessarily reflect the official position or policies of the U.S. Department of Justice.

72
2005 COMMUNITY PROSECUTION ANALYSIS: NPS 2001-LEMAS 2003-NPS 2005 MERGE
LEMAS 2003 large municipal, county, sheriff n = 822
NPS 2005 n= 307
NPS 2001 n= 2,341
Matched pairs after merge: 481 LEMAS agencies with corresponding NPS office.
LEMAS AGENCY ID AGENCY NAME REASON FOR EXCLUSION
0220020010260100 Anchorage Police Dept. NPS 2005 only reports statewide totals for AK.
120370020250100 Bessemer Police Department
NPS reports two separate prosecutors’ offices for Jefferson County (AL). 10th Judicial Circuit- Bessemer Division was not part of NPS 2005.
0120378010260100 Hoover Police Dept. NPS reports two separate prosecutors’ offices for Jefferson County (AL).
0110370370270300 Jefferson County (AL) Sheriff
NPS reports two separate prosecutors’ offices for Jefferson County (AL).
0810020020240200 New Castle County (DE)
Police Department
NPS 2005 only reports statewide totals for DE.
0820020090260100 Wilmington Police (DE)
Dept.
NPS 2005 only reports statewide totals for DE.
4020020010260100 Warwick Police Dept. NPS 2005 only reports statewide totals for RI.
4020040020260100 Cranston Police Dept. NPS 2005 only reports statewide totals for RI.
4020040030260100 Pawtucket Police Dept. NPS 2005 only reports statewide totals for RI.
4020040040260100 Providence Police Dept. NPS 2005 only reports statewide totals for RI.
0720020010260100 Bristol Police Dept. FIPS code would match agency to Harford Judicial
District. CT judicial district do not correspond to
counties. City belongs in New Britain Judicial
District (not part of NPS 2005).
0720020030260100 New Britain Police
Dept.
FIPS code would match agency to Harford Judicial
District. CT judicial district do not correspond to
counties. City belongs in New Britain Judicial
District.
0720050080260100 Waterbury Police Dept. FIPS code would match agency to Harford Judicial
This document is a research report submitted to the U.S. Department of Justice. This report has not been published by the Department. Opinions or points of view expressed are those of the author(s)
and do not necessarily reflect the official position or policies of the U.S. Department of Justice.
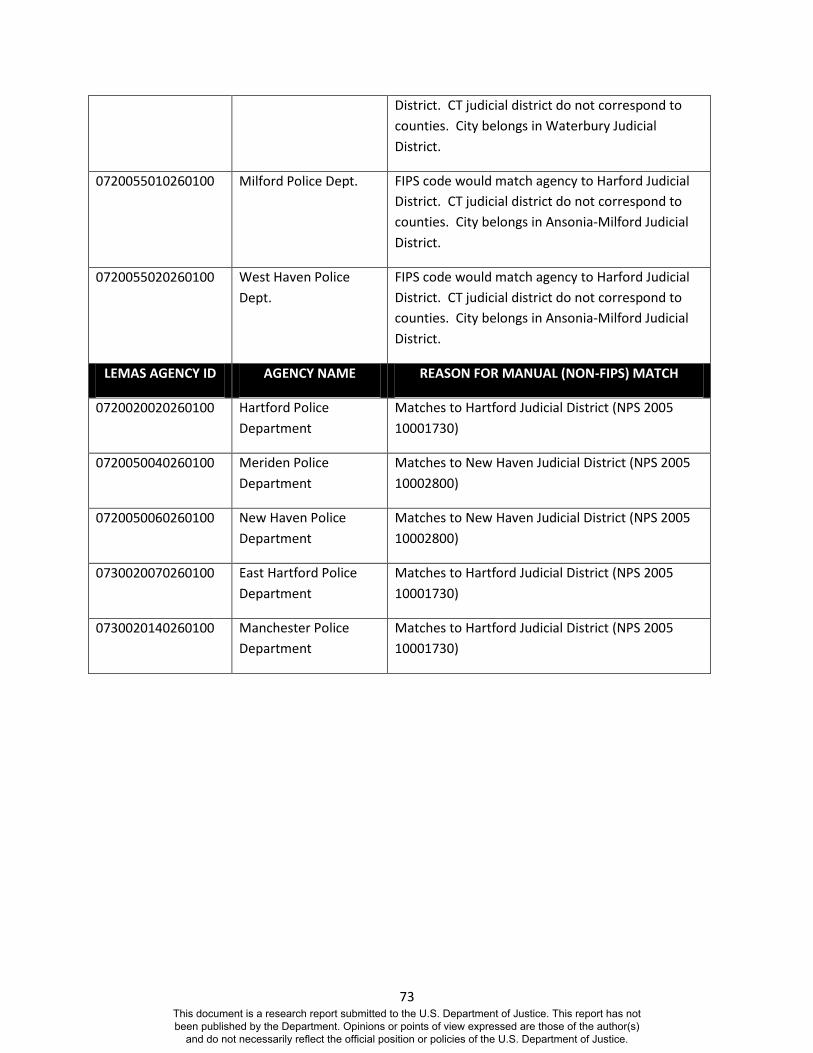
73
District. CT judicial district do not correspond to
counties. City belongs in Waterbury Judicial
District.
0720055010260100 Milford Police Dept. FIPS code would match agency to Harford Judicial
District. CT judicial district do not correspond to
counties. City belongs in Ansonia-Milford Judicial
District.
0720055020260100 West Haven Police
Dept.
FIPS code would match agency to Harford Judicial
District. CT judicial district do not correspond to
counties. City belongs in Ansonia-Milford Judicial
District.
LEMAS AGENCY ID AGENCY NAME REASON FOR MANUAL (NON-FIPS) MATCH
0720020020260100 Hartford Police
Department
Matches to Hartford Judicial District (NPS 2005
10001730)
0720050040260100 Meriden Police
Department
Matches to New Haven Judicial District (NPS 2005
10002800)
0720050060260100 New Haven Police
Department
Matches to New Haven Judicial District (NPS 2005
10002800)
0730020070260100 East Hartford Police
Department
Matches to Hartford Judicial District (NPS 2005
10001730)
0730020140260100 Manchester Police
Department
Matches to Hartford Judicial District (NPS 2005
10001730)
This document is a research report submitted to the U.S. Department of Justice. This report has not been published by the Department. Opinions or points of view expressed are those of the author(s)
and do not necessarily reflect the official position or policies of the U.S. Department of Justice.

74
APPENDIX B: CONNECTICUT TOWNS AND JUDICIAL DISTRICTS
CITY/TOWN JUDICIAL DISTRICT
Middletown Middlesex
Bridgeport Fairfield
Stratford Fairfield
Fairfield Fairfield
New Haven New Haven
Meriden New Haven
Hamden New Haven
West Hartford Hartford
Hartford Hartford
East Hartford Hartford
Manchester Hartford
Waterbury Waterbury
Norwalk Stamford-Norwalk
Stamford Stamford-Norwalk
Greenwich Stamford-Norwalk
New Britain New Britain
Bristol New Britain
Danbury Danbury
Milford Ansonia-Milford
West Haven Ansonia-Milford
New Haven County Sheriff No perfect match (districts do not correspond with counties though close to New Haven and Ansonia-Milford).
Source: http://www.jud.ct.gov/directory/maps/JD/default.htm
This document is a research report submitted to the U.S. Department of Justice. This report has not been published by the Department. Opinions or points of view expressed are those of the author(s)
and do not necessarily reflect the official position or policies of the U.S. Department of Justice.

75
APPENDIX C: CORRELATION MATRIX FOR POLICE
MEASUREMENT MODELS
Corr
ela
tio
n m
atr
ix f
or
ite
ms
in c
om
mu
nit
y p
oli
cin
g m
ea
sure
me
nt
mo
de
l, 2
000
LEM
AS
da
ta (
n=7
78)
Va
ria
ble
CP p
lan
Pro
ble
m
solv
ing
Ge
ogr
ap
hic
ass
ign
.
Tra
in
recr
uit
s in
CP
Tra
in s
wo
rn
off
ice
rs i
n C
P
Tra
in
civi
lia
ns
in
CP
Citi
zen
tra
inin
g in
CPA
cad
em
yM
ee
tin
gs
CP p
lan
1.00
0
Pro
ble
m s
olv
ing
0.32
61.
000
Ge
ogr
ap
hic
ass
ign
.0.
265
0.37
31.
000
Tra
in r
ecr
uit
s in
CP
0.23
40.
335
0.24
41.
000
Tra
in s
wo
rn o
ffic
ers
in
CP
0.28
50.
367
0.26
80.
484
1.00
0
Tra
in c
ivil
ian
s in
CP
0.21
70.
356
0.19
90.
296
0.47
11.
000
Citi
zen
tra
inin
g in
CP
0.22
80.
414
0.28
80.
241
0.20
50.
224
1.00
0
Ho
ld c
itiz
en
s a
cad
em
y0.
207
0.28
80.
199
0.22
10.
156
0.20
60.
336
1.00
0
Me
eti
ngs
0.25
10.
459
0.30
40.
245
0.25
90.
195
0.32
80.
219
1.00
0
This document is a research report submitted to the U.S. Department of Justice. This report has not been published by the Department. Opinions or points of view expressed are those of the author(s)
and do not necessarily reflect the official position or policies of the U.S. Department of Justice.

76
Co
rre
lati
on
ma
trix
fo
r it
em
s in
co
mm
un
ity
po
lici
ng
me
asu
rem
en
t m
od
el,
20
03
LEM
AS
da
ta (
n=4
36
)
Va
ria
ble
CP
pla
n
Pro
ble
m
solv
ing
Ge
ogr
ap
hic
ass
ign
.
Tra
in
recr
uit
s in
CP
Tra
in s
wo
rn
off
ice
rs i
n C
P
Tra
in
civi
lia
ns
in
CP
Cit
ize
n
tra
inin
g in
CP
Aca
de
my
Inp
ut
Pa
rtn
ers
hip
s
/agr
ee
me
nts
CP
pla
n1
.00
0
Pro
ble
m s
olv
ing
0.3
58
1.0
00
Ge
ogr
ap
hic
ass
ign
.0
.26
40
.43
61
.00
0
Tra
in r
ecr
uit
s in
CP
0.1
53
0.1
83
0.1
58
1.0
00
Tra
in s
wo
rn o
ffic
ers
in
CP
0.2
14
0.1
91
0.1
60
0.3
37
1.0
00
Tra
in c
ivil
ian
s in
CP
0.1
13
0.2
13
0.1
35
0.2
12
0.5
04
1.0
00
Cit
ize
n t
rain
ing
in C
P0
.24
20
.33
20
.18
90
.12
50
.07
10
.10
71
.00
0
Ho
ld c
itiz
en
s a
cad
em
y0
.11
80
.17
30
.09
90
.10
90
.08
60
.09
00
.30
61
.00
0
Inp
ut
0.2
74
0.3
21
0.2
74
0.1
46
0.1
99
0.1
85
0.3
86
0.2
87
1.0
00
Pa
rtn
ers
hip
s/a
gre
em
en
ts0
.26
70
.31
60
.21
30
.15
10
.09
10
.14
00
.37
70
.15
80
.40
51
.00
0
This document is a research report submitted to the U.S. Department of Justice. This report has not been published by the Department. Opinions or points of view expressed are those of the author(s)
and do not necessarily reflect the official position or policies of the U.S. Department of Justice.

77
APPENDIX D: CORRELATION MATRIX FOR PROSECUTION
MEASUREMENT MODELS
Correlation matrix for i tems in community prosecution measurement model , 2001 NPS data ( n =291)
Variable
Relation-
ships Meetings
Involve
comm. in
problem ID
Ass ign
prosecutors
to geo.
areas
Use non-
prosecution
tools
Relationships 1.000
Meetings 0.305 1.000
Involve comm. in problem ID 0.248 0.351 1.000
Ass ign prosecutors to geo. areas 0.131 0.215 0.254 1.000
Use non-prosecution tools 0.219 0.282 0.530 0.233 1.000
Correlation matrix for i tems in community prosecution measurement model , 2005 NPS data ( n =162)
Variable
Relation-
ships Meetings
Involve
comm. in
problem ID
Ass ign
prosecutors
to geo.
areas
Use non-
prosecution
tools
Relationships 1.000
Meetings 0.532 1.000
Involve comm. in problem ID 0.473 0.499 1.000
Ass ign prosecutors to geo. areas 0.177 0.307 0.330 1.000
Use non-prosecution tools 0.463 0.441 0.552 0.255 1.000
This document is a research report submitted to the U.S. Department of Justice. This report has not been published by the Department. Opinions or points of view expressed are those of the author(s)
and do not necessarily reflect the official position or policies of the U.S. Department of Justice.

78
APPENDIX E: RELATIONSHIP BETWEEN POLICE AND PROSECUTOR
HOMELAND SECURITY ACTIVITIES
In an effort to determine whether police practices influence prosecutors’ offices in other ways, a
preliminary assessment of homeland security practices was conducted using the combined 2003 LEMAS-
2005 NPS dataset.33 The 2005 NPS asked respondents four questions related to homeland security: did
anyone in the office attend training on homeland security issues, did anyone from the office participate
on a state or local homeland security task force, did the office prosecute any terrorism-related cases,
and did the office participate in any terrorism-related investigations (all had a 12-month reference
period). These four indicators served as outcome variables. The 2003 LEMAS dataset includes fourteen
items related to emergency preparedness: written response plan, mutual aid agreements, shared radio
networks, possession of emergency response equipment (6 indicators), partnering with diverse
communities, public anti-fear campaigns, dissemination of information to increase preparedness, hold
meetings on homeland security, and increase sworn officer presence in critical areas. Following the
procedures used by Randol (2012), the 14 dichotomous indicators derived from the LEMAS dataset were
summed into a single preparedness index (alpha=0.762).
Using logistic regression, police terrorism preparedness is positively and significantly related to two
of the four dichotomous indicators of prosecutor preparedness: training (p<0.05) and task force
participation (p<0.05). Police preparedness was unrelated to actual terrorism-related prosecutions or
investigations. That said, both of the significant effects disappear once prosecutor office size is
introduced as a control; larger prosecutors’ offices are more likely to take preparedness steps (training,
task force participation, and investigations, but not actual prosecutions).
33 A version of this analysis was presented as follows: Wingler, M., Lee, C., and Giblin, M.J. (2014). Assessing homeland security preparedness in police and prosecutors’ offices in the United States. Paper presented at the Midwest Public Affairs Conference, Fort Wayne, IN, March 27-29, 2014.
This document is a research report submitted to the U.S. Department of Justice. This report has not been published by the Department. Opinions or points of view expressed are those of the author(s)
and do not necessarily reflect the official position or policies of the U.S. Department of Justice.

79
This analysis was offered as a supplement to the main analyses presented in the report. It suggests
that the connection between prosecutors’ offices and police departments may be quite loose.
This document is a research report submitted to the U.S. Department of Justice. This report has not been published by the Department. Opinions or points of view expressed are those of the author(s)
and do not necessarily reflect the official position or policies of the U.S. Department of Justice.


