
UNICEF VACCINESZIKA Diagnostics Demand Forecast
1Jorgen Kofoed – UNICEF SD
Forecasting model: Overview
Assesses various methodologies and targeting assumptions
Applies 10-year time horizon incorporating population growth effects but assuming constant rate of disease Illustrates ramp-up period and steady-state demand volumes
Uses scale-up matrix to determine incremental country introduction timinginformed by WHO’s country risk categorization
Includes demand for government programmes, and a stockpile
2
Forecasting model: Technologies included/excluded
INCLUDES Rapid Diagnostic Tests (RDT)INCLUDES Point of Care (POC) tests
• Need for simple, specific IVD for detecting ZKV in acute different biological specimens thatcan be used in screening / diagnosis (particularly for prenatal and antenatal ZKVinfections) and that can generate results quickly and in close proximity to patients
EXCLUDES Surveillance testingEXCLUDES Blood screening
• While there is guidance on use of these technologies, these have not been included in theforecast as UNICEF is not currently planning to procure these tests
3
Forecasting model: Country inclusion/exclusion
INCLUDES Countries at greatest risk of outbreak and where environment is most suitable for vector (See next slides)
INCLUDES Countries likely to channel procurement through UNICEF
o Of these, currently focuses on 20 countries with largest populations ( 80% of total forecasted demand)
EXCLUDES Countries in Latin America
EXLUDES China , India and Indonesia4
Forecasting model: Country selection and Riskcategorization (I)
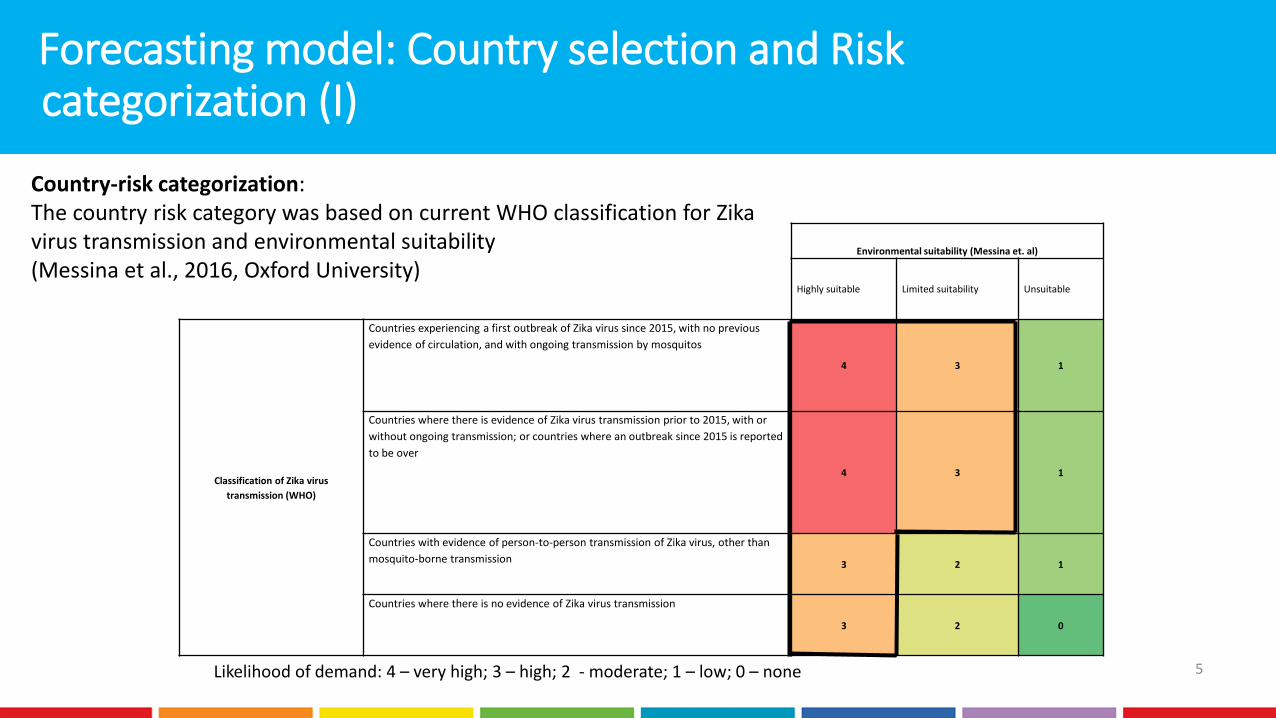
Country-risk categorization:The country risk category was based on current WHO classification for Zikavirus transmission and environmental suitability (Messina et al., 2016, Oxford University)
Environmental suitability (Messina et. al)
Highly suitable Limited suitability Unsuitable
Classification of Zika virus
transmission (WHO)
Countries experiencing a first outbreak of Zika virus since 2015, with no previous
evidence of circulation, and with ongoing transmission by mosquitos
4 3 1
Countries where there is evidence of Zika virus transmission prior to 2015, with or
without ongoing transmission; or countries where an outbreak since 2015 is reported
to be over
4 3 1
Countries with evidence of person-to-person transmission of Zika virus, other than
mosquito-borne transmission3 2 1
Countries where there is no evidence of Zika virus transmission
3 2 0
Likelihood of demand: 4 – very high; 3 – high; 2 - moderate; 1 – low; 0 – none 5
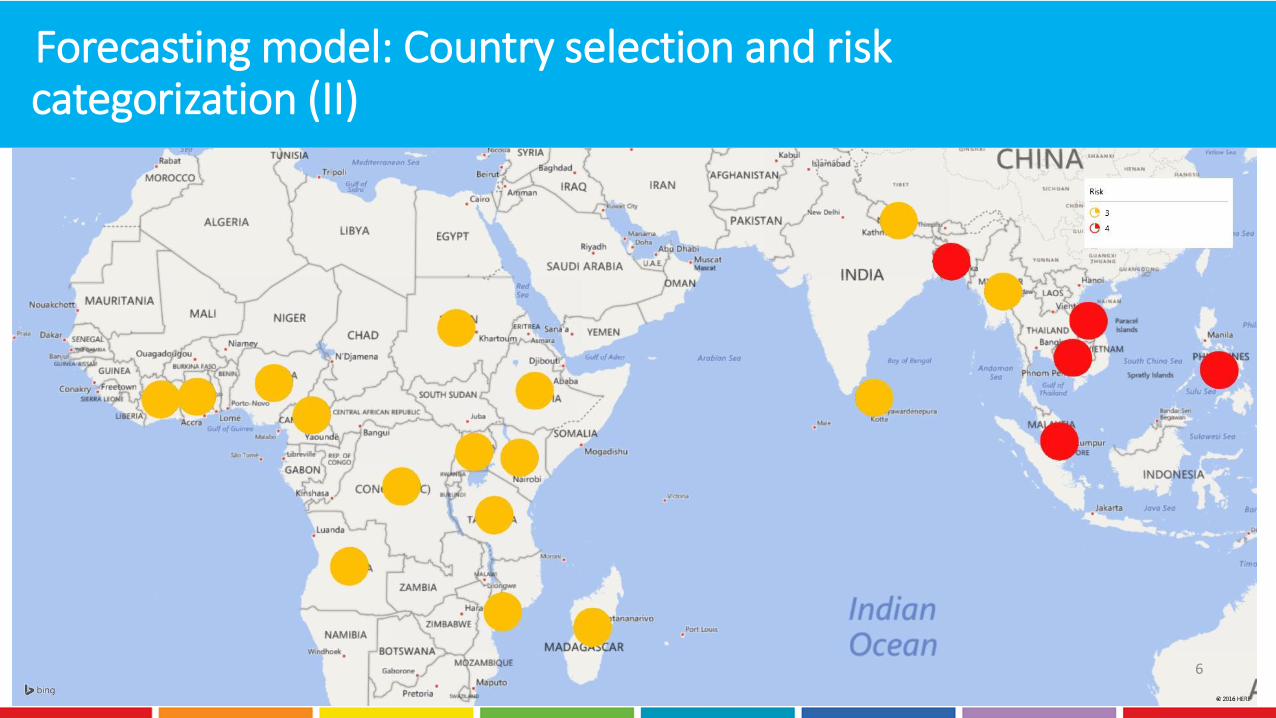
Forecasting model: Country selection and risk categorization (II)
6
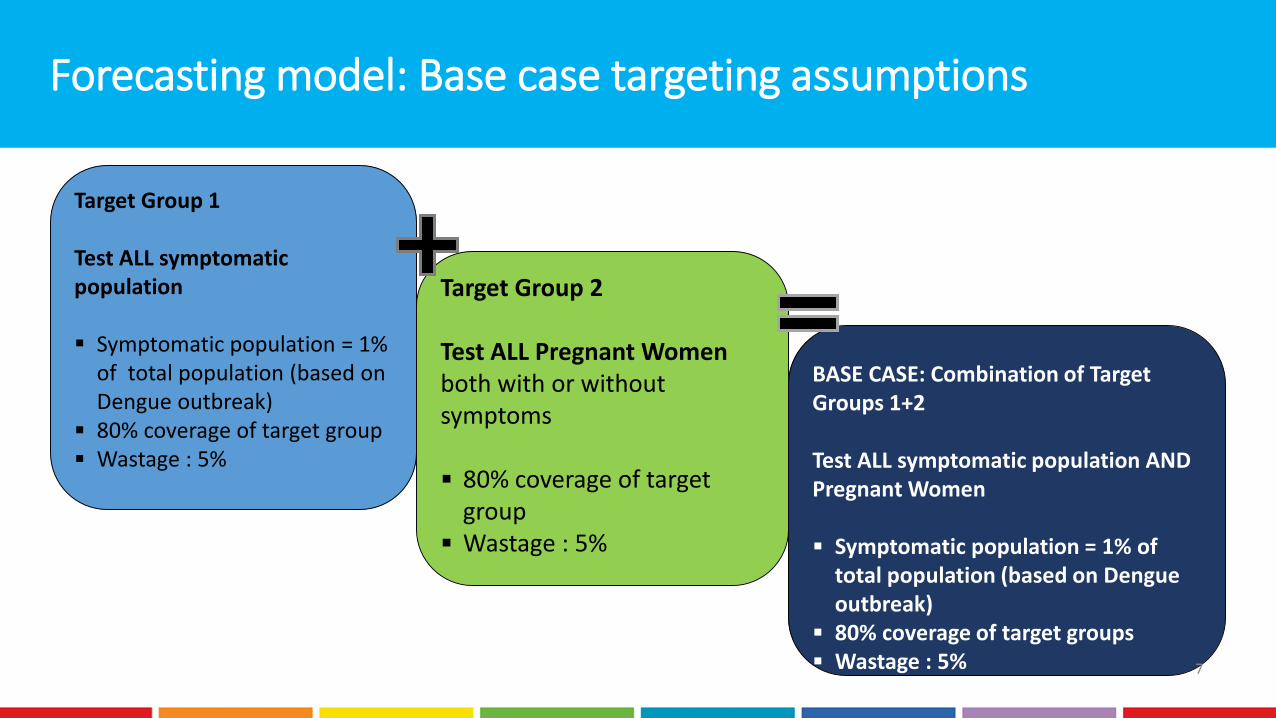
Forecasting model: Base case targeting assumptions
Target Group 1
Test ALL symptomatic population
Symptomatic population = 1% of total population (based on Dengue outbreak)
80% coverage of target group Wastage : 5%
Target Group 2
Test ALL Pregnant Women both with or without symptoms
80% coverage of target group
Wastage : 5%
BASE CASE: Combination of Target Groups 1+2
Test ALL symptomatic population AND Pregnant Women
Symptomatic population = 1% of total population (based on Dengue outbreak)
80% coverage of target groups Wastage : 5% 7
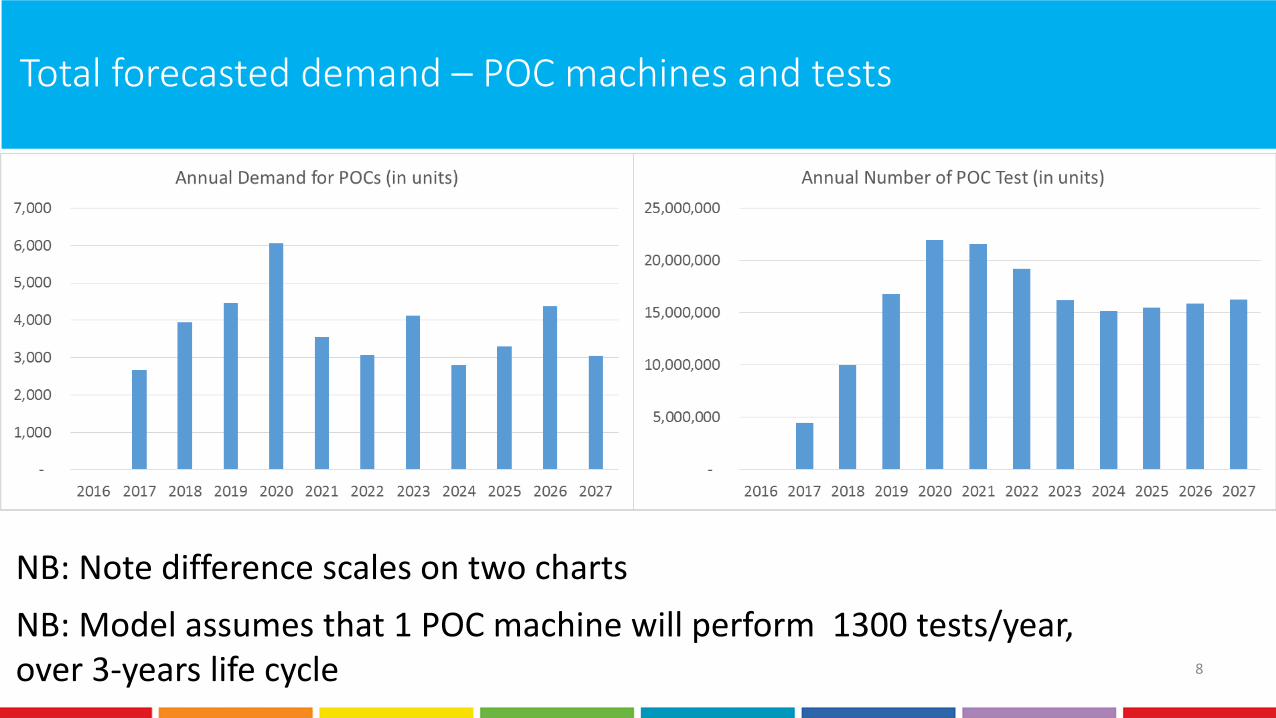
Total forecasted demand – POC machines and tests
NB: Note difference scales on two charts
NB: Model assumes that 1 POC machine will perform 1300 tests/year, over 3-years life cycle 8
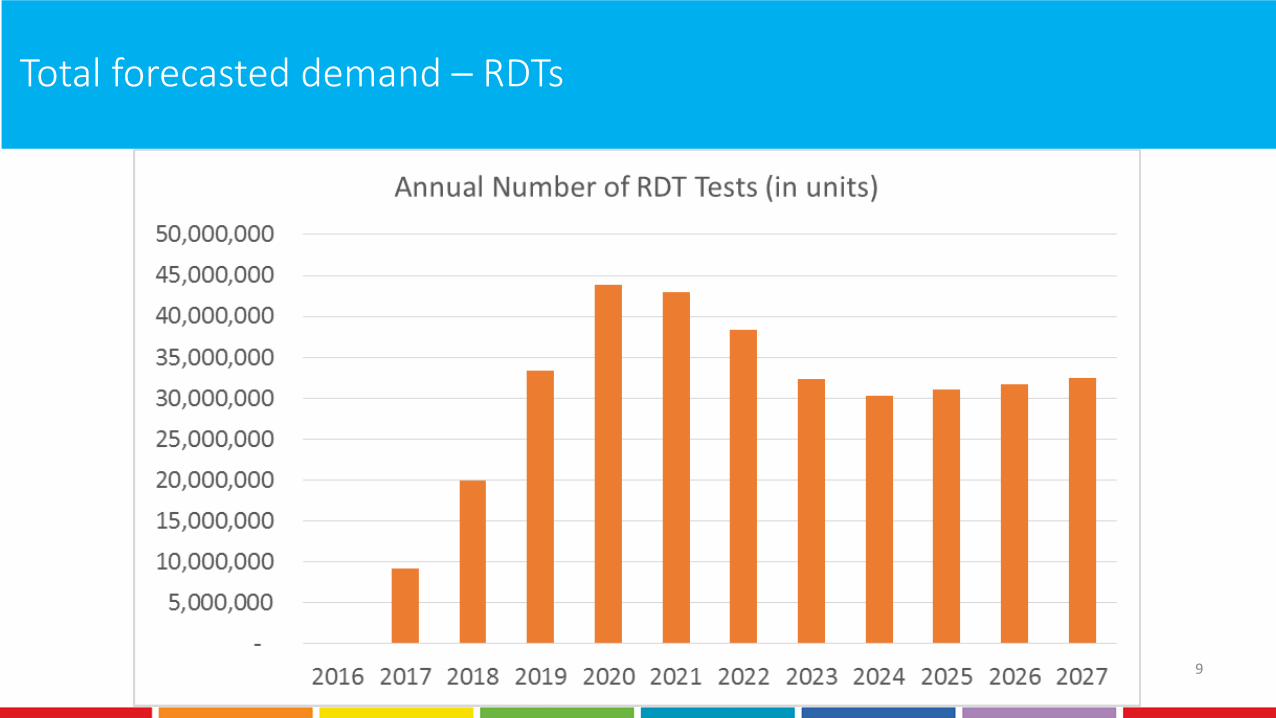
Total forecasted demand – RDTs
9
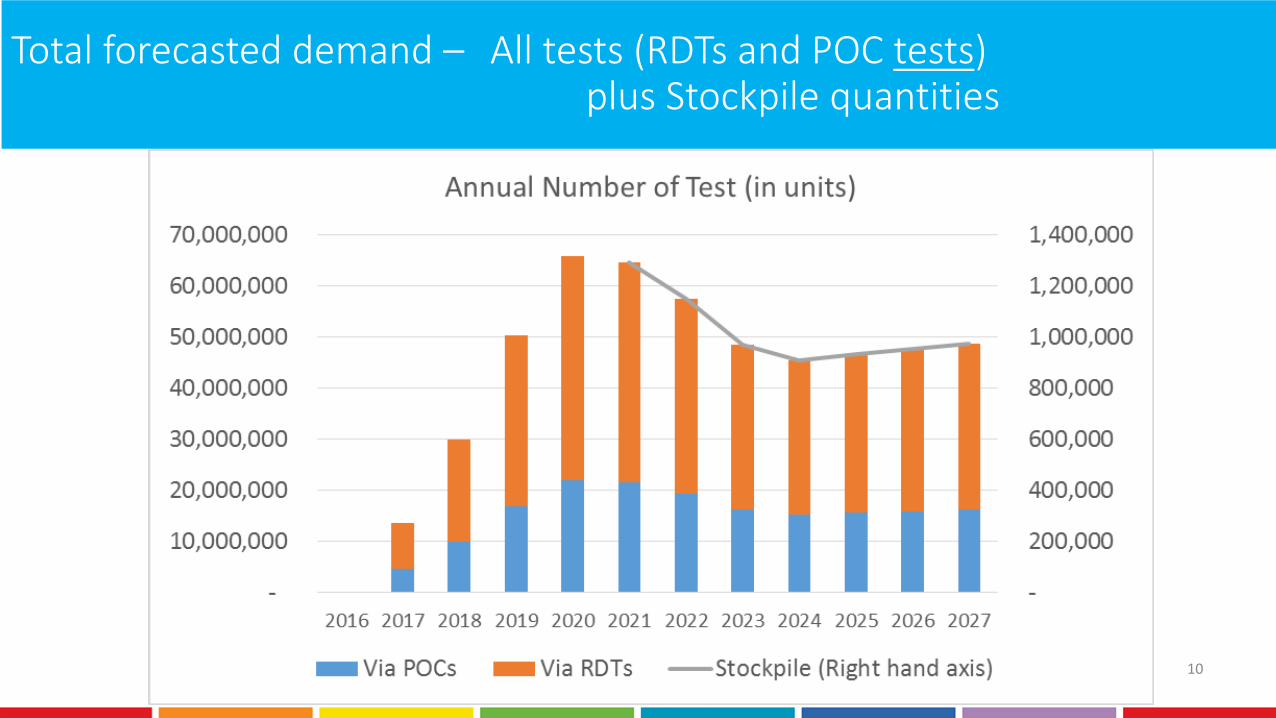
Total forecasted demand – All tests (RDTs and POC tests)plus Stockpile quantities
10
Next steps
• Running scenarios to test model sensitivities
• Conducting country consultation (currently ongoing) to inform model parameters
•Working with UNICEF Country Offices to validate assumptions
•Working with partners to refine model and possible extend scope; e.g. to incorporate dynamic effects of disease epidemiology
• Application to inform procurement and contracting modalities11
UNICEF VACCINESTHANK YOU!
12


