
UNITED STATESDEPARTMENT OF THE INTERIOR
GEOLOGICAL SURVEY
PHYSICAL PROPERTIES OF ROCKS-
POROSITY, PERMEABILITY, DISTRIBUTION COEFFICIENTS,
AND DISPERSIVITY
By Roger G. WoIff
U.S. GEOLOGICAL SURVEY
WATER-RESOURCES INVESTIGATIONS
OPEN-FILE REPORT 82-166
Reston, Virginia 1982

Table of Contents
4.1 Introduction and Scope
4.2 Porosity
4.21 General Definitions
4.22 Historical Aspects
4.23 Summary
4.3 Permeability
4.31 General Definitions
4.32 Historical Aspects
4.33 Discussion
4.34 Summary
4.4 Distribution Coefficients
4.5 Dispersivity
4.6 References
Page
1
3
3
4
5
36
36
36
38
39
91
96
102
Tables
Table 4.2.1 Porosities of Unconsolidated
Sedimentary Rocks
4.2.2 Porosities of Holocrystalline Rocks
4.2.3 Porosities of Evaporites
4.2.4 Porosities of Volcanic Rocks
4.2.5 Porosities of Carbonate Rocks
4.2.6 Porosities of Indurated
Sedimentary Rocks
6
12
17
19
22
26
11
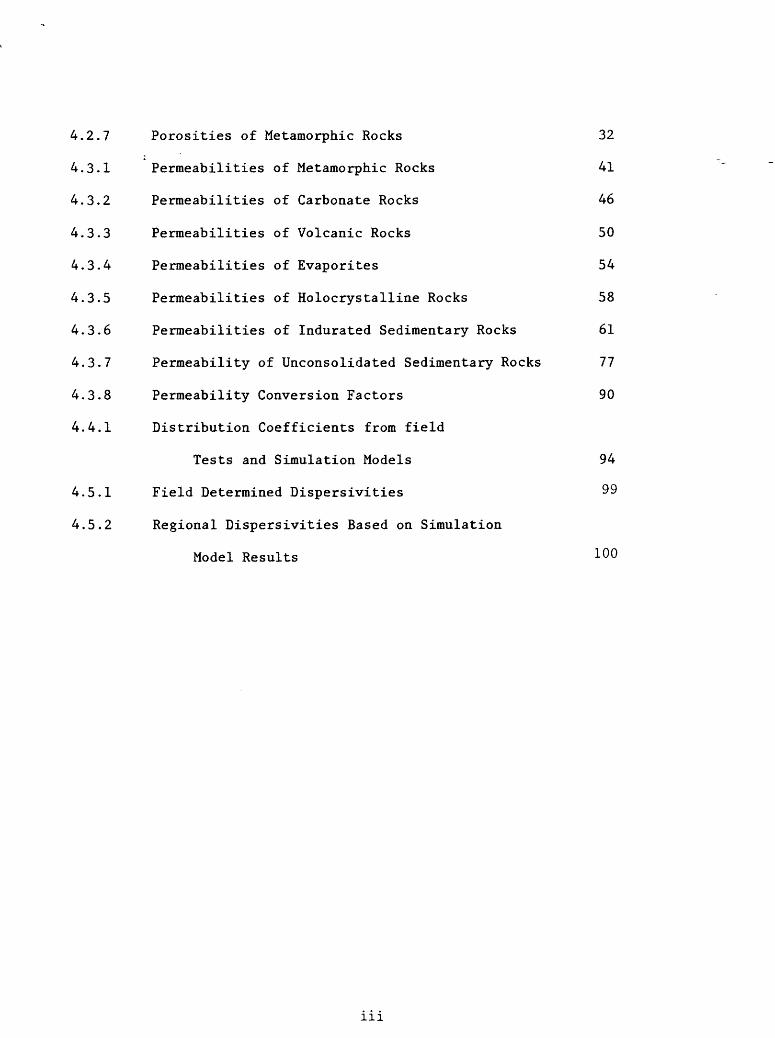
4.2.7 Porosities of Metamorphic Rocks 32
4.3.1 Permeabilities of Metamorphic Rocks 41
4.3.2 Permeabilities of Carbonate Rocks 46
4.3.3 Permeabilities of Volcanic Rocks 50
4.3.4 Permeabilities of Evaporites 54
4.3.5 Permeabilities of Holocrystalline Rocks 58
4.3.6 Permeabilities of Indurated Sedimentary Rocks 61
4.3.7 Permeability of Unconsolidated Sedimentary Rocks 77
4.3.8 Permeability Conversion Factors 90
4.4.1 Distribution Coefficients from field
Tests and Simulation Models 94
4.5.1 Field Determined Dispersivities 99
4.5.2 Regional Dispersivities Based on Simulation
Model Results 10°
111

Abstract
Accompanying the increased emphasis on using the "solid earth" as
a repository for waste as well as a source of fluids is the increased need
for prediction of effects of these planned stresses on porous media. To
fully describe the state of a fluid in a porous media it is necessary to
specify: a) the pressure of the fluid, b) the composition of the fluid and
e) the energy contained in the fluid. To describe and thus predict the
flow and compositional variation of a fluid in porous media in time and space
it is necessary to specify: a) the distribution of parameters affecting flow
in the space of interest, b) initial conditions of pressure, composition and
temperature or enthalpy, c) sources and sinks affecting flow and chemical
variation in time and space, and d) boundary conditions. Presented in this
paper are tabulations of data on porosity and permeability - factors pertinent
to flow; and distribution coefficients and dispersivity - factors pertinent
to chemical variation. Reported porosities vary from 0.000 to 87.3%,
permeabilities range from "too low to measure" to 8.1 cm/sec. Because of the
uncertainties of factors affecting laboratory determined dispersivities
and distribution coefficients, only field based values are reported for
these parameters.
IV

ACKNOWLEDGEMENTS
The thorough reviews by J. D. Bredehoeft and W. W. Wood as
well as the persistent patience of Ines Gore in the preparation
of the tables are greatly appreciated.
v
Physical Properties of Rocks
Chapter 4
Porosity, Permeability, Distribution Coefficents, and Dispersivity
By
Roger G. Wolff
4.1 INTRODUCTION AND SCOPE
The interest in porous media as a source of fluid (water, oil, gas)
or as a repository for the storage or disposal of fluids or other materials
has been increasing in the recent past and is likely to continue increasing
into the foreseeable future. To fully describe the state of a fluid in a
porous medium it is necessary to specify, 1) The pressure of the fluid,
2) the composition of the fluid, and 3) the energy contained in the fluid.
To predict the flow and compositional variation of a fluid in porous media
in time and space, certain parameters must be specified. For flow considerations
the primary parameters are porosity and permeability. For compositional
variations, one of the major sources or sinks are sorption type reactions
which are commonly characterized by utilizing distribution coefficients.

The purpose of this chapter is to present data on these factors as well
as dispersivity, a parameter for prediction of composition of mixing fluids.
It is assumed that users of the data presented in this chapter are
interested in obtaining reasonable ranges for these parameters. This
chapter is an attempt to assemble representative and readily available data.
Many laboratories have unpublished data which for proprietary or other reasons
have not been made available to the general public and therefore are not included.
There are undoubtedly values in the literature that have
been unintentionally overlooked. To reiterate, any pretense that this compilation
is all inclusive would be false because of the breadth of scientific and
engineering endeavors producing such information. For purposes of ease of
presentation, the topics; porosity, permeability, distribution coefficients,
and dispersivity, are treated in separate sections. As table 11 Chapter 1
indicates, sedimentary rocks, constitute only about eight percent of the earth's
crust; however, because most ground water and oil and gas occur in sedimentary
rocks most of the available data pertinent to the topics of this chapter are
for that group of rocks.
Most of the discretionary discussion found in Chapters 1 and 2 are
applicable to the rock properties considered here; i.e., the imprecision of
rock terms (Chapter 1), the effects of extraneous chemical composition
on the measurement of these properties, the "environmental" conditions
(Chapter 2), the representativeness of point data.

Synthesis of the data as presented here has been attempted with the
greatest of care, however, errors will have undoubtedly occurred. Apologies
for these are offered in advance.
4.2 POROSITY
4.21 General Definitions
Slichter (1899) in his pioneering consideration regarding the role
of porosity in the flow of water in porous media did not dwell on the
definition of porosity any more than to state"..., the percentage of open
space to the whole space, or the so-called porosity,..." However, since
that time considerable attention has been focused on questions of total
porosity, "the ratio of the volume of voids to the volume of solids
generally determined by volumetric-gravimetric techniques", (API - RP - 40,
1960), and effective porosity defined as: "the amount of interconnected
pore space available for fluid transmission, expressed as a percentage of the
total volume", (after Lohman and others, 1972b, p. 10). Assuming the
specific gravity of water equals unity, total porosity, expressed as a
percentage, based on four common approaches, can be expressed, after
Lohman (I972a, p. 3):
v. v V-v n = 100 (yi) = 100 (y*-) = 100(-y-^) = 100 (b-Gs ) (1)

where
n =: porosity (percent by volume),
V = total volume (L 3 )
v. = volume of interstices (L 3 )
v = aggregate volume of the solid particles (L 3 )
v = volume of water in a saturated sample (L 3 )
G = Specific gravity of the dry sample (M/L3 ) s
b = specific gravity of the saturated sample (M/L 3 ).
Effective porosity is generally determined by a procedure based on
Boyle's Law. The pressures and procedures used, of course, affect the degree
or size of interconnections measured. For detailed descriptions of the
methodology, including a discussion of the advantages and disadvantages
refer to API - RP-40 (1960).
4.22 Historical Aspects
Because the theoretical aspects of the movement of fluids (ground-water)
in porous media preceded the commercial development of petroleum from wells,
the early ground-water literature contains much of the theoretical
development. The early, thorough investigations of Slichter (1899) showed
that the porosity of uniformly sized spheres ranged from a maximum of 47
percent for the least stable packing to a minimum of 26 percent for the most
stable packing. As deposits of naturally occurring material are seldom
composed of uniform sized spherical material, measured porosities, tables
4.2.1 thru 4.2.7, of naturally occurring materials extend beyond these

limits. Fraser (1935) extended the factors affecting porosity. He
considered the following factors and their relative importance in
determining the porosity of unconsolidated natural deposits:
Absolute grain size
Non-uniformity in size of grains
Proportions of various sizes of grains
Shape of grains
Method of deposition
Compaction during and following deposition
Solidification.
The data as presented here provide little if any information regarding
these factors. However, Fraser's (1935) paper has served as the basis for
numerous studies attempting to develop "laws" governing porosity.
Consideration of these aspects is beyond the scope of this paper; however,
Pryor (1973) presents a good summary.
4.23 Summary
The maximum porosity of a natural inorganic material is reported by Schoeller
(1962) for a pumice sample, 87.3%. Values for minimum porosity are largely
a factor of scale because totally fracture-free material is a question of
scale. Geophysical evidence (Norton and Knight 1977, p. 93) suggests that
interconnected pore spaces exist to a depth of at least 15 km in the earths
crust. However, for laboratory samples, the lowest known porosity is that
for Sioux Quartzite, Precambrian in age from the Jasser, Minnesota area
reported to have a porosity 0.000 percent (Hanley and others, 1978, p. 36).

Table
4.2.1.
Poro
.fei
ties
of
Unconsolidated Sedimentary
Rocks
(percent)
(each
rock
ty
pe ar
rang
ed by increasing mean porosity).
Rock
Number of Sa
mple
s Mi
nimu
m Ma
ximu
m Mean
Reference
Beac
h deposits,
Sali
ne Pa
ss,
TX
Beac
h deposits,
Ship
Is
land
, MS
Beach
deposits,
Santa
Rosa
Isla
nd,
MS
Clay,
till
or bo
ulde
r, un
ifor
m size,
Pomperaug,
Va
lley
, CT
Clay
, pl
asti
c, Ol
igoc
ene
Clay,
plastic, Au
stri
a, Pl
ioce
ne
Clay,
loam soils, Sacramento Va
lley
, CA
Clay,
Arlington, VA
Clay
, (< .00
45 mm
)
Clay,
silt
y, ce
ntra
l CA
Clay,
Wealden, Cretaceous,
lacu
stri
ne
Clay,
sand
y, ce
ntra
l CA
Clay,
Boston blue clay
Clay
Clay,
Wealden, Al
amos
a, CO
Clay,
blue marine cl
ay,
Bosp
orou
s (42%
40 195
245
9 1 2 43 74 72 2 7
45.1
45.9
49.6
8.7
21
14.3
26.0
26.0
26
.1
26.1
37.3
40.1
34.2
56.9
42
35.6
53.3
43.1
43.5
38.4
49.6
44.0
44.4
44
50
45
41.5
57.9
48.2
2 2 2 9 11 11 9 3 8 7 3 7 3 1 4
49.2
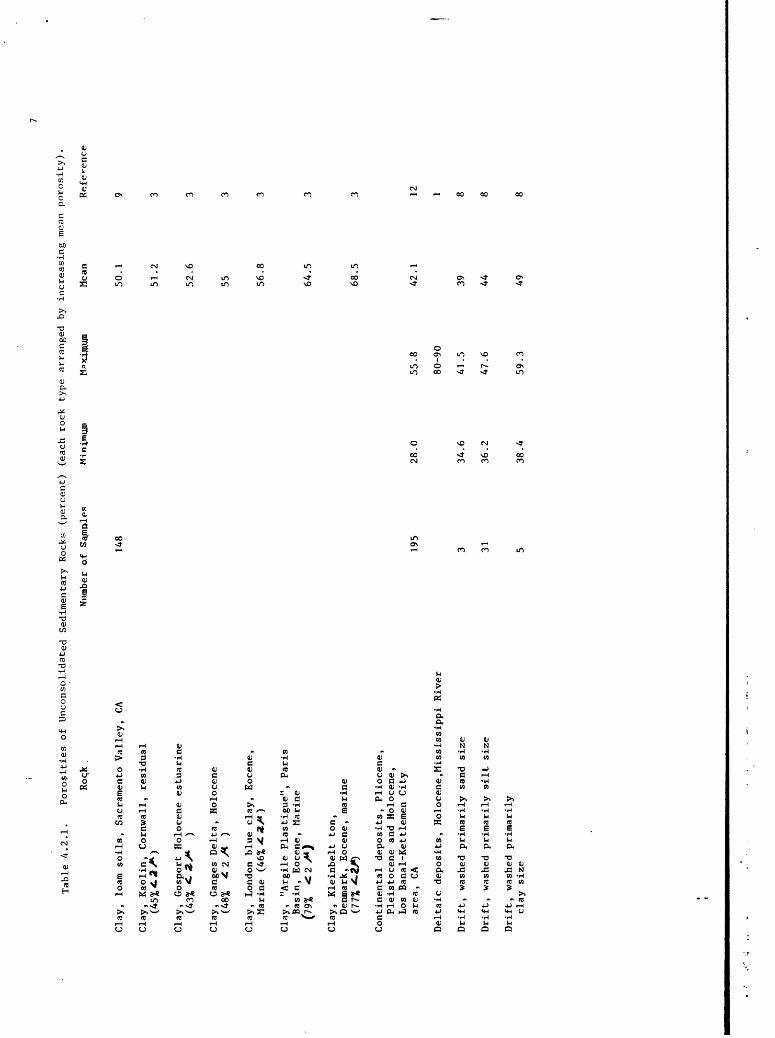
Tabl
e 4.2.1.
Porosities of
Uncons
olidated Sedimentary
Rock
s (percent)
(each
rock
type arranged by increasing me
an porosity).
Rock .
Number cx
f Sa
mulp
s Mi
nimu
m Ma
ximu
m Me
an
Refe
renc
e
Clay,
loam soils, Sacramento Va
lley
, CA
Clay,
Kaol
in,
Cornwall,
residual
148
Clay,
Gosp
ort
Holocene es
tuar
ine
(43% <- Z*
)
Clay,
Gang
es Delta, Ho
loce
ne
(48% *2/t
)
Clay,
London bl
ue clay,
Eoce
ne,
Marine (46% 4ZS*)
Clay,
"Arg
ile
Plastigue",
Paris
Basin, Eo
cene
, Marine
(79% <2/*)
Clay,
Klei
nbel
t ton,
Denmark, Eo
cene
, marine
(77%
Cont
inen
tal
deposits,
Pliocene,
Pleistocene
and
Holocene,
Los
Bana
l-Ke
ttle
men
City
ar
ea,
CA
Delt
aic
deposits,
Holocene, Mi
ssis
sipp
i River
Drift, washed
pr
imar
ily
sand size
Drift, washed primarily
silt size
Drift, washed
primarily
clay size
50.1
51.2
52.6
55 56.8
64.5
68.5
195
3 31
28
.0
34.6
36.2
55
.8
80
-90
41.5
47
.6
42.1
39 44
12 1 8 8
38.4
59.3
49

Tabl
e 4.2.1.
Poro
siti
es of
Un
consolidated Sedimentary
Rock
s (percent)
(each
rock
type arranged by
increasing mean porosity).
Rock
Number of Sa
mple
s Mi
nimu
m Ma
ximu
m Me
an
Reference
Dune
deposit, Santa
Rosa
Is
land
, MS
48
Dune
deposits,
St.
Andr
ew
Park,
Pana
ma Ci
ty,
FL.
Glacial, outwash, Pomperaug
Vall
ey,
CT
Gumbo, Mi
ssis
sipp
i
Loess
Marl
Peat
Peat
Playa
deposit, Mohave De
sert
, CA
Rive
r ba
r deposit, Whitewater River,
Cincinnati,
OH
151
Rive
r bar
deposit, Wabash Ri
ver,
Grayville, IL
167
River
bar
deposit, Mi
ssis
sipp
i River
,Jo
nesv
ille
, LA
30
Sand,
mari
ne,
Olig
ocen
e, Cretaceous (A
lbian) su
bsur
face
,Paris
Basin
13
Sand,
mari
ne,
Cretaceous -(Barremian)
subs
urfa
ce,
Pari
s Ba
sin
3
Sand
, up
per
Mioc
ene
78
22 17.4
35.0
26 31.9
47.9
116
11 5 2
50.8
18.0
38.5
30.2
46.8
44.0
57.2
49 4
7-5
0
92.2
92
80.7
95.2
92 3
8.0
2 9 3 8 1 8 10 9
36.9
44.9
45.0
21.5
23.7
27.1

Tabl
e 4.2.1.
Porosities of Un
cons
olidated Sedimentary
Rocks
(percent)
(each
rock
type ar
rang
ed by increasing me
an porosity).
Rock
Number of
Sa
mple
s Mi
nimu
m Ma
ximu
m Me
an
Reference
Sand
, ma
rine
, Cretaceous (A
ptia
n) subsurface,
Paris
Basin
Sand,
grav
el-g
laci
al
Sand,
dune
, France
Sand,
mari
ne,
Oligocene, Mi
ocen
e &
Pliocene-Tunisia
Sand,
cont
inen
tal,
Quaternary-Tunisia
Sand
, dune,
Saha
ra
Sand,
fluv
ial
Sand
, silty, ce
ntra
l CA
Sand,
medi
um (.
5-.2
5 mm
)
Sand,
coar
se (1
.0-.
5 mm
)
Sand,
silt,
clay,
cent
ral
CA
Sand
, beach, Quaternary
Sand
, be
ach
accretion, Holocene,
Galveston
Barrier
Isla
nd
Sand,
cent
ral
CA
Sand,
fine (.25-.25 mm
)
3 8 3 25 6 4 25 92 127
26 132
25 17 54 243
20 18.6
23.2
32 34.3
28.8
28.4
28.5
30.9
30.6
38.7
35.4
26.0
31 37.6
41.5
34 36.8
39.5
50.2
48.9
46.4
61.2
44.8
50.0
53.3
27.7
28.1
31.5
31.5
33.1
35.2
35.3
38.1
39 39 40.4
41.2
42.2
42.4
43
1 1 1 1 1 1 1 7 8 8 7 11 6 7 8
Sand,
beac
h accretion, Holocene,
New
Orle
ans
Barr
ier
Isla
nd.
43.1

10
Table 4.2.1.
Porosities of
Unconsolidated Sedimentary Rocks (percent)
(each
rock type arranged by increasing mean porosity).
Rock
Number of Samples
Minimum
Maximum
Mean
Reference
Sand
, cl
ayey
, ce
ntra
l CA
Sand
, eolian
Sand,
fine,
stream deposits,
"uni
form
" size,
Pomperaug, Va
lley
, CT
Sand,
silty, su
baqu
eous
, Ho
loce
ne
Silt,
lake de
posi
t-"u
nifo
rm"
size,
Pomp
erau
g, Va
lley
, CT
.
Silt,
sandy, ce
ntra
l CA
Silt,
clayey ce
ntra
l CA
Silt,
(.06
2-.0
04mm
)
Silt
, ce
ntra
l CA
Silt
, loam soils, Sacramento Va
lley
, CA
Soils, Ho
locene
Till
Till,
prim
arily
sand sized
Till
, pr
imar
ily
silt sized
13 6 2 36 120
281
2 87 5 6 10 15
28.0
39.9
36.0
33.9
31.4
33.9
50.4
45 11.5
22.1
29.5
52.8
50.7
41.9
55.6
61.0
61.1
52.2
69.4
21 36.7
40.6
44.4
45 48.0
49.4
38.9
40.9
41.8
46 51.3
52.2
58.3
14.7
31 34
7 8 9 11 9 7 7 8 7 9 11 1 8 8

11
Table
4.2.
1.
Poro
siti
es of
.Unconsolidated Sedimentary
Rock
s (p
erce
nt)
(eac
h rock type ar
rang
ed by in
crea
sing
mean po
rosi
ty).
References for
Table
4.2.
1.
1.
Schoelle
r, 1962;
4.
Wolf
f an
d Papadopulos, 1972;
7.
John
son
and
othe
rs,
1968;
10.
Walmsley,
1977
;
2.
Pryor, 1973;
5.
Morr
ow and
othe
rs,
1969
;8.
Mo
rris
and
John
son,
19
67;
11.
Mang
er,
1963
;
3.
Skempton,
1944
;6.
Beard
and
Weyl,
1973
;9.
Meinzer, 19
23;
12.
John
son
and
othe
rs,
1968
.
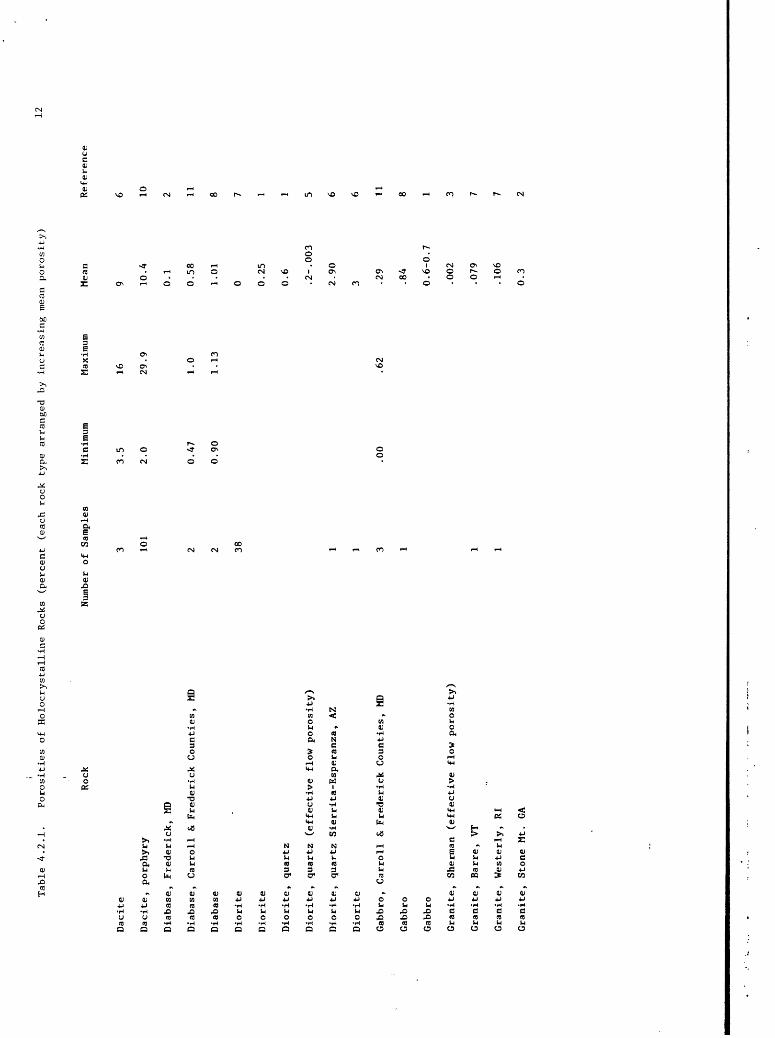
Table 4.2.1.
Porosities of Holocrystalline Rocks (p
erce
nt (e
ach
rock ty
pe arranged by increasing mean porosity)
12
Rock
Dacite
Dacite, porphyry
Diabase, Frederick, MD
Diabase, Carroll & Frederick Counties, MD
Diabase
Diorite
Diorite
Diorite, quartz
Diorite, quartz (effective flow porosity)
Diorite, quartz Sierrita-Esperanza, AZ
Diorite
Gabb
ro,
Carroll & Frederick Counties, MD
Gabbro
Gabbro
Granite, Sherman (effective flow porosity)
Granite, Barre, VT
Granite, Westerly, RI
Granite, Stone Mt.
GA
Number of Samples
Minimum
Maximum
Mean
Reference
3 101
2 2 38 1 1 3 1 1 1
3.5
16
9
2.0
29.9
10
. A
0.1
0.4
7
1.0
0.5
8
0.9
0
1.1
3
1.0
1
0 0.2
5
0.6 .2-.
003
2.9
0
3
.00
.62
.29
.84
0.6
-0.7
.002
.07
9
.106
0.3
6 10 2 11 8 7 1 1 5 6 6 11 8 1 3 7 7 2

Table
4.2.1.
Porosities of
Holocrystalline
Rock
s (percent (each
rock
ty
pe arranged by
increasing mean porosity)
13
Rock
Gran
ite
Granite, Tu
cson
, AZ
Gran
ite
Gran
ite
Granite, Laramie, WY
Granite, We
ster
ly,
RI
Granite, Ca
rrol
l & Fr
eder
ick
Counties,
MD
Granite, Troy
, AZ
Gran
ite
Granite, equi
granular Globe-Miami, AZ
Granite, Te
xas
Cany
on,
AZ
Gran
ite
Granite, (effective flow po
rosi
ty)
Granite, po
rphy
riti
c (a
lter
ed)
Globe-Miami, AZ
Granite, po
rphr
y, Bingham, UT
Gran
odio
rite
, St.
Clou
d, MN
Gran
odio
rite
, Ca
rrol
l & Fr
eder
ick
Counties,
MD
Number of Sa
mple
s Mi
nimu
m
45 1 451
26
0.4
1 17
.44
1 322
0.1
1 1 9 0.
7
Maxi
mum
Mean
Reference
3.0
3.98
11.2
5.5
0.4 .61
1
0.7
0.9 1.0
8
1.1
1.1
1
1.3
6
1.4
1.7
7
2.9
6
3 5--
004
5.3
5
6.1
1
.076
.50
14 6 15 16 6 2 11 6 17 6 6 6 4 6 6 7 11
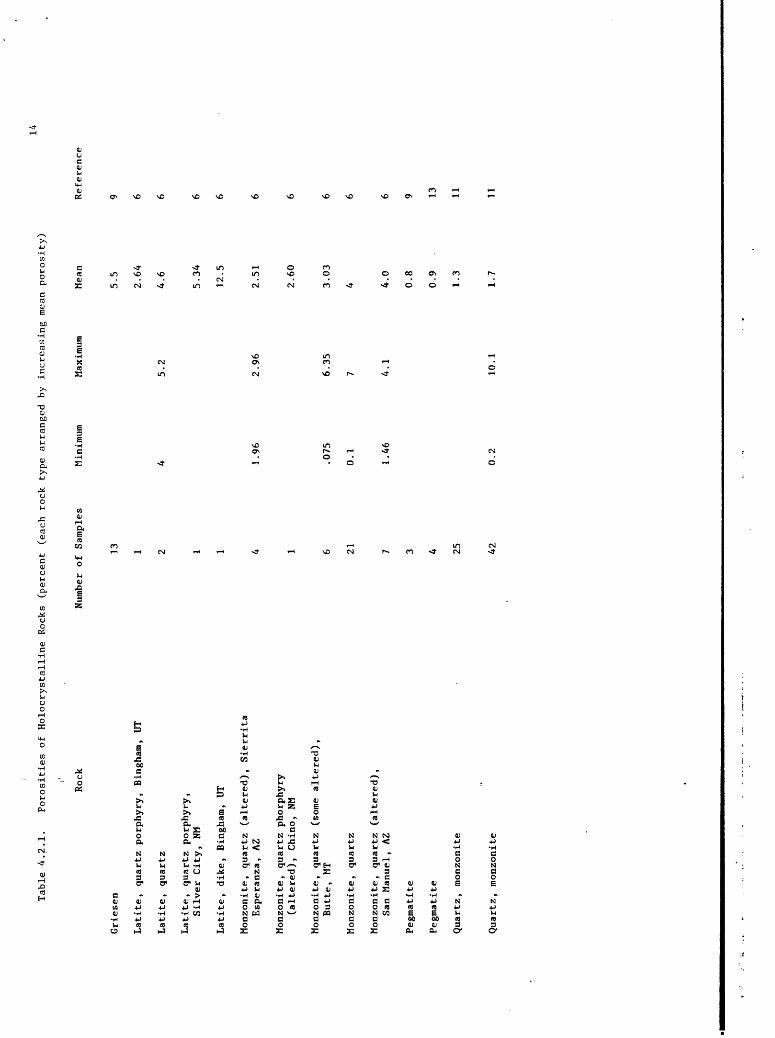
Table
4.2.1.
Poro
siti
es of
Holocrystalline
Rock
s (p
erce
nt (e
ach
rock type ar
rang
ed by
in
crea
sing
me
an porosity)
i'
Rock
Number of
Sa
mple
s Mi
nimu
m Ma
ximu
m Me
an
Grie
sen
Lati
te,
quartz porphyry,
Bingham, UT
Lati
te,
quartz
Lati
te,
quartz porphyry,
Silver Ci
ty,
NM
Lati
te,
dike
, Bingham, UT
Monz
onit
e, quartz (altered), Si
erri
ta
Esperanza, AZ
Monzonite, quartz ph
orph
yry
(alt
ered
), Chino, NM
Monz
onit
e, quartz (some
altered),
Butte, MT
Monz
onit
e, quartz
Monzonite, quartz (altered),
San
Manu
el,
AZ
Pegmatite
Pegmatite
Quar
tz,
monz
onit
e
14
Reference
13 1 2 1 1 4 1 6 21 7 3 4 25
5.5
2.6
4
4 5
.2
4.6
5.3
4
12.5
1.9
6
2.9
6
2.5
1
2.6
0
.075
6.3
5
3.0
3
0.1
7
4
1.4
6
4.1
4
.0
0.8
0.9 1.3
9 6 6 6 6 6 6 6 6 6 9 13 11
Quar
tz,
monz
onit
e42
0.2
10.1
1.7
11

15
Table 4.
2.1.
Porosities of
Holocrystalline Rocks
(percent (each
rock ty
pe arranged by increasing mean porosity)
Rock
Number of Samples
Minimum
Maximum
Mean
Reference
Quartz, monzonite
90
0 35
.0
23.8
12
Seynites
1.38
0.5-0.6
1
16
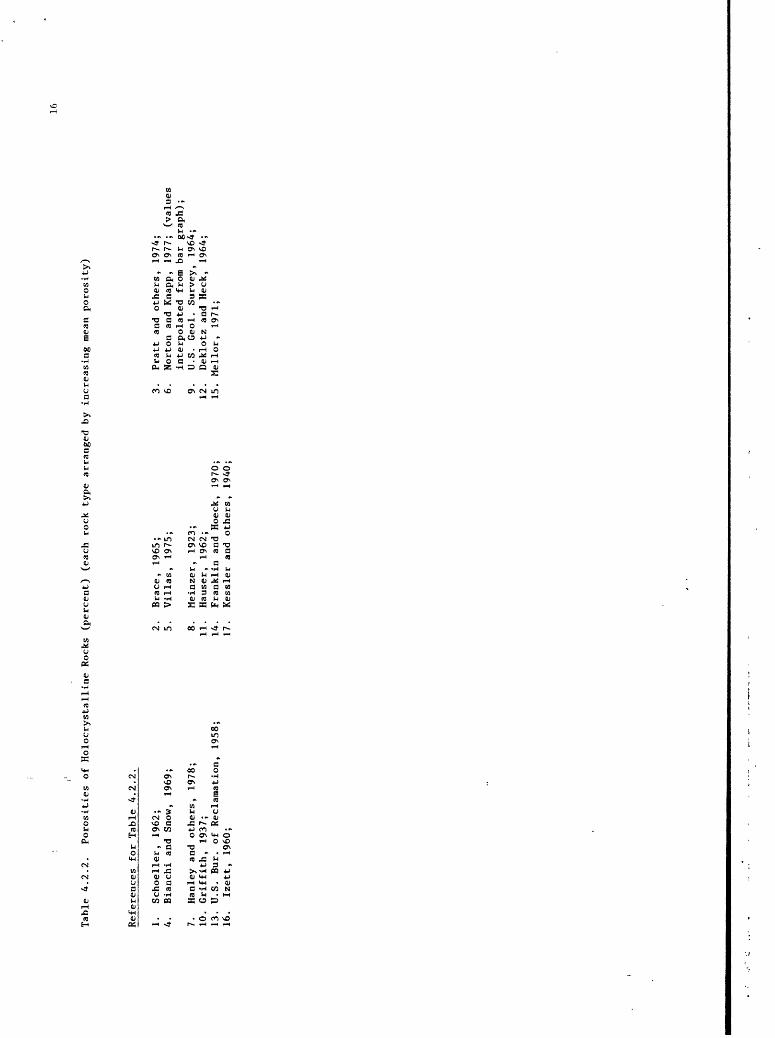
Tabl
e 4.
2.2.
Porosities of Holocrystalline
Rocks
(percent)
(each
rock ty
pe ar
rang
ed by in
crea
sing
me
an po
rosi
ty)
References for
Table
4.2.
2.
1.
Scho
elle
r, 19
62;
4.
Bian
chi
and
Snow,
1969;
7.
Hanley and
othe
rs,
1978;
10.
Griffith,
1937;
13.
U.S. Bur. of
Re
clam
atio
n, 19
58;
16.
Izet
t, 1960;
2.
Brace, 1965;
5.
Vill
as,
1975;
8.
Meinzer, 19
23;
11.
Haus
er,
1962
;14
. Franklin an
d Hoeck, 19
70;
17.
Kess
ler
and
othe
rs,
1940;
3.
Pratt
and
othe
rs,
1974
;6.
Norton and
Knapp, 1977;
(val
ues
inte
rpol
ated
from bar
grap
h);
9.
U.S.
Ge
ol.
Surv
ey,
1964
; 12.
Dekl
otz
and
Heck,
1964;
15.
Mell
or,
1971
;

17Table
4.2.3.
Porosities of Ev
apor
ites
(percent)
(each
rock
ty
pe ar
rang
ed by in
crea
sing
mean po
rosi
ty)
Rock
Number of
Sa
mple
s Mi
nimu
m Ma
ximu
m
Anhy
drit
e, Permian, Br
azos
, TX
region
Anhydrite
Gyps
um,
asso
rted
Gypsum
Gyps
um,
Pari
s Ba
sin
Gyps
um,
Castile, We
st TX
Gypsum
Halite
Halite
Non-clastic, sediments
Salt,
rock (6
10-6
40m*
)
Salt,
rock
(790-823m)
Salt,
bedd
ed,
Hutchinson Salt Member of We
llin
gton
Fm., KS
Salt,
rock,
Winn
fiel
d dome
Salt,
rock,
Gran
d Sa
line
dome,
TX
Salt,
rock,
bedd
ed
Salt,
rock
Mean
Reference
14 21 2 4 3 22 9 12 17 11
0.3
0.3
1.3
1.3
2
3.4
2
27
.2
0.5
0.8
0.1
0.1
0.3
0.6
2
1.5
4.4
40.8
4.0
3.9
6
6.4
3
30.6
5.1
7.1
5.5
0.8
0.7
7.1
7
8.6
1.9
10.3
2.6
2.6
4
4.8
4.8
1
28.4
2.0
2.9
3.5
0.4
0.5
0.5
9
1.2
8
1.7
1
2.1
0
3.7
12 9 1 4 1 3 10 9 10 2 5 5 8 6 8 7 11

18
Table
A.2.
3.
Porosities of
Evaporites (percent)
(eac
h rock type ar
rang
ed by
increasing mean porosity)
* Sa
mple
de
pth
References fo
r Table
A.2.
3.
1.
Schoeller, 1962;
4.
Mein
zer,
1923;
7.
Aufricht and
Howa
rd,
1961;
10.
Card
an
d Di
ckey
, 19
61;
2.
Norton and
Knapp, 1977;
(val
ues
inte
rpol
ated
from
bar
grap
h);
5.
Powe
rs an
d ot
hers
, 19
78;
8.
Robertson, 19
62;
11.
Corps
of En
gine
ers,
1965;
3.
Sany
al and
othe
rs,
1971
;
6.
Guido
and
Warn
er,
1960;
9.
U.S. Ge
ol.
Surv
ey,
1964;
12.
Gloy
na an
d Reynolds,
1961
;

Table 4.
2.4.
Porosities of Volcanic Rocks (p
erce
nt)
(rock
types arranged by increasing mean porosity)
Rock
Number of
Samples
Minimum
Maximum
Basalt, Dresser, WI
Basalt, assorted
Basa
lt,
Germany
Basalt
Basalt
Basalt
Dacite, dike,
Troy,
AZ
Dacite, flow,
Troy,
AZ
Obsidian
Phonolite
Porphyries, Germany
Pumice, from Champs Phlegreens
Pumice
Rhyodacite, dike,
Troy,
AZ
Rhyolite, subvolcanic, Chino, N.M.
Rhyolite, (a
lter
ed),
Sierrita
Esperanza, AZ
Rhyolite
19
Mean
Reference
1 8 5 20 41 1 1 10 1 1 1 3
0.047
0.1
2.9
0.80
0.27
3.37
1.49
1.2
18.7
9.
4
1.4
32.7
15.0
4.40-5.60
3.08
15.7
0.52
1
4.50
2.0-3.50
0.4
15.5
5.48
87.3
50-75
7.52
6.74
7.48
7 21
12
4 1 1 7 6 1 3 3 1 1 1 1 1 3 3 3 3

Table 4.
2.4.
Porosities of
Volcanic Rocks
(percent)
(rock
types
arranged by
increasing mean porosity)
20
Rock
Rhyolite
Tuff
, welded
Tuff,
(altered), Red Mtn.,
AZ
Tuff
Tuff
, zeolitized
Tuff,
volcanic
Southern Italy
Tuff
, zeolitized
Tuff
Tuff
, volcanic
Rhine Valley
Tuff
Tuff,
pumice
Tuff
, friable
Tuff
, pumice
Tuff
, pumice
Tuff
, bedded Nevada
Tuff
, bedded (pumiceous)
Tuff
Number of Samples
Minimum
Maximum
Mean
Reference
6 1 84 23 8 28 165
4 15 31 16 27 180
10.2
7.3
15.8
6 23.2
15.5
24.7
4
29.3
25-2
31.5
28.4
7.2
17.9
47.5
37.7
58.4
39.5
44.2
45.14
40.0
46.1
43.3
47.8
54.7
14.6
14.1
21.5
28.5
29.4
31.0
31.1
31.7
32.0
1
33.5
35.3
35.5
36.2
38.6
38.8
40.2
41
8 2 3 11 14 1 15 10 1 9 13 2 10 12 2 2 5

21
Table 4.2.4.
Porosities of Volcanic Rocks (p
erce
nt)
(rock
types arranged by increasing mean porosity).
References fo
r Table 4.2.4.
1.
Schoeller, 19
62;
4.
Hanley and
others,
1978;
7.
Corps of Engineers, 1965;
10.
Byers, 19
61;
13.
Emerick, 19
62;
2.
Keller, 1960;
5.
Morris and
Johnson, 1967;
8.
Sargent, 1965;
11.
Williams and
others,
1963;
14.
Emerick an
d others,
1962b;
3.
Norton an
d Knapp, 1977;
6.
Saucier, 19
69a;
9.
Dick
ey,
1961;
12.
Emerick an
d others, 19
62a;
15.
Emerick an
d ot
hers
, 19
62c;

Table
4.2.5.
Poro
siti
es of Carbonates (p
erce
nt)
(eac
h ro
ck ty
pe arranged by increasing mean porosity).
22
Rock
Chalk, ce
ment
ed No
rthe
rn Fr
ance
Chalk, Northern France
Chalk
Chal
k
Coqu
ina
Dolo
mite
, Ma
rtin
sbur
g, WV
Dolo
mite
, Webatuck,
NY
Dolo
mite
, (Rustler)
west
TX
Dolomite
Dolomite
Dolomite
Dolomite
Lime
ston
e, Oa
k Hall,
PA
Lime
ston
e, (B
one
Springs) We
st TX
Lime
ston
e, Ca
rrol
l & Frederick
Counties,
MD
Lime
ston
e, do
lomi
tic
Carr
oll
& Frederick
Coun
ties
, MD
Lime
ston
e, Chino, NM
Lime
ston
e, do
lomi
te-L
ower
Ordvician
Numb
er of
Sa
mple
sMi
nimu
mMa
ximu
mMe
anReference
2 16 3 1 2 27 5 2 1 7 2 3
7.7
8.3
8.0
22.2
37.2
29.2
45.9
46.8
46.2
53 56.7
0 0.4
0.4
1
1.3
7
0.8
9
0.8
12.4
4.5
3.0
8.6
5.5
19.1
32.7
26 1
.0-2
2.2
0 0.4
4
.27
4.3
6
1.7
0
2.0
8
.366
4.3
8
2.4
4
0.1
12.6
2
.5
1 1 10 8 11 2 2 6 13 12 7 1 2 6 11 11 4 9

Table
4.2.5.
Porosities of Carbonates (percent)
(eac
h ro
ck type arranged by increasing mean po
rosi
ty)
Rock
Numb
er of
Sa
mple
s Mi
nimu
m Ma
ximu
m
23
Mean
Reference
Lime
ston
e,
Lime
ston
e,
Lime
ston
e,
Lime
ston
e,
Lime
ston
e,
Lime
ston
e,
Lime
ston
e,
Lime
ston
e,
Lime
ston
e,
Lime
ston
e,
Lime
ston
e,
Lime
ston
e,
Lime
ston
e,
Lime
ston
e,
Lime
ston
e,
Lime
ston
e,
Lime
ston
e,
Limestone
John
son
Camp
, AZ
(Sal
em),
Bedford, IN
dolomite,
Devonian
dense, So
uthe
rn Italy
marb
le,
dolo
mite
dolo
mite
, Or
dovi
cian
Carb
onif
erou
s
dolomite,
Silurian
dolo
mite
, Cambrian
Pennsylvanian
Tria
ssic
dolomite,
Perm
ian
Germ
any
asso
rted
Mississipian
ooli
te,
Tria
ssic
chal
k, Cr
etac
eous
4 1 92 24 11 216
29 31 2117
37 56 6 10 226
2109
601
74
2.35
0.6
0.3
.53
.07
0.6
0.5
0 0.4
3.2
3.1
1.6
0.9
0 0.2
6.6
3.88
12.9
14 13.3
6
22.3
14.9
15.9
31.6
36.5
27.1
28.4
36.5
25.9
34.4
42.8
55.7
3.20
3.630
4.4
4.5
4.85
5.4
5.5
5.5
5.8
6.3
9.3
9.8
10.4
10.6
11.3
13.4
17.5
30
4 5 9 1 8 9 9 9 9 9 9 9 1 1 9 9 9 7

24Ta
ble
4.2.5.
Porositie^ of Carbonates (percent)
(eac
h rock type arranged by
increasing mean porosity).
Rock
Number of
Sa
mple
s Mi
nimu
m Ma
ximu
m Mean
Lime
ston
e, do
lomi
tic
marine It
aly
Marble
Marb
le,
whit
e, Portugal
Marb
le,
Danb
ury,
VT
Marb
le,
Gren
vill
e Co
mple
x
Marb
le,
Gren
vill
e Complex, Pr
ecam
bria
n
Marb
le,
Hols
ton
Marb
le,
Knoxville, TN
Marb
le,
whit
e, Tyrol
Marb
le,
east
ern
US
Marb
le,
dolo
miti
c, Ca
rrol
l & Frederick
Coun
ties
, MD
Marb
le,
Carr
oll
& Fr
eder
ick
Coun
ties
, MD
Marble
Marb
le,
John
son
Camp
, AZ
Marb
le,
Carrara, Italy
Oolite
Trav
erti
ne
Tufa,
calcareous,
Quar
tern
ary
Reference
12 9 9 1 100
2 7 6 1 8 5 4
10.5
6
6.6
34.7
.19
.26-2
7
0.3
.01
1.0
6
0.3
5
0.0
1
1.0
6
.35
0.5
2
.59
0.4
0.8
0.6 .60
.31
2.0
2
.62
0.7
1
.1
0.9
2.6
2
.11
-. 2
2
3.2
8
12.4
4
7.1
8
9 38
18
7.0
27.8
19.2
1 1 1 2 3 9 5 1 3 11 11 10 4 1 8 1 9

25
12Ta
ble
4.2.
5.
Poro
siti
es of
Carbonates (p
erce
nt)
(each
rock
type ar
rang
ed by in
crea
sing
mean po
rosi
ty).
References fo
r Table
4.2.
5.
1.
Schoelle
r, 1962;
4.
Norton an
d Knapp, 1977;
7.
Morr
is an
d Johnson, 1967;
10.
Bald
win
and
othe
rs,
1909
;13.
U.S. Ar
my,
1961
;
2.
Brace, 1965;
5.
Hanley and
othe
rs,
1978;
8.
Meinzer, 19
23;
11.
Grif
fith
, 19
37;
3-
Mang
er,
1963;
6.
Sany
al and
othe
rs,
1971
;9.
Ma
nger
, 1963;
12.
Wind
es,
1950
;

Table
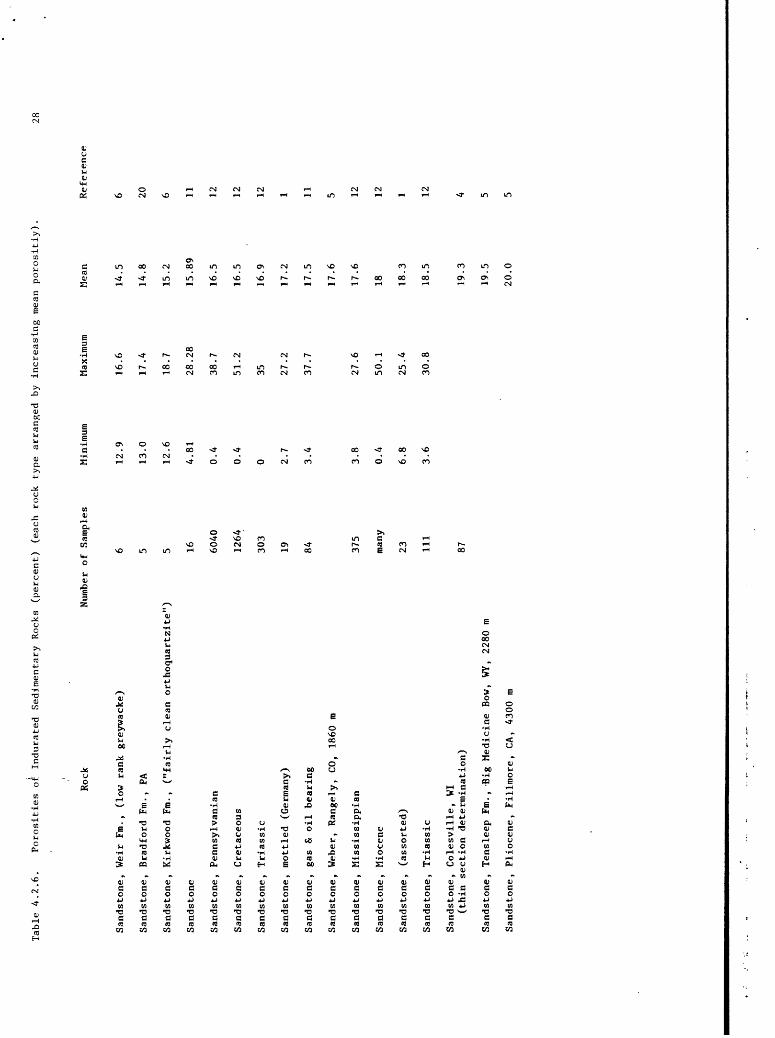
4.2.6.
, Porosities of In
dura
ted
Sedi
ment
ary
Rock
s (percent)
(each
rock
type ar
rang
ed by
in
crea
sing
mean po
rosi
tiy)
.26
Rock
Chert, Keewat
in,
Prec
ambr
ian
Cher
t, Onverwacht Group, Swaziland, Pr
ecambrian
Cher
t
Chert
Clay
ston
e
Clay
ston
e
Grey
wack
e
Quar
tzit
e, Si
oux
Quartzite, Ja
sper
, MN
Quar
tzit
e, Ca
rrol
l & Fr
eder
ick
Coun
ties
, MD
Quar
tzit
e, (C
hesh
ire)
Rutland, VT
Quartzite
Quartzite, Gl
obe-
Miam
i, AZ
Quartzite, Jo
hnso
n Ca
mp,
AZ
Quartzite
Quar
tzit
e, Ch
icki
es Ft
n. ,
PA
Sandstone, mo
ttle
d (G
erma
ny)
Sandstone, St
ockt
on Fm., NJ &
PA
Sandstone, Si
luri
an
Numb
er of
Sa
mple
sMi
nimu
mMa
ximu
mMean
Reference
1 4 2 2 12 4 2 1 3 1 1 3 21 5 5 13
0.10
.03
.72
.33
4.3
6.9
22.1
32.3
29.0
41.2
45.2
43
0.4
4.2
2.3
0.000
.46
0.6
0.8
1.38
2.53
5.35
4.0
0.2
10.0
4.1
3.8
7.8
5.4
15.9
3.
2
1.3
7.9
4.0
0.5
17.4
4.9
8 8 14 13 13 10 1 7 19 2 11 3 3 15 20 1 20 12
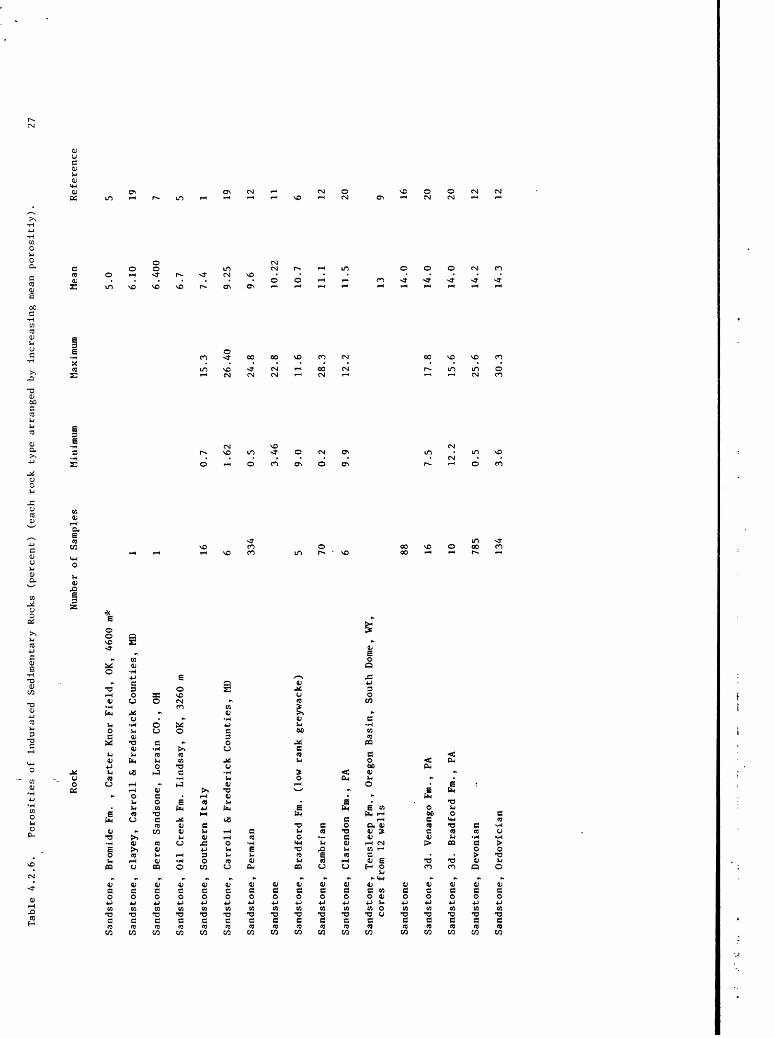
Table
4.2.6.
Porosities of
Indurated
Sedimentary
Rocks
(per
cent
) (each
rock
type arranged by
increasing me
an porositiy).
27
Rock
Sand
ston
e, Br
omid
e Fm
. , Carter Kn
or Field,
OK,
4600 m*
Sand
ston
e, cl
ayey
, Ca
rrol
l & Frederick
Counties,
MD
Sandstone, Berea
Sandsone,
Lorain CO
., OH
Sand
ston
e, Oi
l Creek
Fm.
Lindsay, OK
, 3260 m
Sandstone, So
uthern Italy
Sandstone, Ca
rrol
l & Fr
eder
ick
Coun
ties
, MD
Sand
ston
e, Pe
rmia
n
Sandstone
Sandstone, Br
adfo
rd Fm
. (l
ow ra
nk gr
eywa
cke)
Sand
ston
e, Ca
mbri
an
Sand
ston
e, Clarendon
Fm.,
PA
Sand
ston
e, Te
nsle
ep Fm
., Oregon Basin, South
Dome
, WY,
cores
from 12 we
lls
Sand
ston
e
Sandstone, 3d
. Ve
nang
o Fm
., PA
Sandstone, 3d
. Br
adfo
rd Fm
., PA
Sand
ston
e, Devonian
Sand
ston
e, Ordovician
Numb
er of Sa
mple
sMi
nimu
mMa
ximu
mMean
Reference
1 1 16 6 334
5 70 6 88 16 10 785
134
0.7
1.62
0.5
3.46
9.0
0.2
9.9
7.5
12.2
0.5
3.6
15.3
26.40
24.8
22.8
11.6
28.3
12.2
17.8
15.6
25.6
30.3
5.0
6.10
6.400
6.7
7.4
9.25
9.6
10.2
2
10.7
11.1
11.5
13 14.0
14.0
14.0
14.2
14.3
5 19 7 5 1 19 12 11 6 12 20 9 16 20 20 12 12
Table
4.2.6.
Porosities of
In
dura
ted
Sedimentary
Rocks
(per
cent
) (each
rock type ar
rang
ed by
in
crea
sing
me
an po
rosi
tiy)
.28
Rock
Number of
Sa
mple
sMi
nimu
mMa
ximu
mMean
Reference
Sand
ston
e, We
ir Fm., (low rank gr
eywa
cke)
Sandstone, Br
adfo
rd Fm., PA
Sandstone, Ki
rkwo
od Fm., ("fairly clean
orth
oqua
rtzi
te")
Sand
ston
e
Sand
ston
e, Pennsylvanian
Sandstone, Cretaceous
Sandstone, Tr
iass
ic
Sandstone, mo
ttle
d (Germany)
Sandstone, ga
s &
oil
bear
ing
Sand
ston
e, Weber, Rangely, CO,
1860 m
Sand
ston
e, Mississippian
Sandstone, Mi
ocen
e
Sand
ston
e, (a
ssor
ted)
Sandstone, Tr
iass
ic
Sandstone, Colesville,
WI(thin
sect
ion
dete
rmin
atio
n)
Sandstone, Te
nsle
ep Fm
., Bi
g Medicine Bow,
WY
, 2280 m
Sandstone, Pl
iocene,
Fillmore,
CA,
4300 m
6 5 5 16 6040
1264
303
19 84 375
many
23 111
87
12.9
13.0
12.6
4.81
0.4
0.4
0 2.7
3.4
3.8
0.4
6.8
3.6
16.6
17.4
18.7
28.28
38.7
51.2
35 27.2
37.7
27.6
50.1
25.4
30.8
14.5
14.8
15.2
15.8
9
16.5
16.5
16.9
17.2
17.5
17.6
17.6
18 18.3
18.5
19.3
19.5
20.0
6 20 6 11 12 12 12 1 11 5 12 12 1 12 4 5 5

29Ta
ble
4.2.
6.'
Poro
siti
es of In
dura
ted
Sedi
ment
ary
Rocks
(per
cent
) (each
rock
type ar
rang
ed by in
crea
sing
me
an po
rosi
tiy)
.
Rock
Number of Sa
mple
s Mi
nimu
m Ma
ximu
m Me
an
Reference
Sand
ston
e, Oligocene
Sandstone, Eocene
Sandstone, Sc
heerhorn b
. Nordlawn
1104 m
Sandstone, Pi
acenza,
Italy
1575 m
Sandstone, Eo
cene
, Da
vis
Lens
, TX
2320 m
Sandstone, Pi
acen
za,
Ital
y 19
60 m
Sandstone, Scheerhorn b.
Nordlawn 11
20 m
Sand
ston
e, Miocene, Univ.
Field, TX 2160 m
Sandstone, Pi
acen
za,
Italy
1930
m
Sandstone, sl
ight
ly consolidated -
Germ
any
Oilfields
Eldi
ngen
b. Ce
lle
1483
m
Sandstone, Fr
io Clay,
Fish
ers
Reef,
TX,
2740 m
Sandstone, Miocene, Tu
nisi
a
Sandstone, El
ding
en b.
Ce
lle
1463
m
Sandstone, Cockfield
Fm.,
Ka
ty,
TX,
2100
m
Sandstone, up
per
Miocene, Budrio Os
t b.
Bologna, Italy
2530 m
Sandstone, Ruhlermoor b.
Me
ppen
842
m
Sandstone, Pa
leoc
ene
many
0.8
344
7
2 20
18
9.4
45
22
46.5
22.4
23 23.2
27.0
27.0
27 28.0
28.0
28 28.2
37
28.5
29 29.8
30.0
30
53.6
30.8
12 12 5 5 5 5 5 5 5 5 5 1 5 5 5 5 12

30
Table
4.2.6.
Porosities of
In
dura
ted
Sedimentary
Rocks
(percent)
(each
rock ty
pe ar
rang
ed by
in
crea
sing
me
an po
rosi
tiy)
.
Rock
Number of Sa
mple
s Mi
nimu
m Ma
ximu
m Me
an
Refe
renc
e
Sandstone, Eo
cene
, Li
bert
y CO., TX
, 2340
ID
Sandstone, Pi
acenza,
Ital
y 1595
ra
Sandstone, Ru
hler
moor
b.
Me
ppen
85
3 m
Sandstone, (fine
grained)
Sand
ston
e, Pi
acenza,
Ital
y 1555 m
Sand
ston
e, (med.
grained)
Sandstone, Pl
ioce
ne - Pleistocene
Silt
ston
e
Siltstone
Subgraywacke
55 10 7 6 7 5
13.7
29.7
38.1
1.1
21.2
1.9
49.3
43.6
39.7
24.9
41.0
5.5
31.5
31.7
33 33 36.0
37 39.0 .
16.7
35 3.3
5 5 5 10 5 10 12 17 10 18
31
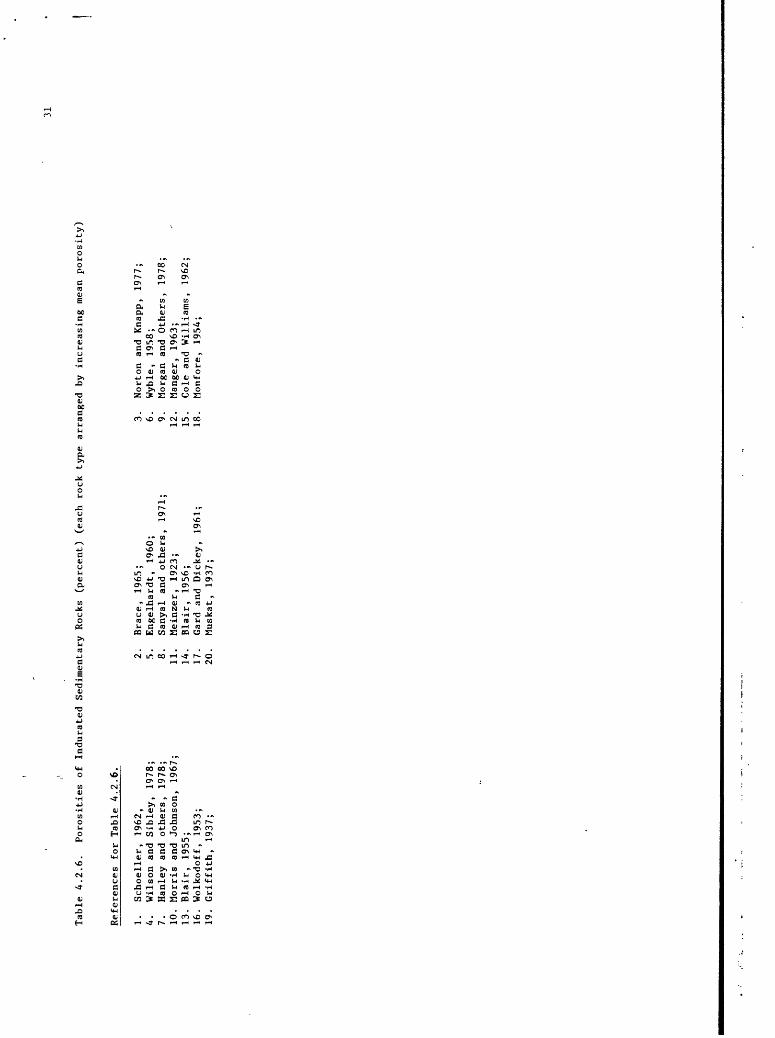
Tabl
e 4.2.6.
Poro
siti
es of
In
dura
ted
Sedimentary
Rock
s (percent)
(each
rock
type ar
rang
ed by
in
crea
sing
me
an po
rosi
ty)
Refe
renc
es fo
r Table
4.2.6.
1.
Schoelle
r, 19
62,
4.
Wils
on and
Sibl
ey,
1978
;7.
Hanl
ey an
d ot
hers
, 19
78;
10.
Morris an
d Johnson, 1967;
13.
Blair, 19
55;
16.
Wolkodoff, 1953;
19.
Griffith,
1937
;
2.
Brace, 1965;
5.
Engelhardt,
I960
;8.
Sanyal an
d ot
hers
, 1971;
11.
Mein
zer,
1923;
14.
Blair, 1956;
17.
Card an
d Di
ckey
, 19
61;
20.
Musk
at,
1937
;
3.
Norton an
d Knapp, 1977;
6.
Wyble, 1958;
9.
Morgan an
d Ot
hers
, 19
78;
12.
Mang
er,
1963;
15.
Cole and
Williams,
1962;
18.
Monfore, 1954;

32
Table
A.2.
7.
Poro
siti
es of Metamorphic
Rocks
(per
cent
) (e
ach
rock type ar
rang
ed by in
crea
sing
me
an porosity)
Rock
Numb
er of Sa
mple
s Mi
nimu
m Ma
ximu
m Mean
Gnei
ss,
Carr
oll
& Fr
eder
ick
Coun
ties
, MD
Gnei
ss
Gnei
ss
Greenstone
, Si
lver
Ci
ty,
NM
Horn
fels
, ma
rble
&
greenstone
Schi
st,
argillaceous
Schi
st,
gneiss &
gran
ite
Schi
st,
siliceous
Schi
st,
Final
Schi
st,
Glob
e-Mi
ami,
AZ
Schi
st,
Final
Schi
st,
John
son
Camp,
AZ
Schi
st,
slat
e, gneiss
Schi
st
Schi
st,
hornfels,
gnei
ss,
metapelite,
Glob
e-Mi
ami,
AZ
Schi
st,
(some
weathered)
Schi
st,
quartz-mica, weathered, Dawson Co
unty
, GA
Serp
enti
ne
Shale, Ba
ngor
, PA
, Ordovician
Shale, Nonesuch Fm., Precambrian
Reference
5 56 30 1 6 36 1 1 6 39 5 18 21 10 6
.30
0.7
0.3
0.2
0.0
2
0.2
0.6 .66
A. A
30.7
0.6 1.5
2.2
3
1.8
A.I
2.5 1.8
5
8 6.0
8.A
2
49.3
58
. A
8.5 1.7
.78
1.2
1.6 .669
1.5 .62
.80
.88
1.3
0
1.5A
2 2.6
3.1
2
38 A6.
9
2. A 1.0
1.6
11 6 7 2 2 1 A 1 2 2 2 8 2 3 10 7 5 5

Tabl
e 4.
2.7.
Porosities of Me
tamo
rphi
c Rocks
(per
cent
) (each
rock
type ar
rang
ed by in
crea
sing
me
an porosity).
33
Rock
Number of
Sa
mple
sMi
nimu
mMa
ximu
mMean
Reference
Shale,
Shale,
Shale,
Shale
Shale,
Shale,
Shale,
Shale,
Shale,
Shale,
Shale,
Shale,
Shal
e
Shale,
Shale,
Shal
e
Skarn,
Skarn,
Ophi
r Fm.
, UT,
Cambrian
John
son
Camp
, AZ
Devonian - Mi
ssis
sipp
ian
Silu
rian
Penn
sylv
ania
n &
Perm
ian
clay,
Pennsylvanian
Mississippian
Wellington Fm
. , Selma, KS,
Perm
ian
clay
s & mu
dsto
nes
, Cretaceous
clay,
Jura
ssic
East
ern
Vene
zuel
a, Ol
igoc
ene
& Mi
ocen
e
Ft.
Unio
n Fm
. , MT
, Pa
leoc
ene
clay
s, Mi
ocen
e
Silv
er City,
NM
Chin
o, NM
4 1 5 20 7 5 23 2 2 34 11 40 29 3 8 2 8
1.6
7.6
1.4
9.7
7.1
17.2
9.7
11.0
15.3
15.5
0.8
42.3
8.8
30.7
9.1
35.8
6.2
42.2
21.2
36.9
3.96
5.24
.73
9.43
.75
2.12
5.9
6 6.6
8.8
9.9
10.4
15.4
18.8
20.2
21.7
23.8
27.2
31.9
20-40
4.60
4.65
5 2 5 3 5 5 5 5 5 5 5 5 7 5 5 1 2 2

Table
4.2.
7.
Poro
siti
es of Metamorphic
Rock
s (percent)
(eac
h rock type ar
rang
ed by
increasing me
an porosity).
Rock
Number of
Sa
mple
s Mi
nimu
m Ma
ximu
m Mean
34
Skarn, Jo
hnso
n Camp,
AZ,
(tre
moli
te,
muscovite, qu
artz
, magnetite, he
mati
tes
Slate, Ca
rrol
l & Frederick
Counties,
MD
Slate, black
Slate, Ne
gaun
ee Ir
on Fm
., Precambrian
Slate, Gl
obe-
Miam
i, AZ
Slat
e
Slat
e
Slate, De
vonian
Slate, shale
Slat
es,
silts
& cl
ays,
Carb
onif
erou
s
Tonalite
1 3 3 2 1 76 6 21 2
.00
.40
0.1
1.91
1.3
.49
1.2
2.9
1.06
.50
4.3
5.66
13.0
7.55
14.3
11.5
14.7
.49
0.6
0.73
0.8
3.12
3.3
3.95
5.7
7.0
Reference
2 11 5 5 2 8 1 5 4 5 9

35
Table
4.2.
7.
Poro
siti
es of
Metamorphi
c Ro
cks
(percent)
(each
rock ty
pe arranged by in
crea
sing
me
an po
rosi
ty).
References fo
r Ta
ble
4.2.7.
1.
Schoeller, 19
62;
4.
Meinzer, 1923;
7.
U.S. Ge
ol.
Surv
ey 1964;
10.
Stew
art,
1964;
2.
Nort
on and
Knapp, 1977
(val
ues
interpolated from ba
r gr
aph)
; 5.
Mang
er,
1963;
8.
Kess
ler
and
Sligh, 1932;
11.
Griffith,
1937;
3.
Morris and
John
son,
1967
6.
Kess
ler
and
othe
rs,
1940
;9.
Saucier, 19
69b;

36
4.3 PERMEABLITY
4.31 General Definitions
The rate of flow of a fluid through any system, porous medium, open
pipes etc., is dependent upon two basic properties: 1) the fluid potential
gradients and 2) the resistance to the flow of that fluid along the
pathway traversed. The determinable "constant" integrating the
"resistance" factors for a porous medium has been labeled "permeability".
Lohman (1972b, p. 9) defines intrinsic permeability as: "a measure of
the relative ease with which a porous medium can transmit a liquid under
a potential gradient. It is a property of the medium alone and is
independent of the nature of the liquid and of the force field causing
movement. It is a property of the medium that is dependent upon the shape and
size of the pores".
4.32 Historical Aspects
Preceeded by Hagen's (1837) and Poiseuille's (1846) work on the laws
affecting the flow of water through capillary tubes, Darcy (1856) performed
a series of experiments on the relationship affecting the downward flow of
water through sands proposed as filtering material for the water supply for the
town of Dijon, France. His experiments developed the relationship:
Q = - kO^-hp/A (2)
where
Q = volume of water crossing unit area in unit time
(L 3/T)
h.,h- = the elevation above a reference level of water
in manometers terminated above and below a
vertical column of sand respectively. (L)
37
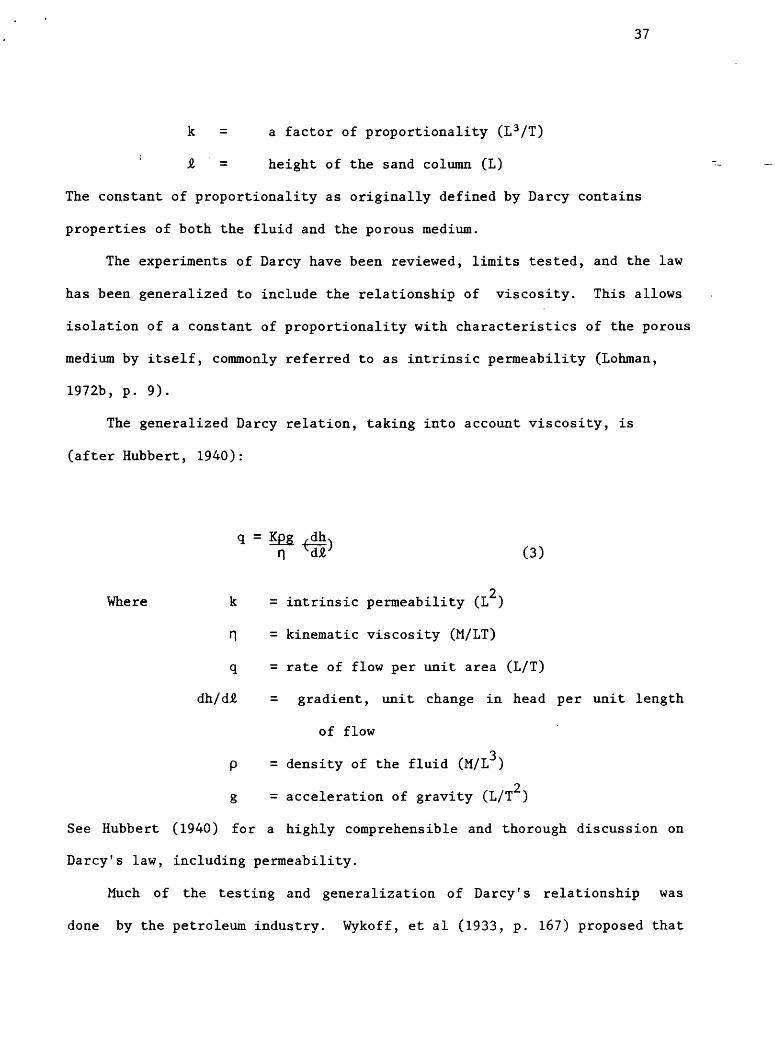
k = a factor of proportionality (L 3 /T)
H = height of the sand column (L)
The constant of proportionality as originally defined by Darcy contains
properties of both the fluid and the porous medium.
The experiments of Darcy have been reviewed, limits tested, and the law
has been generalized to include the relationship of viscosity. This allows
isolation of a constant of proportionality with characteristics of the porous
medium by itself, commonly referred to as intrinsic permeability (Lohman,
1972b, p. 9).
The generalized Darcy relation, taking into account viscosity, is
(after Hubbert, 1940):
q = Kpgn dl O)
2 Where k = intrinsic permeability (L )
H = kinematic viscosity (M/LT)
q = rate of flow per unit area (L/T)
dh/d£ = gradient, unit change in head per unit length
of flow
3 p = density of the fluid (M/L )
2 g = acceleration of gravity (L/T )
See Hubbert (1940) for a highly comprehensible and thorough discussion on
Darcy's law, including permeability.
Much of the testing and generalization of Darcy's relationship was
done by the petroleum industry. Wykoff, et al (1933, p. 167) proposed that

38
this unit of permeability be: "... called a 'darcy' after D'Arcy, who first
formulated the law of porous flow". Using the consistent units specified in
3 equation 3, a permeability of one darcy means a flow rate of 1 cm /sec
2 through a cross section of 1 cm having a length of 1 cm under a pressure
differential of 1 atmosphere for a fluid having a viscosity of 1 centipoise.
Because the permeability of most porous media is less than one darcy and to-3
reduce the use of decimals, the term milli-darcy (10 darcy) is commonly
used in the petroleum industry.
Investigations involving fluids having relatively uniform properties
have superposed the fluid properties onto permeability (matrix)
considerations. For example, in ground-water "a porous medium has a
hydraulic conductivity of unit length per unit time if it will transmit in
unit time a unit volume of ground water at the prevailing viscosity through
a cross section of unit area, measured at right angles to the direction of
flow, under a hydraulic gradient of unit change in head through unit length
of flow" (Lohman, 1972a, p. 6).
4.33 Discussion
In the tables of data (4.3.1 thru 4.3.7) which follow, attempts
have been made to include information about the testing conditions
wherever such data are available. Some of the most important factors
affecting accurate permeability determinations are: 1) the laboratory
conditions of temperature, (see Weinbrandt and others, 1975; and Potter,

39
1978) 2) gradient imposed across the sample, 3) whether the sample was
reloaded and tested under conditions simulating field conditions (see Zoback
and Byerlee, 1975), 4) the composition of the liquid used to do the testing
(See Johnston and Beeson, 1945), and 5) the saturation state. All of these
topics have been addressed and are continuing to be refined in the past and
current literature.
Theoretically, relationships exist between porosity and permeability for
uniform size and shape material. However, in nature the conditions are
rarely met to permit quantitative prediction of permeability based on
porosity measurements. Attempting to summarize the published literature on
this topic is beyond the scope of this chapter, however; recent
introductions into this literature are: Zoback and Byerlee, 1975; Beard and
Weyl, 1973; and Friedman, 1976. A broader treatment of factors affecting
porosity and permeability in sediments can be found in Wolf and Chilingarian
(1976, p. 188-241).
The units chosen for permeability for the tables are centimeters/second.
Data reported in the literature in specific conductivities or in other
units have been converted.
Table 4.3.8 is a conversion chart for the most common "permeability"
units.
4.34 Summary
With a few exceptions, only values for naturally occurring samples are
presented, i.e., values for artificially prepared mixtures were omitted.

40
Also, "soils" in the agricultural sense were eliminated from the following
tabulation; they open a whole new field which is beyond the scope of this
chapter. : The minimum permeability reported in tables 4.3.1 through 4.3.7 is
zero for bedded salt and a maximum of 8.1 cm/sec for basalt "with cavernous
openings".

41Table 4.3.1.
Permeabilities of
Metamorphic Rocks (c
m/se
c).
(Porosities ar
e averages, loading conditions are
k.Pa,
NS =
Not
specified).
Sample Description
(Comments)
// of
Samples
Min
Max
Mean
Permeant
Loading
Testing
Conditions Temp (C)
Porosity
Ref,
Argillite, Eleana Fm.,
NV Test Site,
358m
(Lab
test-vertical
carefully controlled)
Argillite, Eleana Fm.,
NV Test Site,
102
m(L
ab test-vertical,
carefully controlled)
7.8x10⁻¹³
1.1x
10-12
-12
-12
1 3.1x10
3.6x10
water
in-situ
20
water
in-situ
20
NS
NS
Argillite, Eleana Fm.,
NV Test Site,
102 m
(Lab
test-horizontal
carefully controlled)
Argillite, Eleana Fm., NV
Test si
te,
361
m(L
ab test-horizontal
carefully controlled)
Argillite, Eleana Fm.,
NV Test Site,
358m,
fractured
(Lab
test-vertical
carefully controlled)
Argillite, Eleana Fm., NV
Test Site,
361
m(L
ab test-horizontal-
carefully controlled)
-12
-12
1 5.4x10
9.8x10
-12
-12
1 1,1x10
2.3x10
1 7.9xlO~10
l.lx
io"9
2.3x!0"9
3.9xlO~9
water
in-situ
20
water
in-situ
20
water
in-situ
20
water
in-situ
20
NS
NS NS
NS

42
Table
4.3.
1.
Perm
eabi
liti
es of
Me
tamorphic
Rocks
(cm/
sec)
. (P
oros
itie
s are
averages,
load
ing
cond
itio
ns ar
e kPa, NS
=
Not
specified).
Sample De
scri
ptio
n (C
omme
nts)
# of
Sa
mple
sMin
Max
Mean
Permeant
Load
ing
Test
ing
Cond
itio
ns Temp (C)
Porosity
Ref.
Shale, middle Miocene,
Ital
y, 19
57 m
(Lab
te
st)
Shale, Cr
etac
eous
(Lab te
st)
Shale, lower
Pliocene,
Ital
y,
4295
m (L
ab te
st)
Shale, lower
Pliocene,
Italy, 1367 m
(Lab te
st)
Shale, fractured
(Field pu
mpin
g tests)
Slate, Iron River, MI
(Lab
tests)
Slat
e(L
ab tests-vertical)
NS 93 12
2.4x
10-6
2.0x10
-10
1.9x
10-1
0
5.7x10
-3
3.9x
10-8
4.7x
10-8
2.6x
!0"9
NS
3.9x
10-9
4.8x10
3.5x
10-4
4.4x
10-9
9.4x
10-9
NS
3.9x
!0"9
NS NS NS NS
NS
NS
NS NS NS
NS NS NS
16.6
NS 10.3
23.0
wate
r in
-sit
u in
-sit
u NS
NS NS
15.5
15.5
NS NS

Table
4.3.1.
Perm
eabi
liti
es of Me
tamo
rphic
Rock
s (c
m/se
c).
(Porosities
are
aver
ages
, lo
adin
g conditions are
kPa, NS
=
Not
specified).
Sample Description
(Com
ment
s)#
of
Samp
les
Min
Max
Mean
Permeant
Load
ing
Test
ing
Cond
itio
ns Temp (C)
Porosity
Ref.
Schi
st,
quartz-mica,
weathered, Dawson Cy
, GA
(Lab te
sts)
Schi
st,
fractured
(Field pu
mpin
g tests)
Shale, lower
Pliocene,
Ital
y, 49
25 m
(Lab
te
st)
Shale, Pe
nnsy
lvan
ian
(Lab
tests)
Shale, lo
wer
Pliocene,
Ital
y, 35
32 m
(Lab
te
st)
Shale, upper
Triassic,
Ital
y, 61
68 m
(Lab
test)
Shale, lower
Pliocene,
Ital
y, 3054 m
(Lab te
st)
Shale, lo
wer
Pliocene,
Ital
y, 39
19 m
(Lab
test)
21 481
NS
1.9x
10-6
4.7x10
-7
2.7x
10-3
1.2x10
-2
3.8x
lO~4
NS
NS
9.7x10
-12
8.7x10
-11
1.4x
10-10
1.6x10
-10
2.2x10
-10
4.4x
10-10
NS NS NS NS NS NS
15.5
46.9
-3
1.2x10
wate
r in
-sit
u in
-sit
u NS
NS NS NS NS NS
NS NS NS NS NS
NS
NS
5.9
NS 12.0
12.5
13.3
11.1

44
Table
4.3.
1.
Perm
eabi
liti
es of
Me
tamo
rphic
Rocks
(cm/
sec)
. (P
oros
itie
s ar
e averages,
load
ing
conditions ar
e kPa, NS
=
Not
spec
ifie
d).
Samp
le De
scri
ptio
n (C
omme
nts)
# of
Sa
mple
sMi
nMa
xMe
anPe
rmea
ntLo
adin
g Te
stin
g Co
ndit
ions
Te
mp (C)
Porosity
Ref.
Argillite, El
eana
Fm.,
NV Te
st Site
, 10
2 m, fr
actu
red
(Lab
te
st-v
erti
cal
carefully
cont
roll
ed)
Gnei
ss,
fractured
(Field pu
mpin
g tests)
Gree
nsto
ne,
frac
ture
d(Field pu
mpin
g tests)
Meta
sedi
ment
s, fractured,
Placer Cy,
CA(In-situ field
tracer test)
Quar
tzit
e, NV
te
st site
(Lab
tests)
Quar
tzit
e, Marquette
dist
.,
(Lab test)
Quartzite, fractured
(Field pu
mpin
g tests)
Schi
st,
micaceous,
Iron River, MI
(Lab
te
sts)
Schi
st(L
ab tests-vertical)
MI
131
134
135
17
6.0x10
-8
4.7x10
-8
5.7x10
-6
1.7x
10-5
9.4x10
-11
1.9x10
-7
1.9x
10-9
1.1x10
-7
2.6x
10-3
9.9x
10-3
7.2x
10 ̂
4.7x
10-9
2.6x
10-3
1.1x10
-3
7.0x
10
3.8x10
-5
1.6x10
-9
3.7x
10-4
1.8x10
-9
1.9x10
-4
water
in-s
itu
20
-10
9.4x
10
water
NS NS NS
NS
6.6x
10
water
in-s
itu
in-s
itu
NS
.-4
water
in-s
itu
in-s
itu
NS
water
field
field
NS
NS NS
NS 15.5
1.9
NS
wate
r in
-sit
u in
-sit
u NS
NS NS
15.5
NS
15.5
38

45
Tabl
e 4.
3.1.
Pe
rmea
bili
ties
of
Me
tamo
rphic
Rocks
(cm/
sec)
. (Porosities
are
averages,
load
ing
conditions are
kPa,
NS
=
Not
spec
ifie
d)
References fo
r Table
A.3.1.
1.
Stua
rt,
et.
al., 1954;
2.
Stewart, 1964;
3.
Lewi
s, et.
al., 1966;
4.
Gond
ouin
and
Scala, 19
58;
5.
Morris an
d Johnson, 1967;
6.
Lin,
1978;
7.
Rasmussen, 1964;
8.
Negl
ia,
1979
; 9.
Wino
grad an
d Th
orda
rson
, 1975;

Table
4.3.
2.
Perm
eabi
liti
es of Ca
rbon
ate
Rocks
(cm/
sec)
. (P
oros
itie
s are
averages,
load
ing
conditions ar
e kPa, NS
=
Not
spec
ifie
d)
Samp
le Description
(Com
ment
s)//
of
Samp
les
Min
Max
Mean
Perm
eant
Load
ing
Test
ing
Cond
itio
ns Temp (C)
Porosity
Ref.
Carb
onat
e, "s
ome
with large
open
ings
"(Field pu
mpin
g tests)
Chalk, London Basin
(Field pu
mpin
g tests)
Dolo
mite
, 80%, li
mest
one
20%, ea
st TN
(Lab tests)
Dolo
mite
, Ru
stle
r Fm
.,
West
TX (L
ab test-transient)
Dolomite (Lab
test)
Dolomite (Lab te
st-v
erti
cal)
Dolo
mite
, NW Ge
rman
y (Lab test)
Dolo
mite
, McKnight,
TX
(Lab te
sts)
Dolomite (Lab
te
st)
Dolo
mite
, Mississipian
(Lab te
st)
513
4.7x
10
NS 1404
5.8x10
-7
8.7x
10
4.2x10
-11
3.8x
10-9
l.lx
io'
1
1.4x
lO~5
3.8x
!0"8
9.0x
!0"8
3.3x
lO~6
-3
4.4x
10
water
wate
r
9.7x
lO~9
NS
6.6x
!0"8
hydr
.oil
9.7x
lO~7
NS
1.4x
10
water
2.9x
lO~6
NS
5.3x
10
NS
l.Sx
lo"5
NS
2.8x
10
NS
in-s
itu
in-s
itu
NS 10342
NS NS NS NS NS NS
in-s
itu
in-s
itu
NS NS NS 15.5
NS NS NS NS
NS NS NS 0.87
6.3
26 13.0
NS 11.9
27.8
6 9 1 7 2 4 1 5 2 2

47
Table 4.3.2.
Permeabilities of
Carbonate Rocks (c
m/se
c).
(Porosities are
averages, loading conditions ar
e kP
a, NS
=
Not
specified).
Sample Description
(Com
ment
s)#
of
Samples
Min
Max
Mean
Permeant
Loading
Testing
Conditions Temp (C)
Porosity
Ref.
Limestone, Oilman,
CO
(Lab
test)
4.2x10⁻¹³
atmo
s.
NSNS
Limestone, Bi
sbee
, AZ
mining district
(Lab
test)
many
3.3x10⁻¹²
atmos.
NSNS
Limestone,
90%,
dolomite
10%,
ea
st TN
(Lab
te
sts)
Limestone, Tristate district
(Lab
test)
4 5.8xlo"13
6.3xlO~12
22
3.6x10⁻¹²
4.4x10⁻¹¹
NSNS
NS
atmos.
NS
NS NS
11
Limestone,
80%,
dolomite
20%, east TN
(Lab
tests)
3 6.9X10"11
4.6xlo"10
2.8xlo"10
NS
NS
NSNS
11
Limestone, Bone Spring Fm
.,
West TX (Lab
test-transient)
4.7x10⁻¹⁰
hydr.oil
9652
NS0.44
Limestone, crinoidal,
Hanover NM district
(Lab
test)
1.3x!0"9
air
atmo
s.
NSNS
Limestone, Bitter Springs
Fm., Australia
(Lab
test-transient?)
3.9x10
hydr.oil
9652
NS
0.24

Tabl
e 4.
3.2.
Permeabilities of
Ca
rbon
ate
Rocks
(cm/sec).
(Porosities
are
averages,
load
ing
conditions ar
e kPa, NS =
Not
specified).
Samp
le De
scri
ptio
n (C
omme
nts)
// of
Sa
mple
sMin
Max
Mean
Perm
eant
Load
ing
Test
ing
Conditions Te
mp (C)
Porosity
Ref.
Lime
ston
e, do
lomi
tic
NV te
st si
te(Lab te
st)
Lime
ston
e(Lab te
st)
Lime
ston
e, Pe
rmia
n (Lab te
st)
Limestone, oolitic, NW Ge
rman
y (L
ab te
st)
Lime
ston
e, sh
elly
, NW Ge
rman
y (L
ab te
st)
Lime
ston
e, oo
liti
c (L
ab te
st)
Limestone
(Lab
te
st-v
erti
cal)
Limestone, coral-oolitic
NW Ge
rman
y(Lab te
st)
139.
4x!0
"10
4.
7xlO
~6
281.
4xlO
~8
. 7.
5xlO
~3
4.7x
10
9.7x
lO~7
7.4x
lO~6
6.3x
lO~5
2.5x
lO~4
3.2x
lO~4
l.lx
io"3
2.6x
lO~3
tap
water
NS NS NS NS NS wate
r
NS
NS NS NS NS NS NS NS NS
NS NS NS NS NS NS 15.5
NS
2.3
8.4
10.1
19.8
23.6
21.6
30 19.5
10 2 3 1 1 3 4 1

49
Tabl
e 4.3.2.
Perm
eabi
liti
es of
Ca
rbon
ate
Rocks
(cm/
sec)
. (P
oros
itie
s ar
e averages,
load
ing
cond
itio
ns ar
e kP
a, NS =
Not
specified)
Refe
renc
es fo
r Table
4.3.
2.
1.
Englehardt,
1960;
4.
Morr
is an
d Johnson, 1967;
7.
Sany
al,
1971
;10
. Wi
nogr
ad and
Thor
dars
on,
1975;
2.
Murr
ary,
1960;
5.
Warren and
Skib
a, 1961;
8.
Rove
, 1947;
11.
Ohle
, 19
51;
3.
Arch
ie,
1952
;6.
Rasmussen, 19
64;
9.
Satchell and
Wilk
onso
n, 19
73;

Table
4.3.
3.
Permeabilities of
Vo
lcan
ic Rocks
(cm/
sec)
. (P
oros
itie
s ar
e av
erag
es,
load
ing
conditions are
kPa, NS
=
Not
spec
ifie
d).
50
Sample Description
(Com
ment
s)f
of
Samp
les
Min
Max
Mean
Permeant
Load
ing
Test
ing
Cond
itio
ns Te
mp (C)
Porosity
Ref.
Basa
lt,
Oahu,
HI(field pu
mpin
g te
st)
Basa
lt,
modera
tely dense
(NS)
Basalt(Lab te
sts)
Basa
lt,
rhyolite,
trachyte,
frac
ture
d(Field pu
mpin
g tests)
Basa
lt,
Snake
R.,
ID(Estimate
from
field
pump
ing
tests)
Basa
lt,
rhyo
lite
,tra
chyt
e wi
th cavernous
open
ings
(Field pu
mpin
g tests)
Clastics,
volcanic,
Wair
akei
, N.
Z.(field pr
essu
re
build-up.)
Tuff,
welded
NV test si
te(Field pu
mpin
g te
sts)
-
NS NS 93 37 11 10 NS
9.7x10
-2
1.9x10
-9
6.1x10
-5
1.2x10
-1
6.xlO-7
2.9x10
-1
4.2x
10-5
1.3x10
-2
8.1x
10-0
1.0x10
-3
1.4x10
-8
9.4x
10-6
1.2x10
-0
1.3x10
-7
9x10
-10
wate
r in
-sit
u in
-sit
u NS
NS wate
r
NS NS
NS 15.5
7.7
17
-4
9.6x
10
wate
r in
-sit
u in
-sit
u NS
-2
9.7x
10
water
in-s
itu
in-s
itu
NS
water
in-s
itu
in-s
itu
in-s
itu
4
in-s
itu
in-s
itu
in-s
itu
NS
water
in-s
itu
in-s
itu
in-s
itu
5

51
Table
4.3.
3.
Perm
eabi
liti
es of
Vo
lcan
ic Rocks
(cm/
sec)
. (Porosities
are
averages,
load
ing
conditions are
kPa, NS =
Not
specified)
Sample De
scri
ptio
n (C
omme
nts)
# of
Sa
mple
sMin
Max
Mean
Perm
eant
Load
ing
Test
ing
Cond
itio
ns Temp (C)
Porosity
Ref.
Tuff,
clay
ey
NV test si
te(Lab tests)
Tuff
, be
dded
, NV
te
st site
(Lab tests)
Tuff,
weld
ed,
NV test site
(Lab tests)
Tuff,
weld
ed,
NV te
st site
(Lab tests)
Tuff
, be
dded
, NV
te
st si
te
(Lab tests)
Tuff,
fria
ble,
NV
test site
(Lab tests)
Tuff
, zeolitized,
NV te
st si
te(Lab Tests)
Tuff
, fr
iabl
e, NV test site
(Lab te
sts)
Tuff
, pumiceous,bedded,
NV te
st si
te(Lab tests)
38 34
9.4x
10-11
sev.
* 7.
3x10
-10
sev.
8.9x10
sev.
2.1x10
-10
sev.
6.8x
10-8
sev.
8.1x10
-8
2.4x10
-9
sev.
9.2x
10-7
sev.
3-6x10
-6
1.9x10
-5
1.6x10
-5
5.6x
10-5
5.6x10
-5
3.8x
10
2.6x
10
-5
2.8x10
-5
4.0x
10-5
5.9x
10-5
2.8x
10-9
3.9x
10-8
3.2x10
-7
6.4x
10-7
8.7x
10-7
1.3x
10-6
2.4x
10-6
5.8x
10
1.1x
10
-6
water
NS
water
wate
r
water
water
NS NS NS NS NS
water
NS NS NS
NS NS NS NS NS NS NS NS NS
11.0
38.8
14.1
14.1
38.8
35.5
37.7
35.5
40.2

52
Tabl
e 4.
3.3.
Perm
eabi
liti
es of
Vo
lcan
ic.
Rocks
(cm/
sec)
. (Porosities
are
averages,
load
ing
conditions ar
e kPa, NS
=
Not
spec
ifie
d).
Sample Description
(Com
ment
s)#
of
Samp
les
Min
Max
Mean
Permeant
Load
ing
Test
ing
Cond
itio
ns Temp (C
) Porosity
Ref,
Tuff
, pu
miceous, be
dded
, NV
test si
te(L
ab te
sts)
Tuff
Tuff
(Lab
tests-vertical)
(Lab
te
sts-
hori
zont
al)
Tuff
, tu
ffac
eous
sa
ndst
one
NV test si
te(Maximum =
frac
ture
s lab
tests)
sev.
4.0x10
44 44
-6
4.7x10
-9
4.7x10
-9
7.2x
10-5
8.0x
10-4
8.0x
10-4
2.0x
10-5 .-4
2.4x
10
6.5x
10-3
water
NS
NS
1.9x10 "
wate
r NS
,-4
NS NS
NS 15.5
15.5
NS
40.2
41 41

Table
4.3.
3.
Permeabilities of
Vo
lcan
ic Ro
cks
(cm/sec).
(Por
osit
ies
are
averages,
load
ing
conditions are
kPa,
NS
=
Not
spec
ifie
d)
References fo
r Ta
ble
4.3.3.
1.
Kell
er,
I960
4.
Rasmussen, 1964;
7.
Grin
dley
, 19
65;
2.
Davis, 19
69;
5.
Wino
grad
, 1971;
8.
Butt
ers
et.
al.,
19
76;
3.
Morr
is and
Johnson, 1967;
6.
Wino
grad
an
d Thordarson,
1975;

54
Tabl
e 4.
3.4.
Pe
rmea
bili
ties
of
Ev
apor
ites
(c
m/se
c) (P
oros
itie
s ar
e averages,
load
ing
conditions ar
e kPa, NS
=
Not
specified).
Sample Description
(Comments)
# of
Samp
les
Min
Max
,, r,
Load
ing
Test
ing
Mean
Permeant
_ ,.,.
,-;
; >
r. ..
n
rCo
ndit
ions
Temp (C)
Porosity
Ref.
Gyps
um,
Cast
ile
Fm.,
West
TX (L
ab te
st-
vert
ical
tr
ansi
ent?
)
Gyps
um,
Cast
ile
Fm.,
West TX (L
ab test-
horizontal tr
ansi
ent?
)
Salt,
bedd
ed,
Hutchinson,
KS
(Lab
te
st)
Salt
, dome,
Gran
d Sa
line
, TX
(Lab test
)
Salt
, dome,
Grand
Sali
ne,
TX
(Lab test
)
Salt,
dome,
Gran
d Sa
line
, TX
(Lab
test
)
Salt
, dome,
Grand
Sali
ne,
TX
(Lab
te
st)
Salt,
dome,
Gran
d Sa
line
, TX
(Lab
te
st)
Salt,
dome,
Grand
Saline,-TX
(Lab test
)
4.9x
10
.-10-1
0
2x10
4.9x
10-1
0
2.7x
10-8
5.3x10
-8
1.5x10
-7
1.4x10
-7
2.2x
10
5.9x10
-8
4.9x
10
9.8x
10
-7
2.1x
10-7
4.3x
10-7
4.4x
10-7
1.2x10
-10
3.0x
10-8
Hydr
. oil
11031
NS
Hydr
. oi
l 11
031
NS
Ker
Ker.
Ker.
Brine
Brine
16892
NS
Brine
22063
NS
1723
6 NS
Brine
75884
NS
1103
1 NS
7584
NS
7884
NS
4.8
4.6
NS NS NS NS NS NS NS

55
Table 4.
3.4.
Permeabilities of
Evaporites (cm/sec) (Porosities ar
e averages, loading conditions ar
e kPa, NS =
Not
specified).
Sample Description
(Com
ments)
Salt,
dome,
Grand Sa
line
, TX
(Lab test
)
Salt,
dome,
Grand Saline,
TX
(Lab
te
st)
Salt,
dome,
Grand Saline, TX
(Lab
te
st)
Salt,
dome,
Grand Sa
line
, TX
(Lab
test)
Salt,
bedded, Huchinson, KS
(Lab
test)
Salt,
bedd
ed,
Hutchinson, KS
(Lab
te
st)
Salt,
bedded, Hutchinson, KS
(Lab
te
st)
Salt
, be
dded
, Hutchinson, KS
(Lab
test)
Salt
, be
dded
, Hutchinson, KS
(Lab
test)
Salt,
bedd
ed,
Hutchinson, KS
(Lab
test)
Salt,
dome
, Grand Sa
line
, TX
(Lab
test
)
# of
Samples
1 1 1 1 1 1 1 1 1 1 1
Min
1.7x!0"
7
l.lxlO~7
3.1xlO~6
1.7xlO~6
OxlO~°
OxlO~°
OxlO~°
Ox!0"°
Ox!0"°
OxlO~°
OxlO~°
Max
9.8xlO~7
3.9xlO~6
4.1xlO~6
6.1xlO~6
OxlO~°
7.1xlO~9
1.5xlO~9
Ox!0"°
Ox!0"°
Ox!0"°
1.4xlO~7
..
Loading
Testing
Mean
Permeant
_ ,.
. .
_, ,;
;,.
Conditions Temp (C)
Porosity
Ref.
Ker.
Brine
Ker.
Ker.
Brine
Brine
Brine
Brine
Brine
Ker
Brine
3792
3792
3792
3792
7584
7584
1482
4
1034
2
3447
3792
7584
NS NS
NS
NS NS NS NS NS NS NS
NS
NS NS NS NS NS
NS NS
NS NS NS
NS
1 1 1 1 1 1 1 1 1 1 1

i 56
Table
4.3.
4.
Permeabilities of
Evaporites (c
m/se
c) (Porosities
are
averages,
load
ing
conditions ar
e kPa, NS =
Not
spec
ifie
d).
Sample De
scri
ptio
n #
of
...
.. .,
_, Lo
adin
g Te
stin
g,~
\
, Mm
Max
Mean
Pe
rmea
nt
..
..
T fr ^
n
- r.
c(C
omme
nts)
Sa
mple
s Conditions Temp (C)
Porosity
Ref.
Salt,
dome,
Gran
d Sa
line
, TX
1 OxlO~°
4.9x
lO~8
Brin
e 11031
NS
NS
1 (Lab te
st)

57
Table
4.3.
4.
Perm
eabi
liti
es of Evaporites (c
m/se
c).
(Por
osit
ies
are
aver
ages
, lo
adin
g co
ndit
ions
ar
e kPa, NS =
not
specified)
References for
Table
4.3.
4.
1.
Gloyna an
d Reynolds,
1961
; 2.
Sany
al,
1971.

58
Tabl
e 4.
3.5.
Pe
rmea
bili
ties
of Ho
locr
ysta
llin
e Rocks
(cm/sec).
(Por
osit
ies
are
averages,
load
ing
cond
itio
ns are
kPa, NS
=
Not
spec
ifie
d).
Samp
le De
scri
ptio
n (C
omme
nts)
# of
Sa
mple
sMin
Max
Mean
Perm
eant
Load
ing
Test
ing
Cond
itio
ns Te
mp (C)
Porosity
Ref.
Diab
ase,
Hu
dson
, NY
(L
ab te
st)
Gabb
ro,
weathered
(Lab
tests)
Granite, 25
24 m*
(Lab
tests)
Granite, 29
02 m
(Lab tests)
Granite, Barr
iefi
eld,
On
tari
o (L
ab te
st)
Granite, Sh
erma
n Granite, Laramie, WY
(Lab
te
st)
Gran
ite (Field pu
mpin
g test)
Granite, Qu
incy
, MA
(Lab
te
st)
Granite, Ha
rdha
t(F
ield
te
st-h
oriz
onta
l)
Granite, Ha
rdha
t(Field te
st-v
erti
cal)
4.7x
10-5
1.2x10
-11
8.6x
10-11
3.8x
10-4
1.9x10
1.5x10
-9
S.lx
io"13
NS
1.9x
10-4
4.9X
10"11
NS
l.xl
O
,-9
4.4x
10
4x10
7x10
NS NS
NSNS
water
NS
water
vari
able
24
wate
r va
riab
le
24
NS NS
NS NS
NS
15.5
43 NS NS NS NS
4.0x
10
wate
r in
-sit
u in
-sit
u NS
,-9
NSNS
NS
in-s
itu
in-s
itu
NS
in-s
itu
in-s
itu
NS

59
Table 4.
Permeabilities of
Holocrystalline Rocks (cm/sec).
(Porosities ar
e averages, loading conditions ar
e kP
a, NS =
Not specified).
Sample Description
(Com
ment
s)#
of
Samples
Min
Max
Mean
Permeant
Loading
Testing
Conditions Temp (C)
Porosity
Ref.
Granite, Sherman Granite,
Laramie, WY,
jointed
(Fie
ld pumping test)
Granite, diorite & ga
bbro
, coarse grained fractured
(Field pumping te
sts)
Granite, weathered
(Lab tests)
106
4.7xlO~7
4.2xlO~3
3.3xlO~4
5.2x!0"3
9.8x10⁻⁷
1.6x
10-3
water
in-situ
in-situ
NS
-4
4.2x10
water
in-situ
in-situ
NS
water
NS
15.5
45
Igneous-metamorphic, undifferentiated
fractured
556
(Field pumping tests)
9.4x!0"8
1.9x
!0"2
8.5x10⁻⁵
water
in-situ
in-situ
NS
Intrusive, unspecified, Marquette
district, MI
(Lab te
sts)
2.7x10
4.6x10⁻⁹
NS
NS
15.5
NS
Iron Or
e, hematitic et
c. ,
Iron River &
Marquette districts,
MI(Lab tests)
291.3x!0"10
3.3x!0"5
1.3x10
-6NS
NS15
.5
NS

60
Tabl
e 4.
3.5.
Permeabilities of
Holocrystalline
Rocks
(cm/sec).
(Porosities
are
aver
ages
, lo
adin
g co
ndit
ions
ar
e kP
a, NS =
Not
specified)
References fo
r Table
4.3.5.
1. St
uart
et.
al.
, 1954;
4. Po
tter
, 19
78;
7. Bo
ardm
an an
d Sk
rove
, 1966;
2.
Morris and
Johnson, 1967;
5.
Rasmussen, 19
64;
8.
Pratt
et.
al., 1974;
3.
Delisle, 19
75;
6.
Ohle,
1951;

61
Table 4.3.6.
Permeabilities of Indurated Sedimentary Rocks
(cm/sec).
(Porosities are
averages, loading conditions ar
e kPa, NS =
Not
specified)
Sample Description
(Com
ment
s)#
of
Samples
Min
Max
Mean
Permeant
Loading
Testing
Conditions Temp (C)
Porosity
Ref.
Aquicludes, Alberta, Canada
(Simulation modeling results-
large
scale)
Aquifers, Alberta, Canada
(Simulation modeling results-
large
scale)
Argillite, siltstone
NV test site
(Lab
te
sts)
Arkose, coarse,
Stockton
Fm., S.E. PA
(Lab
test-vertical)
Arkose, med.,
Stockton
Fm., S.E. PA
(Lab
test-vertical)
Arko
se,
med.,
Stockton
Fm., S.E. PA
(Lab
test-horizontal)
Arko
se,
fine,
Stockton
Fm., S.E. PA
(Lab test-vertical)
Arkose, vy co
arse
, Stockton
Fm., S.E. PA
(Lab
test-vertical)
5.X
10"
11
l.x
io"
4.x
lO-5
l.xlO
-3
3.3
xlO
~U
3.3
xlO
~10
9.4x10
1.4x
10
4.7x10
4.7x10
-11
1.4x
10-7
3.3x10⁻⁷
water
in-situ
in-situ
NS
water
in-situ
in-situ
NS
water
NS
water
NS
water
NS
water
NS
water
NS
water
NS
NS NS NS NS NS NS
2.0
7.9
16.1
16.1
14.4
10.9
22 22 24

62
Table
4.3.
6.
Perm
eabi
liti
es of
Indurated
Sedimentary
Rocks
(cm/
sec)
. (P
oros
itie
s ar
e averages,
load
ing
conditions ar
e kPa, NS
=
Not
specified),
Sample De
scri
ptio
n (C
omme
nts)
# of
Samp
les
Min
Max
Mean
Perm
eant
Load
ing
Test
ing
Conditions Te
mp (C)
Porosity
Ref.
Arko
se,
vy co
arse
, Stockton Fm.,
S.E. PA (L
ab te
st-v
erti
cal)
Arko
se,
vy co
arse
, St
ockt
on Fm., S.E. PA
(Lab
te
st-h
oriz
onta
l)
Arko
se,
vy co
arse
, St
ockt
on Fm., S.E. PA
(Lab
test-horizontal)
Arko
se,
med.
, St
ockt
on
Fm.,
S.E. PA
(Lab
te
st-v
erti
cal)
Arko
se,
med.
, Stockton
Fm.,
S.E. PA
(Lab
test-horizontal)
Arko
se,
fine,
Stockton
Fm.,
S.E. PA
(Lab
test-horizontal)
Arko
se,
coar
se,
Stockton
Fm.,
S.E. PA
(Lab test-horizontal)
Arko
se,
coar
se,
Stockton
Fm., S.E. PA
(Lab
te
st-v
erti
cal)
4.2x
10-7
4.7x
10-7
4.7x
10-7
9.4x
10-7
1.4x10
-6
1.4x10
-6
1.9x10
-6
water
NS
4.7x
!0"7
wate
r NS
wate
r NS
wate
r NS
water
NS
water
NS
wate
r NS
NS NS NS NS
wate
r NS
NS NS NS NS
19.4
10.9
19.4
25.6
25.6
14.4
19.2
19.2

63
Table
4.3.
6.
Permeabilities of
Indurated
Sedimentary
Rocks
(cm/
sec)
. (P
oros
itie
s are
averages,
load
ing
cond
itio
ns ar
e kPa, NS =
Not
spec
ifie
d),
Sample Descri
ption
(Com
ment
s)#
of
Samp
les
Min
Max
Mean
Perm
eant
Load
ing
Test
ing
Cond
itio
ns Temp (C
) Po
rosi
ty
Ref.
Arko
se,
med.,
Stoc
kton
Fm.,
S.E.
PA (L
ab te
st-v
erti
cal)
Arko
se,
med.
, St
ockt
on
Fm.,
S.
E. PA
(Lab test-horizontal)
Cher
t, Onverwacht Group
Sout
h Africa
(Lab
te
st)
Cher
t, Keewatin,
Cana
da(L
ab te
sts-
tran
sien
t?)
Cher
t, Iron R.,
MI
(Lab tests)
Chert, Onverwacht Group
Sout
h Af
rica
(Lab
te
sts-
tran
sien
t?)
Chert(Lab test)
Clay
ston
e(L
ab te
sts-
vert
ical
)
Coal
, Pricetown, WV
(Field tests)
9.7x
lO~13
2.0x
lO~8
7.0x10
-9
2.3x10
-9
6.4x
10-7
8.3x10
-9
9.4x10
1.4x10
-6
1.1x10
-10
8.xlO
1.9x10
-7
9.4x
10-8
water
NS
water
4.8x
lO~13
br
ine
NS NS
1.6x
lO~10
NS
NS
air
water
NS
NS NS NS
hydr.oil
1103
2 NS 15
.5
hydr.
oil
1103
2 NS
2068
NS 15
.5
30.6
30.6
0.5
0.10
NS 0.72
1.7
43
in-s
itu
in-s
itu
in-s
itu
NS
15 14 14 16

! 64
Ta
ble
4.3.
6.
Perm
eabi
liti
es of
Indurated
Sedimentary
Rocks
(cm/
sec)
. (P
oros
itie
s are
averages,
load
ing
cond
itio
ns ar
e kPa, NS
=
Not
specified)
Samp
le De
scri
ptio
n (C
omme
nts)
# of
Sa
mple
sMin
Max
Mean
Permeant
Load
ing
Test
ing
Cond
itio
ns Temp (C)
Poro
sity
Ref.
Coal
Campbell Cy
., WY
(Fie
ld te
sts-
hori
zont
al)
Coal,
Camp
bell
CY., WY
(Fie
ld te
st-v
erti
cal)
Cong
lome
rate
, vy co
arse
, St
ockt
on Fm., S.
E. PA
(Lab
te
st-h
oriz
onta
l)
Cong
lome
rate
, vy co
arse
, St
ockt
on Fm., S.E. PA
(Lab
te
st-v
erti
cal)
Conglomerate,
vy co
arse
, St
ockt
on Fm., S.
E. PA
(Lab te
st-v
erti
cal)
Conglomerate,
vy co
arse
, St
ockt
on Fm
., S.
E. PA
(Lab test-horizontal)
Graywacke, Ir
on R.
, MI
(L
ab tests)
Graywacke, lo
w rank,
Weir Fm
.,(Lab test
s-ho
rizo
ntal
)
NS3.
5xlO
~4
2.5x
lO~10
1.3x
lO~7
wate
r in
-sit
u in
-sit
u NS
1.2x10
water
in-s
itu
in-s
itu
NS
1.4x10
-7
1.9x10
-7
3.3x
10-7
4.2x10
-7
2.5x
10-8
6.8x
10-7
water
NS
water
NS
wate
r NS
wate
r NS
NS NS
NS
NS NS NS NS
3447
3 NS
7.1
7.1
17.3
17.3
15.5
NS 13.4
23 23 12

65
Table
4.3.
6.
Perm
eabi
liti
es of
Indurated
Sedimentary
Rock
s (c
m/se
c).
(Por
osit
ies
are
aver
ages
, lo
adin
g conditions ar
e kPa, NS
=
Not
spec
ifie
d).
Samp
le Descri
ption
(Com
ment
s)#
of
Samp
les
Min
Max
Mean
Permeant
Load
ing
Test
ing
Cond
itio
ns Te
mp (C)
Poro
sity
Ref.
Gray
wack
e, low
rank,
Weir Fm.,
(Lab
te
sts-
vert
ical
)8.
6xlO
~7
NS34473
NS13.2
12
Gray
wack
e, lo
w rank,
Brad
ford
Fm.,
(Lab
te
sts-
vert
ical
)9.
1xlO
~7
9.2x
lO~7
9.2x
10-7
NSat
mos.
NS
11.0
12
Gray
wack
e, low
rank
, We
ir F
m.,
(Lab te
sts-
hori
zont
al)
1.0x
lO~6
3-lx
lo"6
1.8x
10-6
NSat
mos.
NS
14.6
12
Graywacke, low
rank
, We
ir Fm.,
(Lab
te
sts-
vert
ical
)1.
6xlO
~6
4.5x
!0"6
2.6x
10-6
NSat
mos.
NS
14.3
12
Graywacke, lo
w ra
nk,
Brad
ford
Fm.,
(Lab
te
sts-
hori
zont
al)
2.9x
10-6
NS34
473
NS9.2
12
Graywacke, low
rank,
Brad
ford
Fm
.,(L
ab te
sts-
hori
zont
al)
3 4.
6xlO
~7
9.9x
lO~6
3.9x
!0"6
NSat
mos.
NS
10.4
12
Gray
wack
e, fr
actu
red,
Me
ndoc
ino
Cy., CA
(Field tr
acer
test)
7.0x
lo"6
1.2x
!0"4
4.5x
10-5
wate
r in
-sit
u in
-sit
u NS
Gray
wack
e, low
rank,
Brad
ford
Fm.,
4.8
-7x1
0NS
3447
3 NS
10.1
Lab
test
s-ve
rtic
al

66
Tabl
e 4.
3.6.
Permeabilities of
Indurated
Sedimentary
Rocks
(cm/
sec)
. (P
oros
itie
s are
averages,
load
ing
cond
itio
ns ar
e kPa, NS
=
Not
specified)
Sample De
scri
ption
(Com
ment
s)
Mudstone,
Tria
ssic
, SC
(fie
ld pu
mpin
g te
st)
Mudstone,
Triassic,
SC(Field pu
mpin
g test)
Sand,
Clarendon
Fm.,
PA
(L
ab te
st-v
erti
cal)
Sand
, Br
adfo
rd Fm., PA
(Lab test-horizontal)
Sand,
Brad
ford
Fm., PA
(Lab te
st-v
erti
cal)
Sand,
Brad
ford
Fm., Pa
(Lab te
st-v
erti
cal)
Sand,
2d Ve
nang
o Fm
., PA
(Lab te
st-v
erti
cal)
Sand
, Wa
nett
e Fm
., OK
(Lab
te
sts-
hori
zont
al)
Sand,
Kane Fm
., PA
(Lab te
st-h
oriz
onta
l)
Sand,
Kane
Fm
., PA
(Lab te
st-v
erti
cal)
Sand
, Wilcox Fm., OK
(Lab te
sts-
hori
zont
al)
c *
?f
Min
Max
Samp
les
1 1 6 7.
3xlO
~8
3.2x
lO~6
5 3.
5xlO
~7
3.1x
lO~6
8 S.
Oxlo
"7
4.4x
lO~6
38
6.1x
lo"8
1.3x
lO~4
8 8.
0xlO
~7
1.3x
lO~4
7 2.
4xlO
~6
1.6x
lO~4
2 3.
2xlO
~5
5.9x
lO~5
5 1.
3xlO
~6
2.1x
lO~4
2 7.
3xlO
~5
8.5x
lO~5
Mean
3.8x
lO"
1:
1.7x
lO~9
1.3x
!0"6
1.7x
lO~6
2.1x
lO~6
7.0x
lO~6
3.3x
lO~5
3.6x
lO~5
4.5x
lO~5
6.9x
lO~5
7.9x
lO~5
Permeant
Load
ing
Test
ing
Cond
itio
ns Te
mp (C)
Poro
sity
Ref.
in-s
itu
in-s
itu
in-s
itu
3
in-s
itu
in-s
itu
in-s
itu
3
wate
r
wate
r
wate
r
water
water
water
wate
r
water
NS NS NS NS NS NS NS NS NS
NS NS NS NS NS NS NS NS NS
14.6
13.1
12.9
11.7
14.3
16.8
22.1
17.6
14.2
19 19

67
Table 4.3.6.
Permeabilities Of
Indurated Sedimentary Rocks (cm/sec).
(Porosities are
averages, loading conditions are
kPa,
NS =
Not
spec
ifie
d),
Sample Description
(Comments)
# of
Samples
Min
Max
Mean
Permeant
_ ,. _.
, ,;L
..
n f
Conditions Temp (C)
Porosity
Ref.
Sand,
3d.
Venango Fm., PA
(Lab test-vertical)
Sand,
Wanette Fm., OK
(Lab tests-vertical)
Sand,
Johnson Fm., OK
(Lab
tests-horizontal)
Sand,
Woodbine Fm., E.TX
(Lab
test-horizontal)
Sand,
Cromwell Fm., OK
(Lab
tests-horizontal)
Sand,
Johnson Fm., OK
(Lab tests-vertical)
Sand,
Berea Fm., OK
(Lab
tests-vertical)
Sand,
Cromwell Fm., OK
(Lab
tests-vertical)
Sand,
Wilcox Fm., OK
(Lab
tests-vertical)
Sand,
Woodbine Fm., E.
TX
(Lab
test-vertical)
Sand,
2d Venango Fm., PA
(15.
5)
13 13 14
1.5x10⁻⁸
1.1x
10-5
7.7x10⁻⁷
1.9x10⁻⁵
3.7x10⁻⁵
7.9x10⁻⁷
2.5x10⁻⁴
5.2x10⁻⁵
7.6x10 e
1.1x10
4X10
1'1-4
5.2x10⁻⁴
4.7x10⁻⁴
2.7x10⁻⁴
3.3x10⁻⁴
6.4x10⁻⁴
6.7x10⁻⁴
2.8x10⁻⁴
7.4x10⁻⁴ -4
6.5x10
3.2xlO~3
-5X10⁶
'4
1 1 1 1 2 2 2 2 2 1
.0x10
.1x10
.2x10
.7x1
0
.2x10
.5x1
0
.6x10
.8x10
.9x1
0
.2x10
-5xl03
*T
-4 -4 -4 -4 -4 -4 -4 -4 -3 .4
air
NS
water
NS
water
NS
water
NS
water
NS
water
NS
water
NS
water
NS
water
NS
water
NS
-5
water
NS
NS
NS
NS NS
NS NS
NS
NS
NS NS
11,
16,
15.
26,
20,
14,
19.
19 13 24,
NS
.5 .5 .9 .3 .0 .1 .4 .8 .1 .6
8 8 8 8 8 8 8 8 8 8 8

Table 4.3.6.
Permeabilities of
Indurated Sedimentary Rocks (c
m/se
c).
(Porosities are
averages, loading conditions ar
e kPa, NS - Not specified)
Sample Description
(Comments)
// of
Samples
Min
Max
Mean
Permeant
Loading
Testing
Conditions Temp (C)
Porosity
Ref.
Sandstone, fn-vy fn,
clayey
& silty, L.Cretaceous,
W. Canada,
2012 m
(Lab
test-vertical
d50 =
40)
Sandstone, vy fn,
clayey
& silty, L. Cretaceous,
W. Canada,
1414 m
(Lab
test-vertical
d50
= 10
0)
Sandstone, fn-vy fn,
silty &
clayey,
L.Cretaceous,
W. Canada 1924 m
(Lab test-vertical
d50
= 100)
Sandstone, vy fn,
clayey &
silt
y, L.Cretaceous,
W. Canada, 1414 m
(Lab
test-horizontal
d50 =
100)
Sandstone, fn,
clayey &
silt
y,L. Cretaceous,
W. Ca
nada
, 1519 m
(Lab test-vertical
d50
=
135)
1.0x
lO~12
2.9xlO~12
-1 O
_11
4.7x10
1.1x10
1.6x10⁻¹³
1.9x10⁻¹²
1.9x10⁻¹²
7.7x10⁻¹²
1.9x10⁻¹¹
brine
in-situ
36
brine
in-situ
35
brine
in-situ
35
NS NS
varied
varied
35-36
NS
varied
varied
35-36
NS NS
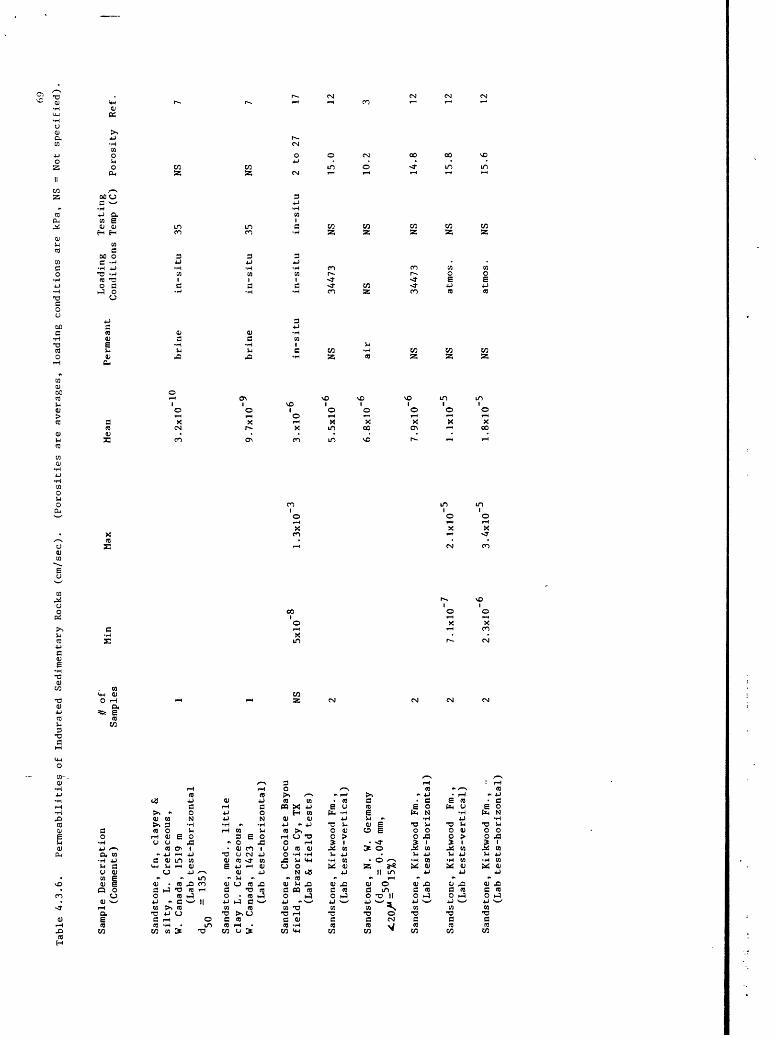
Table
4.3.6.
Perm
eabi
liti
es of In
dura
ted
Sedimentary
Rocks
(cm/
sec)
. (Porosities
are
averages,
load
ing
cond
itio
ns ar
e kPa, NS
=
Not
specified)
Samp
le Description
(Com
ment
s)//
of
Samp
les
Min
Max
Mean
Perm
eant
Load
ing
Test
ing
Cond
itio
ns Te
mp (C)
Poro
sity
Re
f.
Sand
ston
e, fn
, clayey &
silt
y, L. Cr
etac
eous
, W.
Ca
nada
, 1519 m
(Lab test-horizontal
d50
= 135)
Sandstone, med. ,
li
ttle
clay L. Cr
etac
eous
, W.
Ca
nada
, 1423 m
(Lab
te
st-h
oriz
onta
l)
Sandstone, Chocolate
Bayo
u field, Br
azor
ia Cy
, TX
(Lab &
field
tests)
Sandstone, Ki
rkwo
od Fm.
, (L
ab te
sts-
vert
ical
)
Sand
ston
e, N. W. Ge
rman
y (d
=
0.04 mm,
U
Sandstone, Ki
rkwood Fm.
,(L
ab te
sts-
hori
zont
al)
Sand
ston
e, Kirkwood
Fm.
, (Lab te
sts-
vert
ical
)
Sandstone, Kirkwood Fm
.,
(L
ab te
sts-
hori
zont
al)
NS5x10
-8
7.1x10
-7
2.3x10
-6
1.3x
10-3
2.1x10
-5
3.4x10
-5
3.2x
10-10
9.7x
10-9
3.xl
O
5.5x10
6.8x
10-6
7.9x
10-6
1.1x
10-5
1.8x
10-5
brine
NS NS NS NS
in-s
itu
35
brin
e in
-sit
u 35
NS NS
in-s
itu
in-s
itu
in-s
itu
2 to
27
17
3447
3 NS
NSNS
34473
NS
atmo
s.
NS
atmo
s.
NS
15.0
10.2
14.8
15.8
15.6
12 12 12 12

70
Table
4.3.
6.
Permeabiliti'es
of Indurated
Sedimentary
Rock
s (c
m/se
c).
(Porosities
are
averages,
load
ing
cond
itio
ns ar
e kPa, NS
=
Not
spec
ifie
d)
Samp
le De
scri
ption
(Com
ment
s)#
of
Samp
les
Min
Max
», r.
Load
ing
Test
ing
Mean
Pe
rmea
nt
,.,_.
_ f~
^
...
n ,-
Cond
itio
ns Te
mp (C)
Poro
sity
Kef.
Sand
ston
e, "B
romi
de Fm.
, OK
(Lab tests)
Sand
ston
e, N. W.
Ge
rman
y (d
=
0.04
mm
,
1371
3.1x
10-5
3.4x
10-5
NSNS NS
NS NS
NS 24.5
11
Sand
ston
e, med. ,
li
ttle
clay
L. Cr
etac
eous
, W.
Cana
da,
1423 m
(Lab te
st-v
erti
cal)
Sand
ston
e, vy
fn to
fn
, Tensleep,
WY(Lab tests,
<12%
cl
ay si
ze)
Sandstone, si
ltstone,
shal
e, fr
actu
red
(Fie
ld pu
mpin
g tests)
Sand
ston
e, N. W. Ge
rman
y(d
=
0.09 mm,
<20/su3.1%)
Sandstone, N. W.
Ge
rman
y(d
= 0.
35 mm,
<20^ =
6.5%)
Sand
ston
e, N. W. Ge
rman
y
50
= 0.
10 mm
, =
7.5%
)
many
326
4.7x
107.
1x10
-3
4.0x
10-5
6.6x
10-5
7.1x
10-5
9.7x
10-5
1.0x10
-4
1.7x10
-4
brine
in-s
itu
35
air
NSNS
NS 13.8
wate
r in
-sit
u in
-sit
u NS
air
NS
air
NS
air
NS
NS NS NS
19.0
24.7
27.2
21 13
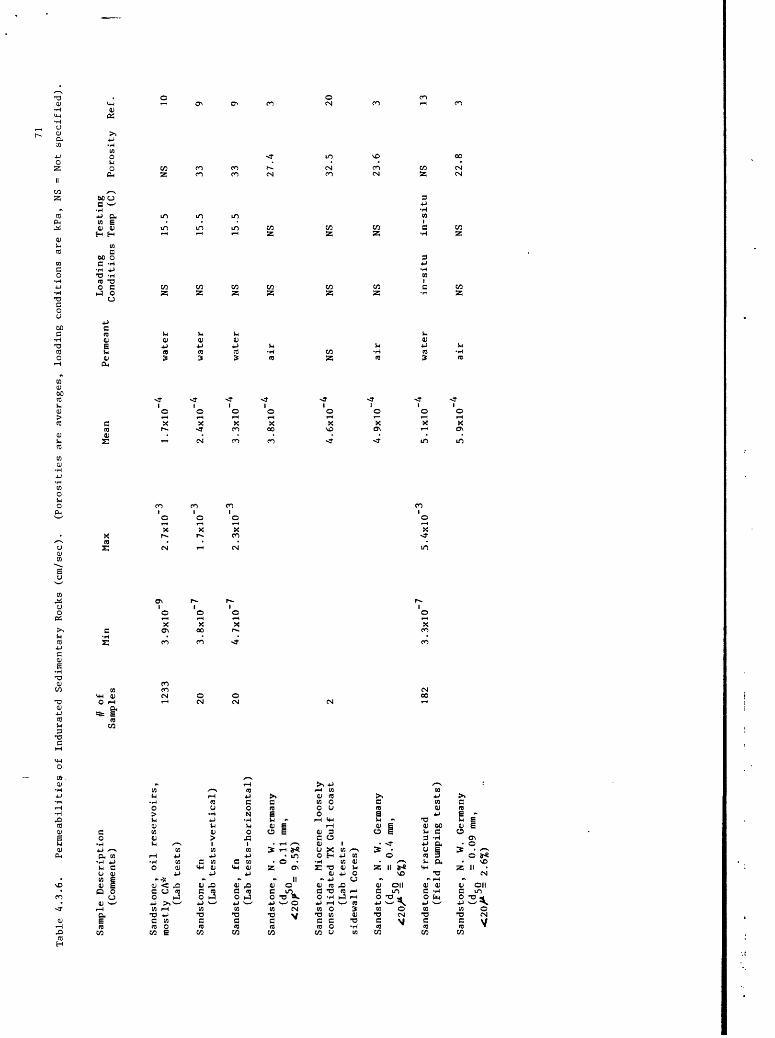
71
Table
4.3.6.
Perm
eabi
liti
es of Indurated
Sedimentary
Rock
s (c
m/se
c).
(Por
osit
ies
are
averages,
load
ing
conditions ar
e kPa, NS
=
Not
specified)
Sample Description
(Com
ment
s)#
of
Samp
les
Min
Max
Mean
Perm
eant
Load
ing
Test
ing
Cond
itio
ns Te
mp (C)
Poro
sity
Ref.
Sandstone, oil
rese
rvoi
rs,
mostly CA*
(Lab
tests)
Sandstone, fn
(Lab te
sts-
vert
ical
)
Sandstone, fn
(Lab test
s-ho
rizo
ntal
)
Sand
ston
e, N.
W. Ge
rman
y(d
0.11
mm,
= 9.5%)
1233
3.
9x10
20 20
-9
3.8x
10
4.7x10
-7
2.7x10
-3
1.7x
10-3
2.3x10
-3
1.7x10
-4
2.4x
10-4
3.3x10
-4
3.8x
10-4
water
water
water
NS NS NS NS
15.5
15.5
15.5
NS
NS 33 33 27.4
10
Sand
ston
e, Mi
ocen
e lo
osel
y consolidated TX
Gu
lf coast
(Lab te
sts-
sidewall Cores)
Sandstone, N. W. Ge
rman
y (d
= 0.
4 mm,
= 6%)
Sand
ston
e, fr
actu
red
(Field pu
mpin
g tests)
Sandstone, N. W. Ge
rman
y(d
=
0.09 mm,
<20/* =
2.6%)
182
3.3x
10-7
5.4x10
-3
4.6x10
-4
4.9x
10-4
5.9x10
NSNS
air
NS
NS NS
32.5
23.6
5.1x10
water
in-s
itu
in-s
itu
NS
,-4
air
NSNS
22.8
20 13

72
Tabl
e 4.3.6.
Perm
eabi
liti
es of Indurated
Sedimentary
Rock
s (c
m/se
c).
(Por
osit
ies
are
averages,
load
ing
conditions are
kPa, NS
=
Not
specified)
Sample Descri
ption
(Comments)
# of
Sa
mple
sMin
Max
Mean
Permeant
Load
ing
Test
ing
Cond
itio
ns Te
mp (C)
Poro
sity
Re
f.
Sandstone, oil
rese
rvoi
rs,
mostly in CA
*(Lab tests)
1223
3.8x
10-7
4.9x10
-39.
8x10
-4water
NS15.5
NS10
Sand
ston
e, No
. 1 Woodbine Fm.
, E.TX
NS
(Lab
tests)
Sandstone, N. W.
Ge
rman
y (d
_ =
0.31
mm,
= 2.
3%)
1.2x10
CC1,
Sand
ston
e, No
. 4 Woodbine Fm.,
E. TX
NS
(L
ab te
sts)
Sand
ston
e, No
. 2 Woodbine Fm.
, E.
TX
NS
(Lab
tests)
Sandstone, N.
W. Ge
rman
y (d
=0.16 mm,
Sand
ston
e, No
. 3 Woodbine Fm., E.TX
NS
(Lab
tests)
Sandstone, N. W.
Ge
rman
y (d
= 0.2mm,
1.3x10
-3
1.4xlO
~3
1.5x10
1.5x10
-3
1.6x10
-3
2.3x
10-3
NS NS
water
NS
wate
r NS NS
wate
r NS NS
NS NS NS NS NS NS NS
NS 18.5
NS NS 26.9
NS 28.5
Sandstone, oil
rese
rvoi
rs,
most
ly CA*
(Lab tests)
1233
4.2x
10-6
1.3x
10-2
2.7x
10-3
NS15.5
NS10

73
Table
4.3.6.
Perm
eabi
liti
es of
In
dura
ted
Sedimentary
Rocks
(cm/
sec)
. (Porosities
are
averages,
load
ing
cond
itio
ns are
kPa, NS
=
Not
specified)
Samp
le De
scri
ptio
n (C
omme
nts)
# of
Sa
mple
sMi
nMax
Mean
Perm
eant
Load
ing
Test
ing
Cond
itio
ns Te
mp (C)
Poro
sity
Ref.
Sandstone, N.
W. Ge
rman
y(d
= 0.
25 mm
, <20/« =
1.5%)
Sandstone, N.
W. Ge
rman
y(d
=
0.25
mm
, <20/*= 2.
5%)
Sandstone, N.
W.
Ge
rman
y(d
=
0.21
mm
<20/
*-=
1.6%
)
Sandstone, me
d.(Lab te
sts-
vert
ical
)
Sand
ston
e, N.
W. Ge
rman
y (d
. = 0.
7 mm
,
132.
4x10
-61.
0x10
-2
3.0x
10-3
3.1x
10-3
3.1x
10-3
3.6x
10-3
4.7x
10-3
NS NS
air
NS
wate
r NS
air
NS
NS NS NS NS
25.1
24.6
27.8
15.5
37 19.9
Sand
ston
e, fi
ne to med. poorly
ceme
nted
,Norfolk, VA
(Lab
test
s)
Sandstone, N.
W. Ge
rman
y (d
= 0.
35 mm
, =
1.1%)
Sand
ston
e, N.
W.
Ge
rman
y (d
= 0.
25 mm
, =
0.8%)
124.
9xlO
~3
water
NS
,-3
5.5x
10
7.2x
10-3
air
NS
air
NS
NS NS NS
NS 24.5
29.5
18

i 74
Table
4.3.
6.
Perm
eabi
liti
es of Indurated
Sedi
ment
ary
Rocks
(cm/
sec)
. (P
oros
itie
s are
averages,
load
ing
conditions are
kPa, NS
=
Not
spec
ifie
d).
Samp
le De
scri
ptio
n (C
omme
nts)
# of
Sa
mple
sMin
Max
Mean
Perm
eant
Load
ing
Test
ing
Cond
itio
ns Te
mp (C)
Poro
sity
Ref.
Sand
ston
e, N. W. Ge
rman
y
^ d5
0 0.50 mm,
<20/= 1.
3%)
Silt
sone
, Iron R.,
MI
(Lab
tests)
1.5x10
-94.3x10
-8
9.5x
10-3
2.3x
10-8
NS
NS NS
NS26
.2
15.5
NS
Silt
ston
e, co
arse
clayey
L. Cretaceous,
W. Ca
nada
, 1605 m
(Lab te
sts-
vert
ical
d50
= A0
)
Siltstone, co
arse
, clayey
L. Cretaceous,
W. Ca
nada
, 1426 m
(Lab te
st-h
oriz
onta
l d5Q
= 35-40)
Siltstone, co
arse
, cl
ayey
,L.
Cr
etac
eous
,W. Ca
nada
, 1426 m
(Lab
te
st-v
erti
cal
d5Q
= 35
-40)
Silt
ston
e, co
arse
clayey
L. Cr
etac
eous
,W.
Ca
nada
, 16
80 m
(Lab
tests-vertical
d5Q
= 35)
2.3x
lO~13
4.
2xlO
~13
-13
-12
3.8x
10
2.9x10
3.2x
10-1
3
4.7x
10-1
3
1.3x
10-12
1.4x10
-12
brine
varied
36
brin
e in
-sit
u 36
brin
e in
-sit
u 35
NS NS NS
varied
varied
35-36
NS

75
Tabl
e 4.3.6.
Perm
eabi
liti
es of
Indurated
Sedimentary
Rocks
(cm/
sec)
. (P
oros
itie
s are
averages,
load
ing
conditions are
kPa, NS
=
Not
specified)
Samp
le Descri
ption
(Comments)
# of
Samp
les
Min
Max
Mean
Permeant
Load
ing
Test
ing
Cond
itio
ns Te
mp (C
) Porosity
Ref.
Silt
ston
e, vy
co
arse
, poorly
sort
ed,
L.Cr
etac
eous
, W. Ca
nada
, 1665 m
(Lab
te
st-v
erti
cal)
Silt
ston
e, vy
co
arse
, poorly
sort
ed,
L. Cretaceous,
W. Ca
nada
, 16
65 m
(Lab
test-horizontal)
Silt
ston
e, sa
ndy,
Stockton
Fm., S.
E. PA
(Lab te
st-h
oriz
onta
l)
Silt
ston
e, sa
ndy,
Stockton
Fm., S.E.PA
(Lab
te
st-v
erti
cal)
Silt
ston
e(L
ab tests-vertical)
9.4x
10-10
1.4x10
-6
2.9x
10-1
2
2.9x
10-12
1.0x10
-7
1.4xlO
1.9x10
~7
brin
e in
-sit
u 35
brin
e in
-sit
u 35
water
NS
wate
r NS
water
NS
NS NS
NS NS 9.7
9.7
15.5
35
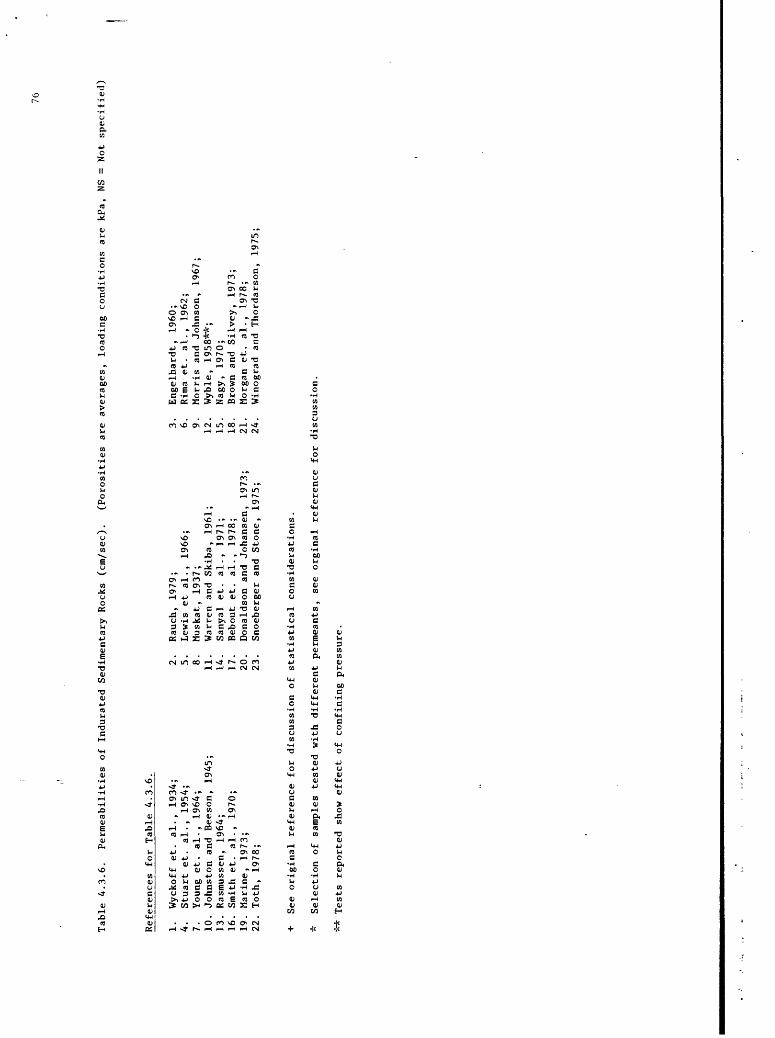
76
Table
4.3.
6.
Permeabilities of In
dura
ted
Sedi
ment
ary
Rocks
(cm/
sec)
. (P
oros
itie
s ar
e averages,
load
ing
cond
itio
ns ar
e kPa, NS
=
Not
specified)
References fo
r Table
4.3.
6.
1.
Wyck
off
et.
al., 1934;
4.
Stuart et
. al., 1954;
7.
Youn
g et
. al., 19
64;
10.
Johnston
and
Bees
on,
1945;
13.
Rasmussen, 19
64;
16.
Smith
et.
al., 1970;
19.
Mari
ne,
1973;
22.
Toth,
1978;
2.
Rauch, 1979;
5.
Lewis
et al., 1966;
8.
Musk
at,
1937
;11.
Warren and
Skiba, 1961;
14.
Sany
al et.
al., 1971;
17.
Bebo
ut et
. al., 1978;
20.
Donaldson
and
Joha
nsen
, 1973;
23.
Snoeberger and
Stone, 1975;
Engelhardt
, 19
60;
Rima
et.
al., 19
62;
Morris an
d Johnson, 1967;
Wybl
e, 19
58**
;Na
gy,
1970
;Brown
and
Silv
ey,
1973;
Morgan et
. al., 19
78;
3. 6. 9.
12.
15.
18.
21.
24.
Winograd and
Thordarson,
1975
;
+ See
orig
inal
re
fere
nce
for
disc
ussi
on of
statistical
cons
ider
atio
ns.
* Selection
of sa
mple
s tested with di
ffer
ent
perm
eant
s, see
orgi
nal
reference
for
discussion.
** Te
sts
repo
rted
show ef
fect
of
co
nfin
ing
pressure.

Table
4.3.
7.
Permeabilities of Un
cons
olid
ated
Sedimentary
Rocks
(cm/
sec)
. (P
oros
itie
s ar
e averages,
load
ing
cond
iton
s ar
e kPa, NS
=
Not
specified)
Sample De
scri
ptio
n (C
omme
nts)
Alluvium,
Arkans
as R.
(Lab tests)
Alluvium,
Ohio Ri
ver
(Lab
tests-vertical)
Alluvium,
Quaternary,
Jack
son
purc
hase
re
gion
, KY
(Lab
tests-horizontal,
outc
rop
samples?)
Alluvium,
Quat
erna
ry,
Jack
son
purchase re
gion
, KY
(Lab te
sts-
vert
ical
ou
tcro
p samples?)
Beac
h deposit, Sa
bine
Pa
ss,
TX
(Lab test-horizontal)
Beach
deposit, Ship Is
land
, MS
(Lab
test-horizontal)
Beach
deposit, Santa
Rosa Is
, MS
(Lab te
st-h
oriz
onta
l)
Clay,
montmorillonite
(Lab prep
ared sa
mple
)
Clay,
mont
mori
llon
ite
(Lab pr
epar
ed sa
mple
)
0 *
?f
Min
Max
Samp
les
97
3.3x
lO~7
2.4x
lO~2
22
2.4x
!0"7
3.3x
lO~2
2 l.
lxio
"2
2.2x
lO~2
2 1.
4x!0
"2
2.3x
lO~2
40 195
245
1 1
Mean
Pe
rmea
i
-3
5.6x10
water
9.9x10
wate
r
-2
1.7x
10
water
-2
1.8x10
wate
r
-3
6.6x10
wate
r
_2
5.9x
10
water
7.3x
lO~2
wate
r
5.3x
!0"15
NS
9.7x
lO~15
NS
Load
ing
Test
ing
Cond
itio
ns Temp (C
) Po
rosi
ty
Ref.
water
atmo
s.
15.5
38.8
NS NS NS NS
15.5
NS NS NS
121200
NS
80800
NS
NS
15.5
48.6
15.5
49.0
NS 45.9
49.6
30.8
36.0
10 14 14 25 25

Table
4.3.
7.
Permeabilities pf
Un
cons
olid
ated
Sedimentary
Rocks
(cm/sec).
(Por
osit
ies
are
aver
ages,
load
ing
conditons
are
kPa, NS =
Not
spec
ifie
d)
Samp
le Description
(Com
ment
s)//
of
Samp
les
Min
Max
Mean
Perm
eant
Load
ing
Test
ing
Conditions Te
mp (C)
Poro
sity
Re
f.
Clay
, montmorillonite
(Lab
pr
epar
ed sa
mple
)
Clay,
mont
mori
llon
ite
(Lab prep
ared
sa
mple
)
Clay
, montmorillonite
(Lab prepared sa
mple
)
Clay
, so
dium
mo
ntmo
rill
onit
e Cherry le
ase,
TX
(lab
test-prepared
samp
le)
Clay
, so
dium
montmorillonite
Cherry lease, TX
(lab test-prepared
samp
le)
Clay,
kaol
init
e (Lab te
st)
Clay
, silty
sandy
aqui
tard
s,
San
Joaq
uin
Vall
ey,
CA(Regiona
l modeling
anal
ysis
re
sult
)
Clay,
sand
y ce
ntra
l CA
(Lab te
st-v
erti
cal)
Clay,
Eoce
ne,
Jack
son
purc
hase
re
gion
,KY
(Lab
te
sts-
hori
zont
al)
2.6x
!0"14
NS
5.3x
!0"14
NS
6.4x
!0"14
NS
4.5x
10-13
5.5xlo
2.2x
10
"13
2.9x
10-9
9.4x
10
1.4x10
-9
40400
NS
20200
NS
10201
NS
Brine
33000
NS
wate
r 33000
NS
wate
r 34
323
NS
43.3
47.8
52.1
in-s
itu
in-s
itu
in-s
itu
NS
water
atmo
s.
15.5
NS
wate
r NS
15.5
48
.5
25 25 25
est.35
15
est.35
15
22.5
21 12
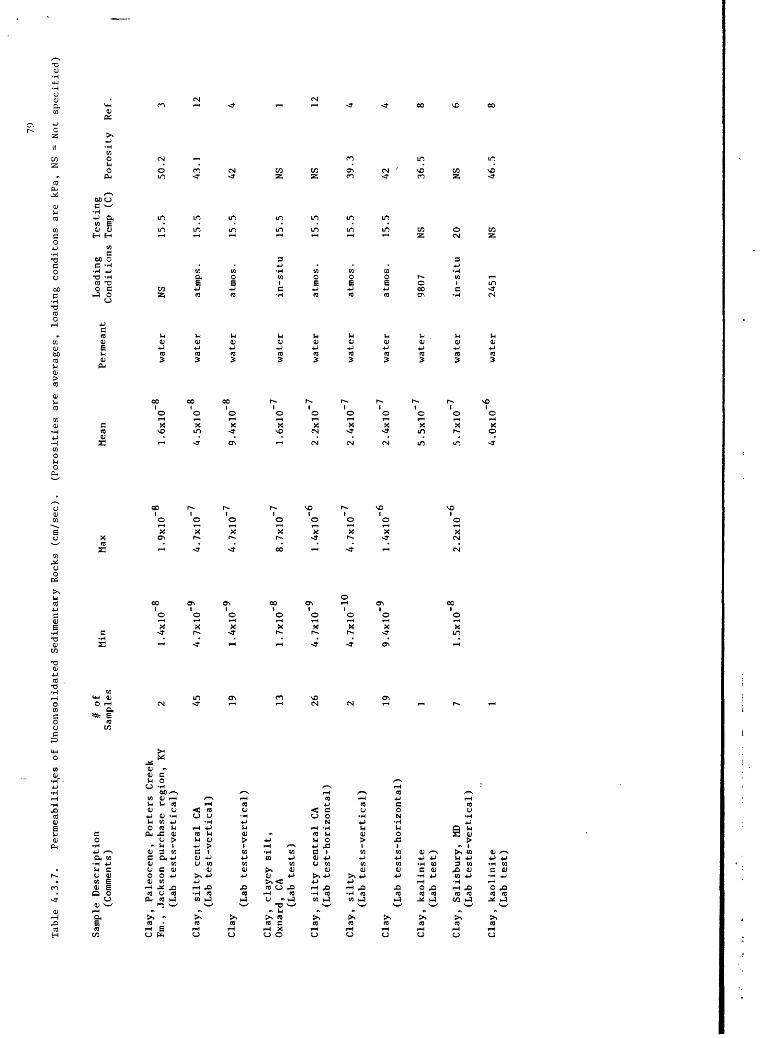
70
Table
4.3.
7.
Perm
eabi
liti
es of Unconsol
idated Sedimentary
Rocks
(cm/
sec)
. (P
oros
itie
s ar
e averages,
load
ing
cond
iton
s ar
e kPa, NS
=
Not
spec
ifie
d)
Samp
le Description
(Com
ment
s)
Clay,
Paleocene, Po
rter
s Creek
Fm., Ja
ckso
n purchase re
gion
, KY
(Lab
te
sts-
vert
ical
)
Clay,
silt
y ce
ntra
l CA
(Lab te
st-v
erti
cal)
Clay
(Lab te
sts-
vert
ical
)
Clay,
clay
ey silt,
Oxna
rd,
CA(Lab tests)
Clay,
silty
cent
ral
CA(L
ab test-horizontal)
Clay,
silty
(Lab
tests-vertical)
Clay
(Lab te
sts-
hori
zont
al)
Clay,
kaol
init
e (L
ab te
st)
Clay,
Salisbury, MD
(Lab
te
sts-
vert
ical
)
Clay,
kaolinite
(Lab te
st)
* ?f
Min
Max
Samp
les
2 1.
4xlO
~8
1.9x
lO~8
45
4.7x
lO~9
4.7x
lO~7
19
1.4x
lO~9
4.7x
lO~7
13
1.7x
lO~8
8.7x
lO~7
26
4.7x
lO~9
1.4x
lO~6
2 4.
7xlO
~10
4.
7xlO
~7
19
9.4x
lO~9
1.4x
lO~6
1 7 l.
Sxlo
"8
2.2x
lO~6
1
Mean
1.6x
lO~8
4.5x
lO~8
9.4x
lO~8
1.6x
lO~7
2.2x
lO~7
2.4x
lO~7
2.4x
lO~7
5.5x
lO~7
5.7x
!0"7
4.0x
lO~6
Perm
eant
_
, .
. Co
ndit
ions
water
NS
water
atmp
s.
wate
r at
mos.
water
in-s
itu
water
atmo
s .
water
atmo
s .
wate
r at
mos.
water
9807
wate
r in
-sit
u
wate
r 2451
Test
ing
Temp
(C)
15.5
15.5
15.5
15.5
15.5
15.5
15.5
NS 20 NS
Poro
sity
50.2
43.1
42 NS NS 39.3
42 36.5
NS 46.5
Ref. 3 12 4 1 12 4 4 8 6 8

80
Tabl
e 4.
3.7.
Pe
rmeabilities of
Un
cons
olid
ated
Sedimentary
Rocks
(cm/
sec)
. (P
oros
itie
s ar
e averages,
load
ing
cond
iton
s ar
e kPa, NS =
Not
spec
ifie
d)
Samp
le Description
(Comments)
// of
Sa
mple
sMin
Max
Mean
Perm
eant
Load
ing
Test
ing
Conditions Te
mp (C)
Poro
sity
Re
f.
Clay,
kaol
init
e (Lab test)
Clay,
kaol
init
e (Lab test)
Clay
, kaolinite
(Lab test)
Clay
, Sa
n Luis Va
lley
, CO
(L
ab tests-vertical)
Dune
deposit, sa
nd,
Coos
Bay, OR
(Lab te
sts-
disturbed
samp
le)
Dune deposit, St
. An
drew
Park,
Panama City,
FL(Lab te
st-h
oriz
onta
l)
Dune
deposit, Sa
nta
Rosa
Is., MI
(Lab te
st-h
oriz
onta
l)
Grav
el,
poor
ly so
rted
, Hu
mbol
dt R.,
Winn
emuc
a, NV
(Lab
test)
Grav
el,
sand
y we
ll so
rted
, Humboldt R.
, Wi
nnem
uca,
NV
(Lab te
st)
116
48
3.1x10
-9
2.4x
10-2
3.9x10
-3
3.0x
10-2
1.3x10
-5
2.0x
10-5
2.3x
10-5
6.1x
10-4
2.8x
10-2
3.5x
10-2
6.9x
10
4.7x10
-2
3.3x
10-1
water
392
water
98
water
49
NS NS NS
wate
r in
-sit
u 20
water
atmo
s.
15.5
wate
r NS
water
NS
NS NS
54.8
57.5
58.8
NS 37 50.8
47.9
water
atmo
s.
15.5
63.4
water
atmo
s.
15.5
28.2
11 14 14

81
Table
4.3.7.
Perm
eabi
liti
es of Un
cons
olid
ated
Sedimentary
Rocks
(cm/
sec)
. (Porosities
are
averages,
load
ing
cond
iton
s ar
e kPa, NS
=
Not
spec
ifie
d)
Samp
le Description
(Comments)
// of
Sa
mple
sMi
nMa
xMean
Perm
eant
Load
ing
Test
ing
Cond
itio
ns Te
mp (C)
Poro
sity
Ref.
Grav
el,
"wat
erla
id"
(Lab tests-vertical)
Loess(L
ab tests)
Loess(Lab te
sts-
vert
ical
)
1.9x10
-1
9.4x
10-7
4.7x
10-6
1.9x
10
1.9x
10-4
1.9x
10-4
1.2x
100
7.9x
10-5
9.4x10
-5
wate
r
water
wate
r
atmo
s.
15.5
atmo
s 15.5
atmo
s.
15.5
40 44.6
49
Loess, Pleistocene, Ja
ckso
n pu
rcha
se
regi
on,
KY
1(L
ab test-horizontal
outc
rop
samp
le)
Loess, Pleist
ocen
e, Ja
ckso
n purchase
regi
on,
KY
2(L
ab te
sts-
vert
ical
ou
tcro
p samples)
Peat
, fi
brou
s(Lab tests)
Peat,
reed
and
Sedg
e decomposed 46
cm*
Peat
, sp
hagn
um moss,
UN(Field piezometer tests)
Peat
, woody, MN
(Field pi
ezom
eter
tests)
NS
9.4x
10-5
l.xl
O-7
1.4x10
-4
5.6x10
-4
2.8x10
-4
4.xlO-5
3.8x
10-2
5.0x10
-3
1.9x10
-4
1.9x
10-4
1.3x
10
2.8x
10
wate
r NS
Wate
r NS
15.5
50.7
15.5
42.1
wate
r variable
NS
3.3x
lO~7
wate
r NS
,-3
NS
NS NS
water
in-s
itu
in-s
itu
NS
wate
r in
-sit
u in
-sit
u NS
18 19 17 17

82
Table
4.3.7.
Permeabilities of
Un
cons
olid
ated
Sedimentary
Rocks
(cm/
sec)
. (P
oros
itie
s are
averages,
load
ing
conditons
are
kPa, NS
=
Not
spec
ifie
d)
Samp
le Description
(Comments)
// of
Sa
mple
sMi
nMa
xMean
Perm
eant
Load
ing
Test
ing
Conditions Te
mp (C)
Porosity
Ref.
Peat,
herbaceo
us,
MN(Field piezometer tests)
Peat
(Lab te
sts-
vert
ical
)
7.0x10
-6
1.4x10
-4
1.3x10
-2
1.3x
10-2
6.5x10
6.6x
10
-3water
in-s
itu
in-s
itu
NS
wate
r at
mos.
15.5
92
17
Rive
r ba
r deposit, Mi
ssis
sipp
i R.
, Jonesville,
LA
30
(Lab
test-horizontal)
Rive
r ba
r deposit, Wabash R.
, Gr
ayville, IL
167
(Lab
tests-horizontal)
River
bar
deposit, Wh
itew
ater
R.
, Ci
ncin
nati
, OH
151
(Lab te
sts-
hori
zont
al)
Sand,
silt
and
clay,
cent
ral
CA
62
(Lab
te
sts-
hori
zont
al)
Sand,
silt an
d clay,
cent
ral
CA
103
(Lab
tests-vertical)
Sand
, cl
ayey
ce
ntra
l CA
12
(Lab te
sts-
vert
ical
)
Sand,
clay
ey ce
ntra
l CA
3 (L
ab te
sts-
hori
zont
al)
9.4x
10
4.7x
10
-9
4.7x
10-9
4.7x
10-7
3.3x
10-4
3.3x
10
1.9x
10
9.4x10
-4
6.2x
10-3
7.5x
10-2
9.1x
10-2
4.2x
10-6
7.5x
10-6
2.2x10
-5
3.3x
10-5
wate
r NS
wate
r NS
wate
r NS
wate
r
water
wate
r
NS NS NS
atmo
s.
15.5
atmos.
15.5
atmos.
15.5
45.0
44.9
36.9
wate
r atmos.
15.5
40.4
40.4
44.4
44.4
14 14 14 12 12 12 12

Table
4.3.
7.
Perm
eabi
liti
es of
Unconsolidated Se
dime
ntar
y Ro
cks
(cm/
sec)
. (Porosities
are
averages,
load
ing
cond
iton
s ar
e kPa, NS =
Not
sp£<?ified)
Samp
le Description
(Comments)
Sand,
silty
cent
ral
CA(L
ab tests-vertical)
Sand,
silty
cent
ral
CA(Lab te
sts-
hori
zont
al)
Sand,
Mioc
ene
2440-2900
m (Lab tests)
Sand,
cent
ral
CA(Lab tests-vertical)
Sand,
fine
(Lab te
sts-
vert
ical
)
Sand
, ce
ntra
l CA
(Lab te
sts-
hori
zont
al)
Sand,
eolian
(Lab tests)
Sand,
medi
um(Lab tests-vertical)
Sand,
Eoce
ne,Jackson
purc
hase
re
gion
, KY
(Lab te
sts-
vert
ical
ou
tcro
p samples)
Sand,
80-1
00 mesh
(Lab te
st)
// of
Samp
les
83 9 59 50 164
16 3 112
5
Min
1.4x
!0"8
4.7x
!0"8
1.8x
!0"6
9.4x
10
4.7x
lO~6
1.9x
lo"5
l.Ox
lo"3
4.7x
lO~5
7.6x
lO~3
Max
l.Ox
lo"3
9.0x
lO~4
2.7x
lO~3
3.1x
!0"2
4.6x
lO~2
1.6x
!0"2
3.0x
!0"2
9.0x
!0"2
3.3x
lO~2
Mean
7.2x
!0"5
l.Ox
lo"4
6.4x
!0"4
3.8x
lO~3
4.4x
lO~3
4.6x
lO~3
1.4x
!0"2
1.6x
!0"2
1.7x
!0"2
Perm
eant
Load
ing
Test
ing
Cond
itio
ns Te
mp (C)
Poro
sity
Ref.
2.3x
10-2
wate
r at
mos.
15.5
38.1
wate
r at
mos.
15.5
NS
water
in-situ?
NS
27.1
water
atmo
s.
15.5
41.8
wate
r at
mos.
15.5
43
water
atmo
s.
15.5
41.8
water
atm
wate
r NS
water&air
NS
15.5
43.0
wate
r at
mos.
15
.539
15.5
42.2
12 12 16 12 12
NSNS
13

84
Tabl
e 4.3.7.
Perm
eabi
liti
es of Unconsolid
ated Sedimentary
Rocks
(cm/
sec)
. (P
oros
itie
s ar
e averages,
load
ing
cond
iton
s ar
e kPa, NS =
Not
specified)
Samp
le De
scri
ptio
n (Comments)
# of
Sa
mple
sMi
nMax
Mean
Perm
eant
Load
ing
Test
ing
Conditions Te
mp (C
) Po
rosi
ty
Ref.
Sand,
silty, Og
alla
la Fm.,
High Pl
ains
-TX
& NM
135
(Field pu
mpin
g te
sts)
Sand
, eolian
6 1.
0x10
(Lab tests-vertical)
Sand,
coar
se
20
8.5x
10
(Lab tests-vertical)
Sand,
well
so
rted
, Hu
mbol
dt R.
,Wi
nnem
uca,
NV
4 2.
4x10
(Lab tests)
Sand
, Eo
cene
, Ja
ckso
n pu
rcha
sere
gion
, KY
5 2.
5x10
(Lab tests-horizontal
outc
rop
samples)
Sand,
40-45
mesh
1 (Lab te
st)
Silt,
cent
ral
CA
1 (Lab te
st-v
erti
cal)
Silt,
clay
ey,
cent
ral
CA
43
9.4x
10
(Lab te
sts-
hori
zont
al)
Silt,
clay
ey,
cent
ral
CA
61
4.7x
10
(Lab
tests-vertical)
-3 -4 -4 -3 -9 -9
7.1x
10-2
9.0x10
-2
6.6x10
-2
4.7x10
-2
9.4x10
-6
9.4x10
-6
_2
2.3x
10
wate
r in
-sit
u in
-sit
u 15
-22.
4x10
3.2x
10-2
3.9x
10-2
4.6x10
-2
1.3x
10-1
9.4x
10-8
2.5x
10-7
4.3x
10-7
wate
r at
mos.
15.5
water
wate
r NS
water&air
NSNS
water
atmo
s.
15.5
wate
r at
mos.
15.5
45
atmo
s.
15.5
39
water
atm
15.5
41
.1
15.5
43.2
NS 51.3
41.8
wate
r at
mos.
15.5
41.8
20 13 12 12 12

, 85
Table
4.3.7.
Permeabilities of Un
cons
olid
ated
Se
dime
ntar
y Rocks
(cm/
sec)
. (P
oros
itie
s ar
e averages,
load
ing
cond
iton
s ar
e kPa, NS
=
Njt
specified),
Samp
le Descri
ption
(Comments)
# of
Sa
mple
sMin
Max
Cond
itio
ns Te
mp (C)
Poro
sity
Re
f.
Silt
, sandy
clayey aq
uita
rd,
Oxnard basin, CA
(Field pu
mpin
g te
sts)
Silt,
sand
y, ce
ntra
l CA
(Lab te
sts-
vert
ical
)
Silt
(Lab
te
sts-
vert
ical
)
Silt,
sand
y, ce
ntra
l CA
(Lab te
sts-
hori
zont
al)
Silt
, cl
ayey
(Lab tests-vertical)
Silt
(Lab te
sts-
hori
zont
al)
30 39 14 39
2.8x
10-8
9.4x
10-9
2.4x
10-7
9.4x
10-6
1.9x10
-8
2.4x10
-5
7.1x10
-4
4.7x10
-4
9.4x10
-5
1.1x
10-3
6.3x
10-6
7.1x
10-6
2.8x
10-5
4.0x10
-5
5.2x10
-5
9.4x
10-5
in-s
itu
in-s
itu
in-s
itu
NS
water
atmo
s.
15.5
40.9
wate
r at
mos.
15
.5
46
water
atmo
s.
15.5
NS
water
atmo
s.
15.5
43
.3
wate
r at
mos.
15
.5
46
22 12 12
Silt,
sand
y we
ll so
rted
, Hu
mbol
dt R.,
Winn
emuc
a, NV
(Lab te
st)
Soil,
weat
here
d granite,
grade
V eng
soil
(Lab tests-values va
ry
with vo
id ratio)
NS
1.9x10
-7
5-xlO-7
1.4x
10-4
3.xlO-3
1.1x10
-4water
atmo
s.
15.5
47.7
NSNS
NSNS

cS6
Table
4.3.
7.
Permeabilities of
Un
cons
olid
ated
Sedimentary
Rocks
(cm/
sec)
. (Porosities
are
averages,
load
ing
cond
iton
s ar
e kPa, NS =
Not
spec
ifie
d)
Sample Description
(Comments)
# of
Sa
mple
sMi
nMax
Mean
Perm
eant
Load
ing
Test
ing
Cond
itio
ns Temp (C)
Poro
sity
Ref.
Soil
, we
athe
red
granodiorite,
grade
V eng
soil
(Con
soli
dati
on
test results)
Soil,
gnei
ss,
grad
e V
eng. soil
(Field &
lab
tests)
Soil,
weathered
granite,
grade
VI re
sidu
al soil
(Lab
te
sts-
valu
es vary
with void ratio)
Soil,
gnei
ss gr
ade
V eng
soil
(Parallel
to fo
liat
ion)
Soil
, gn
eiss
grade
V en
g so
il(P
erpe
ndic
ular
to
foliation)
Soil,
weat
here
d granite,
grade
VI re
sidu
al so
il
(Lab tests)
Soil,
weat
here
d black
seams
in gn
eiss
, gr
ade
VI re
sidu
al soil
(Falling tests
perpendicular
to seams)
NS NS NS NS NS NS NS
3.2x
10-7
l.xlO-7
5.xlO-7
Z.xlO-5
l.xl
O-5
2.1x
10-5
l.xl
O-4
5.6x10
-7
l.xl
O-6
2.xlO-4
5.xl
O-4
2.xlO-4
4.2x
10-4
2.xl
O-4
NS NS NS NS NS NS NS
NS NS NS NS NS NS NS
NS NS NS NS NS NS NS
NS NS NS NS NS NS NS

Table
4.3.7.
Perm
eabi
liti
es of Un
cons
olid
ated
Se
dime
ntar
y Ro
cks
(cm/
sec)
. (P
oros
itie
s are
averages,
load
ing
conditons
are
kPa, NS
=
Not
specified)
Samp
le Description
(Comments)
# of
Sa
mple
sMin
Max
Mean
Perm
eant
Load
ing
Test
ing
Cond
itio
ns Temp (C)
Porosity
Ref.
Soil,
weathered
granite,
grade
V en
g soil
(Lab te
sts)
Soil,
weat
here
d granodiorite,
grade
V en
g so
il(Falling he
ad tests)
Soil,
quartz diorite,
grade
V en
g. soil
(Field &
lab
tests)
Till
, clayey
(Lab
tests-vertical)
Till,
silty
(Lab tests-vertical)
Till
, ea
st ce
ntra
l SD
(Lab
tests)
Till,
silty-cl
ayey
, Ha
nd Cy,
SD(L
ab tests-vertical)
Till
, Montgomery Cy., OH
(Field pu
mpin
g tests)
Till
, northeastern OH
(Lab tests)
NS NS NS 12 10 16
2.1x
10-3
l.xl
O-5
3.8x
10-9
1.4x10
-8
9.4x
10-9
3.8x
10-6
1.4x
10-6
3.8x
10-8
42.x
lO
3-xl
O-4
4.2x10
1.9x
10
-7
2.4x10
-5
4.7x10
-6
2.3x
10-5
4.2x
10-5
8.9x
10-6
l.xl
O-5
9.4x
10-8
2.8x10
-6
3.5x
10-6
4.2x
10-6
4.6x
10-6
7.0x
10-6
NS NS wate
r
wate
r
wate
r
NS
water
NS NS
water
NS
NS NS NS NS
atmo
s.
15.5
NS NS NS
water
atmo
s.
15.5
NS
water
atmo
s.
15.5
34 NS 36.8
in-s
itu
in-s
itu
NS
NSNS
NS
24 24 24
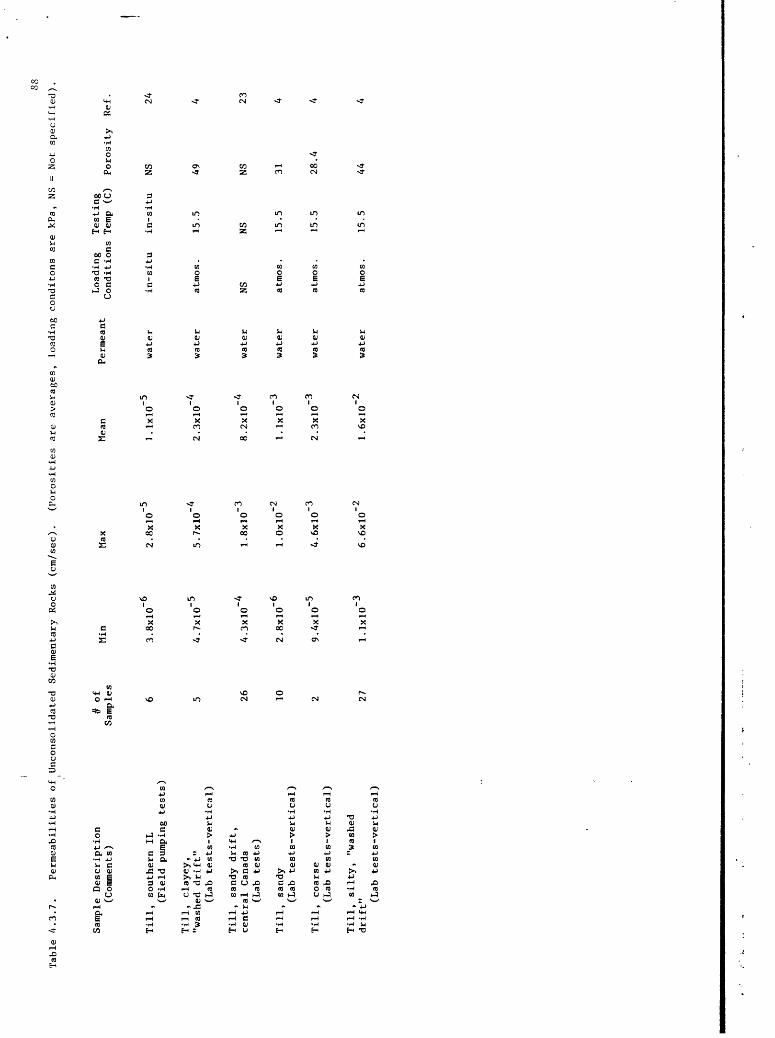
88
Table
4.3.
7.
Permeabilities of Unconsolidated Sedimentary Rocks (c
m/se
c).
(Porosities are
averages, loading conditons are
kPa,
NS =
Not
specified).
Sample Description
(Comments)
// of
Samples
Min
Max
Mean
Permeant
Loading
Testing
Conditions Temp (C)
Porosity
Ref.
Till,
southern IL
(Field pumping te
sts)
Till,
clayey,
"washed drift"
(Lab
tests-vertical)
Till,
sandy drift,
central Canada
(Lab
tests)
Till,
sandy
(Lab
tests-vertical)
Till,
coarse
(Lab tests-vertical)
Till
, silty, "washed
drift" (L
ab tests-vertical)
26 10 27
3.8x10⁻⁶
A.7x10-5
A.3x10-4
2.8x10⁻⁶
9.4x10
1.1x10
-5
2.8x10⁻⁵
5.7x10⁻⁴
1.8x10⁻³
1.0x10⁻²
4.6x10⁻³
6.6x10⁻²
1.1x10⁻⁵
2.3x10"
8.2x10⁻⁴
1.1x10⁻³
2.3x10
1.6x10
-3
water
in-situ
in-situ
NS
water
atmos.
15.5
49
water
water
water
NSNS
atmos.
15.5
atmo
s.
15.5
NS 31 28.4
water
atmos.
15.5
44
24 23

Table
4.3.7. Pe
rmea
bili
ties
of
Unconsolid
ated
Se
dime
ntar
y Rocks
(cm/
sec)
. (Porosities
are
aver
ages,
load
ing
cond
itio
ns are
kPa, NS
=
Not
specified}
References for
Table
4.3.
7.
1.
Mitchell,
1969
;4.
Morris an
d Johnson, 19
67;
7.
Wolf
f an
d Pa
pado
pulo
s, 1972;
10.
Tanaka an
d Hallowell, 19
6613.
Wyck
off
et.
al., 1934;
16.
Morr
ow et
. al., 19
69;
19.
Sturges, 19
68;
22.
Neuman and
With
ersp
oon,
19
72;
25.
Negl
ia,
1979
;
2.
Dear
man
et.
al., 19
78;
5.
Gall
aher
, 1964;
8.
Olsen, 1966;
11.
Brow
n an
d Ne
wcom
b, 1963;
14.
Pryor, 1973;
17.
Boelter, 1965;
20.
Brut
saer
t et
. al., 1975;
23.
Cher
ry et.
al., 1973;
3.
MacC
ary
and
Lambert, 1962;
6.
Wolf
f, 19
70;
9.
Cohen, 19
65;
12.
John
son
et.
al.,
1968;
15.
Coplen and
Hanshaw, 19
73;
18.
Hanr
ahan
, 19
54;
21.
Helm,
1976
;24
. No
rris
, 1962;

90
Table 4.3.8. Permeability Conversion factors-
ratios of common permeability units
relative to cm/sec used in tables 4.3.1-4.3.7
(example: to convert a value in the tables from cm/sec to cm 2 divide by 9.804 x 10 )
9.804 X 10⁴ (cm/sec)/cm2 *
9.109 X 10 7 (cm/sec)/ft2 *
9.66 X 10~ 4 (cm/sec)/Darcy*
9.66 X 10 (cm/sec)/millidarcy*
30.48 (cm/sec)/(ft/sec)
4.72 X 10"5 (cm/sec
* for water at 20°C
="* for water at 60 F = Meinzer unit.
(gpd = U.S. gallons per day)
91
4.4 DISTRIBUTION COEFFICIENTS
4.41 General Comments
As mentioned in section 4.1, for predicting (modeling) the
compositional variation of a liquid in a porous medium in time and space, it
is necessary to consider chemical reactions which are sources and sinks of chemical
constitutents. Sorption-desorption type reactions are common in natural
materials; these can be characterized by the use of distribution coefficients.
4.42 Historical Aspects
The property of natural "rock" materials to sorb to permanently
sequester or delay movement of aqueous species has been of interest to a
range of scientific disciplines for many years, starting with Way's (1850)
classical paper. Since that time much effort has been concentrated on: 1)
evaluation of the ion exchange properties of natural materials, 2) the
factors influencing ion exchange, and 3) the best methods to characterize
these reactions. As environmental concerns about waste disposal have
escalated, the characterization of sorption properties under natural
(in-situ) conditions has become of increasing importance. Recognizing
that laboratory determinations suffer from all of the difficulties of
transferability to the field discussed earlier, a whole new area of
research is foreseen for the hydrologist and soil scientists.

92
4.43 General Definition and Discussion
The most commonly used quantitative expression for the sorption of ions
on to or off of the skeletal framework of the porous media is the
distribution coefficient, K,. The distribution coefficient is defined
(after Wood, 1978, p. 27) as:
where:
K, = distribution coefficient (L 3 /M)
c = concentration of ions sorbed on skeletal framework (M/M)
3 c = concentration of ions in solution (M/L ).
3 3 The units for K, (equation 4) are volume/mass. K,(L /M), x p (M/L ), whereQ Q S
p is density of the skeletal framework, results in a dimensionless form. InS
table 4.4.1, the values from Robertson (1974 and 1977) are dimensionless whereas
those of Meani and others (1978) have unspecified dimensions, but are
assumed dimensionless.
K, must be empirically determined over the range of concentration of
interest to the investigator. "Standardization" of the methodology for
laboratory determinations of K,' s is still in the state of evolution.
Relyea and Serne, 1979, reporting on their "controlled sample program" found
that even though uniform samples were sent to several laboratories for K,
determinations using specified standardized methodology and materials,
results varied over three orders of magnitude. Progress is being made in
identifying the factors requiring careful control (Means and others, 1978;
Apps and others, 1977). Once these factors are standarized, it should be
possible to compare results for different rock materials, ions, etc.

93
Because of the obvious questions remaining regarding laboratory determined
values, only values measured in the field, all of which are for saturated
conditions are reported in Table 4.4.1. These values have been determined
under conditions which integrate the in-situ factors affecting flow and
transport of the chemical species of interest. This integration may include
phenomena not "normally" considered in laboratory sorption experiments;
however, until characterization of the medium being considered for waste
isolation evolves to the degree where quantification is complete, values
determined by field testing and/or regional modeling may be the most
meaningful. However, as shown, the number of "field" determinations is very
small.
The primary function to be served by this compilation is to highlight
the need for more data both from field experiments, and/or from modeling
studies involving enough field derived data for calibration of the model.
Ames and Rai, 1978, have summarized most of the data available on K, 's
for radionuclides. They have also made assessments of the factors
apparently affecting laboratory determinations for these same isotopes.

94
Table
4.4.1.
Dist
ribu
tion
co
effi
cien
ts
Rock Type
Basa
lt Sn
ake
River
Plai
n aquifer, ID
Basalt Sn
ake
River
Plai
n, ID
Basa
lt Sn
ake
River
Plain, ID
Basa
lt Sn
ake
River
Plain, ID
Sedi
ment
s Sn
ake
Rive
r Plain, ID
Shal
e Co
nasa
uga
Fm.,
Oak
Ridge, TN
Shale
Cona
saug
a Fm., Oak
Ridge, TN
Shale
Conasauga
Fm.,
Oa
k Ridge, TN
Shale
Cona
saug
a Fra., Oa
k Ridge, TN
Shale
Conasauga
Fm., Oa
k Ridge, TN
Shale
Conasauga
Fm., Oa
k Ridge, TN
from fi
eld
tests
Isot
ope
Strontium-90
Strontium-90
Stro
ntiu
m-90
Trit
ium
Stro
ntiu
m-90
Coba
lt-6
0
Coba
lt-6
0
Cobalt-60
Cobalt-60
Coba
lt-6
0
Cobalt-60
and
simulation models using
fiel
d data,
n =
poro
sity
in
percent)
Kd 3.0
15.0
5. 0 100
65.3
32.6
52.3
30.0
29.1
6.1
n Me
thod
olog
y Ref.
10
Calibrated re
gion
al di
gita
l mo
del
resu
lts
1
10
Calibrated re
gion
al di
gita
l model
resu
lts
2
10
Calibrated re
gion
al di
gita
l mo
del
resu
lts
2
10-40
Cali
brat
ed regional digital
model
resu
lts
2
30-45
Cali
brat
ed re
gion
al di
gita
l mo
del
resu
lts
2
NS
Field
dete
rmin
atio
ns - we
ll sa
mple
s 3
NS
Field
dete
rmin
atio
ns-w
ell
samp
les
3
NS
Field
determinations-well
samp
les
3
NS
Fiel
d determinations-well
samp
les
3
NS
Fiel
d determinations-well
samp
les
3
NS
Field
dete
rmin
atio
ns-w
ell
samp
les
3

95
Table
4.4.
1.
Distribution co
effi
cien
ts from fi
eld
test
s an
d si
mula
tion
mo
dels
using
fiel
d data.
(n = porosity in
pe
rcen
t)
References for
Table
4.4.
1.
1.
Robe
rtso
n, 1974;
2.
Robertson, 19
77;
3.
Means
and
othe
rs,
1978
;
96
4.5 DISPERSIVITY
4.51 General Definitions
Factors affecting the concentration and movement of solutes (transport)
in porous media include advection, dispersion, and chemical reactions (sec.
4.4). The transport of solutes associated with liquid which is moving in
response to potential differences, Darcy flow, is referred to as advection.
(Convection, although more properly reserved for flow resulting from thermal
differences, has been used synonymously.) The process of advection would
result in the movement of solutes at an average rate equal to the average
linear velocity of the transporting liquid. However, there is a tendency
for the solute to spread out from what would be predicted on the basis of
pure advection. This spreading phenomenon is called hydrodynamic
dispersion. Dispersion is a phenomenon which results from the mixing of
fluids of differing compositon. It produces dilution of solutes in the zone
of mixing. Dispersion includes the effects of molecular diffusion, usually
neglected except at low advection rates, and the mixing resulting from
velocity differences affected by microscopic and macroscopic variations in
porous media. Dispersion resulting from variations in velocity is
referred to as mechanical or hydraulic dispersion. Dispersion has
directional properties; spreading of solute in the direction of flow
is referred to as longitudinal disperson, spreading perpendicular to
the direction flow lines as transverse dispersion.
Assuming steady state conditions, saturation, nonreactive solutes; the
longitudinal coefficient of hydrodynamic dispersion can be expressed as:

97
D£ = 0V + D* (5)
Dp = coefficient of longitudinal dispersion along flow path (L2 /T)
a = dispersivity, property of the porous medium (L)
v = average linear velocity of liquid (L/T)
D* = coefficient of molecular diffusion (L 2T)
The considerations necessary to transform equation 5 into more than one
dimension or to coordinate systems other than the one dimension assumed
here, are beyond the scope of this chapter, for a clear discussion
see Freeze and Cherry (1979, p. 549).
The coefficient of dispersion is ultimately of importance in the
analysis of transport.
Transport by dispersion = n D 0 -^ (6)Xf C/A«r
where
n = porosity
Dp = longitudinal coefficient of dispersion
err = longitudinal concentration gradient
It should be noted that the dispersive component of transport, equation
6, is of the form of Pick's first law, which is applicable to diffusion.
4.52 Discussion
As defined by equation 5, dispersivity the topic of this section is a
"constant" which characterizes the spreading or dispersion attributable

98
to the medium being considered. It has been shown that values of
dispersivity vary depending on the scale at which they are measured.-2
Laboratory determinations range from 10 to 1 cm, while field values range
from 10 to 100 m, (Anderson, 1979). Because dispersivity is an indirect
measure of the homogeneity of the sample tested, the larger the sample the
more representative the result. For this reason and because of the growing
tendency to utilize the solid earth for disposal of a variety of materials
including long-lived nuclear wastes, it was decided to report only
dispersivity values from: 1) field tests and 2) field investigation of
chemical transport in which dispersivities were determined, usually through
model analysis. The latter results from the calibration of areal numerical
models which may include other factors too involved for discussion here,
thus these values should be viewed as "apparent dispersivities".
Anderson (1979) presents an excellent review of simulation modeling of
contaminants in ground water flow systems involving dispersion. The disper
sivity values reported in tables 4.5.1 and 4.5.2 are adapted from this
paper.

99
Table
4.5.
1.
Field
Determined Di
sper
sivi
ties
(A
fter
Anderson,
1979
).
Rock Type
Alluvium,
Chalk Ri
ver
Onta
rio
Alluvium,
Chalk
River, On
tari
o
Alluvium,
Chalk
River, On
tari
o
Allu
vium
, Barstow, CA
Alluvium,
Tucs
on,
AZ
Alluvium,
Lyons, France Ar
ea
Alluvium,
Lyons, France Ar
ea
Alluvium,
Lyons, France Area
Allu
vium
, Lyons, France Ar
ea
Alluvium,
Lyons,
France Ar
ea
Allu
vium
, Lyons, France Area
Chal
k, Do
rset
, En
glan
d
Chalk, Do
rset
, En
glan
d (fractured)
Dolomite,
Carlsbad,
NM (f
ract
ured
)
Schi
st-g
neis
s, Sa
vann
ah River
Plan
t, SC (f
ract
ured
)
Long.
Trans.
Unsp
ec.
n(%)
.034-1
0.1
0.5
15.2
40
15.2
38
0.10-0.50
NS
12.0
3.1-
14.0
5.0
5.0
0.14
-14.
5
7.0
0.009-1.0
8.0
0.015-1.0
1.0
2.3
3.1
0.5
38.1
12
dist
. (m)
NS
NS
6.4
79.2
8 8 16.8
Meth
od
134
.08
538
Sing
le-w
ell
test
-pla
ne of hi
gh velocity
Two-well te
st-p
lane
of
hi
gh velocity
Two-
well
te
st-f
ull
aqui
fer
Two-
well
test
Two-
well
te
st
Single-well
test-stratum sc
ale
Sing
le-w
ell
test with re
sist
ivit
y
Single-well
test
-ful
l aq
uife
r
Single-well
test wi
th resistivity
Single-well
test wi
th re
sist
ivit
y
Single-well
test
with resistivity
Two-well test
Two-
well
te
st
Two-
well
test
Two-
well
te
st

Tabl
e A.5.2.
Regi
onal
Di
spersivities Based
on Si
mula
tion
Model
Resu
lts
(aft
er An
ders
on,
1979).
100
Rock Type
Alluvium,
Alsa
ce,
France
Alluvium,
Alsa
ce,
France
Alluvium,
Sutter Basin, CA
Alluvium,
Sutt
er Basin, CA
Alluvium,
CA
Allu
vium
, CO
Alluvium,
CA
Alluvium,
CO
Alluvium,
Barstow, CA
Allu
vium
, Barstow, CA
Alluvium,
Lyons, France
Alluvium,
Lyons, Fr
ance
Alluvium,
Rocky
Mtn.
, Arsenal, CO
Alluvium,
Rocky
Mtn. Arsenal, CO
Alluvium,
Barstow, CA
Alluvium,
Barstow, CA
Basa
lt,
Hanf
ord
site,
WA (fractured)
Long.
15 15 80-2
00
80-200
30.5
30.5
30.5
30.5
61 61 12 12 30.5
30.5
61 61 30.5
T/L
0.06
7
0.06
7
0.1
0.1
0.3
0.3
0.3
0.3
0.3
0.3
0.33
0.33
1.0
1.0
1/33
0
1/33
0
0.6
n(%)
NS NS 5-20
5-20
NS 20 NS 20 40 40 20 20 30 30 40 40 NS
Model
Type
Prof
ile
Prof
ile
3-D
3-D
Areal
Areal
Area
l
Areal
Area
l
Area
l
Areal
Area
l
Area
l
Areal
Prof
ile
Prof
ile
Areal
Noda
l Sp
acin
g (m
)
NS NS Variable
Variable
305
660
X 1320
305
660X
1320
305
305
NS NS 305
305
3 X
152
3X152
NS

Tabl
e 4.
5.2.
Re
gion
al Di
sper
sivities Based
on Simulation Mo
del
Resu
lts
(aft
er An
ders
on,
1979
)
101
Rock Ty
pe
Basa
lt,
Hanf
ord
site
, WA (fractured)
Basa
lt,
ID (f
ract
ured
)
Basa
lt,
ID(f
ract
ured
)
Basa
lt,
ID (f
ract
ured
)
Basa
lt,
ID (fractured)
Glac
ial
deposits,
Long
Is
land
, NY
Glac
ial
deposits,
Long
Is
land
, NY
Limestone, Br
unsw
ick,
GA
Lime
ston
e, Br
unsw
ick,
GA
Long.
30.5
91 91 91 91 21.3
21.3
61 61
T/L
0.6
1.0
1.0
1.5
1.5
0.2
0.2
0.3
0.3
n(%)
NS 10 10 10 10 35 35 35 35
Model
Type
Area
l
Areal
Areal
Areal
Areal
Areal
Areal
Areal
Areal
Noda
l Sp
acin
g On)
NS 640
640
640
640
Variable
Variable
Variable
Variable

102
References
American Petroleum Institute, 1960, Recommended Practice for
Core-Analysis Procedure: API-RP-40, 55 p.
Ames, L. L., and Rai, D., 1978, Radionuclide interactions with soil
and rock media: U.S. Environmental Protection Agency Report No,
EPA 520/78-007, v. 1, 307 p.
Anderson, M. P., 1979, Using models to simulate the movement
of contaminants through ground water flow systems: CRC Journal
of Environmental Control, in press.
Apps, J. A., Lucas, J., Mathur, A. K., and Tsao, L., 1977,
Theoretical and experimental evaluation of waste transport in
selected rocks: 1977 Annual report of LBL Contract No. 45901
AK: Lawrence Berkeley Lab.,Univ. CA., Berkeley, CA., Publ.
No. LBL-7022, 139 p.
Archie, G. E., 1952, Classification of carbonate reservoir
rocks and petrophysical considerations: Am. Assoc. Petroleum
Geologists Bull., v. 36, p. 278-298.
Aufricht, W. F., Howard, K. C., 1961, Salt characteristics as
they affect storage of hydrocarbons: Jour. Petroleum
Technology, v. 13, p. 733-738.
Baldwin-Wiseman, W. R., Griffith, 0. W., 1909, Physical Properties
of Building Material: Proc. Inst. Civil Eng. 23 p.

103
Beard, D. C., and Weyl, P. K., 1973, Influence of texture on
porosity and permeability of unconsolidated sand: Am.
Assoc. Petroleum Geologists Bull., v. 57, p. 349-369.
Bebout, D. G., Loucks, R. G., and Gregory, A. R., 1978, Frio
sandstone reservoirs in the deep subsurface along the Texas
Gulf Coast their potential for production of geopressured
geothermal energy: Univ. of Texas, Bur. of Economic Geology,
Report of Inv. No. 91, 92 p.
Bianchi, L., and Snow, D. T., 1969, Permeability of crystalline
rocks interpreted from measured orientations and apertures of
fractures: Jodphur, Rajasthan, Arid Zone Research Assoc.
of India, Annals of Arid Zone, v. 8, No. 2, p. 231-245.
Blair, B. E., 1955, Physical properties of mine rock: U.S. Dept.
Interior, Bureau of Mines, 69 p.
Bair, B. E., 1956, Physical properties of mine rock, Part IV:
U.S. Bur. Mines, BM-RI-5244, 69 p.
Boardman, C. R., and J. Skrove, 1966, Distribution in fracture
permeability of granitic rock mass following a contained
nuclear explosion: Jour, of Petroleum Technology, v. 18,
p. 619-623.
Boelter, D. H., 1965, Hydraulic conductivity of peats: Soil
Science, v. 100, p. 227-231.
Brace, W. F., 1965, Some new measurements of linear compressiblity
of rocks: Jour. Geophys. Res., v. 70, p. 391-398.

104
Brown, D. L., and Silvey, W. D., 1973, Underground storage and
retrieval of fresh water from a brackish-water aquifer, in
Braunstein, J. ed. Underground waste management and
artificial reacharge: Am. Assoc. Petroleum Geologists,
v. 1, p. 379-419.
Brown, S. G., and Newcomb, R. C., 1963, Ground-water resources
of the coastal sand-dune area North of Coos Bay, Oregon:
U.S. Geol. Survey Water Supply Paper 1619-D, 32 p.
Brutsaert, W., Gross, W. G., and McGhee, R. M., 1975, C. E. Jacob's
study on the prospective and hypothetical future of the mining
of the ground water deposited under the southern high plains
of Texas and New Mexico: Ground Water, v. 13, No. 6, 14 p.
Butters, S. W., Jones, A. H., and Dropeck, R. K., 1976, Material
properties of Nevada test site tuff and grout - with emphasis
on the mighty Epic event: Defense Nuclear Agency, Washington,
D. C., Rept. DNA 4235 F, 426 p.
Byers, F. M. Jr., 1961, Porosity, density, and water content data
on tuff of the Oak Spring formation from the U12E tunnel
system; Nevada test site, Nye county, Nevada: U.S. Dept.
Interior, Geological Survey, 37 p.
Cherry, J. A., Grisak, G. E.,and Glister, W. E., 1973, Hydrogeologic
studies at a subsurface radioactive-waste-management site in
west-central Canada, in Braunstein, J. ed., Undergroundwaste
management and artificial recharge: Am. Assoc. Petroleum
Geologists, Inc., v. 1, p. 436-467.

105
Cohen, P., 1965, Water resources of the Humboldt River valley near
Wiimemuca, Nevada: U.S. Geol. Survey Water Supply Paper 1795.
Cole,:T. H., Williams, W. P., 1962, Continuation of the lithologic
log with physical properties and X-ray data from drill hole
UE15D Nevada test site: Technical letter, U.S. Geol. Survey, 26 p.
Coplen, T. B., and Hanshaw, B. B., 1973, Ultrafiltration by a
compacted clay membrane - I. oxygen and hydrogen isotopic
fractionation:Geochmicia et Cosmochimica Acta, v. 37, p. 2295-2310
Corps of Engineers, 1965, Rock property data. Tabulated physical
properties of rock cores: Waterways Experiment Station,
Concrete Div., Jackson, MS, Unpublished data.
Darcy, H., 1856, Les fontaines publiques de la ville de Dijon:
Paris, Victor Dalmont, 647 p.
Davis, S. N., 1969, Porosity and permeability of natural materials,
in De Weist, R. J. M., ed., Flow through porous media: New York,
Academic Press, p 54-89.
Dearman, W. R., Baynes, F. J., and Irfan, T. Y., 1978, Engineering
grading of weathered granite: Engineering Geology, v. 12,
p. 345-374.
Deklotz, E. J., and Heck, W. J., 1964, Strengthening of rock against
shock effects DASA Sub-task No. 13.192 tests for strength
characteristics of rock piledriver project: Corps of Engineeers,
U.S. Army, Missouri River, Div., Omaha, NE, 112 p.

106
Delisle, G., 1975, Determination of permeability of granitic
rocks in GT-2 from hydraulic fracturing data: Los Alamos
Scientific Lab., Los Alamos, N. M., Informal Report LA-6169-MS,
5 p.
Dickey, D. D., 1961, Physical property measurements from shaft at
Linen site, U12B tunnel, Nevada Test Site, Nevada: U.S. Geol.
Survey Unpubl. data, 3 p.
Donaldson, E. C., and Johansen, R. T., 1973, History of a two-
well industrial-waste disposal system, in Braunstein, J., ed.,
Underground waste management and artificial recharge: Am.
Assoc. Petroleum Geologists, Inc., v. 1, p. 603-621.
Emerick, W. L., 1962, Interim Geological Investigations in the
U12E.06 Tunnel, Nevada test site, Nye county, Nevada:
U.S. Geol. Survey, TFI 776, 38 p.
Emerick, W. L., Dickey, D. D., and McKeown, F. A., 1962a, Interim
Geological investigations in the U12E.04 tunnel, Nevada test
site, Nye county, Nevada: U.S. Geol. Survey, TFI 776, 27 p.
Emerick, W. L., Hasler, J. W., and Bowers, W. E., 1962b, Outline
of the geology of the U12G.01 tunnel Nevada test site, Nye
county, Nevada: U.S. Geol. Survey, Tech. Letter, Area 12-1, 21 p
Emerick, W. L., Snyder, R. P., and Hoover, D. L., 1962c, Additional
physical property data, U12G.01 tunnel, Nevada test site,
Nye county, Nevada: U.S. Geol. Survey, Tech. Letter, Area
12-1, 3 p.

107
Englehardt, W. V., 1960, Die porenraum der sedimente: Springer-
Verlag, Berlin.
Franklin, J. A., and Hoeck, E., 1970, Developments in triaxial testing
technique: Rock Mechanics: v. 2, p. 223-228.
Fraser, H. J., 1935, Experimental study of the porosity and permeability
of clastic sediments: Jour. Geol., v. 43, p. 910-1010.
Freeze, R. A., and Cherry, J. A., 1979, Groundwater: New Jersey,
Prentice-Hall, 604 p.
Friedman, M., 1976, Porosity, permeability, and rock mechanics -
a review, in Brown, W. S., Green, S. J., and Hustrulid, W. A.,
Site Characterization: 17th U.S. Symposium on Rock Mechanics,
Utah Engineering Experiment Station, Univ. of Utah, Salt Lake
City, Utah.
Gallaher, J. T., 1964, Geology and hydrology of alluvial deposits along the Ohio
River between the Uniontown area and Wickliffe, Kentucky: U.S. Geol.
Survey Hydrologic Atlas 129.
Card, L. M., and Dickey, D. D., 1961, Some physical properties of rock
samples from Gnome Shaft, Eddy county, New Mexico: U.S. Geol.
Survey, Tech. Letter, GNOME-12, 4 p.
Gloyna, E. F. , and Reynolds, T. D., 1961, Permeability measurements of
rock salt: Jour. Geophys. Research, v. 66, p. 3913-3921.
Gondouin, M., and Scala, C., 1958, Streaming potential and the SP log:
Trans. Am. last, of Mining and Met. Engrs., Paper 8023.
Greenberg, D. B., Cresap, R.S., and Malone, T. A., 1968, Intrinsic
permeability of hydrological porous mediums: Variation with
temperature: Water Resources Research, v. 4, p. 791-800.

108
Griffith, J. H., 1937, Physical properties of typical American rocks:
Iowa Engr., Exper. Sta. Bull. 131.
Grindley, G. W., 1965, The geology, structure and exploitation of the
Wairakei geothermal fied, Taupo, New Zealand: New Zealand Geol.
Survey, Bull. 75, 131 p.
Grove, D. B., and Wood, W. W., 1979, Prediction and field verification
of subsurface-water quality changes during artificial recharge,
Lubbock, Texas: Ground Water, v. 17, p. 250-257.
Guido, R. S., and Warner, S. E., 1960, Project Cowboy, Physical
properties of salt samples: Univ. Calif., Lawrence Radiation
Lab. UCRL 6069, 14 p.
Hagen, G. H. L., 1839, Ueber die Bewegung des Wassers in engen
cylindrischen Rohren: Annalen Physik u. Chemie (Leipzig),
v. 36, p. 423-442.
Hanley, E. J., Dewitt, D. P., and Roy, R. F., 1978, The thermal
diffusivity of eight well-characterized rocks for the temperature
range 300-1000K: Eng. Geol., v. 12, p. 31-47.
Hanrahan, E. T., 1954, An investigation of some physical properties of
peat: Geotechnique, v. 4, p. 108-123.
Hazen, Alien, 1892, Some physical properties of salts and gravels:
Rept. Mass. State Bd. of Health, 541 p.
Helm, D. C., 1976, One-dimensional simulation of aquifer system
compaction near Pixley, CA, 2. stress-dependent parameters:
Water Resources Research, v. 12, p. 375-391.
Houser, F. N., 1962, Some physical property data of samples from
U15A site, Nevada test site: U.S. Geol. Survey,
Tech. Letter, Area 15-2, 4 p.

109
Hubbert, M. K., 1940, The theory of ground-water motion: Jour. Geology,
v. 48, p. 785-944.
Izett', G. A., 1960, Granite exploration hole, area 15, Nevada test ~-
site, Nye County, NV interim report, part C: U.S. Geol. Survey,
Trace Elements Memorandum Report 836-C, 3711.
Johnson, A. I., Moston, R. P., and Morris, D. A., 1968, Physical
and hydrologic properties of water bearing deposits in subsiding
areas in central California: U.S. Geol. Survey, Prof. Paper
497-A, 71 p.
Johnston, N., and Beeson, C. M., 1945, Water permeability of reservoir
sands: Am. Inst. of Mining and Metallurgical Engineers, Tech. Publ.
# 1871, 12 p.
Kaufman, W. J., 1963, An appraisal of the distribution coefficient for
estimating undergound movement of radioisotopes: Hazelton-Nuclear
Science Corp., Palo Alto, CA, Report HNS-1229-21.
Keller, G. V., 1960, Physical properties of tuffs of the Oak Spring
formation, Nevada: U. S. Geol. Survey Prof. Paper 400-B, p.396-400.
Kessler, D. W., Insley, H., and Sligh, W. H., 1940, Physical, Mineralogical,
and durability studies on the building and monumental granites of the
United States: Jour. Res. Nat. Bur. Standards, v. 25, p. 161-206.
Kessler, D. W., and Sligh, W. H., 1932, Physical properties and weathering
characteristics of slate: Jour. Res. National Bureau Standard,
v. 9, p. 377-411.
Lewis, D. C., Kriz, G. J., and Burgy, R. H., 1966, Tracer dilution sampling
technique to determine hydraulic conductivity of fractured rock: Water
Resources Research, v. 2, p. 533-542.

110
Lin, W. , 1978, Measuring the permeability of Eleana argillite from area 17,
Nevada test site, using the transient method: Univ. of CA, Lawrence
Livermore Lab., Livermore, CA, UCRL 52604, 11 p.
Lohman, S. W., 1972a, Ground-water hydraulics: U.S. Geol. Survey
Prof. Paper 708, 70p.
Lohman, S. W., and others, 1972b, Definitions of selected ground-
water terms - revisions and conceptual refinements: U.S.
Geol. Survey Water-Supply Paper 1988, 21 p.
MacGary, L. M., and Lambert, T. W., 1962, Reconnaissance of ground-water
resources of the Jackson Purchase region, Kentucky: U.S. Geol. Survey
Hydrologic Atlas 13.
Manger, G. E., 1963, Porosity and bulk density of sedimentary rocks:
U.S. Geol. Survey, Bull. 1144-E.
Marine, I. W., 1973, Geohydrology of buried Triassic basin at Savannah
river plant, South Carolina, in Braunstein, J., ed., Underground
waste management and artificial recharge: Am. Assoc. Petroleum
Geologists Inc., v. 1, p. 481-504.
Means, J. L., Crerar, D. A., and Duguid, J. 0., 1978, Migration of
radioactive wastes:radionuclide mobilization by complexing
agents: Science, v. 200, p. 1477-1481.
Meinzer, 0. E., 1923, The occurence of ground water in the United States:
U.S. Geol. Survey Water Supply Paper 489, 321 p.
Mellor, M., 1971, Strength and deformability of rocks at low temperatures:
Cold Regions Research and Engineering Lab., Hanover, NH,
CORREL-RR-294, 78 p.
Miller, R. J., Overman, A. R., and Peverly, J. H., 1968, Non-Darcy flow
characteristics of water as influenced by clay concentration: Univ.
Illinois Water Resources Center Research Report No. 16, 50 p.
Ill
Mitchell, J. K., 1969, Physical and hydrologic properties of the aquitard
layers in the Oxnard, California area: Dept. Civil Eng., Univ. CA,
Berkeley, T. E. Kept. # 69-2, 66 p.
Monfore, G. E., 1954, Laboratory tests of rock cores from the foundation and
analysis of load-bearing tests: U.S. Bur. Reclamation
Concrete Lab. Report No. C-731, 35 p.
Morgan, J. T., Cordiner, F. J., and Livingston, A. R., 1978, Tensleep
reservoir, Oregon Basin Field, Wyoming: Am. Assoc. Petr. Geol.
Bull., v. 62, p. 609-632.
Morris, D. A., and Johnson, A. I., 1967, Summary of hydrologic and
physical properties of rock and soil materials, as analyzed by the
hydrologic laboratory of the U.S. Geological Survey: U.S. Geol. Survey
Water-Supply Paper 1839-D.
Morrow, N. R., Huppler, J. D., and Simmons, A. B., III, 1969, Porosity and
permeability of unconsolidated Upper Miocene sands from grain-size
analysis: Jour. Sed. Petr., v. 39, p. 312-321.
Murray, R. C., I960, Origin of porosity in Carbonate rocks: Jour.
Sediment. Petrol., v. 30, p. 59-84.
Muskat, M., 1937, The flow of homogeneous fluids through porous media: New York,
McGraw Hill, 763 p.
Nagy, B. , 1970, Porosity and permeability of the early Precambrian Onverwacht
chert: origin of the hydrocarbon content: Geochmica & Cosmochimica Acta,
v. 34, p. 525-527.

112
Neglia, S., 1979, Migration of fluids in sedimentary basins: Am.
Assoc. Petroleum Geologists Bull., 63, p. 573-597.
Neumah, S. P., and Witherspoon, P. A., 1972, Field determination of the ~-
hydraulic properties of leaky multiple aquifer systems: Water Resources
Research, v. 8, p. 1284-1298.
Norris, S. E., 1962, Permeability of glacial till: U.S. Geol. Survey
Prof. Paper 450-E, p. 150-151.
Norton, D., and Knapp. R., 1977, Transport phenomena in hydrothermal
systems: The nature of porosity: Am. Jour. Sci., v. 297,
p. 913-936.
Norton, D., and Knight, J., 1977, Transport phenomena in hydrothermal
systems: cooling Plutons: Am. Jour, of Sci., v. 277, p. 937-981.
Ohle, E. L., 1951, The influence of permeability on ore distribution
in limestone and dolomite: Economic Geology, v. 46, p. 667-706.
Olsen, H. W., 1966, Darcy's law in saturated kaolinite: Water
Resources Research, v. 2, p. 287-295.
Poiseuille, J. L. M., 1846, Experimental investigations on the flow
of liquids in tubes of very small diameter: Acad. Royal Sci.
et Inst. France, Math. Phys. Sci. Mem., v. 9, p. 433-543.
Potter, J. M., 1978, Experimental permeability studies at elevated
temperature and pressure of granitic rocks: Los Alamos
Scientific Lab., Los Alamos, N. M., Thesis LA-7224-T, 101 p.

113
Powers, D. W., Lambert, S. J., Shaffer, S. E., Hill, L. R.,
and Weart, W. D., Eds., 1978, Geological characterization report
waste isolation pilot plant (WIPP) site, Southeastern New Mexico: ~-
Sandia Lab. Albuquerque, N. M. Report No. SAND 78-1596, v. 2.
Pratt, H. R., Black, A. D., Brace, W. F., and Norton, D. L., 1974,
In situ joint permeability in a granite: EOS, Am. Geophys.
Union Trans. v. 55, p. 433.
Pryor, W. A., 1973, Permeability-porosity patterns and variations in some
Holocene,sand bodies: Am. Assoc. Pet. Geol. Bull., v. 57, p. 162-189.
Rasmussen, W. C., 1964, Permeability and storage of heterogeneous
aquifers in the United States: Internat. Assoc. Scientific Hydrology,
Pub. 64, p. 317-325.
Rauch, H. W., 1979, Determining permeability for a deep coal seam targeted
for underground coal gasification: Trans. Am. Geophys. Union,
v. 60, Abs. p. 248.
Rima, D. R., Meisler, H., and Longwill, S., 1962, Geology and
hydrology of the Stockton formation in southeastern Pennsylvania:
PA Topographic and Geologic Survey Bull. W-14, 111 p.
Robertson, E. C., 1962, Physical properties of evaporite minerals: U.S. Geol.
Survey Report TEI-821, 90 p.
Robertson, J. B., 1974, Digital modeling of radioactive and chemical waste
transport in the Snake River plain aquifer at the National Reactor
Testing Station, Idaho: U.S. Geol. Survey Open-File Report IDO-22054.

114
Relyea, J. F., and Serne, J., 1979, Controlled sample program,
Publication No. 2, interlaboratory comparison of batch K, values:
Battelle Pacific Northwest Labs., Richland, WA, Pub. NO. PNL-2872.
Robertson, J. R., 1977, Numerical modeling of subsurface radioactive solute
transport from waste-seepage ponds at the Idaho National Engineering
Laboratory: U. S. Geological Survey Open-File Report 76-717.
Rove, 0. N., 1947, Some physical characteristics of certain favorable
and unfavorable ore horizons Part I: Economic Geol., v. 42,
p. 57-77.
Sanyal, S. K., Kvenvolden, K. A., and Marsden, S. S., 1971, Permeabilities
of Precambrian Onverwacht cherts and other low permeability
rocks: Nature, v. 232, p. 325-327.
Sargent, K. A., 1965, Preliminary geologic report on the UE19G and UE19G-S
drill holes, area 19, pahute mesa, Nevada test site: U.S. Geol.
Survey, Tech. Letter, special studies-1-38, 25 p.
Satchell, R. L. H., and Wilkonson, W. B., 1973, Artificial recharge in United
Kingdom with special reference London Basin, in Braunstein, J., ed.,
Underground waste management and artificial recharge: Am. Assoc.
Petroleum Geologists Inc., v. 1, p. 34-59.
Saucier, K. L., 1969a, Tests of rock cores, mountain home, Idaho, and
Fairchild, Washington Areas: U.S. Army Engineer Waterways
Experiment Station, Misc. paper C-69-12, 291 p.
Saucier, K. L., 1969b, Properties of cedar Citytonalite: U.S. Army
Engineer Waterways Experiment Station, Misc. Paper C-69-9, 286 p.

115
Schoeller, H., 1962, Les eaux Souterraines: Masson, Paris.
Skempton, A. W., 1944, Notes on the compressibility of clays: Quarterly
3. Geol. Soc. London, v. 100, p. 119-135.
Slichter, C. S., 1899, Theoretical investigation of the motion of
ground water: U.S. Geol. Survey Nineteenth Ann. Kept. pt. 2,
p. 305-328.
Smith, J. W., Schopf, J. W., and Kaplan, I. R., 1970, Extractable
organic matter in Precambrian cherts: Geochim. et Cosmochm.
Acta, v. 34, p. 659-675.
Snoeberger, D. F., and Stone, R., 1975, Evaluation of the native hydraulic
characteristics of the Felix coal (Eocene, Wasatch formation)
and associated strata, Hoe creek site, Compbell county, Wyoming:
Lawrence Livermore Lab. Rept. UCRL-51992.
Stewart, J. W., 1964, Infiltration and permeability of weathered crystalline
rocks Georgia Nuclear laboratory, Dawson County, GA: U.S. Geol.
Survey Bull. 1133-D, 57 p.
Stuart, W. T., Brown, E. A., and Rhodehamel, E. C., 1954, Ground
water investigations of the Marquette iron-mining district:
Michigan, Tech. Rept. No. 3, 92 p.
Sturges, D. L., 1968, Hydrologic properties of peat from a Wyoming
mountain bog: Soil Science, v. 106, p. 262-264.
Tanaka, H. H., and Hollowell, J. R., 1966, Hydrology of the alluvium of
the Arkansas River, Muskogee, Oklahoma to Fort Smith, Arkansas: U.S.
Geol. Survey Water Supply paper 1809-T, 42 p.
Toth, Jr., 1978, Gravity-induced cross-formational flow of formation
fluids, red earth region, Alberta, Canada: Analysis, patterns,
and evolution: Water Resources Research, v. 14, p. 805-843.

116
U.S. Army, 1961, Subsurface investigation report headquarters SAC
combat operations center Offutt AFB, NE for the United States
Air Force: U.S. Army Engineer District Omaha, NE, 120 p.
U.S. Bur. Reclamation, 1958, Data on properties of foundation rock:
177 p.
U.S. Geological Survey, 1964, Computer Punch Card: Experimental Results.
Villas, R. N., 1975, Fracture analysis, hydrodynamic properties and
mineral abundance in altered igneous wall rocks of the Mayflower
mine, Park City district, Utah: Ph.D. dissertation., Univ.
Utah, Salt Lake City, UT, 253 p.
Walmsley, M. E., 1977, Physical and chemical properties of peat, in
Radforth, N.W., and Brawner, C. 0., ed., Muskeg and the Northern
environment in Canada: Toronto, Univ. of Toronto Press, p. 63-81.
Warren, J. E., and Skiba, F. F., 1961, An evaluation of the significance of
permeability measurements: Jour. Petroleum Technology, p. 739-744.
Way, J. T., 1850, On the power of soils to absorb manure: Jour. Royal
Agricultural Society of England, v. 11, p. 313-379.
Weinbrandt, R. M., Ramey, H. J. Jr., and Casse, F. J., 1975, The
effect of temperature on relative and absolute permeability of
sandstones: Society of Petroleum Engineers Jour. v. 15, p. 376-384.

117
Williams, W. P., Emerick, W. L., Davis, R. E., and Snyder, R. P., 1963, U.S.
Geol. Survey Investigations in Yucca Flat Nevada test site. Part C.--
Underground: U.S. Geol. Survey, NTS-45-Pt.C,. 251 p.
Wilson, T. V., and Sibley, D. F. , 1978, Pressure solution and porosity
reduction in shallow buried quartz arenite: Am. Assoc. Petroleum
Geologists, Bull., v. 62, p. 2329-2334.
Windes, S. L., 1950, Physical properties of mine rock: U.S. Bur.
of Mines, BM-RI-4727, 37 p.
Winograd, I. J., 1971, Hydrogeology of ash flow tuff: A preliminary
statement: Water Resources Research, v. 7, p. 994-1006.
Winograd, I. J., and Thordarson, W., 1975, Hydrogeologic and hydro-
chemical framework, south-central great basin, Nevada-California,
with special reference to the Nevada test site: U.S.
Geol. Survey Prof. Paper 712-C, 126 p.
Wolf, K. H., and Chilingarian, 1976, Diagenesis of sandstones,
and compaction, in Chilingarian, G. V., and Wolf, K. H., eds.,
Compaction of coarse-grained sediments, II: New York, Elsevier
Scientific Publ. Co., p. 69-444.
Wolff, R. G., 1970, Field and laboratory determination of the hydraulic
diffusivity of a confining bed: Water Resources Research,
v. 6, p. 194-203.
Wolff, R. G., and Papadopulos, S. S., 1972, Determination of the
hydraulic diffusivity of a heterogeneous confining bed: Water Resources
Research, v. 8, p. 1051-1058.

118
Wolkodoff, V. E., 1953, Petrographic examination and preparation of
rock-core sections for static and dynamic tests Alcova Powerhouse
Kendrick Project, Wyoming: U.S. Bureau of Reclamation,
Kept. No. PET-100, 23 p.
Wood, W. W., 1978, Use of laboratory data to predict sulfate sorption
during artificial ground-water recharge: Ground Water, v. 16,
p. 22-31.
Wyble, D. 0., 1958, Effect of applied pressure on the conductivity, porosity
and permeability of sandstones: Trans., AIME, v. 213, p. 431-438.
Wyckoff, R. D., Botset, H. G., Muskat, M., and Reed, D. W., 1934,
Measurement of permeability of porous media: Am. Assoc. Petroleum
Geologists, v. 18, p. 161-190.
Young, A., Low, P. F., and McLatchie, A. S., 1964, Permeability studies
of argillaceous rocks: Jour. Geophysical Research, v. 69, p. 4237-
4245.
Zoback, M. D., and Byerlee, J. D., 1975, Permeability and effective
stress: Am. Assoc. Petroleum Geologists, v. 59, p. 154-158.


