
UNIVERSITI TEKNIKAL MALAYSIA MELAKA
MEASUREMENT ERROR AND UNCERTAINTY ANALYSIS BY
EXCEL
This report submitted in accordance with the requirements of the Universiti Teknikal
Malaysia Melaka (UTeM) for the Bachelor Degree of Manufacturing Engineering
(Process) with Honours.
By
MARLIANA BINTI MD TAIB
FACULTY OF MANUFACTURING ENGINEERING
2010
UNIVERSITI TEKNIKAL MALAYSIA MELAKA (UTeM)
BORANG PENGESAHAN STATUS LAPORAN PROJEK SARJANA MUDA
TAJUK: Measurement Error and Uncertainty Analysis By Excel
SESI PENGAJIAN: 2009/2010 Semester 2 Saya MARLIANA BINTI MD TAIB
mengaku membenarkan Laporan PSM ini disimpan di Perpustakaan Universiti Teknikal Malaysia Melaka (UTeM) dengan syarat-syarat kegunaan seperti berikut:
1. Laporan PSM adalah hak milik Universiti Teknikal Malaysia Melaka dan Penulis. 2. Perpustakaan Universiti Teknikal Malaysia Melaka dibenarkan membuat salinan
untuk tujuan pengajian sahaja dengan izin penulis. 3. Perpustakaan dibenarkan membuat salinan laporan PSM ini sebagai bahan
pertukaran antara institusi pengajian tinggi.
4. **Sila tandakan (√)
SULIT
TERHAD
TIDAK TERHAD
(Mengandungi maklumat yang berdarjah keselamatan atau kepentingan Malaysia yang termaktub di dalam
AKTA RAHSIA RASMI 1972)
(Mengandungi maklumat TERHAD yang telah ditentukan
oleh organisasi/badan di mana penyelidikan dijalankan)
(TANDATANGAN PENULIS)
Alamat Tetap: G17-G-2 DESA MURNI, KOMPLEKS PENJARA SG BULOH, 47000 SG BULOH, SELANGOR DARUL EHSAN.
Tarikh:_________________________
Disahkan oleh:
(TANDATANGAN PENYELIA)
Cop Rasmi:
Tarikh:_________________________
** Jika laporan PSM ini SULIT atau TERHAD, sila lampirkan surat daripada pihak berkuasa/organisasi berkenaan dengan menyatakan sekali sebab dan tempoh laporan PSM ini perlu dikelaskan sebagai
SULIT atau TERHAD.
DECLARATION
I hereby, declared this report entitled “Measurement Error and Uncertainty By
Excel” is the results of my own research except as cited in the references.
Signature : …………………………………
Author’s Name : …………………………………
Date : …………………………………
APPROVAL
This report submitted to the Faculty of Manufacturing Engineering of UTeM as a
partial fulfillment of the requirements for the degree of Bachelor of Manufacturing
Engineering (Process) with Honours. The member of the supervisory committee is as
follow:
……………………………………………….
Project Supervisor
(Official Stamp & Date)

ACKNOWLEDGEMENT
First and foremost, thanks to ALLAH S.W.T for His blessings and strengths, I had finished
this project. Next, I would like to place my gratitude to the ones that contributed to the
success of this project. I wish to acknowledge and express my gratitude and appreciation to
my supervisor, Dr Mohd Rizal Salleh for his supervision, encouragement, suggestion and
assistance through the research.
Valuable suggestions, criticisms and comments have been made by numerous individuals. I
greatly appreciate the time and effort the following people gave in order to complete my final
year project and I really appreciate them for their help in improving the quality of this final
year project:
Last but not least, million thanks to all friends who’s guide me to complete this research. I
could offer here only an inadequate gesture of my appreciation and all of your good deeds
will always be in my mind.
DEDICATION
Specially dedicated to my beloved father, mother, family, and friends who provide a loving,
caring, encouraging and supportive atmosphere. These are characteristic that contribute to
the environment that is always needed to achieve the goals ahead.
i
ABSTRACT
This thesis has focused on the measurement error and uncertainty analysis by excel
conducted in the ABC Company Sdn Bhd. The objective of this study was to investigate
the methods applies in error determination and measurement uncertainty. In order to
analyze the data some of Statistical Process Control (SPC) tools were used such as
histogram, cause and effect diagram and control chart. The result that gained is achieved
to develop software to measure error and uncertainty. The errors in the production line
are determined and proper tool is used to analyze the quality problem. Major defects
were highlighted and analyzed. Root causes for the problems were determined and
suggestions for improvement were suggested. After the improvement stage, suggestions
for control the quality also were suggested.
ii
ABSTRAK
Laporan ini bertujuan untuk mencipta perisian melalui Microsoft Excel bagi kesalahan
dan ketidakpastian pengukuran di syarikat ABC company Sdn Bhd. Objektif kajian ini
adalah untuk mengkaji kaedah kaedah yang digunakan dalam penentuan dan pengukuran
kesalahan ketidakpastian Untuk menganalisis data, beberapa alat “Statistical Process
Control” (SPC) digunakan seperti histogram, diagram sebab dan akibat dan carta
kawalan. Keputusan yang diperolehi adalah dapat mencipta perisian untuk mengukur
kesalahan dan ketidakpastian. Kesalahan didalam pengukuran pengeluaran dan alat
sesuai yang digunakan untuk menganalisis masalah kualiti. Kecacatan utama dianalisis.
Masalah utama dinyatakan dan saranan untuk pembaikan dicadangkan. Selepas
peringkat pembaikan, saranan kawalan quality juga dicadangkan.
iii
TABLE OF CONTENT
Abstract i
Abstrak ii
Table of Content iii
List of Table vi
List of Figure viii
List of Abbreviation x
1.0 INTRODUCTION
1.1 Background of Project 1
1.2 Objectives of project 3
1.3 Definition of Problem 3
1.4 Scopes of Work 4
2.0 LITERATURE REVIEW
2.1 Error In Measurement
2.1.1 Introduction 5
2.1.2 Types of Measurement Error 6
2.1.3 Systematic error 7
2.1.3.1 Selection Bias 9
2.1.3.2 Measurement Bias 10
2.1.4 Random Error 11
2.1.5 True Score 13
2.2 Uncertainty
2.2.1 Introduction 13
2.2.2 Control Chart 15
2.2.3 Repeatability and Reproducibility
2.2.3.1 Control of bias 18
iv
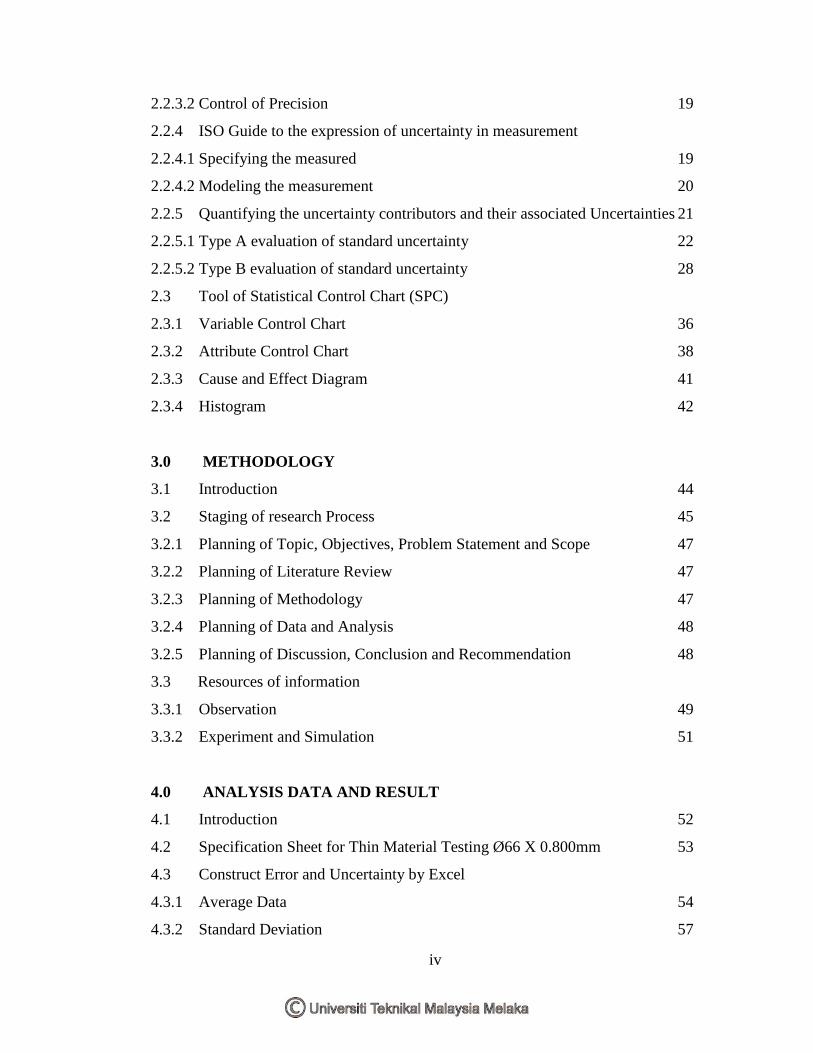
2.2.3.2 Control of Precision 19
2.2.4 ISO Guide to the expression of uncertainty in measurement
2.2.4.1 Specifying the measured 19
2.2.4.2 Modeling the measurement 20
2.2.5 Quantifying the uncertainty contributors and their associated Uncertainties 21
2.2.5.1 Type A evaluation of standard uncertainty 22
2.2.5.2 Type B evaluation of standard uncertainty 28
2.3 Tool of Statistical Control Chart (SPC)
2.3.1 Variable Control Chart 36
2.3.2 Attribute Control Chart 38
2.3.3 Cause and Effect Diagram 41
2.3.4 Histogram 42
3.0 METHODOLOGY
3.1 Introduction 44
3.2 Staging of research Process 45
3.2.1 Planning of Topic, Objectives, Problem Statement and Scope 47
3.2.2 Planning of Literature Review 47
3.2.3 Planning of Methodology 47
3.2.4 Planning of Data and Analysis 48
3.2.5 Planning of Discussion, Conclusion and Recommendation 48
3.3 Resources of information
3.3.1 Observation 49
3.3.2 Experiment and Simulation 51
4.0 ANALYSIS DATA AND RESULT
4.1 Introduction 52
4.2 Specification Sheet for Thin Material Testing Ø66 X 0.800mm 53
4.3 Construct Error and Uncertainty by Excel
4.3.1 Average Data 54
4.3.2 Standard Deviation 57
v
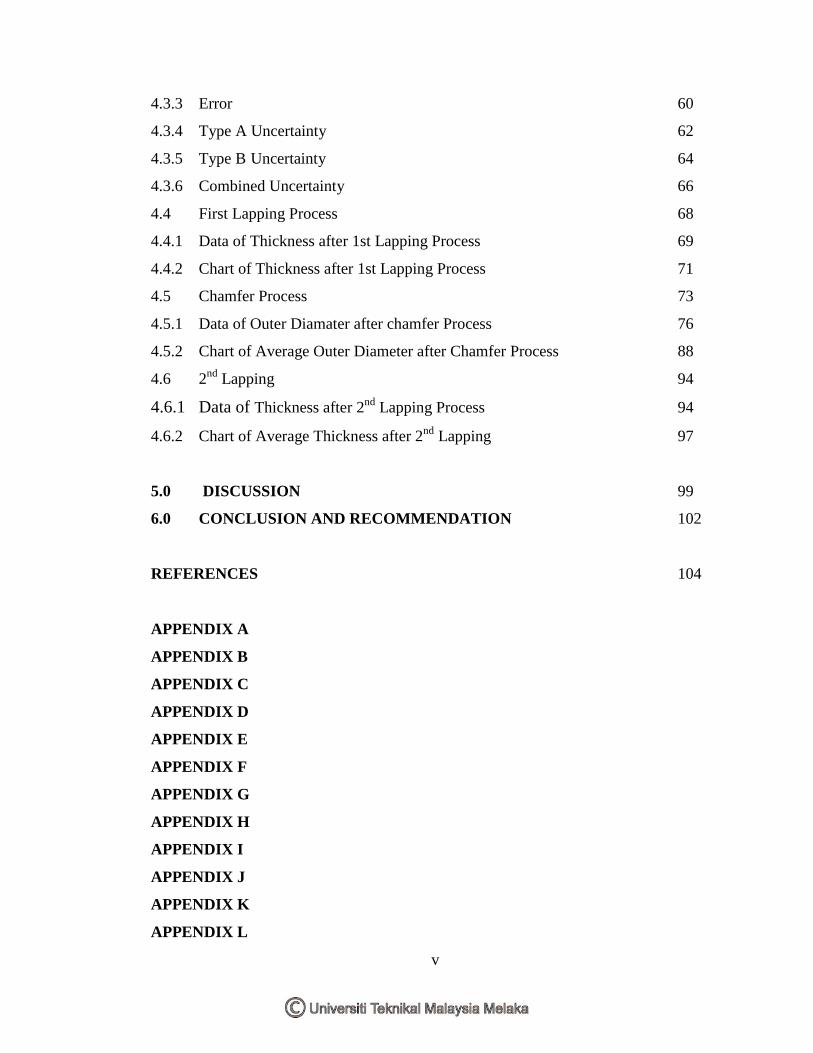
4.3.3 Error 60
4.3.4 Type A Uncertainty 62
4.3.5 Type B Uncertainty 64
4.3.6 Combined Uncertainty 66
4.4 First Lapping Process 68
4.4.1 Data of Thickness after 1st Lapping Process 69
4.4.2 Chart of Thickness after 1st Lapping Process 71
4.5 Chamfer Process 73
4.5.1 Data of Outer Diamater after chamfer Process 76
4.5.2 Chart of Average Outer Diameter after Chamfer Process 88
4.6 2nd
Lapping 94
4.6.1 Data of Thickness after 2nd
Lapping Process 94
4.6.2 Chart of Average Thickness after 2nd
Lapping 97
5.0 DISCUSSION 99
6.0 CONCLUSION AND RECOMMENDATION 102
REFERENCES 104
APPENDIX A
APPENDIX B
APPENDIX C
APPENDIX D
APPENDIX E
APPENDIX F
APPENDIX G
APPENDIX H
APPENDIX I
APPENDIX J
APPENDIX K
APPENDIX L
vi
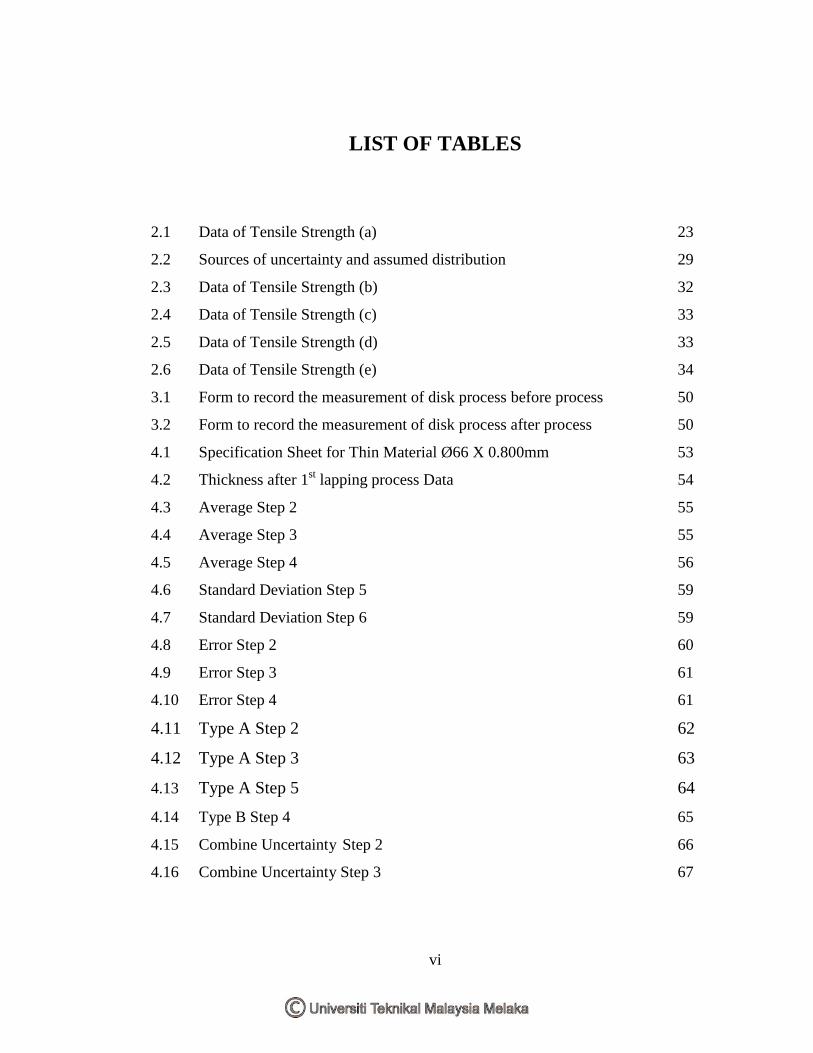
LIST OF TABLES
2.1 Data of Tensile Strength (a) 23
2.2 Sources of uncertainty and assumed distribution 29
2.3 Data of Tensile Strength (b) 32
2.4 Data of Tensile Strength (c) 33
2.5 Data of Tensile Strength (d) 33
2.6 Data of Tensile Strength (e) 34
3.1 Form to record the measurement of disk process before process 50
3.2 Form to record the measurement of disk process after process 50
4.1 Specification Sheet for Thin Material Ø66 X 0.800mm 53
4.2 Thickness after 1st lapping process Data 54
4.3 Average Step 2 55
4.4 Average Step 3 55
4.5 Average Step 4 56
4.6 Standard Deviation Step 5 59
4.7 Standard Deviation Step 6 59
4.8 Error Step 2 60
4.9 Error Step 3 61
4.10 Error Step 4 61
4.11 Type A Step 2 62
4.12 Type A Step 3 63
4.13 Type A Step 5 64
4.14 Type B Step 4 65
4.15 Combine Uncertainty Step 2 66
4.16 Combine Uncertainty Step 3 67
vii
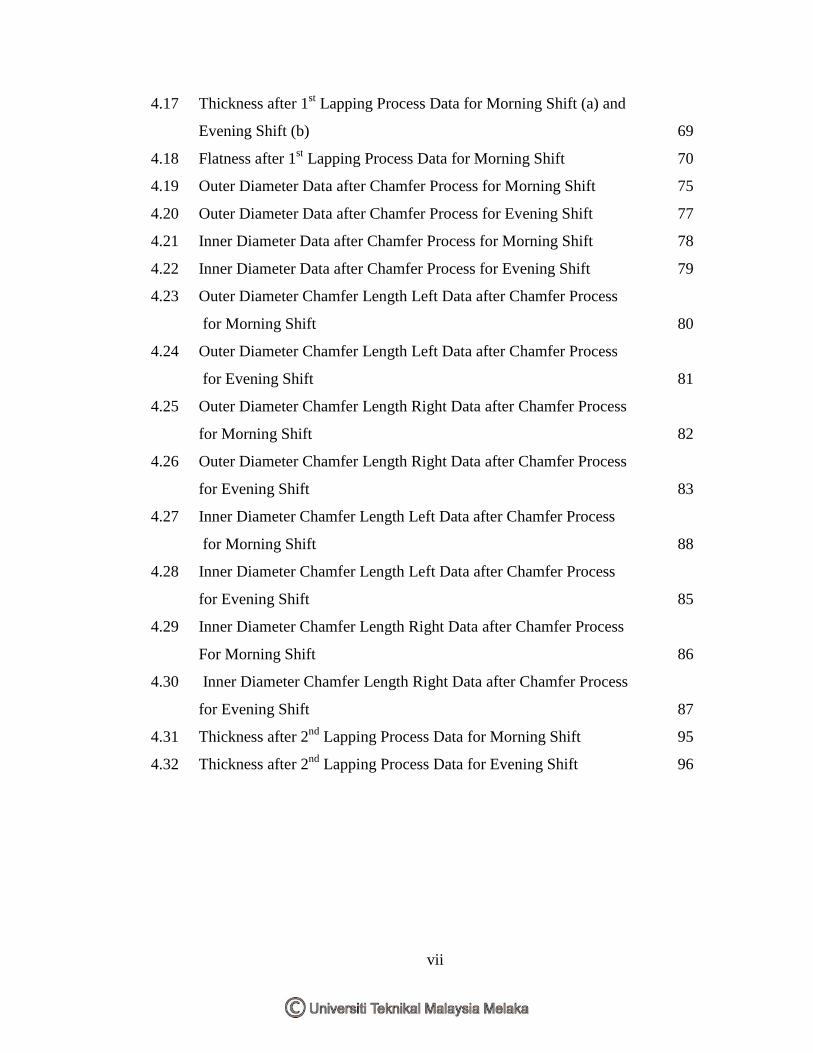
4.17 Thickness after 1st Lapping Process Data for Morning Shift (a) and
Evening Shift (b) 69
4.18 Flatness after 1st Lapping Process Data for Morning Shift 70
4.19 Outer Diameter Data after Chamfer Process for Morning Shift 75
4.20 Outer Diameter Data after Chamfer Process for Evening Shift 77
4.21 Inner Diameter Data after Chamfer Process for Morning Shift 78
4.22 Inner Diameter Data after Chamfer Process for Evening Shift 79
4.23 Outer Diameter Chamfer Length Left Data after Chamfer Process
for Morning Shift 80
4.24 Outer Diameter Chamfer Length Left Data after Chamfer Process
for Evening Shift 81
4.25 Outer Diameter Chamfer Length Right Data after Chamfer Process
for Morning Shift 82
4.26 Outer Diameter Chamfer Length Right Data after Chamfer Process
for Evening Shift 83
4.27 Inner Diameter Chamfer Length Left Data after Chamfer Process
for Morning Shift 88
4.28 Inner Diameter Chamfer Length Left Data after Chamfer Process
for Evening Shift 85
4.29 Inner Diameter Chamfer Length Right Data after Chamfer Process
For Morning Shift 86
4.30 Inner Diameter Chamfer Length Right Data after Chamfer Process
for Evening Shift 87
4.31 Thickness after 2nd
Lapping Process Data for Morning Shift 95
4.32 Thickness after 2nd
Lapping Process Data for Evening Shift 96
viii
LIST OF FIGURES
1.1 Rough of Flow Chart 4
2.1 Measurement error when measuring a concept 6
2.2 To compensate for the systematic error in my dart throwing ability, will
need to throw 10 cm lower to bit the target 8
2.3 Notice that systematic error does affect the average (call bias) 9
2.4 This dartboard shows random error that can’t be compensated. In
experimental setting it’s usually assumed that averaging a series of
measurement approximates the actual value 12
2.5 Notice that random error doesn’t affect the average, only the variability
around the average 12
2.6 The triangular distribution is used to model cases where 100% containment
limits are known and values are more likely to be near the mean than at the
extremes 27
2.7 The normal distribution 27
2.8 The U distribution model cases where the value of measures is likely
to be near the containment linear 28
2.9 Cause and Effect Diagram 42
3.1 Flow chart for PSM 1 45
3.2 Flow chart for PSM 2 46
4.1 Average Step 1 55
4.2 Standard Deviation Step 1 57
4.3 Standard Deviation Step 2 57
4.4 Standard Deviation Step 3 58
4.5 Standard Deviation Step 4 58
4.6 Error Step 1 60
4.7 Type A Step 1 62
ix
4.8 Type A Step 4 64
4.9 Combine uncertainty Step 1
4.10 Digimatic Indicator 68
4.11 Graph Average Thickness after 1st Lapping 71
4.12 Graph Error Thickness after 1st Lapping 72
4.13 Graph Flatness Measurement after 1st Lapping 72
4.14 Servo machine in Chamfering section. 73
4.15 Outer diameter measurement 74
4.16 Hole Tester measurement 74
4.17 Glass disk placed under the microscope. 75
4.18 Picture of chamfer length from microscope 75
4.19 Average Outer Diameter after Chamfer 88
4.20 Error Outer Diameter after Chamfer 88
4.21 Average Inner Diameter after Chamfer 89
4.22 Error Inner Diameter after Chamfer 89
4.23 Average Outer Diameter Chamfer Length 90
4.24 Error Outer Diameter Chamfer Length 90
4.25 Average Inner Diameter Chamfer Length 91
4.26 Error Inner Diameter Chamfer Length 91
4.27 Diamond sheet used in 2nd Lapping process. 94
4.28 Average Thickness after 2nd
Lapping 97
4.29 Error Thickness after 2nd
Lapping 97
x
ABBREVIATION
MT - Must Trial
SPC - Statistical Control Chart
UCL Upper Control Limit
LCL Lower Control Limit
CL Center Line
1
CHAPTER 1
INTRODUCTION
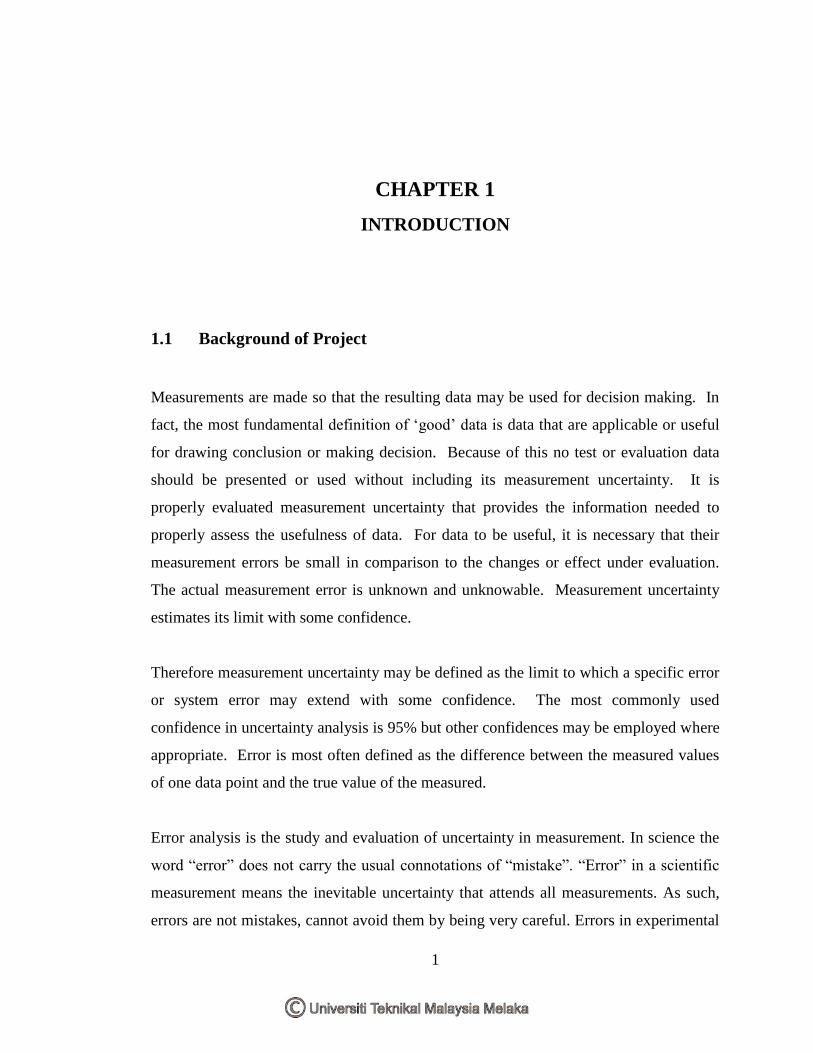
1.1 Background of Project
Measurements are made so that the resulting data may be used for decision making. In
fact, the most fundamental definition of ‘good’ data is data that are applicable or useful
for drawing conclusion or making decision. Because of this no test or evaluation data
should be presented or used without including its measurement uncertainty. It is
properly evaluated measurement uncertainty that provides the information needed to
properly assess the usefulness of data. For data to be useful, it is necessary that their
measurement errors be small in comparison to the changes or effect under evaluation.
The actual measurement error is unknown and unknowable. Measurement uncertainty
estimates its limit with some confidence.
Therefore measurement uncertainty may be defined as the limit to which a specific error
or system error may extend with some confidence. The most commonly used
confidence in uncertainty analysis is 95% but other confidences may be employed where
appropriate. Error is most often defined as the difference between the measured values
of one data point and the true value of the measured.
Error analysis is the study and evaluation of uncertainty in measurement. In science the
word “error” does not carry the usual connotations of “mistake”. “Error” in a scientific
measurement means the inevitable uncertainty that attends all measurements. As such,
errors are not mistakes, cannot avoid them by being very careful. Errors in experimental
2
measurements can be divided into two classes, (a) systematic errors and (b) random
errors. It is possible to correct for errors of the first type if the source of the error is
known. Random error typically arises from unpredictable variations of influence
quantities. These random effects give rise to variations in repeated observations of the
measured. The random error of an analytical result cannot be compensated by correction
but it can usually be reduced by increasing the number of observations. Random error
indicated by fluctuation in successive measurements and lead to imprecise
measurements. Systematic errors are reproduced in successive measurements, made
under the same conditions. It is defined as a component of error which, in the course of a
number of analyses of the same measured remains constant or varies in a predictable
way. It is independent of the number of measurements made and cannot therefore be
reduced by increasing the number of analyses under constant measurement conditions.
Uncertainty, on the other hand, takes the form of a range, and, if estimated for an
analytical procedure and defined sample type, may apply to all determinations so
described. In general, the value of the uncertainty cannot be used to correct a
measurement result. The definition of the term uncertainty (of measurement) used in
this protocol and taken from the current version adopted for the International
Vocabulary of Basic and General Terms in Metrology is "A parameter associated with
the result of a measurement, that characterizes the dispersion of the values that could
reasonably be attributed to the measured". The definition of uncertainty given above
focuses on the range of values that the analyst believes could reasonably be attributed to
the measured. In general use, the word uncertainty relates to the general concept of
doubt. In this guide, the word uncertainty, without adjectives, refers either to a
parameter associated with the definition above, or to the limited knowledge about a
particular value. Uncertainty of measurement does not imply doubt about the validity of
a measurement; on the contrary, knowledge of the uncertainty implies increased
confidence in the validity of a measurement result.
In practice the uncertainty on the result may arise from many possible sources, including
examples such as incomplete definition, sampling, matrix effects and interferences,
3
environmental conditions, uncertainties of weights and volumetric equipment, reference
values, approximations and assumptions incorporated in the measurement method and
procedure, and random variation.
In estimating the overall uncertainty, it may be necessary to take each source of
uncertainty and treat it separately to obtain the contribution from that source. Each of the
separate contributions to uncertainty is referred to as an uncertainty component. When
expressed as a standard deviation, an uncertainty component is known as a standard
uncertainty. If there is correlation between any components then this has to be taken
into account by determining the covariance. However, it is often possible to evaluate the
combined effect of several components. This may reduce the overall effort involved and,
where components whose contribution is evaluated together are correlated; there may be
no additional need to take account of the correlation
1.2 Definition of problem
Nowadays, the Must Trial processes (MT) were done by engineer at Production
Engineering Department which the disk must be checking and setting the parameter first
before the actual process running. Disk defects are checking and data were keyed- in at
the forms that are given before calculated manually. Usually the problems were arising
during calculation of defect and more error will detect. Besides that, time is important
because they can take the longer time to do the calculation.
1.3 Objective
a) To investigate the methods applies in error determination and
measurement uncertainty
b) To develop a tool for computing the measurement error and uncertainty
using Excel.
4
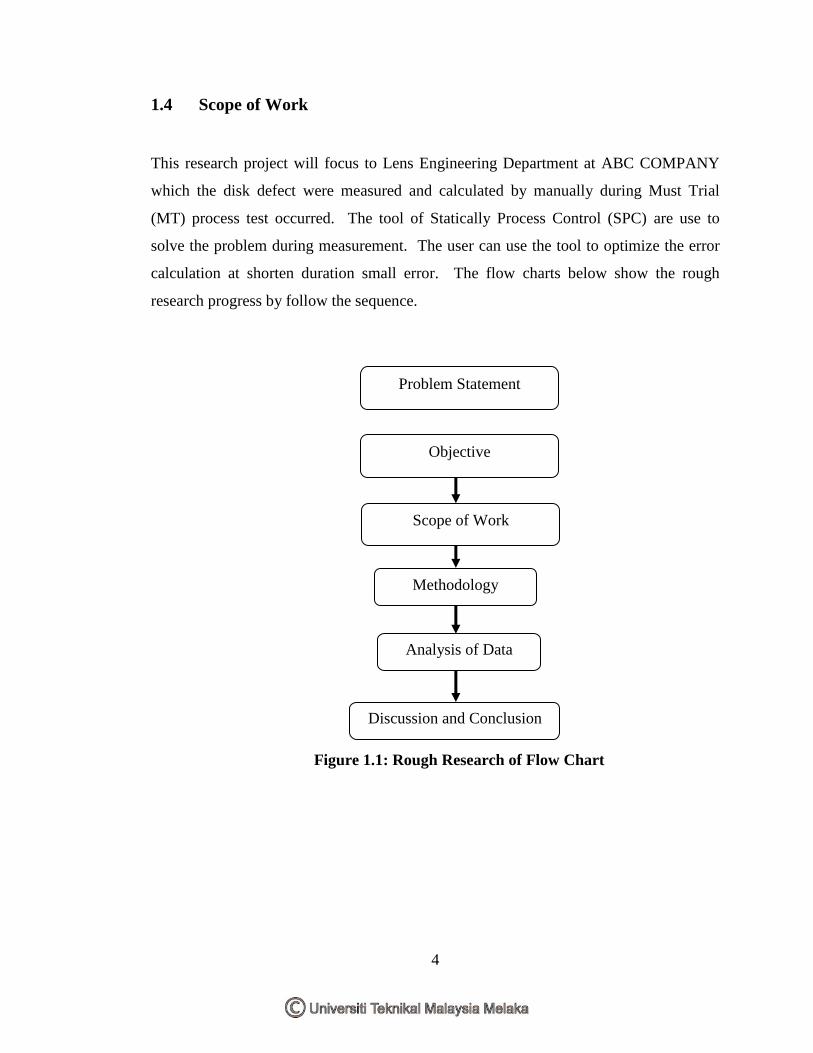
1.4 Scope of Work
This research project will focus to Lens Engineering Department at ABC COMPANY
which the disk defect were measured and calculated by manually during Must Trial
(MT) process test occurred. The tool of Statically Process Control (SPC) are use to
solve the problem during measurement. The user can use the tool to optimize the error
calculation at shorten duration small error. The flow charts below show the rough
research progress by follow the sequence.
Figure 1.1: Rough Research of Flow Chart
Problem Statement
Methodology
Analysis of Data
Discussion and Conclusion
Objective
Scope of Work
5
CHAPTER 2
LITERATURE REVIEW
2.1 Error In Measurement
2.1.1 Introduction
Error analysis is the study and evaluation of uncertainty in measurement. In science, the
word ‘error’ does not carry the usual connotations of mistake. Error in a scientific
measurement means the inevitable uncertainty that attends all measurement. As such,
errors are not mistakes cannot avoid by being very careful. The best is to ensure that
errors are as small as reasonably possible and to have some reliable estimates of how
large errors are.
There is no perfect measure. Error is inherent in any measurement strategy.
Measurement error is the difference between what exist in reality and what is measured
by a research instrument. Measurement errors exist in both direct and indirect measures
and can be random or systematic. Direct measures which are considered to be highly
accurate are subject to error. For example the scale may not be accurate the machine
may be precisely calibrated but it may change with use or the tape measure may not be
held at exactly the same tightness.
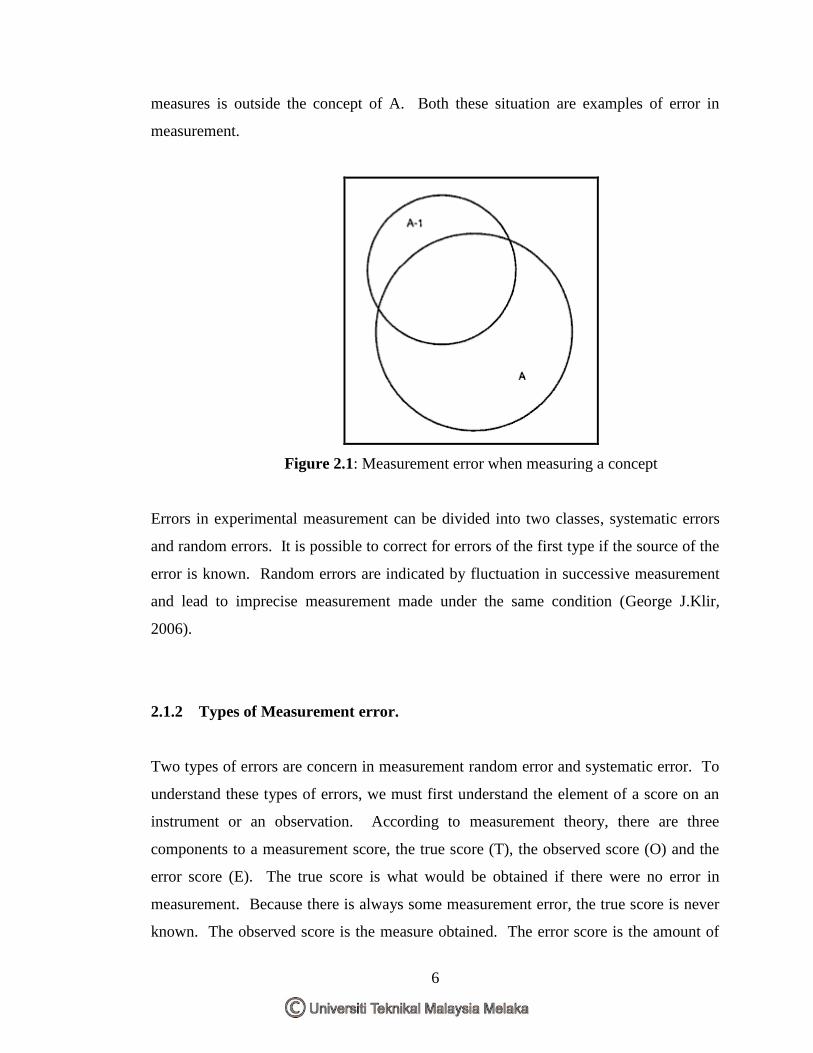
There is also error in indirect measures. Efforts to measure concepts usually result in
measuring only part of the concept but also contain other elements that are not part of
the concept. Figure 2.1 shows a Venn diagram of the concept A measured by instrument
A-1. As can be seen, A-1 does not measure all of A. In addition some of what A-1
6
measures is outside the concept of A. Both these situation are examples of error in
measurement.
Figure 2.1: Measurement error when measuring a concept
Errors in experimental measurement can be divided into two classes, systematic errors
and random errors. It is possible to correct for errors of the first type if the source of the
error is known. Random errors are indicated by fluctuation in successive measurement
and lead to imprecise measurement made under the same condition (George J.Klir,
2006).
2.1.2 Types of Measurement error.
Two types of errors are concern in measurement random error and systematic error. To
understand these types of errors, we must first understand the element of a score on an
instrument or an observation. According to measurement theory, there are three
components to a measurement score, the true score (T), the observed score (O) and the
error score (E). The true score is what would be obtained if there were no error in
measurement. Because there is always some measurement error, the true score is never
known. The observed score is the measure obtained. The error score is the amount of
7
random error in the measurement process. The theoretical equation of these three
measures is as follow:
O = T + E (2.1)
This equation is a means of conceptualizing random error and not a basis for calculating
it. Because the true score is never known the random error is never known only
estimated. Theoretical the smaller the error score the more closely the observed score
reflects the true score. Therefore using measurement strategies that reduce the error
score improves the accuracy of the measurement.
A number of factors can occur during the measurement process that can increase random
error. They are (1) transient personal factors, such as fatigue, hunger, attention span,
health, mood, mental set and motivation;(2) situational factor such as a hot stuffy room,
distraction, the presence of significant others, rapport with the researcher and the
playfulness or seriousness of the situation; (3) variations in the administration of the
measurement procedure such as interviews in which wrong or sequence of questions
varied, questions are are added or deleted or different coders code responses differently ;
and (4) processing of data such as errors in coding accidental marking of the wrong
column, punching of the wrong key when the data are entered into the computer or
incorrect totaling of instrument scores ( Howard C, 2001).
2.1.3 Systematic error
Systematic error is a wrong due to bias sources of variation that distort the study
findings in one direction. The only way to improve the accuracy of the estimate is to
design the study in a way that either reduces the size of the various biases or gives some
information about them.
Many systematic can be eliminated by the application of familiar corrections. For
example in the determination atmospheric pressure using a mercury barometer,
8
correction must be applied to allow for the difference between the thermal expansion of
mercury column and scale are at a temperature of 0 ºC. In very precise work it is
necessary, in addition to correct for the capillary depression of the mercury and for the
difference between the acceleration of gravity where the barometer is being used and the
reference point.
Systematic errors may not manifest themselves by fluctuation in measurement and
cannot be eliminated by merely repeating the measurement. These errors are therefore
especially serious and insidious and can be avoided only by careful calibration and
consideration of all possible correction. Sometimes systematic errors are indicated by
the change in the measured value resulting from a change of experimental technique or
when different values are obtained on different days.
Systematic error (or bias) occurs in epidemiology when result differs in a systematic
manner from the true values. A study with small systematic error is said to have a high
accuracy. Accuracy is not affected by sample size. The possible sources of systematic
error in epidemiology are many and varied over 30 specific types of bias have been
identified. The principal biases are selection bias and measurement bias (N.C Barford,
1967).
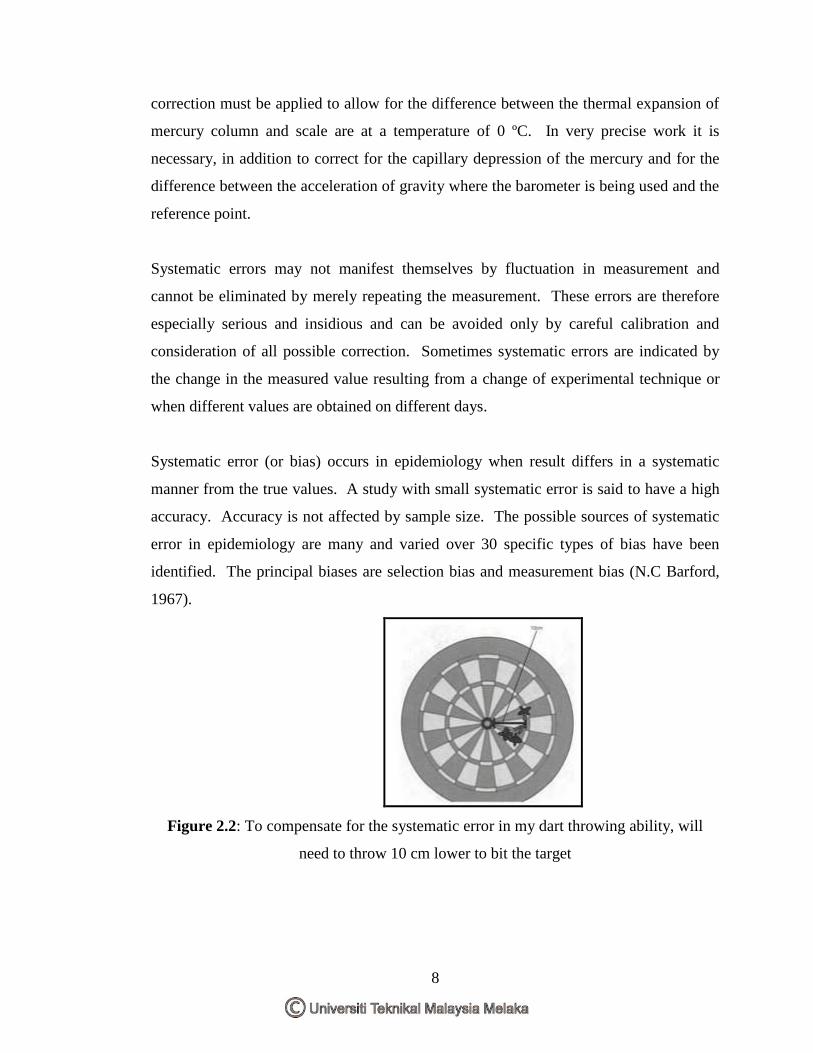
Figure 2.2: To compensate for the systematic error in my dart throwing ability, will
need to throw 10 cm lower to bit the target


