

University of Birmingham
Quality and flexibility performance trade-offsbetween lean and agile manufacturing firms in theautomotive industryQamar, Amir; Hall, Mark; Chicksand, Daniel; Collinson, Simon
DOI:10.1080/09537287.2019.1681534
License:Other (please specify with Rights Statement)
Document VersionPeer reviewed version
Citation for published version (Harvard):Qamar, A, Hall, M, Chicksand, D & Collinson, S 2019, 'Quality and flexibility performance trade-offs betweenlean and agile manufacturing firms in the automotive industry', Production Planning & Control: The Managementof Operations, pp. 1-16. https://doi.org/10.1080/09537287.2019.1681534
Link to publication on Research at Birmingham portal
Publisher Rights Statement:This is an Accepted Manuscript of an article published by Taylor & Francis in Production Planning & Control on 25.10.19, available online:https://www.tandfonline.com/doi/full/10.1080/09537287.2019.1681534
General rightsUnless a licence is specified above, all rights (including copyright and moral rights) in this document are retained by the authors and/or thecopyright holders. The express permission of the copyright holder must be obtained for any use of this material other than for purposespermitted by law.
•Users may freely distribute the URL that is used to identify this publication.•Users may download and/or print one copy of the publication from the University of Birmingham research portal for the purpose of privatestudy or non-commercial research.•User may use extracts from the document in line with the concept of ‘fair dealing’ under the Copyright, Designs and Patents Act 1988 (?)•Users may not further distribute the material nor use it for the purposes of commercial gain.
Where a licence is displayed above, please note the terms and conditions of the licence govern your use of this document.
When citing, please reference the published version.
Take down policyWhile the University of Birmingham exercises care and attention in making items available there are rare occasions when an item has beenuploaded in error or has been deemed to be commercially or otherwise sensitive.
If you believe that this is the case for this document, please contact [email protected] providing details and we will remove access tothe work immediately and investigate.
Download date: 02. Dec. 2021
1
Quality and Flexibility Performance Trade-Offs between Lean and Agile Manufacturing Firms in the Automotive Industry
Amir Qamar*a , Mark A. Hallb, Daniel Chicksandb and Simon Collinsona
a Department of Strategy and International Business, Birmingham Business School, University of Birmingham, Edgbaston, UK.
b Department of Management, Birmingham Business School, University of Birmingham, Edgbaston, UK.
Abstract:
Firms operating in the automotive industry have traditionally been ascribed with efficiency and high levels of quality, as lean production has been extensively applied within this context, but given the recent dynamics in the automotive sector, there is also a need for high levels of flexibility, widening our attention to agile production. However, when lean and agile production have been explored simultaneously, the quality and flexibility trade-offs have been mixed and unclear. In order to dispel the lean-agile ambiguity, and given that both high levels of flexibility and quality are required within the automotive industry, the purpose of this study was to: a) Identify the relationship between flexibility and quality; and b) Explore the quality and flexibility differences between lean and agile production. Primary quantitative data was obtained via a survey and a total of 140 automotive manufacturing firms within the UK returned the survey. Logistic regressions were utilised as the main mode of analysis. Not only was an inverse relationship found between quality and flexibility, but our findings depict two distinctive Business Models (BMs) existing in the automotive industry, one lean and one agile. We advance the lean-agile debate by asserting that lean and agile firms acquire quality (efficiency) and flexibility strengths respectively, and not vice-versa. Given this, we theoretically side with the notion of performance ‘trade-offs’ and contend the idea that capabilities are cumulatively gained. By incorporating an argument built on the strategy literature on BMs and Dynamic Capabilities, we assert that lean and agile firms have evolved to underpin different kinds of competitive advantage within the same industry, but these advantages are placed at different tiers in the automotive supply chain.
Key Words: Flexibility; Quality; Lean; Agile; Performance; Automotive; Trade-offs; Supply Chain.
*Corresponding author email: [email protected]

2
1.0 Introduction
With its origins traceable to the Japanese Toyota Production System (TPS), lean production has been
extensively researched and applied in the automotive context (Moyano-Fuentes et al., 2012; Bhamu &
Sangwan, 2014; Marodin et al., 2016; Tortorella et al., 2016, 2017). As this concept specifies reduced
waste, continuous improvement and lower levels of inventory, it would be expected that high levels of
efficiency (Cherrafi et al., 2019), and in turn, quality (i.e. reduction of defects, reduced warranty
claims, reduced customer complaints and reduced scrap levels) are obtained within the automotive
industry. However, in order to be competitive, high levels of flexibility, which refers to a firm’s
ability to adjust or adapt their operation in line with the market environment, are also required by
firms (Dwaikat et al., 2018), especially in the automotive industry. In fact, two recent challenges
within the global automotive industry have been identified as: a) volatile fluctuations in terms of
product mix and production volume, and b) the ability to adapt and produce products in time (Qamar
et al., 2018). The UK automotive industry, which is the research setting in this study, experienced a
boom in output from 2010-2016 (SMMT, 2016); thus, the ability to respond quickly and effectively to
changes in demand (Ifandoudas & Chapman, 2009) are just as important as efficiency and quality
priorities (Chi & Gursoy, 2009). Given this, it is also important to address a production concept that
has continually been affiliated with adaptability (Purvis et al., 2014), namely, agile production. Yet,
there is limited research on agile production within the automotive context (Qamar et al., 2018) and
the recent lean and agile literature (Loss & Crave, 2011; Martinez-Jurado & Moyano-Fuentes, 2014,
Vinodh et al., 2014; Bevilacqua et al., 2015; Gligor et al., 2015; Godinho Filho et al., 2016; Zhang et
al., 2016; Pavlov et al., 2017; Tarafdar & Qrunfleh, 2017; Tortorella & Fettermann, 2017; Bai et al.,
2019; Chiarini & Brunetti, 2019; Yadav et al., 2019) has examined each of these production concepts
in silos. Thus, there is a deficiency in studies that have explored the differences in performance
between lean and agile production strategies (Qamar et al., 2018), especially from a quality
perspective (Shahin & Rezaei, 2018).
Agility been advocated as one of the most salient issues of contemporary supply chain
management (Gligor et al., 2015) and a large proportion of the literature has focused on its enablers,
antecedents and effects on business performance (Roscoe et al., 2019). Agile production is said to be
an evolved version of lean production (Hormozi, 2001), as lean methods can act as a potential catalyst
for agile methods (Ifandoudas & Chapman, 2009; Ghobakhloo & Azar, 2018). Considering that agile
production encompasses certain lean elements as well as more radical innovative-led practices, from a
theoretical perspective, this suggests that agile capabilities are cumulatively gained in association with
lean capabilities. Yet, given Skinner’s (1969) landmark assertion that firms cannot compete on all
performance dimensions, it is important to investigate whether agile practices (radical innovative-led
practices), and in turn flexibility, come at the expense of lean practices (innovative, but incremental
process-refinement practices), thus efficiency and quality levels in production. Both, the trade-off

3
theory and the notion of cumulative capabilities are increasingly important within the recent
Operations Management literature (Wurzer & Reiner, 2018). In this paper we use theoretical insights
from distinct Business Models (BM) to frame our argument concerning the flexibility and quality
disparities between lean and agile firms. Furthermore, the concept of ambidexterity, recently applied
to supply chains as an extension to studies of single organizations, provides a central framing to
understand ‘why’ and ‘where’ these trade-offs occur in automotive supply chains (Blome et al.,
2013a; Kristal et al., 2010).
Using the UK automotive industry as our research setting, our findings advance the lean-agile
debate (Narasimhan et al., 2006; Hallgren & Olhager, 2009; Purvis et al., 2014; Qamar & Hall, 2018;
Moyano-Fuentes et al., 2019) and make several worthwhile contributions. First, we make a
methodological contribution by empirically operationalising flexibility and quality performance
measures without resorting to the use of case studies or Likert-scale questions, limiting validity and
reliability concerns (Vachon & Klassen, 2008). Second, we find an inverse relationship between
quality and flexibility, and more specifically, we find that lean and agile firms acquire quality and
flexibility strengths respectively, and not vice-versa. Therefore, our results confirm the notion of
‘trade-offs’ and Skinner’s (1969) assertion that manufacturing strategies compete on different
performance objectives. Our findings complement the work on supply chain agility and adaptability in
the automotive sector context (Dubey et al., 2018), specifically by providing new insights into the
micro-foundations of different kinds of dynamic capabilities in the form of the processes and practices
that underpin lean or agile BMs. Moreover, we shed light on some of the misconceptions concerning
the lean-agile debate by refuting the notion of cumulative capabilities in this context, also known as
the ‘law of cumulative capabilities’ (Schmenner & Swink, 1998). Finally, we acknowledge and
respond to Moyano-Fuentes et al.’s (2019) recent call, that supply chain studies need to utilise both
lean and agile concepts, by illustrating that high levels of quality (lean) and flexibility (agile) are
likely to be found downstream and upstream in automotive supply chains respectively. This argument
is built from the strategy literature on BMs and dynamic capabilities, which links the contingent
positioning of firms within automotive supply chains to specific production methods and capabilities
they have evolved to underpin different kinds of competitive advantage within the same industry.
This article is structured as follows. Next, we present the literature review. In section 3.0, we
outline the theoretical framework that underpins the development of our hypotheses. Following this,
in section 4.0, we detail the methodology. We then outline our analytical findings in section 5.0 and
discuss the results and the theoretical implications of our research in section 6.0. Finally, we conclude
the article, present our limitations, and suggest potential avenues for future research.
2.0 Literature Review: Lean and Agile Production

4
A large stream of literature asserts that lean production is affiliated with high levels of efficiency and
quality (Chavez et al., 2013; Fullerton et al., 2014). Efficiency and quality are linked together because
quality concerns may compromise productivity and thus the use of resources (efficiency) (Cherrafi et
al., 2019). However, Negrao et al.’s (2017) review of lean studies clearly shows that this is not
necessarily always the case. In fact, Chiarini & Brunetti (2019) found a weak relationship between
quality management systems and the successful implementation of lean practices. In contrast,
although the agile concept has been associated with high levels of flexibility (Yusuf et al., 2014),
when lean production has been investigated individually, Chavez et al. (2013) and Yusuf et al. (2014)
assert that high levels of flexibility are also ascribed with lean practices. Given this, it is important to
review the studies that have explored both production concepts. While lean production has often been
investigated in association with six-sigma and quality management concepts (Clegg et al., 2010;
Zhang et al., 2016; Wang et al., 2019), few studies have investigated it relative to agile production,
especially with the inclusion of quality (Shahin & Rezaei, 2018).
The few studies (Yusuf & Adeleye, 2002; Cagliano et al., 2004; Narasimhan et al., 2006;
Hallgren & Olhager, 2009; Ghobakhloo & Azar, 2018) that have explored the differences between the
two concepts have presented mixed findings. For instance, Cagliano et al. (2004) found lean to be
superior to agile production in most levels of performance (operational and flexibility), but the
difference was not deemed to be of significance. In contrast, Yusuf & Adeleye (2002) found that
organisations focussing on agility displayed higher business performance scores relative to lean firms,
who were prioritising cost and quality. In an attempt to disentangle each production concept, based
upon data from 224 organisations Narasimhan et al. (2006) found that lean firms scored well in terms
of cost efficiency, conformance in quality, and design quality, yet the agile firms were superior to lean
firms in terms of design quality, conformance quality, delivery reliability, delivery speed, new product
flexibility, and process flexibility. This was contested by Hallgren & Olhager’s (2009) findings,
which were based upon a sample of 211 firms. More specifically, in terms of cost, quality, delivery
speed and delivery reliability, they found lean production to outperform agile production. Although
agile production significantly outperformed lean in terms of volume and product mix flexibility, but
lean production was also identified to be associated with flexibility. In fact, Hallgren & Olhager
(2009) found that both lean and agile practices significantly impacted quality, delivery speed and
delivery reliability. More recently, Ghobakhloo & Azar (2018) conducted a study with a sample of
189 Iranian automotive firms and found that agile production had a significant impact on financial
performance, whereas lean production had a significant impact on operational performance. Qamar &
Hall (2018) found a relationship between lean and agile practices at different tiers in the UK
automotive industry; however, performance was not included in their investigation. Qamar et al.
(2018) assert that agile firms acquire higher levels of flexibility when compared to lean firms, but this
5
evidence was based upon descriptive findings and levels of quality or efficiency were not included,
highlighting the need to investigate multiple dimensions of performance.
In summary, not only is there a deficiency in lean-agile studies, but the quality, and to a
certain extent the flexibility, disparities between the two production concepts are not so clear in the
literature (Narasimham et al., 2006; Hallgren & Olhager, 2009; Ghobakhloo & Azar, 2018). Thus, the
lean-agile debate requires further development and in the following section we outline our theoretical
underpinning of our hypotheses.
3.0 Theoretical Framework
Considering that approximately only one third of studies within Supply Chain Management and
Operations Management (Chicksand et al., 2012; Walker et al., 2015) have applied theories to ground
their research, we believe it is important to thoroughly address our theoretical rationale. We
conceptualise lean and agile as different types of firms with distinctive BMs. Although some authors
(Chicksand et al., 2012; Walker et al., 2015) do not associate BMs as theory per se, we argue that
BMs can be seen as a theoretical and conceptual tool. This is because BMs combine a set of
interrelated building blocks within an organisation (Loss & Crave, 2011), and a different set of
interrelated building blocks leads to alternative strategies, in this case lean or agile systems. The BM
framework has been utilised by business and marketing practitioners to outline various components of
the business strategy in order to attract customers and potential markets (Loss & Crave, 2011). We
assert that lean and agile production concepts are BMs that are identifiable by a particular common set
of characteristics, which underpin both their differentiation relative to other firms and their
competitive position and value proposition in the market. They are the result of prior trade-offs; a
series of past decisions which have dedicated resources to the development either lean or agile
capabilities. Thus, as will be discussed below, theoretically anchoring our research on BMs can assist
in explaining the notion of trade-offs.
The literature (Foss & Saebi, 2017) on BM and Business Model Innovation (BMI) has
defined a BM as the “design or architecture of the value creation, delivery, and capture mechanisms”
of a firm (Teece, 2010: 172). Importantly, BMs and BMI are linked closely with dynamic capabilities
(Eckstein et al., 2015; Dubey et al., 2018). When combining these conceptual frameworks, the
literature asserts that different kinds of dynamic capability are required for firms to maintain different
BMs. In an approach framed by the concept of ambidexterity, differentiation arises from the
development of dynamic capabilities which give rise to strengths in exploration (R&D, creativity,
radical innovation), in comparison to those which underpin BMs that specify exploitation
(incremental innovation, efficiency in leveraging existing assets and capabilities). This idea follows

6
studies of James March (March, 1991) and others in application to the context of supply chain
management (Kristal et al., 2010). The process by which firms evolve their set of distinctive dynamic
capabilities and a specific BM involves decision-making concerning performance ‘trade-offs’. The
notion of ‘trade-offs’, which is also referred to as the law of ‘trade-offs’ (Schmenner & Swink, 1998),
is traceable to Skinner’s (1969) assertion that firms compete on different performance aspects other
than just costs. Da Silveira & Slack (2001) and Forrester et al. (2010) suggest that the Resource-
Based View (RBV) provides a useful framing to understand how strategic focus requires
specialisation, which in turn requires resources to be dedicated to particular structures, processes and
capabilities to underpin a sub-set of competitive advantages in relation to a unique position in a
competitive market. In this sense, we argue that different BMs focus on different performance goals
and these orient a firm towards a specific set of valuable, rare, inimitable, and non-substitutable
(VRIN) resources and capabilities (Barney, 2002).
The dynamic capabilities approach is an extension of the RBV, and both can support an
exploration of different kinds of BM’s in action. They are complementary, rather than alternative or
competing theoretical approaches. We examine lean and agile firms as having evolved BMs which are
underpinned and identifiable by particular dynamic capabilities that conform to the VRIN archetype
as they underpin sustained competitive advantage (otherwise such firms would not survive and co-
exist in the same automotive market). To better-understand the micro-foundations that differentiate
lean and agile BMs we build on prior studies (Wong et al., 2014) to identify lean, agile and ‘hybrid’
tools, practices, routines & concepts (TPRCs) as evidence of these distinctive dynamic capabilities.
Table 1 lists these, including an ‘overlapping category’ of ‘Hybrid’ TPRCs associated with both lean
and agile capabilities.
Table 1: Lean, Agile and ‘Hybrid’ Tools, Practices, Routines & Concepts (TPRCs)
Concept TPRCs Source Lean a) Elimination of waste
b) Continuous improvements c) Zero defects d) Production smoothing e) Line balancing f) Value stream mapping g) Total productive maintenance h) 5s
Bamber & Dale (2000); Sanchez & Perez (2001); Soriano-Meier & Forrester (2002); Shah & Ward (2007); Forrester et al. (2010); Lyons et al. (2013); Bhamu & Sangwan (2014); Wong et al. (2014); Jasti & Kodali (2015); Bamford et al. (2015); Godinho Filo et al. (2016); Negrao et al. (2017); Tortorella et al. (2017); Bellisario & Panwar et al. (2018) Pavlov (2018).
Hybrid (Lean & Agile)
i) Just-in-time j) Kanban k) Multi-functional machines l) Multi-functional teams m) Total quality management n) Employee empowerment o) Single minute exchange dies
Gunasekaran (1999); Sanchez & Perez (2001); Sharifi & Zhang (2001); Soriano-Meier & Forrester (2002); Shah & Ward (2007); Inman et al. (2011); Bhasin (2012); Godinho Filo et al. (2016); Yin et al. (2017)
Agile p) Virtual enterprise q) Concurrent engineering r) IT-driven enterprise s) Rapid prototyping
Gunasekaran (1999); Sharp et al. (1999); Cao & Dowlatshahi (2005); Vinodh & Kuttalingam (2011); Clegg & Wan (2013); Yin et al. (2017)

7
t) Reconfiguration u) Core competence management v) Knowledge driven enterprise
Source: Adapted from Qamar & Hall (2018)

8
3.1 Trade-Offs: Development of Hypotheses
Figure 1 outlines how innovation studies and the concept of ambidexterity can be applied to the
current discussion about lean vs. agility trade-offs to provide new empirical insights. Ambidextrous
firms in this context would demonstrate a capacity for managing both quality (efficiency) and
flexibility positions (A and B in Figure 1), underpinned by both kinds of innovative capabilities,
straddling the ‘trade-off gap’ between these two options. However, much of the literature surrounding
the notion of performance trade-offs, and in turn the performance paradox (Ostroff and Schmitt, 1993;
Weigelt and Sarkar, 2012) argues that maintaining ambidexterity is very challenging, because there
are incompatibilities between the required capabilities and processes. Organisations are forced to
pursue either an exploitation-oriented approach and focus their attention on continuous but
incremental improvement of existing quality, efficiency, products, and services (Patel et al., 2012), or
an exploration-oriented approach, prioritising radical innovative practices geared towards flexibility.
Figure 1: The Trade-Off Law in Association with Quality and Flexibility
Source: Adapted from Da Silveira & Slack (2001, p.951)
The idea that firms operate closer to A or B is supported by Hallgren et al. (2011), who found
quality (efficiency) and flexibility not to exhibit a cumulative pattern. Moreover, Ebben & Johnson
(2005) advocated that organisations pursuing either efficiency-driven practices or flexibility-driven
practices, outperformed the organisations that tried to do both. Given this, an important responsibility
of managers is to balance quality and other performance metrics (Shahin & Rezaei, 2018). While
some studies have found that quality performance and flexibility performance can be acquired
cumulatively (Nakane, 1986, cited in Bortolotti et al., 2015) based upon the discussion presented in
this section we propose that high levels of quality are achieved at the expense of being highly flexible.

9
Thus, in Figure 1, moving towards point A comes at the expense of B and with this in mind, we
propose:
Ha: There is an inverse relationship between quality and flexibility levels of performance.
Next, we argue that the TPRCs are the identifiable components of dynamic capabilities in the
firm. Although there are similarities between lean and agile production we assert that as each
production strategy requires a different combination of TPRCs, which in turn underpin different
dimensions of performance. Consequently, lean and agile production were conceptualised upon the
assumption that each strategy would inevitably lead to different performance strengths and that ‘trade-
offs’ would be present (Da Silveira & Slack, 2001), which is illustrated in Figure 1. More specifically,
we argue that lean firms in the automotive industry implement the necessary practices to achieve high
levels of quality (Shah & Ward, 2003), thus they move towards position A in Figure 1. This includes
capabilities that underpin incremental process innovation, to steadily improve quality and reliability,
but at low-cost which comes at the expense of flexibility. Although there were some mixed views in
the literature (see section 2.0), in terms of efficiency and quality, lean production (Cagliano et al.,
2004; Hallgren & Olhager’s, 2009) has been identified to outperform agile production. Given this, we
hypothesise that lean firms acquire or develop capabilities which allow for higher levels of efficiency,
thus high levels of quality (Calvo et al., 2008; Pakdil & Leonard, 2014).
Finally, we assert that to achieve high levels of responsiveness, some firms are expected to
cater to large internal and external variances concerning factors such as volume, variety, delivery and
supplier capabilities. This is in contrast to a lean production position where efficiency and quality are
achieved at least partly by reducing the internal and external variances of the same factors (Naylor et
al., 1999; Bellisario & Pavlov, 2018). Uncertainty results in more room for error for firms which face
high levels of internal and external variances, so we would expect that responsiveness comes at the
cost of lower levels of quality. When both concepts have been explored simultaneously, although
some studies have found an association with lean and flexibility (Hallgren & Olhager, 2009), others
have found flexibility to be the most significant performance characteristic that can distinguish lean
and agile production (Gunasekaran et al., 2008; Purvis et al., 2014). We argue that as adaptability (in
the form of flexibility) is increasingly required within the automotive industry (Qamar et al., 2018),
firms are also being driven to develop innovative capabilities in relation to their product portfolios.
These firm acquire or develop the kinds of capabilities which enable high levels of flexibility.
However, we argue that this comes at the expense of efficiency-related capabilities, thus they are
positioned close to point B in Figure 1. Taking the arguments presented in this section into account,
we hypothesise:

10
Hb: Firms implementing lean TPRCs acquire high levels of quality in comparison with firms implementing agile TPRCs.
Hc: Firms implementing agile TPRCs acquire high levels of flexibility in comparison with firms implementing lean TPRCs.
In summary, our approach uses the notion of BMs and ‘trade-offs’ within a theoretical
framework that focuses our attention on resources and innovation-related capabilities (lean –
exploitation, agile – exploration) that support specific competitive strengths and commensurate
market positions within the automotive industry.
4.0 Methodology
In total, 1,710 firms were identified as the population operating within the West Midlands automotive
industry. Approximately 25% (450 firms) of the original population were contacted over a 6-month
period in 2014. Managing Directors and Operational Directors were contacted via the use of emails
and LinkedIn. In total, 140 surveys were completed revealing a response rate of 31%. A total of 42,
64 and 34 firms returned the survey within the first two months, during months 2-4, and within
months 4-6 respectively. Miller & Smith (1983) assert that the generalisability of findings increases
considerably if non-response bias is avoided; thus, to test for non-respondent bias (Armstrong &
Overton, 1977), similar to Panwar et al.’s (2018) and Moyano-Fuentes et al.’s (2019) study, late
respondents were considered as a surrogate for non-respondents and the first 30 surveys received were
compared to the last 30 received surveys. T-tests were conducted concerning five random TPRCs,
flexibility and quality. No significant differences were found which suggested non-response bias did
not exist.
4.1 Distinguishing Lean & Agile Firms
The synthetisation of lean (Bai et al., 2019) and agile constructs is complex, thus there is no universal
composition of lean (Panwar et al., 2018) and agile practices. Given this, we adopted the same
approach as Qamar & Hall (2018) when identifying lean and agile TPRCs. Our survey asked firms to
state the extent to which each of the twenty-two TPRCs from Table 1 was being implemented within
their organisation on a Likert-scale ranging from 1 (zero levels) to 5 (high levels). The mean values
were calculated for the three bundled TPRCs groups (lean, agile, hybrid) and depending on which was
the highest, firms were distinguished as being lean, agile or ‘hybrid’. Although the distinguishing
approach used within this study can also imply that all firms are only partially lean or agile,
identifying firms as ‘totally’ implementing a production strategy such as lean or agile can be
considered to be a dated approach (Bamford et al., 2015). Importantly, no firm scored the highest
within the ‘hybrid’ group; hence, we focus our attention to just lean and agile firms. This was an early

11
indication that ambidexterity was difficult to sustain, as firms were largely compelled to adopt a lean
or an agile BM. We found that 74 firms and 66 firms were identified as pursuing lean and agile
practices respectively, which was 97% consistent with the original responses when respondents were
asked which of the three manufacturing strategies was being implemented to the greatest extent.
Further justification concerning the extraction of two factors (lean, agile), as opposed to three factors
(lean, agile, hybrid) can be found in section 4.5.
4.2 Operationalising Quality
Table 2 highlights the mode in which quality dimensions were operationalised. Percentage of defects
is a way of assessing quality levels (Wang et al., 2004; Kumar et al., 2006; Carvalho et al., 2012).
Quality and efficiency can also be capture via documenting the percentage of defects that were
recyclable or re-worked (Laohavichien et al., 2009). For instance, when products are considered
defective to a minor degree, organisations may recycle the raw material for the same or another
product. Therefore, we captured the percentage of products that were entirely scrapped. The rationale
was simple, the higher the scrap levels then the lower the recyclability of defects, thus the wasted
energy used in production is relatively high (Cheraffi et al., 2019). Given this, firms were asked to
state the average percentage of products that were scrapped and not recyclable having been
considered defective. Customer satisfaction rates can also provide an interesting insight, as they can
be used as indicators of whether or not customers are likely to buy from a firm again (Cai et al.,
2009). This study therefore incorporated the measurement of quality levels by asking organisations to
state the percentage of customer complaints and warranty claims (Upadhye et al., 2010; Carvalho et
al., 2012; Psomas et al., 2014). Customer complaints and warranty claims are also another form of
quality (Zhang et al., 2003) and efficiency, the notion here is that if customers lodge complaints and
the products are sent back, more production energy is required when refurbishing or replacing the
product.
Table 2: Operationalisation of Quality
Quality Items
Unit Operationalisation Source
Defects % Percentage of defects in relation to total output
Wang et al. (2004); Kumar et al. (2006); Carvalho et al.
(2012) Customer
complaints % Percentage of customer complaints in
relation to customer orders Cai et al. (2009); Carvalho et al.
(2012). Warranty
claims % Percentage of warranty claims in
relation to customer orders Upadhye et al. (2010); Psomas
et al. (2014). Scrap levels % Percentage of defects in relation to
total output that were not recyclable/rework able/reusable
Biswas & Sarker (2008); Laohavichien et al. (2009).

12
4.4 Operationalising Flexibility
Traditionally, flexibility is characterised by factors such as low set-up time, reduced switching time,
rapid production and high variety of products (Dwaikat et al., 2018). However, to be more specific
flexibility can be categorised into two groups: Internal Flexibility (IF) and External Flexibility (EF)
(Oke, 2005), where IF refers to forms of flexibility that can occur within systems (Malhotra &
Mackelprang, 2012) and EF refers to flexibility that can be seen by external groups, such as
customers. Building from Gerwin’s (1993) seven dimensions of flexibility, D'Souza & Williams
(2000) outlined four flexibility groupings: (1) volume flexibility; (2) variety flexibility; (3) process
flexibility; (4) materials handling flexibility, where (1) and (2) belong within EF and (3) and (4) are
part of IF. Importantly, each dimension of flexibility comprises of range and mobility (Qamar et al.,
2018), therefore two groupings (volume, variety) were categorised within EF (see Table 3).
Table 3: Operationalisation of Flexibility
Flexibility Range Mobility Unit Operationalisation Source
Volume Volume
flexibility demand
-
Volume flexibility
cost
CV
%
Variance in orders per month.
Cost savings when
doubling volume output
Sethi & Sethi (1990); Beamon (1999)
Carter (1986)
Variety
Product Mix
flexibility
-
- New product
flexibility
N
N
Total number of different (unique)
products produced
Time (days) required to introduce new products
Gerwin (1987); Malhotra &
Mackelprang (2012)
Sethi and Sethi (1990); Beamon (1999); Cai et
al. (2009) Source: Adapted from Qamar et al. (2018)
With regards to volume flexibility in demand, first, the standard deviation of orders per month was
calculated. However, as standard deviations can vary quite sharply between each firm, the coefficient
of variance (CV) was used when making comparisons. The CV generally ranges from 0 to 1 and
measures the uniformity of the data. The greater the uniformity of the data, the closer the CV will be
to the value of 0. Next, in order to measure the mobility of volume flexibility one must observe the
total costs required when doubling the output volume (Carter, 1986). Therefore, we asked respondents
to state the average percentage of total costs saved when doubling the volume of goods. The range
concerning variety flexibility can be measured by product mix flexibility, which identifies the range
of individual product types that can be manufactured over a certain period of time (Qamar et al.,
2018). Thus, firms were asked the total unique products produced over the investigated time period.
The mobility of variety flexibly can be measured by new product flexibility, which refers to the ease
with which a firm can introduce new products within its organisation (Beamon, 1999). This can be

13
assessed by the time required to produce a new product or the excess cost required when setting up a
new product (Sethi & Sethi, 1990). As speed and responsiveness have repeatedly been affiliated with
differentiating each concept, speed was used as the unit of measurement. Thus, we asked firms for the
average time spent (days) when introducing new products into their organisation.

14
4.5 Analysis
Initially, we used Principal component factor analysis to determine the number of factors concerning
the TPRCs listed in Table 1. Kim & Mueller (1978) assert that factors that account for a variance
greater than one (Eigen values > 1) should only be used. Although the results revealed three factors
(lean, agile and hybrid) which had eigenvalues greater than one, the third factor’s (hybrid) eigenvalue
was marginally over the value of 1, and considering that the two-factor solution accounted for 69% of
the variance, as opposed to 75% with the three-factor solution, it was deemed appropriate to exclude
the examination of a third factor.
The internal consistency reliability amongst the TPRCs investigated was tested using
Cronbach’s alpha. The results are reported in Table 4. Vogt (1999) asserts that constructs with a value
of more than 0.70 suggests that the sub-items are measuring the same construct. Both lean and agile
TPRCs from Table 1 were identified as scoring well above the 0.70 threshold, thus they were deemed
as being internally consistent and reliable. Although the hybrid strategy also acquire a score which
was above the threshold criteria, as no firm scored highest within the hybrid strategy, once again, the
inclusion of ‘hybrid’ was omitted.
Table 4: Reliability of TPRCs Associated with Lean and Agile production
Manufacturing Strategy Number of Items Cronbach’s Alpha Lean 15 0.72
Lean excluding hybrid TPRCs 8 0.82 Hybrid 7 0.73 Agile 13 0.70
Agile excluding hybrid TPRCs 7 0.92
For Hb and Hc, the analysis involved the use of logistic regressions in SPSS. Researchers
(Moayed & Shell, 2009; Jayaram et al., 2010; Qamar & Hall, 2018) incorporate the use of logistic
regressions when predicting the probability/odds ratio of categorical placement or category
membership concerning a dependent variable based upon multiple independent variables. This is
measured via estimating the probability by using a logistic function. In the regression models, B refers
to the log odds ratio and Exp (B) is the odds ratio of the predictor variable relative to the dependent
variable (Jayaram et al., 2010). The independent variables (predictor) in this study were lean/agile,
which were coded as 1 or 0 depending on the models. The dependent variables were flexibility (for
models 1FL-4FL and models 1FA-4FA) or quality (for models 1QL-4QL and models 1FL-4FL)
performance levels, which were coded as low, medium and high. The performance parameters (low,
medium, high) for each of the dependent variables are outlined in Table 5. Given that the log odds
ratio is challenging to interpret, researchers often interpret the findings by observing the odds ratio of
having made the event (Jayaram et al., 2010). In essence, the odds ratio measures the predicted
15
change in odds of the dependent variable for a unit change in the corresponding predictor (lean versus
agile). If a model has an odds ratio below one this represents a decrease in odds (less likely), whereas
an odds ratio greater than one represents an increase in odds (more likely). Finally, if the odds ratio is
relatively close to one, this means that that a unit change in the predictor variable does not impact the
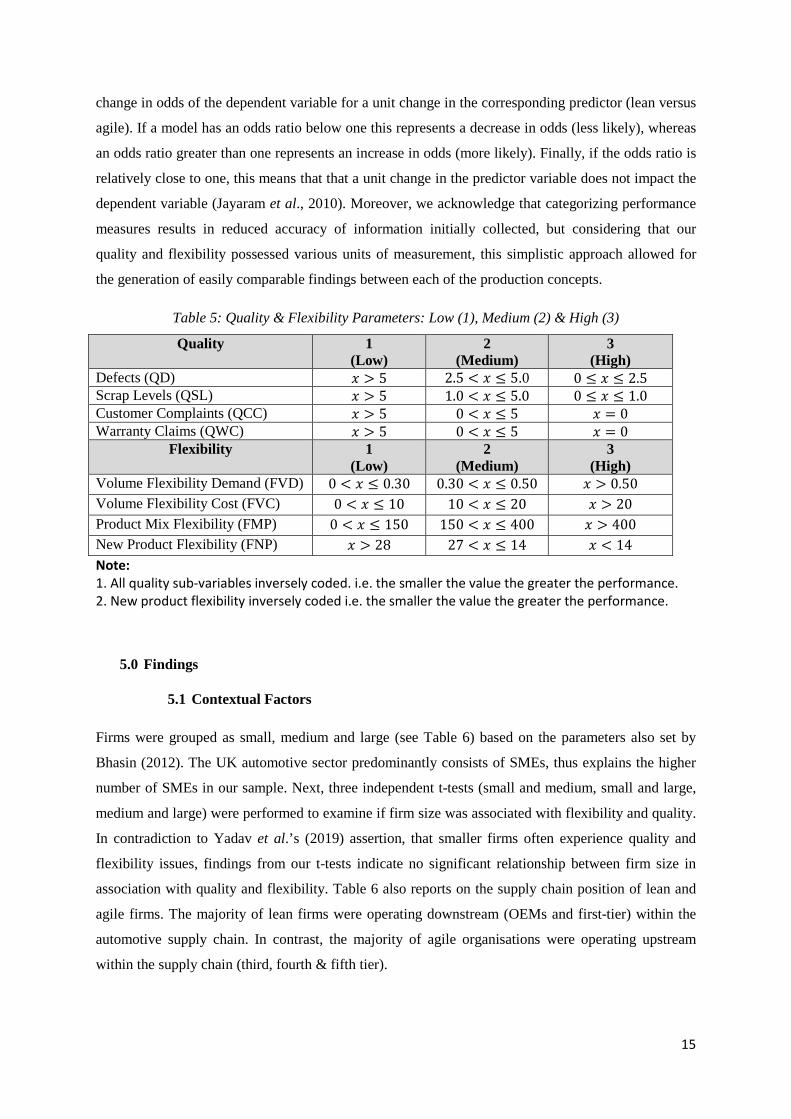
dependent variable (Jayaram et al., 2010). Moreover, we acknowledge that categorizing performance
measures results in reduced accuracy of information initially collected, but considering that our
quality and flexibility possessed various units of measurement, this simplistic approach allowed for
the generation of easily comparable findings between each of the production concepts.
Table 5: Quality & Flexibility Parameters: Low (1), Medium (2) & High (3)
Quality 1 (Low)
2 (Medium)
3 (High)
Defects (QD) 𝑥 > 5 2.5 < 𝑥 ≤ 5.0 0 ≤ 𝑥 ≤ 2.5 Scrap Levels (QSL) 𝑥 > 5 1.0 < 𝑥 ≤ 5.0 0 ≤ 𝑥 ≤ 1.0 Customer Complaints (QCC) 𝑥 > 5 0 < 𝑥 ≤ 5 𝑥 = 0 Warranty Claims (QWC) 𝑥 > 5 0 < 𝑥 ≤ 5 𝑥 = 0
Flexibility 1 (Low)
2 (Medium)
3 (High)
Volume Flexibility Demand (FVD) 0 < 𝑥 ≤ 0.30 0.30 < 𝑥 ≤ 0.50 𝑥 > 0.50 Volume Flexibility Cost (FVC) 0 < 𝑥 ≤ 10 10 < 𝑥 ≤ 20 𝑥 > 20 Product Mix Flexibility (FMP) 0 < 𝑥 ≤ 150 150 < 𝑥 ≤ 400 𝑥 > 400 New Product Flexibility (FNP) 𝑥 > 28 27 < 𝑥 ≤ 14 𝑥 < 14 Note: 1. All quality sub-variables inversely coded. i.e. the smaller the value the greater the performance. 2. New product flexibility inversely coded i.e. the smaller the value the greater the performance.
5.0 Findings
5.1 Contextual Factors
Firms were grouped as small, medium and large (see Table 6) based on the parameters also set by
Bhasin (2012). The UK automotive sector predominantly consists of SMEs, thus explains the higher
number of SMEs in our sample. Next, three independent t-tests (small and medium, small and large,
medium and large) were performed to examine if firm size was associated with flexibility and quality.
In contradiction to Yadav et al.’s (2019) assertion, that smaller firms often experience quality and
flexibility issues, findings from our t-tests indicate no significant relationship between firm size in
association with quality and flexibility. Table 6 also reports on the supply chain position of lean and
agile firms. The majority of lean firms were operating downstream (OEMs and first-tier) within the
automotive supply chain. In contrast, the majority of agile organisations were operating upstream
within the supply chain (third, fourth & fifth tier).

16
Table 6: Distinguishing Lean and Agile Firms by Size & Supply Chain Position
Size Lean Agile Total Number of
employees n % of
firms n % of
firms n % of
firms Small 0-50 27 37% 22 33% 49 35%
Medium 51-250 32 43% 34 52% 66 47% Large 250+ 15 20% 10 15% 25 18% Total 74 100% 66 100% 140 100%
SC Position Lean Agile Total Tier n % of
firms n % of
firms n % of
firms Downstream OEM 12 16% 4 6% 16 11%
1ST 26 34.5% 10 15% 36 26% Mid-stream 2ND 17 23% 15 23% 32 23% Upstream 3RD 13 18.5% 19 29% 32 24%
4TH& 5TH 6 8% 18 27% 24 16% Total 74 100% 66 100% 140 100%
5.2 Quality and Flexibility Trade-Offs
Next, in order to investigate the relationship between flexibility and quality we conducted a Pearson
correlation in SPSS (see Table 7). With the exception of the relationship between scrap levels and
warranty claims, all the quality variables demonstrated a positive and significant correlation with
other quality variables at the 0.01 level. Similarly, all of the flexibility variables demonstrated a
positive correlation with one another at the 0.01 level. However, the association between quality and
flexibility variables were identified as being negative and significant (highlighted in grey). The most
negative association was between scrap levels and product mix flexibility (-3.80**), implying that the
greater the number of unique products produced by an organisation is more likely to acquire higher
levels of scrap levels, thus more waste. These findings support the notion that there is an inverse
relationship between quality and flexibility, thus Ha was supported.
Table 7: Pearson Correlation between Quality and Flexibility
QD QSL QCC QWC FVD FVC FPM FNP QD 1 QSL .561** 1 QCC 607** .397** 1 QWC .288** .178* .451** 1 FVD -.240** -.219** -.165* -.118* 1 FVC -.267** -.310** -.264** -.338** .421** 1 FPM -.338** -.380** -.291** -.177* .552** .442** 1 FNP -.209* -.255** -.150* -.235** .558** .463** .737** 1
*Correlation is significant at the 0.05 level (2-tailed). **Correlation is significant at the 0.01 level (2-tailed).

17
5.3 Lean and Agile Quality and Flexibility Regression Results
Table 8 illustrates the frequency of lean and agile firms deemed to be performing low, medium and
high in association with each of the quality and flexibility variables. Before moving on to the
regression analysis is important to note that Schwab (2002) suggested that accurate logistic results
would need to entail a minimum of 10 responses per group. Due to the vast disparity in certain
performance measures it was not possible to distinguish three performance groups (low, medium,
high) and allocate exactly 10 responses within certain categories. However, Table 7 does imply that
lean and agile firms acquire strengths in quality and flexibility respectively.
Table 8: Distinguishing Lean and Agile Firms Based on Performance
Quality Performance
N 1 (Low)
N 2 (Medium)
N 3 (High)
Lean (n=74)
Defects 5 31 38 Scrap Levels 15 15 44 Customer Complaints 21 37 16 Warranty Claims 34 13 27
Agile (n=66)
Defects 17 38 11 Scrap Levels 32 24 10 Customer Complaints 36 20 10 Warranty Claims 35 11 21
Flexibility Performance
N 1 (Low)
N 2 (Medium)
N 3 (High)
Lean (n=74)
Volume Flexibility Demand 30 33 11 Volume Flexibility Cost 41 10 13 Product Mix Flexibility 36 27 11 New Product Flexibility 52 14 8
Agile (n=66)
Volume Flexibility Demand 9 12 45 Volume Flexibility Cost 22 20 34 Product Mix Flexibility 8 15 43 New Product Flexibility 9 23 34
Note: See Table 5 for low, medium and high parameters. All quality sub-variables: High performance equals small defects, scrap levels, customer complaints and warrant claims.
Table 9 illustrates the regression results concerning lean and agile production relative to different
levels (low, medium, high – see Table 5) of flexibility and quality. The frequency count which was
used to conduct these regressions are reported in Table 8. Models 1QL-4QL refer to results
corresponding to lean quality levels in comparison to agile quality levels. Results from models 1QL
and 2QL, which investigated defects and scrap levels respectively, both found the B coefficients to be
positive for medium and high categories. However, the P values were not found to be above the
threshold for each of the medium categories, but less than 0.05 for each the high categories.

18
Table 9: Lean and Agile Regression Results
Model 1QL Defects
Model 2QL Scrap Levels
L/A Performance B Sig Exp (B)
L/A Performance B Sig Exp (B)
L (1) Med 1.020 .070 2.774 L (1) Med .288 .526 1.333 L (1) High 2.463 .000 11.745 L (1) High 2.239 .000 9.387
Model 3QL Customer Complaints
Model 4QL Warranty Claims
L/A Performance B Sig Exp (B)
L/A Performance B Sig Exp (B)
L (1) Med 1.164 .002 3.203 L (1) Med 1.678 .114 .187 L (1) High 2.031 .001 7.619 L (1) High .463 .213 .630
Model 1FL Volume Flexibility Demand
Model 2FL Volume Flexibility Cost
L/A Performance B Sig Exp (B)
L/A Performance B Sig Exp (B)
L (1) Med -.192 .705 .825 L (1) Med .071 .880 1.210 L (1) High -2.613 .000 .073 L (1) High -1.584 .000 .031
Model 3FL Product Mix Flexibility
Model 4FL New Product Flexibility
L/A Performance B Sig Exp (B)
L/A Performance B Sig Exp (B)
L (1) Med -.916 .040 .400 L (1) Med 2.250 .000 .105 L (1) High -2.867 .000 .057 L (1) High 3.201 .000 .041
Model 1FA Volume Flexibility Demand
Model 2FA Volume Flexibility Cost
L/A Performance B Sig Exp (B)
L/A Performance B Sig Exp (B)
A (1) Med .192 .705 1.212 A (1) Med -.071 .880 .932 A (1) High 2.613 .000 13.636 A (1) High 1.584 .000 4.874
Model 3FA Product Mix Flexibility
Model 4FA New Product Flexibility
L/A Performance B Sig Exp (B)
L/A Performance B Sig Exp (B)
A (1) Med .916 .040 2.500 L (1) Med 2.250 .000 9.492 A (1) High 2.867 .000 17.591 L (1) High 3.201 .000 24.556
Model 1QA Defects
Model 2QA Scrap Levels
L/A Performance B Sig Exp (B)
L/A Performance B Sig Exp (B)
A (1) Med -1.020 .070 .361 A (1) Med -.288 .526 .750 A (1) High -2.463 .000 .085 A (1) High -2.239 .000 .107
Model 3QA Customer Complaints
Model 4QA Warranty Claims
L/A Performance B Sig Exp (B)
L/A Performance B Sig Exp (B)
A (1) Med -1.164 .002 .312 A (1) Med -1.678 .114 .187 A (1) High -2.031 .001 .131 A (1) High -.463 .213 .630
Note: 1QL – 4QL & 1FL – 4FL Agile is base and low performance is reference category. Note: 1FA – 4FA & 1QA – 4QA Lean is base and low performance is reference category
19
Taking this into account, the results show that lean firms were more likely, but not significantly more
likely, to achieve medium levels of quality in terms of defects and scrap levels in comparison with
agile firms. Yet, lean firms were significantly more likely to achieve high levels of quality in terms of
defects and scrap levels in comparison with agile firms (Tables 2, 3 and 5 list the performance
definitions we have applied). More precisely, lean firms were (11.745-1 =10.745) 10.75 times more
likely to achieve high levels of quality, as measured by production defects and (9.387-1=8.387) 8.39
times more likely to achieve high levels of quality, as measured by production scrap rates, relative to
agile firms. Complementing this finding, model 3QL found that lean firms were (3.203-1=2.203) 2.20
and (7.619-1=6.619) 6.62 times more likely to achieve medium and high levels of quality
respectively, with regards to customer complaints. Model 4QL, which investigated warranty claims,
was the only quality sub-variable which failed to differentiate lean and agile firms to the same degree
as the previous quality sub-variables. For instance, lean firms, when compared with agile firms, were
only (1-.187=0.813) 0.81 and (1-.630=0.370) 0.37 more times more likely to acquire medium and
high levels of warranty claims, relative to low levels of warranty claims. Neither category (medium
and high) amongst warranty claims demonstrated levels of significance.
Next, in models 1QA, 2QA, 3QA and 4QA we changed the comparative baseline to make
lean the base. As expected, the P values are the same, but this does allow for the likeliness for
medium and high categories to be calculated. These four models found that agile firms, when
compared with lean firms were less likely to achieve high levels of defects (1-.085=.915 or 0.92),
scrap levels (1-.107=.893 or 0.89), customer complaints (1-.312=.688 or 0.69) and warranty claims
(1-.630=.370 or 0.37), indicating lower relative levels of quality. Overall, our models for 1QA, 2QA,
3QA showed that agile firms were significantly less likely to achieve high levels quality, when
compared with lean firms. In summary, our results partially support Hb. in that the majority of
quality performance indicators show that lean firms were significantly more likely to achieve high
quality levels compared with agile firms.
Models 1FA-4FA refer to results comparing flexibility levels in lean and agile firms. Model
1FA found that agile firms were more likely to achieve both medium and high levels of volume
flexibility in demand, when compared with lean firms. However, although the P value was not found
to be above the threshold for the medium category, it was less than 0.05 for the high category.
Therefore, we conclude that agile firms in comparison with lean firms were more likely, but not
significantly more likely, to achieve medium, rather than low, levels of volume flexibility in demand.
But agile firms were found to be significantly more likely (specifically 13.636-1=12.636, or 12.64
times more likely) to achieve high levels of volume flexibility in demand relative to low levels of
volume flexibility in demand. Model 2FA, which focused on volume flexibility cost, illustrated a
negative (but not significant) B coefficient for the medium category, but positive B coefficient (and
significant) for the high category. Therefore, agile firms were (1-.932=.068) 0.068 times less likely to

20
achieve medium levels of volume flexibility cost, and (4.874-1=3.874) 3.87 times more likely to
achieve high levels of volume flexibility cost, rather than low levels.
In terms of significance, the results from Models 3FA and 4FA mirrored each other in both
(medium & high) categories. More specifically, agile firms when compared with lean firms were
(2.50-1=1.50) 1.50 times and (17.591-1=16.591) 16.59 times (and significantly) more likely to
achieve medium and high levels of product mix flexibility, relative to low levels of product mix
flexibility.
Moreover, Model 4FA found that agile firms in comparison with lean firms were (9.492-
1=8.492) 8.49 times and (24.556-1=23.556) 23.56 times (and significantly) more likely to acquire
medium and high levels of new product flexibility respectively, relative to low levels of flexibility.
Finally, in models 1FL, 2FL, 3FL and 4FL we changed the comparative baseline to make agile the
base. As expected, the P values are the same therefore, once again, lean firms when compared to agile
firms were found to be significantly less likely to achieve high levels of flexibility, relative to low
levels of flexibility. But changing the base does allow for the likeliness for lean medium and high
flexibility to be calculated relative to low levels of flexibility. Given that all models found agile firms,
when compared to lean firms, to be significantly more likely to acquire high levels of flexibility, the
results support Hc.
6.0 Discussion
6.1 Performance Trade-Offs
Within the recent Operations Management literature, both trade-off theory and cumulative approaches
are becoming increasingly more important (Wurzer & Reiner, 2018). The theoretical framework,
outlined in section 2.0, focused our empirical study on evidence that would differentiate more clearly
how different BMs are underpinned by specific organisational structures and innovative capabilities.
Moreover, the framework enabled us to explicitly test whether trade-offs were ubiquitous or whether
ambidextrous firms had managed to maintain a ‘dual’ position in the automotive industry.
Results from Table 7, which correspond to Ha, clearly indicate a (significant) negative
relationship between quality and flexibility, empirically confirming a trade-off between flexibility and
quality as performance targets for suppliers. This contrasts with some previous studies which assert
that quality and flexibility complement each other as they have a synergistic relationship (Boyer &
Lewis, 2002). Moreover, although prior research has suggested that flexibility is correlated with
customer service levels (Zhang et al., 2003) this was not the case in our findings. Taking the inverse
relationship between the two constructs of performance into account, our findings refute the ‘law of
cumulative capabilities’ (Schmenner & Swink, 1998), better known as the Sand Cone Model. Instead,

21
the results align with Skinner’s (1969) assertion and Hallgren et al.’s (2011) findings, which
demonstrated no strong empirical support for the entire cumulative model. However, results from
Table 7 do highlight that the quality sub-variables (defects, scrap levels, customer complaints,
warranty claims) are positively correlated. This was also the case for the flexibility sub-variables
(volume flexibility demand, volume flexibility cost, product mix flexibility, new product flexibility).
6.2 Lean and Agile Trade-Offs
With regards to Hb and Hc, our findings show a clear distinction between the two BMs, one lean and
one agile, on the basis of a robust analysis using the TPRCs listed in Table 1. Each of these
production strategies emphasise clear performance differences within our automotive study. We assert
that combinations of TPRCs represent specific kinds of dynamic capability, which in turn characterise
each BM and give rise to sustained competitive advantages. This explains how the two BMs can co-
exist in the same industry.
Our lean and agile trade-off findings align with Hallgren & Olhager’s (2009) study, but contest
Narasimhan et al.’s (2006) assertion that agile firms are more quality-effective when compared with
lean organisations. While Cagliano et al. (2004) found lean to be superior to agile production in most
levels of performance (operational and flexibility), these differences were not deemed to be of
significance. Given the comparative (lean versus agile) framing of our models, we are able to reject
Cagliano et al.’s (2004) assertions; our findings show that lean and agile firms demonstrate significant
differences. Moreover, our quality findings side with Ghobakhloo & Azar’s (2018) assertion that lean
practices lead to higher levels of operational performance when compared to agile practices. As the
agile firms did not possess the high levels of quality found in the lean firms, our findings have
theoretical implications. For instance, Hormozi (2001) advocated that agile production is an evolved
version of lean production and Ifandoudas & Chapman (2009) asserted that lean practices can act as
catalyst to agile practices. This was not the case in our findings. More specifically, we shed some light
on these misconceptions, by refuting the notion that agile capabilities are cumulatively gained in
association with lean capabilities.
Based upon the parameters set in this study, lean firms, when compared to agile firms, were
approximately 10 times, 9 times and 7 times more likely to achieve high (relative to low) levels of
quality as measured by defects, scrap levels and customer complaints respectively. Agile production is
characterised by the ability to be adaptable, hence, the capability to change rapidly in the face of ever-
changing demand conditions. This was shown in our results, as agile firms, when compared to lean
firms, were approximately 12.5 times, 4 times, 16.5 times and 23.5 times more likely to acquire high
(relative to low) levels of volume flexibility in demand, volume flexibility in cost, product mix

22
flexibility and new product flexibility respectively. Our results show that agile firms are operating
under turbulent demand conditions and producing a greater variety of products, and require
significantly less time to produce new products, when compared with lean organisations. Our findings
show that the demands of both scale (producing more new products) and scope (a greater portfolio of
products), requiring operational flexibility and responsiveness, has repercussions on efficiency and
quality levels. More precisely, we assert that large internal and external operational variances tend to
lead to a greater number of human/machine errors in comparison with lean organisations that exhibit
small internal and external variances within the production process. To summarise, we present these
findings in the form of a taxonomy illustrating the quality and flexibility trade-offs between lean and
agile production (Figure 2).
Figure 2: Lean versus Agile Production: Flexibility and Quality Trade-Offs
The flexibility differences between lean and agile firms were far greater in comparison to the
quality differences, which is demonstrated by the rectangular shape in Figure 2. This aligns with the
received wisdom that suggests flexibility is a key performance measure which can distinguish each of
the production concepts (Gunasekaran et al., 2008; Purvis et al., 2014; Qamar et al., 2018). This also
complements the Demirbas et al. (2018) study, which found that, following the 2008 economic
downturn, some firms operating in the UK automotive industry survived and remained competitive by
increasing their levels of responsiveness, i.e. their agility.
Regarding the relative specialisations of our sample, the leaner, less flexible firms have a
stronger internal focus. This is because the lean firms prioritise the specific TPRCs which rely heavily
on the technical capabilities suited to developing and maintaining relatively predictable and
controllable processes, which give rise to higher quality and incremental innovation (e.g. elimination
of waste, continuous improvement, line balancing etc.). Thus, they rely more on the exploitation of
existing knowledge and expertise, rather than exploring new solutions externally. In contrast, agile
firms require an extensive range of external network connections and a wider portfolio of processes
and production technologies. This is gained through the implementation of TPRCs that underpin
adaptability (e.g. rapid prototyping, concurrent engineering, virtual enterprise). Given this, the agile
23
firms have developed a faster response to changing conditions, particularly the varying demands of
clients, and the exploration of new delivery partners, contractors and consultants, via external
networks. In summary, the proxy measures for different kinds of performance in Tables 2, 3, 5 and 8
provide evidence of the trade-off in competitive advantage terms, between lean and agile positions.
But, these performance outcomes are underpinned by the specific process capabilities (TPRCs)
outlined in Table 1. Our findings strongly suggest that the resourcing costs and the organisational
complexities of developing innovative capabilities to achieve both kinds of advantage compel firms to
engage in trade-offs, i.e. to prioritise lean or agile initiatives.
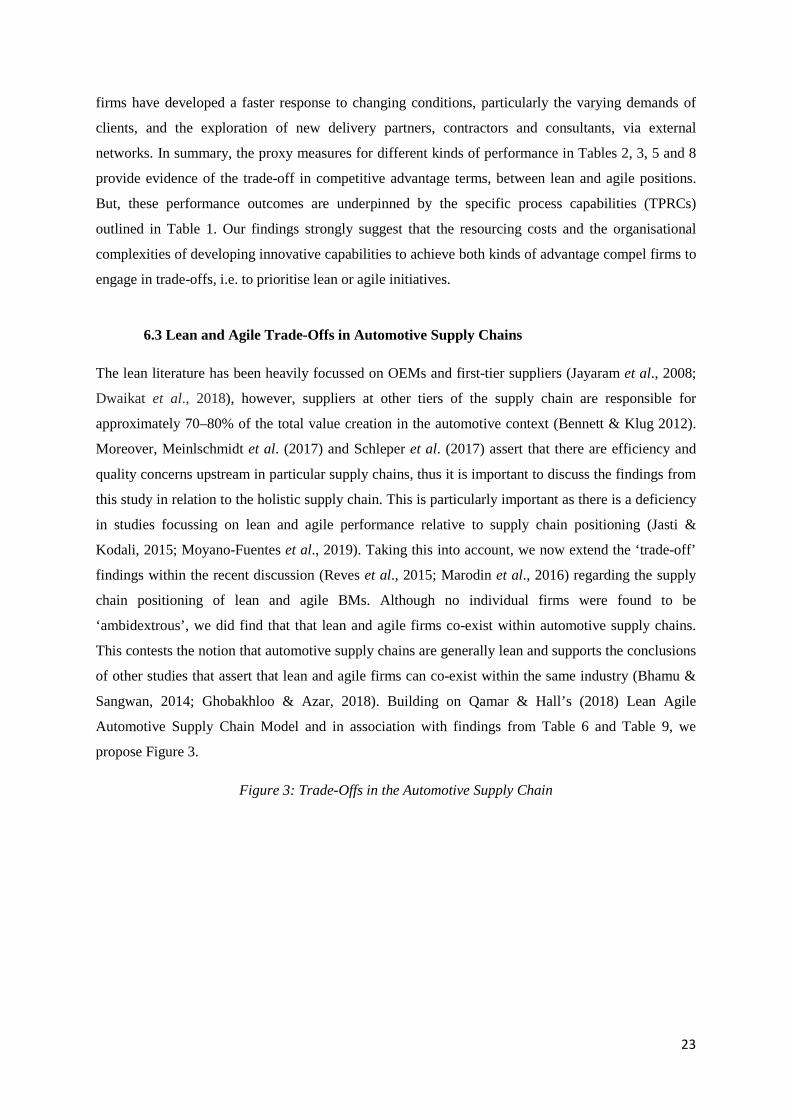
6.3 Lean and Agile Trade-Offs in Automotive Supply Chains
The lean literature has been heavily focussed on OEMs and first-tier suppliers (Jayaram et al., 2008;
Dwaikat et al., 2018), however, suppliers at other tiers of the supply chain are responsible for
approximately 70–80% of the total value creation in the automotive context (Bennett & Klug 2012).
Moreover, Meinlschmidt et al. (2017) and Schleper et al. (2017) assert that there are efficiency and
quality concerns upstream in particular supply chains, thus it is important to discuss the findings from
this study in relation to the holistic supply chain. This is particularly important as there is a deficiency
in studies focussing on lean and agile performance relative to supply chain positioning (Jasti &
Kodali, 2015; Moyano-Fuentes et al., 2019). Taking this into account, we now extend the ‘trade-off’
findings within the recent discussion (Reves et al., 2015; Marodin et al., 2016) regarding the supply
chain positioning of lean and agile BMs. Although no individual firms were found to be
‘ambidextrous’, we did find that that lean and agile firms co-exist within automotive supply chains.
This contests the notion that automotive supply chains are generally lean and supports the conclusions
of other studies that assert that lean and agile firms can co-exist within the same industry (Bhamu &
Sangwan, 2014; Ghobakhloo & Azar, 2018). Building on Qamar & Hall’s (2018) Lean Agile
Automotive Supply Chain Model and in association with findings from Table 6 and Table 9, we
propose Figure 3.
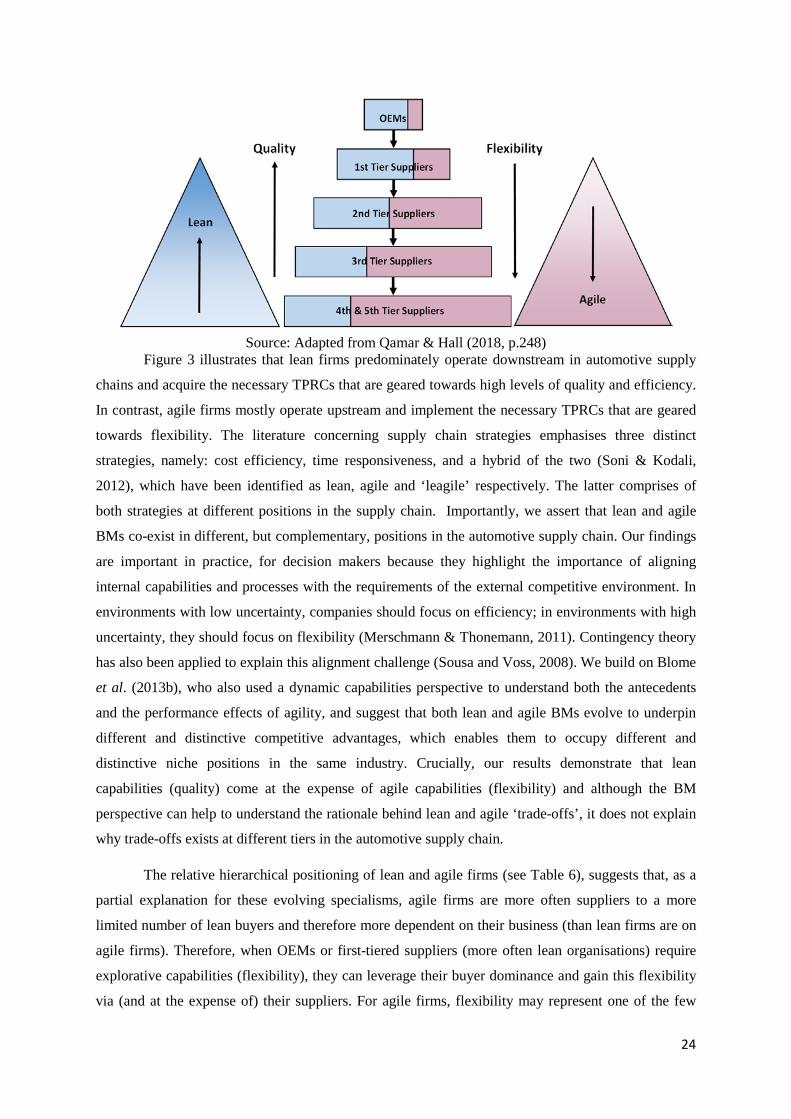
Figure 3: Trade-Offs in the Automotive Supply Chain
24
Source: Adapted from Qamar & Hall (2018, p.248)
Figure 3 illustrates that lean firms predominately operate downstream in automotive supply
chains and acquire the necessary TPRCs that are geared towards high levels of quality and efficiency.
In contrast, agile firms mostly operate upstream and implement the necessary TPRCs that are geared
towards flexibility. The literature concerning supply chain strategies emphasises three distinct
strategies, namely: cost efficiency, time responsiveness, and a hybrid of the two (Soni & Kodali,
2012), which have been identified as lean, agile and ‘leagile’ respectively. The latter comprises of
both strategies at different positions in the supply chain. Importantly, we assert that lean and agile
BMs co-exist in different, but complementary, positions in the automotive supply chain. Our findings
are important in practice, for decision makers because they highlight the importance of aligning
internal capabilities and processes with the requirements of the external competitive environment. In
environments with low uncertainty, companies should focus on efficiency; in environments with high
uncertainty, they should focus on flexibility (Merschmann & Thonemann, 2011). Contingency theory
has also been applied to explain this alignment challenge (Sousa and Voss, 2008). We build on Blome
et al. (2013b), who also used a dynamic capabilities perspective to understand both the antecedents
and the performance effects of agility, and suggest that both lean and agile BMs evolve to underpin
different and distinctive competitive advantages, which enables them to occupy different and
distinctive niche positions in the same industry. Crucially, our results demonstrate that lean
capabilities (quality) come at the expense of agile capabilities (flexibility) and although the BM
perspective can help to understand the rationale behind lean and agile ‘trade-offs’, it does not explain
why trade-offs exists at different tiers in the automotive supply chain.
The relative hierarchical positioning of lean and agile firms (see Table 6), suggests that, as a
partial explanation for these evolving specialisms, agile firms are more often suppliers to a more
limited number of lean buyers and therefore more dependent on their business (than lean firms are on
agile firms). Therefore, when OEMs or first-tiered suppliers (more often lean organisations) require
explorative capabilities (flexibility), they can leverage their buyer dominance and gain this flexibility
via (and at the expense of) their suppliers. For agile firms, flexibility may represent one of the few

25
options available to them as an alternative competitive advantage, complementing lean and efficient
producers. Further supporting this contingency view, small firms operating upstream in supply chains
are likely to possess greater flexibility levels due to simpler internal organisational structures (Panwar
et al., 2018). Developing our findings on BM trade-offs to encompass supply chain positioning
furthers the contribution of this study. The majority of prior studies that have investigated
performance in a supply chain context have either focused on single firms (Gligor, 2018) or primarily
focused their attention to a specific tier in a supply chain (Dwaikat et al., 2018), precluding discussion
based on different tiers in supply chains.

26
7.0 Conclusion
Given that high levels of quality and flexibility (Demirbas et al., 2018) are required within the
automotive industry, we focussed our attention to two production concepts which have been
associated with both quality and flexibility, namely lean and agile production. The UK automotive
industry has been classified as a slow adopter of both of these manufacturing concepts (Clegg et al.,
2013). In the extant academic literature, not only is there a deficiency in studies concerning the lean-
agile debate, but when both concepts have been investigated together, the findings relating to
flexibility and quality have been unclear. Therefore, using the automotive industry in the Midlands
region of the UK as our context, the aims of this study were to: (1) Identify the relationship between
flexibility and quality; and (2) Explore the quality and flexibility differences between lean and agile
production.
We find that two distinctive BMs (exploitative-lean, explorative-agile) have evolved in the
same automotive industry, identifiable on the basis of particular dynamic capabilities which give rise
to particular kinds of competitive advantage. More specifically, we assert that: a) Agile firms are
significantly more flexible when compared to lean organisations; and b) Lean firms are significantly
more efficient, when compared with agile firms. Moreover, we find that firms do not seek to pursue a
‘hybrid’ or ambidextrous approach; there is a distinct separation between firms which possess high
levels of flexibility and those that achieve high levels of quality. This is an important finding because
a major debate within the Operations Management literature concerns whether or not capabilities lead
to ‘trade-offs’ or whether capabilities are cumulatively gained (Wurzer & Reiner, 2018). The law of
cumulative capabilities (the ‘Sand Cone Model’) has attracted much attention, associated with the
concept of world-class manufacturing (Flynn et al., 1999; Brown et al., 2007), and revolves around
the belief that manufacturing organisations are able to compete on all measures of performance via the
implementation of ‘best-practices’. These findings question this as a general assumption, suggesting
that best-practices are context-specific and, as proposed by Skinner (1969) and others since, firms
make trade-offs to evolve distinctive specialisms appropriate to their relative positioning in their
immediate competitive environment (Schmenner & Swink, 1998).
For practitioners, not only do we present a novel method which can assist them in
determining whether they are lean or agile based upon their respective TPRCs, but we can clarify
some of the misconceptions concerning lean and agile production. The idea that lean production can
also result in high levels of flexibility and the notion that agile production can lead to just as high
levels of quality as lean production is refuted. Decision makers in the automotive industry need to
prioritise the success factors most important to their respective firm and responsibly pursue the most
suitable production strategy. It is important that managers understand that our findings reveal ‘trade-

27
offs’, i.e. radical innovation processes (flexibility) come at the expense of incremental process
refinement processes (efficiency), and vice-versa.
Although we focus solely on the Midlands (UK) automotive sector, and this is certainly a
limitation of our research, we achieve depth and robustness in our findings. Future studies should
extend the discussion by investigating these relationships in other industry supply chains and in other
countries. Also, this study only examined the quality and flexibility trade-offs between lean and agile
production; future studies should look to explore the cost, speed and dependability trade-offs
associated with the two production concepts, especially at different tiers in the supply chain.

28
References:
Armstrong, J. S. & Overton, T. S. (1977). Estimating nonresponse bias in mail surveys. Journal of Marketing Research, 396-402.
Bai, C., Satir, A., & Sarkis, J. (2019). Investing in lean manufacturing practices: an environmental and operational perspective. International Journal of Production Research, 57(4), 1037-1051.
Bamber, L. & Dale, B.G. (2000) Lean production: A study of application in a traditional manufacturing environment. Production, Planning & Control, 11(3), 291-298.
Bamford, D., Forrester, P., Dehe, B. & Leese, R. G. (2015). Partial and iterative lean implementation: two case studies. International Journal of Operations & Production Management, 35(5), 702-727.
Barney, J. B. (2002). Gaining and sustaining competitive advantage. Upper Saddle River, Prentice Hall.
Bellisario, A., & Pavlov, A. (2018). Performance management practices in lean manufacturing organizations: a systematic review of research evidence. Production, Planning & Control, 29(5), 367-385.
Beamon, B. M. (1999). Measuring supply chain performance. International Journal of Operations & Production Management, 19, 275-292.
Bennett, D., & Klug, F. (2012). Logistics supplier integration in the automotive industry. International Journal of Operations & Production Management, 32(11), 1281-1305.
Bevilacqua, M., Ciarapica, F. E., & Paciarotti, C. (2015). Implementing lean information management: the case study of an automotive company. Production Planning & Control, 26(10), 753-768.
Bhagwat, R., & Sharma, M. K. (2007). Information system architecture: a framework for a cluster of small-and medium-sized enterprises (SMEs). Production, Planning & control, 18(4), 283-296.
Bhamu, J. & Singh Sangwan, K. (2014). Lean manufacturing: literature review and research issues. International Journal of Operations & Production Management, 34(7), 876-940.
Bhasin, S. (2012). Performance of lean in large organisations. Journal of Manufacturing Systems, 31, 349-357.
Biswas, P. & Sarker, B. R. (2008). Optimal batch quantity models for a lean production system with in-cycle rework and scrap. International Journal of Production Research, 46(23), 6585-6610.
Blome, C., Schoenherr, T., & Kaesser, M. (2013a). Ambidextrous governance in supply chains: The impact on innovation and cost performance. Journal of Supply Chain Management, 49(4), 59-80.
Blome, C., Schoenherr, T., & Rexhausen, D. (2013b). Antecedents and enablers of supply chain agility and its effect on performance: a dynamic capabilities perspective. International Journal of Production Research, 51(4), 1295-1318.
Blome, C., Foerstl, K., & Schleper, M. C. (2017). Antecedents of green supplier championing and greenwashing: An empirical study on leadership and ethical incentives. Journal of Cleaner Production, 152, 339-350.
Bortolotti, T., Boscari, S., & Danese, P. (2015). Successful lean implementation: Organizational culture and soft lean practices. International Journal of Production Economics, 160, 182-201.
Boyer, K. K., & Lewis, M. W. (2002). Competitive priorities: investigating the need for trade‐offs in operations strategy. Production and Operations Management, 11(1), 9-20.

29
Brown, S., Squire, B. & Blackmon, K. (2007). The contribution of manufacturing strategy involvement and alignment to world-class manufacturing performance. International Journal of Operations & Production Management, 27(3), 282-302.
Cai, J., Liu, X., Xiao, Z. & Liu, J. (2009). Improving supply chain performance management: A systematic approach to analyzing iterative KPI accomplishment. Decision Support Systems, 46(2), 512-521.
Cao, Q., & Dowlatshahi, S. (2005). The impact of alignment between virtual enterprise and information technology on business performance in an agile manufacturing environment. Journal of Operations Management, 23(5), 531-550.
Carter, M. F. (1986). Designing flexibility into automated manufacturing systems. In Proceedings of the Second ORSA/TIMS Conference on Flexible Manufacturing Systems (August, 107-118). Amsterdam: Elsevier.
Carvalho, H., Azevedo, S.G. & Cruz-Machado, V. (2012). Agile and resilient approaches to supply chain management: influence on performance and competitiveness. Logistics Research, 4(1-2), 49-62.
Chavez, R., Gimenez, C., Fynes, B., Wiengarten, F. & Yu, W. (2013). Internal lean practices and operational performance: The contingency perspective of industry clockspeed. International Journal of Operations & Production Management, 33(5), 562-588.
Cherrafi, A., Elfezazi, S., Hurley, B., Garza-Reyes, J. A., Kumar, V., Anosike, A., & Batista, L. (2019). Green and Lean: a Gemba–Kaizen model for sustainability enhancement. Production Planning & Control, 30(5-6), 385-399.
Chi, C. G. & Gursov, D. (2009). Employee satisfaction, customer satisfaction, and financial performance: An empirical examination. International Journal of Hospitality Management, 28(2), 245-253.
Chicksand, D., Watson, G., Walker, H., Radnor, Z. & Johnston, R. (2012). Theoretical perspectives in purchasing and supply chain management: an analysis of the literature. Supply Chain Management: An International Journal, 17(4), 454-472.
Chiarini, A., & Brunetti, F. (2019). What really matters for a successful implementation of Lean production? A multiple linear regression model based on European manufacturing companies. Production Planning & Control, 1-11.
Clegg, B., Gholami, R. & Omurgonulsen, M. (2013). Quality management and performance: a comparison between the UK and Turkey. Production Planning & Control, 24(12), 1015-1031.
Clegg, B., Rees, C. & Titchen, M. (2010). A study into the effectiveness of quality management training: a focus on tools and critical success factors. The TQM Journal, 22(2), 188-208.
Clegg, B. & Wan, Y. (2013). Managing enterprises and ERP systems: a contingency model for the enterprization of operations. International Journal of Operations & Production Management, 33(11/12), 1458-1489.
D'Souza, D. E. & Williams, F. P. (2000). Toward a taxonomy of manufacturing flexibility dimensions. Journal of operations management, 18(5), 577-593.
Da Silveira, G. & Slack, N. (2001). Exploring the trade-off concept. International Journal of Operations & Production Management, 21(7), 949-964.
Demirbas, D., Wilkinson, L., & Bennett, D. (2018). Supplier relations impact within the UK automotive industry. Benchmarking: An International Journal, 25(8), 3143-3161.
Dubey, R., Altay, N., Gunasekaran, A., Blome, C., Papadopoulos, T., & Childe, S. J. (2018). Supply chain agility, adaptability and alignment: empirical evidence from the Indian auto components industry. International Journal of Operations & Production Management, 38(1), 129-148.

30
Dwaikat, N. Y., Money, A. H., Behashti, H. M., & Salehi-Sangari, E. (2018). How does information sharing affect first-tier suppliers’ flexibility? Evidence from the automotive industry in Sweden. Production, Planning & Control, 29(4), 289-300.
Eckstein, D., Goellner, M., Blome, C., & Henke, M. (2015). The performance impact of supply chain agility and supply chain adaptability: the moderating effect of product complexity. International Journal of Production Research, 53(10), 3028-3046.
Flynn, B. B., Schroeder, R. G. & Flynn, E. J. (1999). World class manufacturing: an investigation of Hayes and Wheelwright's foundation. Journal of Operations Management, 17(3), 249-269.
Forrester, P. L., Kazumi Shimizu, U., Soriano-Meier, H., Arturo Garza-Reyes, J. & Fernando Cruz Basso, L. (2010). Lean production, market share and value creation in the agricultural machinery sector in Brazil. Journal of Manufacturing Technology Management, 21(7), 853-871.
Foss, N. J., & Saebi, T. (2017). Fifteen years of research on business model innovation: how far have we come, and where should we go? Journal of Management, 43(1), 200-227.
Fullerton, R. R., Kennedy, F. A, & Widener, S. K. (2014). Lean manufacturing and firm performance: The incremental contribution of lean management accounting practices. Journal of Operations Management, 32(7), 414-428.
Ghobakhloo, M., & Azar, A. (2018). Business excellence via advanced manufacturing technology and lean-agile manufacturing. Journal of Manufacturing Technology Management, 29(1), 2-24.
Gligor, D. (2018). Performance implications of the fit between suppliers' flexibility and their customers' expected flexibility: A dyadic examination. Journal of Operations Management, 58, 73-85.
Gligor, D. M., Esmark, C. L., & Holcomb, M. C. (2015). Performance outcomes of supply chain agility: when should you be agile? Journal of Operations Management, 33, 71-82.
Godinho Filho, M., Ganga, G. M. D. & Gunasekaran, A. (2016). Lean manufacturing in Brazilian small and medium enterprises: implementation and effect on performance. International Journal of Production Research, 54(24), 7523-7545.
Gunasekaran, A. (1999). Agile manufacturing: A framework for research and development. International Journal of Production Economics, 62, 87-105.
Gunasekaran, A., Lai, K.-H. & Edwin Cheng, T. C. (2008). Responsive supply chain: A competitive strategy in a networked economy. Omega, 36, 549-564.
Hallgren, M. & Olhager, J. (2009). Lean and agile manufacturing: external and internal drivers and performance outcomes. International Journal of Operations & Production Management, 29, 976-999.
Hillman, A. J., Withers, M. C., & Collins, B. J. (2009). Resource dependence theory: A review. Journal of management, 35(6), 1404-1427.
Hormozi, A. M. (2001). Agile manufacturing: the next logical step. Benchmarking: An International Journal, 8(2), 132-143.
Ifandoudas, P., & Chapman, R. (2009). A practical approach to achieving agility–a theory of constraints perspective. Production, Planning and Control, 20(8), 691-702.
Inman, R. A., Sale, R. S., Green, K. W. & Whitten, D. (2011). Agile manufacturing: relation to JIT, operational performance and firm performance. Journal of Operations Management, 29(4), 343-355.
Jasti, N. & Kodali, R. (2015) A critical review of lean supply chain management frameworks: Proposed framework. Production, Planning & Control, 26(13), 1051-1068.

31
Jayaram, J., Tan, K. C., & Nachiappan, S. P. (2010). Examining the interrelationships between supply chain integration scope and supply chain management efforts. International Journal of Production Research, 48(22), 6837-6857.
Jayaram, J., Vickery, S. & Droge, C. (2008). Relationship building, lean strategy and firm performance: an exploratory study in the automotive supplier industry. International Journal of Production Research, 46(20), 5633-5649.
Kim, J. O., & Mueller, C. W. (1978). Factor analysis: Statistical methods and practical issues (No. 14). Sage.
Kristal, M. M., Huang, X., & Roth, A. V. (2010). The effect of an ambidextrous supply chain strategy on combinative competitive capabilities and business performance. Journal of Operations Management, 28(5), 415-429.
Kumar, M., Vrat, P. & Shankar, R. (2006). A fuzzy programming approach for vendor selection problem in a supply chain. International Journal of Production Economics, 101(2), 273-285.
Laohavichien, T., Fredendall, L. D., & Cantrell, R. S. (2009). The effects of transformational and transactional leadership on quality improvement. Quality Management Journal, 16(2), 7-24.
Loss, L., & Crave, S. (2011). Agile Business Models: an approach to support collaborative networks. Production Planning & Control, 22(5-6), 571-580.
Lyons, A. C., Vidamour, K., Jain, R., & Sutherland, M. (2013). Developing an understanding of lean thinking in process industries. Production Planning & Control, 24(6), 475-494.
Malhotra, M. K., & Mackelprang, A. W. (2012). Are internal manufacturing and external supply chain flexibilities complementary capabilities? Journal of Operations Management, 30(3), 180-200.
March, J. G. (1991). Exploration and exploitation in organizational learning. Organization science, 2(1), 71-87.
Marodin, G., Frank, A. G., Tortorella, G. & Saurin, T. A. (2016). Contextual factors and lean production implementation in the Brazilian automotive supply chain. Supply Chain Management: An International Journal, 21(4).
Martinez-Jurado, P. J., & Moyano-Fuentes, J. (2014). Key determinants of lean production adoption: evidence from the aerospace sector. Production Planning & Control, 25(4), 332-345.
Moyano-Fuentes, J., Bruque-Cámara, S., & Maqueira-Marín, J. M. (2019). Development and validation of a lean supply chain management measurement instrument. Production Planning & Control, 30(1), 20-32.
Meinlschmidt, J., Schleper, M. C., & Foerstl, K. (2018). Tackling the sustainability iceberg: a transaction cost economics approach to lower tier sustainability management. International Journal of Operations & Production Management, 38(10), 1888-1914.
Merschmann, U., & Thonemann, U. W. (2011). Supply chain flexibility, uncertainty and firm performance: An empirical analysis of German manufacturing firms. International Journal of Production Economics, 130(1), 43-53.
Miller, L. E., & Smith, K. L. (1983). Handling nonresponse issues. Journal of Extension, 21, 45-50.
Moayed, F. A. & Shell, R. L. (2009). Comparison and evaluation of maintenance operations in lean versus non-lean production systems. Journal of Quality in Maintenance Engineering, 15(3), 285-296.
Moyano-Fuentes, J., Sacristán-Díaz, M., & Jose Martinez-Jurado, P. (2012). Cooperation in the supply chain and lean production adoption: Evidence from the Spanish automotive industry. International Journal of Operations & Production Management, 32(9), 1075-1096.

32
Narasimhan, R., Swink, M. & Kim, S. W. (2006). Disentangling leanness and agility: An empirical investigation. Journal of Operations Management, 24, 440-457.
Naylor, J. B., Naim, M. M., & Berry, D. (1999). Leagility: Integrating the lean and agile manufacturing paradigms in the total supply chain. International Journal of Production Economics, 62(1-2), 107-118.
Negrao, L.L.L., Godinho Filho, M. & Marodin, G. (2017) Lean Practices and Their Effect on Performance: A Literature Review. Production Planning & Control, 28(1), 33-56.
Pakdil, F. & Leonard, K. M. (2014). Criteria for a lean organisation: development of a lean assessment tool. International Journal of Production Research, 52(15), 4587-4607.
Panwar, A., Jain, R., Rathore, A. P. S., Nepal, B., & Lyons, A. C. (2018). The impact of lean practices on operational performance–an empirical investigation of Indian process industries. Production Planning & Control, 29(2), 158-169.
Patel, P. C., Terjesen, S., & Li, D. (2012). Enhancing effects of manufacturing flexibility through operational absorptive capacity and operational ambidexterity. Journal of Operations Management, 30(3), 201-220.
Pavlov, A., Mura, M., Franco-Santos, M., & Bourne, M. (2017). Modelling the impact of performance management practices on firm performance: interaction with human resource management practices. Production Planning & Control, 28(5), 431-443.
Pfeffer, J. & Salanick, G. R. (1978). The external control of organizations: A resource dependence perspective. New York: Harper & Row.
Psomas, E., Vouzas, F. & Kafetzopoulus, D. (2014). Quality management benefits through the “soft” and “hard” aspect of TQM in food companies. The TQM Journal, 26(5), 431-444.
Purvis, L., Gosling, J. & Naim, M. M. (2014). The development of a lean, agile and leagile supply network taxonomy based on differing types of flexibility. International Journal of Production Economics, 151, 100-111.
Qamar, A., & Hall, M. (2018). Can Lean and Agile organisations within the UK automotive supply chain be distinguished based upon contextual factors? Supply Chain Management: An International Journal, 23(3), 239-254.
Qamar, A., Hall, M. A., & Collinson, S. (2018). Lean versus agile production: flexibility trade-offs within the automotive supply chain. International Journal of Production Research, 56(11), 3974-3993.
Reves, J.A.G.G., Ates, E.M. & Kumar, V. (2015). Measuring lean readiness through the understanding of quality practices in the Turkish automotive suppliers industry", International Journal of Productivity and Performance Management, 64(8), 1092-1112.
Roscoe, S., Eckstein, D., Blome, C., & Goellner, M. (2019). Determining how internal and external process connectivity affect supply chain agility: a life-cycle theory perspective. Production Planning & Control, 1-14.
Sanchez, A. & Perez, M. (2001). Lean indicators and manufacturing strategies. International Journal of Operations & Production Management, 21(11), 1433-1452.
Schleper, M. C., Blome, C. & Wuttke, D. A. (2017). The dark side of buyer power: Supplier exploitation and the role of ethical climates. Journal of Business Ethics, 140(1), 97-114.
Schwab, J.A. (2002) Multinomial Logistic Regression: Basic Relationships and Complete Problems.
Sethi, A. K. & Sethi, S. P. (1990). Flexibility in manufacturing: a survey. International Journal of Flexible Manufacturing Systems, 2, 289-328.

33
Schmenner, R. W. & Swink, M. L. (1998). On theory in operations management. Journal of Operations Management, 17(1), 97-113.
Shah, R. & Ward, P. T. (2003). Lean manufacturing: context, practice bundles, and performance. Journal of Operations Management, 21, 129-149.
Shah, R. & Ward, P.T. (2007). Defining and developing measures of lean production. Journal of Operations Management, 25(4), 785-805.
Sharifi, H. & Zhang, Z. (2001). Agile manufacturing in practice: application of a methodology. International Journal of Operations & Production Management, 21, 772-794.
Sharp, J.M., Irani, Z. & Desai, S. (1999). Working towards agile manufacturing in the UK industry. International Journal of Production Economics, 62(1), 155-169.
Skinner, W. (1969). Manufacturing-Missing Link in Corporate Strategy. Harvard Business Review, 47, 136-145.
SMMT. (2016). 2016 UK Automotive Sustainability Report. London: The Society of Motor Manufacturers and Traders.
Soriano-Meier, H. & Forrester, P. L. (2002). A model for evaluating the degree of leanness of manufacturing firms. Integrated Manufacturing Systems, 13(2), 104-109.
Soni, G., & Kodali, R. (2012). Evaluating reliability and validity of lean, agile and leagile supply chain constructs in Indian manufacturing industry. Production Planning & Control, 23(10-11), 864-884.
Sousa, R. and Voss, C. (2008). Contingency Research in Operations Management Practices. Journal of Operations Management, 26, 697-713.
Tarafdar, M., & Qrunfleh, S. (2017). Agile supply chain strategy and supply chain performance: complementary roles of supply chain practices and information systems capability for agility. International Journal of Production Research, 55(4), 925-938.
Teece, D. J. (2010). Business models, business strategy and innovation. Long range planning, 43(2-3), 172-194.
Tortorella, G. L., Marodin, G. A., Fettermann, D. D. C., & Fogliatto, F. S. (2016). Relationships between lean product development enablers and problems. International Journal of Production Research, 54(10), 2837-2855.
Tortorella, G. L., Miorando, R. & Marodin, G. (2017). Lean supply chain management: Empirical research on practices, contexts and performance. International Journal of Production Economics, 193, 98-112.
Touboulic, A., Chicksand, D. & Walker, H. (2014). Managing imbalanced supply chain relationships for sustainability: A power perspective. Decision Sciences, 45(4), 577-619.
Upadhye, N., Deshmukh, S. G. & Gard, S. (2010). Key issues for the implementation of lean manufacturing system. Global Business and Management Research: An International Journal, 1 (3- 4).
Vachon, S. & Klassen, R.D. (2008). Environmental management and manufacturing performance: The role of collaboration in the supply Chain. International Journal of Production Economics, 111(2), 299-315.
Vinodh, S. & Kuttalingam, D. (2011). Computer-aided design and engineering as enablers of agile manufacturing: a case study in an Indian manufacturing organization. Journal of Manufacturing Technology Management, 22(3), 405-418.

34
Vinodh, S., Kumar, S. V., & Vimal, K. E. K. (2014). Implementing lean sigma in an Indian rotary switches manufacturing organisation. Production Planning & Control, 25(4), 288-302.
Vogt, W.P. (1999). Dictionary of statistics and methodology: A nontechnical guide for the social sciences. London: Sage.
Wang, C. H., Chen, K. S., & Tan, K. H. (2019). Lean Six Sigma applied to process performance and improvement model for the development of electric scooter water-cooling green motor assembly. Production Planning & Control, 30(5-6), 400-412.
Walker, H., Chicksand, D., Radnor, Z. & Watson, G. (2015). Theoretical perspectives in operations management: an analysis of the literature. International Journal of Operations & Production Management, 35(8), 1182-1206.
Wang, G., Huang, S.H. & Dismukes, J.P. (2004). Product-driven supply chain selection using integrated multi-criteria decision-making methodology. International Journal of Production Economics, 91(1), 1-15.
Wong, W. P., Ignatius, J., & Soh, K. L. (2014). What is the leanness level of your organisation in lean transformation implementation? An integrated lean index using ANP approach. Production Planning & Control, 25(4), 273-287.
Yadav, V., Jain, R., Mittal, M. L., Panwar, A., & Lyons, A. C. (2019). The propagation of lean thinking in SMEs. Production Planning & Control, 30(10-12), 854-865.
Yin, Y., Stecke, K. E., Swink, M. & Kaku, I. (2017). Lessons from seru production on manufacturing competitively in a high cost environment. Journal of Operations Management, 49, 67-76.
Yusuf, Y. Y., Gunasekaran, A., Musa, A., Dauda, M., El-Berishy, N. M. & Cang, S. (2014). A relational study of supply chain agility, competitiveness and business performance in the oil and gas industry. International Journal of Production Economics, 147, 531-543.
Zhang, A., Luo, W., Shi, Y., Chia, S. T., & Sim, Z. H. X. (2016). Lean and Six Sigma in logistics: a pilot survey study in Singapore. International Journal of Operations & Production Management, 36(11), 1625-1643.
Zhang, Q., Vonderembse, M. A., & Lim, J. S. (2003). Manufacturing flexibility: defining and analyzing relationships among competence, capability, and customer satisfaction. Journal of Operations Management, 21(2), 173-191.


