

Financial Statements for the year ended 31 July 2011
UNIVERSITY OF EX
ETER
FINANCIAL STA
TEMENTS FO
R THE YEAR EN
DED 31 JU
LY 2011
Please recycle this brochure when you have finished with it.
Northcote HouseThe Queen’s DriveExeter EX4 4QJ
Telephone: +44 (0)1392 723146Fax: +44 (0)1392 723060
www.exeter.ac.uk
2011CORP172
100% recycled :

CHANCELLOR
Baroness Floella Benjamin, OBE HonDLitt Exon
PRO -CHANCELLORS
K Russell Seal, BA HonDSc KeelePeter Lacey, BSc BArch Bath RIBARichard M P Hughes (Finance), MA Oxon FCA
V ICE-CHANCELLOR AND CHIEF EXECUTIVE
Professor Sir Steven M Smith, BSc MSc PhD S’ton AcSS FRSA
DEPUTY V ICE-CHANCELLORS
Professor Neil Armstrong, BEd MSc Lough PhD Exon DSc Exon CBiolFIBiol FRSH FRSA
Professor Janice M Kay, BA Newc PhD Cantab AFBPsSProfessor Mark Overton, BA Exon MA PhD CantabProfessor Nick Talbot, BSc PhD UEA
REGISTRAR AND DEPUTY CHIEF EXECUTIVE
David J Allen, OBE BA MEd Wales
DIRECTOR OF F INANCE AND DEPUTY REGISTRAR
Jeremy C Lindley, BSoc Sci Bham ACA
DIRECTOR OF ACADEMIC SERV ICES
Michele I Shoebridge, BA (Hons), PG Dip.Lib MA
BANKERS
National Westminster Bank plc Barclays Bank plcStocker Road 3 Bedford StreetExeter ExeterEX4 4RH EX1 1LX
INVESTMENT MANAGERS
From 9 November 2011 Until 8 November 2011J P Morgan International Investec Wealth & Investment LimitedBank Ltd (formerly Rensburg Sheppards)125 London Wall 2 Gresham StreetLondon LondonEC2Y 5AJ EC2V 7QN
EXTERNAL AUDITORS INTERNAL AUDITORS
KPMG LLP Mazars LLPPlym House Clifton Down House3 Longbridge Road Clifton DownPlymouth BristolPL6 8LT BS8 4AN
Total income up 8% to £246 million – up 50% since 2007
International student numbers reach 3,450 –up 156% since 2007. Total student numbersreach 17,950 – up 34% since 2007
£62 million direct capital investment in year –£372 million on campus investment since 2006
Non-HEFCE research income up 130%since 2007
Historic cost operating surplus £14 million –increasing every year from £0.8 million in 2007
Net assets up 18% in year to £473 million
As you read these financial statements you will see that2010/11 has been another very successful year for theUniversity of Exeter. These highlights show that we havecome a long way in a relatively short period of time interms of growth, financial performance and recognitionamongst our peers.
At the same time our students achieve ever higher entrytariffs, our drop-out rates are low, student satisfactionremains consistently ‘top ten’ and our research base is rapidly growing in both size and international reputation.
This performance reflects the rewards from the strategicobjectives undertaken and implemented by the Universityand its staff over a number of years now. These initiatives are all aligned with our aim to be a world-class, research-led University which retains its student-focused philosophy and drive for academic excellence. We have reorganised our Colleges; internationalised our student base and ourresearch; redirected resources to support our faculty andstudents; continued to invest in top academics and tosupport their research, their teaching and the wider transfer of knowledge.
However, this only tells a part of the story. The coming yearsmark a period of significant change for both the Universityand the sector as a whole. As the future of Higher Educationand the new funding regime becomes clearer we nowrecognise that our past investments and achievements have positioned us well to benefit from these changes. But our efforts must continue.
Over several years we have invested heavily in ourinfrastructure – at our campuses in Exeter and at ourTremough Campus in Cornwall – and this continues. You will read more about these ongoing investments –
FOREWORD
These pages do not form part of the Statutory Financial Statements

Page
Business Review 2
Public Benefit Statement 10
Corporate Governance and
Internal Control Statement 13
Membership of the Council 18
Responsibilities of the Council of the University 20
Independent Auditor’s Report 22
Statement of Principal Accounting Policies 24
Consolidated Income and Expenditure Account 30
Statement of Consolidated Total
Recognised Gains and Losses 32
Balance Sheets 33
Consolidated Cash Flow Statement 34
Notes to the Accounts 35
The following do not form part of the
Statutory Financial Statements:
Five Year Summary Accounts 73
Financial Statistics 75
Detailed Movements in Reserves 76
REVIEW
OF YEAR
NOTES TO
ACCOUNTS
GOVERNANCE
FINANCIAL STATEMENTS
FURTHER ANALYSIS
CONTENTS
The Forum project is an exciting new development for the heart of the
Streatham Campus, creating an inspirational mix of outside and inside
space that will deliver a new Student Services Centre, retail and catering
outlets, a refurbished Library, new technology-rich learning space, a
400-seat lecture theatre and a new University reception.
in research and teaching facilities, student facilities,accommodation and the overall ‘Exeter Experience’ – inthese financial statements. However, through strong cashflows from operations, success in achieving capital grants and partnering with external organisations for investment in non-core services, these significant investments have been achieved with an increase in net debt of less than £19 million. Our investment in new and upgraded facilitieswill continue.
Our reputation and achievement of high academicstandards, at entry and over an academic career, mean that we are well positioned for this new era in HigherEducation funding. With rising personal contributions to their education comes a rise in student expectationsabout the quality and support for research and teaching,modern facilities and technologies, and the quality of theoverall student experience both academic and social.
As Funding Council monies are reduced and tuition incomeincreases we must ensure this income is directed towardsenhanced academic quality and so must continue our efforts in securing alternative sources of income and ingrowing our research income.
I wish to thank all of the management, staff and students of the University for their own contribution to theundoubted successes achieved. We can look forward with anticipation to further challenges ahead but also with great confidence.
K Russell Seal, Chair of Council
1These pages do not form part of the Statutory Financial Statements

2 U N I V E R S I T Y O F E X E T E R : F I N A N C I A L S TAT E M E N T S F O R T H E Y E A R E N D E D 3 1 J U L Y 2 0 1 1
Even with this uncertainty, in the year the University has
continued to drive forward with its core agenda of enhancing
its educational and research capabilities. Notwithstanding the
ongoing major capital infrastructure works at our Exeter and
Cornwall campuses the University has maintained its
achievement of always finishing as a top 10 University in the
National Student Survey. The University is grateful for the
hard work of its entire staff in mitigating the impact of this
huge capital investment on our students and we are grateful
for the forbearance of our students during this period of
significant investment. The majority of the University’s capital
programme will end in the summer of 2012. The £18.6
million Business School extension work; the delivery of the
£43.3 million INTO University of Exeter teaching and
residential buildings; the £24.9 million refurbishment of the
Biosciences Geoffrey Pope building; and the delivery of the
first £87 million stage of student residential buildings via
University Partnership Programme, were all concluded in
2010/11.
These improvements, and the University’s historic drive for
academic excellence in its mission, led to a further increase in
the student entry tariff for the academic year commencing in
September 2010 of 5% to 459. The University continued
to be one of the most popular universities in the United
Kingdom with some six applications per place in 2010/11.
We are especially pleased with the increased employability of
our students in these difficult economic times: 73% of our
students are now in graduate level employment or training
six months after graduation, a 3% improvement on last year
despite the tough economic conditions. It is not surprising
given these improvements that the University remains a
leader in student academic attainment and with some of the
lowest student drop-out rates in the higher education sector.
Research has continued to thrive and grow at the University
over the year, research income having increased by £8.6
million to £46.3 million; £64.9 million if the Funding Council
research funding is included. The University is continuing its
investment in Science research with an approved investment
of £18 million through the Science and Research and
Knowledge Transfer Strategies, of which £3.6 million was
undertaken this year.
BUS INE S S R EV I EW
OPERAT ING REV IEW
The University has continued to improve its performance
through a year that has seen uncertainty and apprehension
within the higher education sector and in the wider national
and international economies. During the year the University
retained its focus on improving its core activities of delivering
excellent research and an outstanding student experience
within a financially sustainable business model.
The growth of the University continued unabated during the
year with Dun and Bradstreet reporting the University as
the 23rd fastest growing organisation in the United Kingdom
and the 62nd across Europe in the period since 2007. The
University’s total income has grown by 50% since 2007
and staff numbers have risen from 2,500 to over 3,000 with
staff recruitment still ongoing. Capital investment on the
campuses will have led to around £372 million of new
infrastructure since 2006, including £176 million invested by
partnering with University Partnership Programme and INTO
University Partnerships Limited. Net assets have increased
from £414 million in July 2007 to £473 million this year. The
University will continue to grow over the coming years with
additional income and continued investment in infrastructure
to deliver enhancements to the student experience and
continued development of excellent world leading research.
The change in the policy environment of the higher
education sector has provided an uncertain backdrop for
the year to 31 July 2011. These policy changes now have
greater clarity following the publication by the Government
of the White Paper “Students at the Heart of the System”
and several associated consultation documents. The
University has paid close attention to Government and other
regulators’ pronouncements on these. Our analysis is that
the proposed changes will strengthen the University and
provide new opportunities to improve our research and
educational activities. The regulatory changes will also bring
some challenges which will need to be resolved, most
notably in relation to our agenda to widen participation and
access to higher education for excellent students from lower
socio economic groups. Overall, despite this potential issue,
the University believes it is well placed to benefit from the
changes.

3
BUS INE S S R EV I EW
REVIEW
OF YEAR
BU I LD ING ON SUCCESS , INVEST ING FOR THE FUTURE
The purpose-built Environment and Sustainability Institute being constructed on our Tremough, Cornwall Campus will bring
together state-of-the-art resources, leading academics and researchers to lead cutting-edge and interdisciplinary research into
the consequences of environmental change and the mitigation and management of its effects.
‘The Exchange’, representing further investment in world-class learning, teaching and research facilities at the Tremough
Campus, will help the University and its partner, University College Falmouth, to achieve their shared vision to create a
world-class campus for Cornwall.

4 U N I V E R S I T Y O F E X E T E R : F I N A N C I A L S TAT E M E N T S F O R T H E Y E A R E N D E D 3 1 J U L Y 2 0 1 1
The University approved an additional plan to invest in
research growth in Arts, Humanities and Social Sciences
during the year. Investment in research is targeted at
promoting excellent research in key inter-disciplinary themes
whilst being mindful of the 2014 Research Excellence
Framework. Investment to increase the number of
postgraduate research students at the University has
progressed well with the University now having, on average,
2.1 students per academic member of staff. This
improvement in part explains the University’s success in
being accredited as a Doctoral Training Centre for the
Economic and Social Research Council in partnership with
the Universities of Bath and Bristol.
In order to improve the quality of the student experience
and to improve the research base the University has
employed a net additional 153 staff in 2010/11, of which
115 are academic staff (including research staff and teaching
fellows). The University will continue its staff recruitment
exercise over the coming years.
In addition to successes in core areas of research and
education the University has also achieved success in other
areas:
• The University is delighted that Students’ Guild (a separate
legal entity to the University) won second best students’
union in the United Kingdom for 2010/11 in the National
Union of Students awards ceremony; they came first in
2009/10.
• The University Sports Office and the Athletics Union
achieved eighth place in the British Universities and
Colleges Sports league, a competition against 161 other
universities and colleges, an improvement on its tenth
position in the league in 2009/10.
• Both the University’s Communications and the
Development and Alumni Relations teams won first prize
in the Times Higher Education’s Leadership and
Management Awards. In addition the Development and
Alumni team achieved their target of raising £23 million
from donations and philanthropic giving a year early.
• The University gained a “First” in the 2011 People and
Planet Green League award along with 36 other
universities. The University was also delighted to win the
Green Gown award for the One Planet MBA offered by
the Business School. The judges described the course as
“a unique programme designed to develop a new
generation of managers and leaders who will transform
business and deliver more sustainable strategies.” Other
significant environmental successes include a 60% increase
in the number of bicycles being used following new cycle
parking and incentive schemes. Bus use has also increased
by 40% following work with Devon County Council and
Stagecoach.
The performance of the University in 2010/11 has led to
a continued rise of the University in the national and
international league tables. The University has risen to
eleventh in the Guardian League Table, tenth in the Times
and ninth in the Sunday Times league tables. In addition the
University has risen to 156th in the Times HigherWorld
League table, up 28 places from 2010. This puts the
University in the top 1% of universities in the World and on
target to be a top 100 World university by 2015.
The University, aware of the changing nature of the
environment in which it operates, started an initiative in the
year to build on the £10 million saved through its earlier
“Creating Value” initiative. The University is planning to
create additional earnings and further efficiencies of another
£10 million over the four years to 2015. This will be
achieved by targeting new surplus generating activities,
savings in procurement and process efficiencies.
BUS INE S S R EV I EW

5
BUS INE S S R EV I EW
FINANCIAL OVERV IEW
These financial statements of the University of Exeter for the year ended 31 July 2011 incorporate the University’s subsidiaries
and joint ventures. The summarised historic cost income and expenditure performance of the University over the last five
years is set out below:
Year ended 31 July: 2011 2010 2009 2008 2007£m £m £m £m £m
Funding Council income 74.8 71.6 67.7 63.5 57.9
Teaching income 81.3 74.2 60.0 45.5 35.2
Research income 46.3 37.7 33.3 24.5 20.1
Other income 43.8 43.7 42.2 45.2 39.6
Total income 246.2 227.2 203.2 178.7 152.8
Expenditure (233.1) (219.6) (195.6) (170.9) (151.2)
Share of joint venture operating results 0.9 0.8 0.2 (0.9) (0.8)
Operating surplus 14.0 8.4 7.8 6.9 0.8
Exceptional items – 10.9 0.5 (5.1) 5.3
Transfer from endowment funds 0.6 0.3 0.4 0.2 –
Historical cost surplus for the year 14.6 19.6 8.7 2.0 6.1
The University’s historic cost operating surplus, before exceptional items and endowment transfers, has risen from £8.4million to £14.0 million, representing some 5.7% (3.7% in 2009/10) of total income. The operating surplus is reported after a £3.1 million (£2.6 million in 2009/10) historic cost impairment of the Geoffrey Pope building. Ignoring this non-recurrentimpairment increases the historic cost operating surplus to some 6.9% (4.8% in 2009/10) of total income. This is set against a background of a significant reduction in the future level of Funding Council capital grants.
During the year the University has maintained its financialfocus on:
• Growing earnings from educational activities.
• Growing research income on a sustainable basis.
• Managing the financial and cash impacts of the infrastructure and other investments.
• Continuing the drive to improve efficiency.
The University is now actively searching for other efficiencysavings and earnings generating activities which it couldexploit to support improvements in its educational andresearch activities.
REVIEW
OF YEAR

6 U N I V E R S I T Y O F E X E T E R : F I N A N C I A L S TAT E M E N T S F O R T H E Y E A R E N D E D 3 1 J U L Y 2 0 1 1
The level and excellence of research have been actively
promoted by an in-year investment of £3.6 million in the
Science and Research and Knowledge Transfer Strategies.
This was further enhanced in the year by a new strategy to
further promote research in humanities and social sciences.
The University is on target to grow its research income to
£60 million annually (excluding the Funding Council’s
research funding) by 31 July 2015. The University continued
to invest in high calibre, research active staff in preparation
for the 2014 Research Excellence Framework.
Other income continued to be dominated by residences,
catering and conferences, although this declined by 0.1% to
£21.8 million as some historic student residences are now
operated by our partner University Partnership Programme
Limited, who receive the student rental income. The
University continued to partner with reputable third party
organisations to deliver non-core activities so allowing
the University to focus its investment in educational and
research activities.
INCOME
Total University income has grown by 8.4% in the year to £246.2 million. This income growth is split between Funding
Council income growth of 4.4% and growth of 10.1% in non-Funding Council incomes. Overall the University received some
30% (31% in 2009/10) of its income from the Funding Council, in 2006/07 the Funding Council constituted some 38% of
University incomes. This trend of falling Funding Council revenues as a proportion of total income will continue into the future
with the Government reducing its support for teaching, by 2015/16 Funding Council income is forecast to be under 20% of
University revenues.
Funding Council grants have remained largely static in the
year with the exception of the teaching grant which rose
by 5.6% due to increases in student numbers in Cornwall
of 10%.
The single largest business activity of the University is tuition
fees and educational contracts with a total teaching income
of some £81.3 million. Overall this has grown by some
9.5% from 2009/10 with particular increases of 12.2% in
postgraduate income, 7.0% in undergraduate and 12.5%
in international student fees. This growth is largely due to
increases in student numbers of 9% and 3% with respect
to international and home/EU numbers respectively.
The increase in postgraduate student numbers is partially as a
consequence of the University’s investment to encourage
greater numbers of postgraduate research students.
Research grants and contracts grew by 22.8% in the year to
£46.3 million. It reflects the University’s intention to promote
excellent world-leading research and to increase the scale of
research activity at the University.
NET INCOME (excluding exceptional income)
Funding Council grants30.4%
Home/EU tuition fees19.5%
Research grants and contracts18.8%
Residences and catering8.9%Other income
(including share of joint venture)8.1%
Endowment andinvestment income
0.8%
International/other tuition fees13.5%
BUS INE S S R EV I EW
77
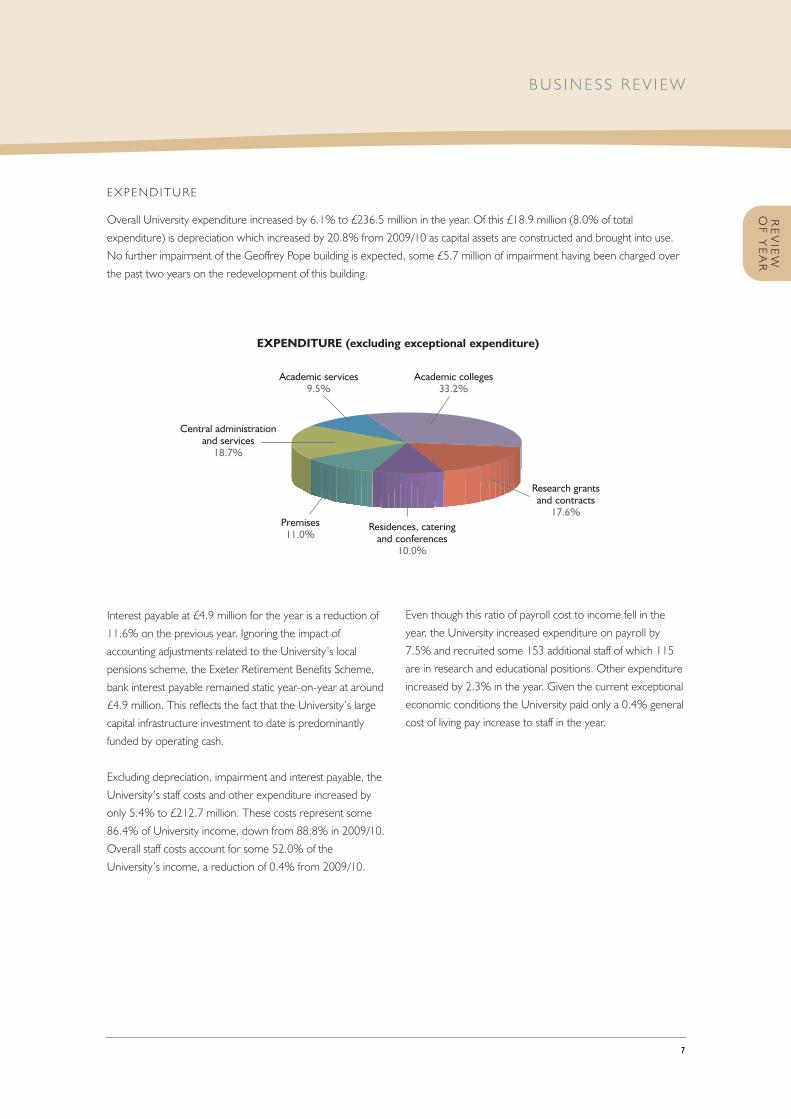
Academic colleges33.2%
Academic services9.5%
Premises11.0%
Research grants and contracts 17.6%
Central administrationand services18.7%
Residences, catering and conferences
10.0%
EXPENDITURE
Overall University expenditure increased by 6.1% to £236.5 million in the year. Of this £18.9 million (8.0% of total
expenditure) is depreciation which increased by 20.8% from 2009/10 as capital assets are constructed and brought into use.
No further impairment of the Geoffrey Pope building is expected, some £5.7 million of impairment having been charged over
the past two years on the redevelopment of this building.
EXPENDITURE (excluding exceptional expenditure)
Even though this ratio of payroll cost to income fell in the
year, the University increased expenditure on payroll by
7.5% and recruited some 153 additional staff of which 115
are in research and educational positions. Other expenditure
increased by 2.3% in the year. Given the current exceptional
economic conditions the University paid only a 0.4% general
cost of living pay increase to staff in the year.
Interest payable at £4.9 million for the year is a reduction of
11.6% on the previous year. Ignoring the impact of
accounting adjustments related to the University’s local
pensions scheme, the Exeter Retirement Benefits Scheme,
bank interest payable remained static year-on-year at around
£4.9 million. This reflects the fact that the University’s large
capital infrastructure investment to date is predominantly
funded by operating cash.
Excluding depreciation, impairment and interest payable, the
University’s staff costs and other expenditure increased by
only 5.4% to £212.7 million. These costs represent some
86.4% of University income, down from 88.8% in 2009/10.
Overall staff costs account for some 52.0% of the
University’s income, a reduction of 0.4% from 2009/10.
BUS INE S S R EV I EW
REVIEW
OF YEAR

8 U N I V E R S I T Y O F E X E T E R : F I N A N C I A L S TAT E M E N T S F O R T H E Y E A R E N D E D 3 1 J U L Y 2 0 1 1
BALANCE SHEET
The University’s net assets have increased considerably inthe year to £472.6 million from £398.3 million, an increaseof 18.7%. One driver for the increase in net assets is theinvestment the University has made in infrastructure, both incapital expenditure and in higher levels of maintenance, overthe last five years. This has been achieved without requiringcommensurate levels of additional debt. This investment isreflected both with the £62.1 million investment in tangiblefixed assets this year and also in a £51.4 million uplift in thevalue of tangible fixed assets arising from the five yearlyrevaluation process carried out by the professional valuersJones Lang LaSalle.
During the year the University has completed therefurbishment of the Geoffrey Pope building (£24.9 million)and the refurbishment and extension of the Business School(£18.6 million). At the Exeter campuses work is ongoingwith the Sir Henry Wellcome Mood Disorders Centre(£1.2 million in 2010/11) and the Forum project, torevolutionise the student experience at the main StreathamCampus (£25.8 million in 2010/11), these are planned tocomplete in 2011/12. In addition the University has juststarted work on the development of the £26 millionWellcome Wolfson Centre for Translational Medicine inassociation with the Royal Devon and Exeter NHSFoundation Trust and the Peninsula College of Medicine andDentistry (PCMD). At the University’s Cornwall Campuswork is underway on the Environment and SustainabilityInstitute (£30.8 million) and the Exchange (£8.6 million)both of which are planned to complete beforeSeptember 2012.
Net current assets fell in the year as cash and short terminvestment balances were allocated to the funding of thecapital programme and as short term creditors increased topay for the construction works. The reduction in net currentassets was expected and the University has undrawn bankfacilities of £62.3 million which, together with approvedcapital grants, more than covers all the current capitalcommitments.
CASH FLOW
The University generated some £29.7 million in operatingcash during the year, an increase of £15.1 million on the£14.6 million generated in 2009/10. This cash part fundedthe University’s large capital programme which required£59.1 million of cash over the twelve months. Other cashused to fund the capital programme included £14.9 millionof capital grants, additional bank debt of £10.0 million and an£8.8 million element of the cash and short term investmentsbrought forward from 2009/10.
Overall the University’s net debt increased by 49.8% in theyear to £56.6 million. Bank debt rose by £10.0 million to£102.7 million and was offset by cash and short terminvestment holdings at 31 July 2011 of £46.2 million. Thecash inflow from operating activities was assisted in the yearby favourable working capital movements of £4.6 million;these should not be expected to recur. Ignoring thesebeneficial working capital improvements the University stillgenerated a healthy £25.1 million of operating cash inflows.
Over £420 million of infrastructure investment on theUniversity’s campuses will be fully completed by 31 July2012. The investment in infrastructure projects on theExeter campuses, including the tranche 1 programme, willthen exceed £370 million with a further £44 million beinginvested on the Cornwall Campus. An additional £100million tranche 2 infrastructure investment programme alsocommenced in the year at the Exeter campuses; this willdeliver much in the way of improved internet connectivityand teaching and learning space enhancements.
The University closely plans and monitors the cashrequirements of these large infrastructure projects.Forecasting and sensitivity analysis indicates the Universityhas the capacity to deliver these tranche 1 and tranche 2infrastructure investments whilst complying with FundingCouncil financial memorandum requirements and bankcovenants.
BU S INE S S R EV I EW

9
Key financial performance indicator Actual as at Early warning Maximum / 31 July 2011 trigger minimum level
Payroll costs as a percentage of total income 52% 55% 57%Cash and near cash **£29.8 million £15.0 million £15.0 millionCurrent ratio (including undrawn loan facility) 2.3 1.2 1.0Net liquidity days 77 50 40Loans as a percentage of total income 42% 60% 65%Compliance with bank covenants Full compliance Full compliance Full compliance
KEY F INANCIAL PERFORMANCE INDICATORS
In addition to the income and expenditure account, balance sheet and cash flow monitoring the University regularly monitors
its financial strength against six key performance indicators:
The University is operating within its key financial indicators
and future forecasting indicates that it will not breach these.
Overall the University’s finances are robust and strong even
with the liquidity issues imposed by the substantial
infrastructure investment that is currently underway.
The University Council approved a new Finance Strategy in
December 2010 which will build on the success achieved
over the last few years. Forecasting included in the Strategy
and since reveal that for the next four years the University’s
finances will remain strong and resilient. The regulatory
changes proposed by the Government in its White Paper
“Students at the Heart of the System” introduce
opportunities for the University which are currently being
explored and considered.
** University only. Cash and near cash £45.4 million including PCMD and subsidiary cash balances.
The University Council is working with the Students’ Guild at
the University to achieve the appropriate balance of future
investment and to build on the current financial resilience of
the Institution. Overall the University is confident and positive
about the future but is not complacent and remains watchful
of the unfolding changes in higher education and the national
and World economies.
J C LindleyDirector of Finance and Deputy Registrar
28 November 2011
BUS INE S S R EV I EW
REVIEW
OF YEAR
10 U N I V E R S I T Y O F E X E T E R : F I N A N C I A L S TAT E M E N T S F O R T H E Y E A R E N D E D 3 1 J U L Y 2 0 1 1
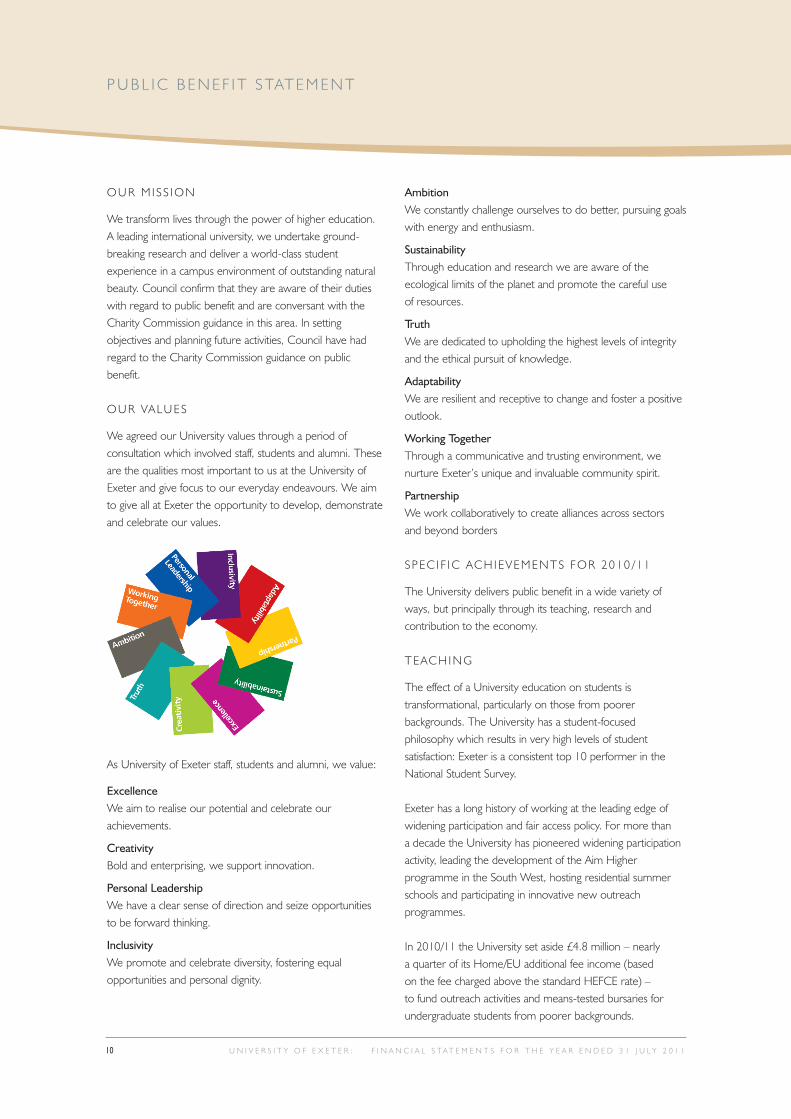
AmbitionWe constantly challenge ourselves to do better, pursuing goalswith energy and enthusiasm.
SustainabilityThrough education and research we are aware of theecological limits of the planet and promote the careful useof resources.
TruthWe are dedicated to upholding the highest levels of integrityand the ethical pursuit of knowledge.
AdaptabilityWe are resilient and receptive to change and foster a positiveoutlook.
Working TogetherThrough a communicative and trusting environment, wenurture Exeter’s unique and invaluable community spirit.
PartnershipWe work collaboratively to create alliances across sectors and beyond borders
SPEC IF IC ACHIEVEMENTS FOR 2010 /11
The University delivers public benefit in a wide variety ofways, but principally through its teaching, research and contribution to the economy.
TEACHING
The effect of a University education on students istransformational, particularly on those from poorerbackgrounds. The University has a student-focusedphilosophy which results in very high levels of studentsatisfaction: Exeter is a consistent top 10 performer in theNational Student Survey.
Exeter has a long history of working at the leading edge ofwidening participation and fair access policy. For more thana decade the University has pioneered widening participationactivity, leading the development of the Aim Higherprogramme in the South West, hosting residential summerschools and participating in innovative new outreachprogrammes.
In 2010/11 the University set aside £4.8 million – nearly a quarter of its Home/EU additional fee income (based on the fee charged above the standard HEFCE rate) –to fund outreach activities and means-tested bursaries forundergraduate students from poorer backgrounds.
OUR M ISS ION
We transform lives through the power of higher education.A leading international university, we undertake ground-breaking research and deliver a world-class studentexperience in a campus environment of outstanding naturalbeauty. Council confirm that they are aware of their dutieswith regard to public benefit and are conversant with theCharity Commission guidance in this area. In settingobjectives and planning future activities, Council have hadregard to the Charity Commission guidance on publicbenefit.
OUR VALUES
We agreed our University values through a period ofconsultation which involved staff, students and alumni. Theseare the qualities most important to us at the University ofExeter and give focus to our everyday endeavours. We aimto give all at Exeter the opportunity to develop, demonstrateand celebrate our values.
As University of Exeter staff, students and alumni, we value:
ExcellenceWe aim to realise our potential and celebrate ourachievements.
CreativityBold and enterprising, we support innovation.
Personal LeadershipWe have a clear sense of direction and seize opportunities to be forward thinking.
InclusivityWe promote and celebrate diversity, fostering equalopportunities and personal dignity.
PUBL IC BENEF IT STATEMENT

11
This provision represented 5.9% of gross tuition fee incomeand over 13% of Home/EU undergraduate fee income.Bursaries are publicised and paid at £1,500 pa for studentswith a household income below £25,000 and £750 pa forstudents with a household income between £25,001 and£35,000. A total of 2,922 students received means testedsupport in 2010/11, representing 30% of Home/EUundergraduate students.
Outreach activity sees trained Exeter student ambassadorsand staff going out to schools to help raise the aspirations ofstudents from under-represented groups and to improvetheir awareness of higher education. Students from targetschools are invited to attend a range of on-campus activitiescovering a variety of subject areas throughout the year. The University is also engaged in two innovative fair accessschemes with partners:
• Realising Opportunities is a national pilot involving 12research-intensive universities who have agreed tooperate a national ‘compact’. A compact scheme ensuresthat progression to a partner university is encouraged bymaking offers to participating students below the normalentry requirements (provided a student completes theprogramme). Only students from disadvantagedbackgrounds are invited to participate in the programmeand in order to be eligible, students have to beacademically able, have achieved a specified level of GCSEattainment, come from the public care system and/orsatisfy certain income criteria. Often, outreach isconducted locally and then students can choose to applyfor higher education study in another part of the countryentirely.
• Sutton Trust Academic Routes (STAR) takes a differentapproach and aims to identify bright young students fromdisadvantaged backgrounds at an earlier age and then offer them guaranteed entry to the University of Exeter,provided they meet certain academic and project-specificconditions along the way. Eligibility for the STARprogramme is dependent on academic ability, being ontrack for a specified level of GCSE attainment, comingfrom the public care system and/or living in a postcodeidentified as having high levels of deprivation. The STARprogramme involves 60 students from eight local schoolsand works with students pre-GCSE in Year 11 through totheir application to university in Year 13.
The University also uses contextual data in its admissionspolicy. A growing body of evidence suggests that studentsfrom poorly performing schools achieve better degree resultsthan similarly-qualified peers from high performing schools.Such contextual data is employed by the University to identifya cohort of students with potential to succeed – althoughtheir qualifications on entry might be slightly lower thanothers.
Applicants are therefore considered for offers at one gradebelow the norm (although still within published boundaries),with the expectation that they will close or overcome theachievement gap during their time at the University.
The University of Exeter is well placed to build on its historyof widening participation activity and relishes theopportunities to further increase its activities in this area. The University recognises its role as a vehicle for socialmobility and will seek to ensure that fair access is guaranteedto all applicants, regardless of background, in collaborationwith local, regional and national partners.
RESEARCH
The University seeks to undertake research which has adistinctive and measurable impact on society. There is a focuson translational research so that discoveries are used for thebenefit of society. Working with business and other funders ofresearch is fundamental to this approach. The University inrecent years having trebled the size of its on-campusInnovation Centre, which provides business units for smallhigh tech companies, is now working with a range of partnersto establish the city of Exeter’s first science park.
Exeter researchers are making major contributions to ourunderstanding of diabetes, creating new ways of testing formalaria, combating the world’s biggest killer of rice crops;discovering genes responsible for height and obesity;measuring the impact of workspace design on workers’health; assessing the effects of nitrates on athletes’ stamina,promoting the benefits of exercise in combating nicotineaddiction; identifying the link between vitamin D deficiencyand cognitive decline in the elderly; finding links between astain repellent chemical and possible thyroid problems; andmeasuring the effects of endocrine-disrupting chemicals foundin rivers.
PUBL IC BENEF IT STATEMENT
REVIEW
OF YEAR

12 U N I V E R S I T Y O F E X E T E R : F I N A N C I A L S TAT E M E N T S F O R T H E Y E A R E N D E D 3 1 J U L Y 2 0 1 1
top 200 institutions in the world. The Times HigherEducation international league table ranked the University in156th position, making it one of the top 1% of universities in the world. Exeter’s target is to make it into the top 100 by 2015.
BUS INESS ENGAGEMENT
The University works on over 1,000 business projects eachyear including student projects and research or servicecollaborations. Our links with commercial businesses andother external organisations such as the NHS, localauthorities, government agencies and the service sector, nowcontribute around £25 million to our research, consultancy,innovation and Continuing Professional Developmentportfolios. Our income from industry was such that wereceived a significant rise in our grant from the HE InnovationFund and we were ranked 24th in the UK. We are using thisto establish a new Open Innovation Fund to encouragecollaboration with industry.
In the region we are linked to many of the main employerssuch as Flybe, Thomson Reuters, the professional rugby andfootball clubs and the Met Office. We have helped supportthe development of the marine renewable energy sector inthe region through the PRIMaRE and Wave Hub projectsand our new centre for Additive Layer Manufacturing isintroducing a new manufacturing technology to South WestSMEs. The Business School ran a very successful projectClear about Carbon in Cornwall, to develop low carbonliteracy and leadership and management skills within publicsector procurement and private sector supply chains and theEnvironment and Sustainability Institute is building researchnetworks with clusters of businesses in Cornwall.
The Business School’s Business Leaders Forum continuesto grow with over 100 business members. It also runs anInnovation Club. The University was also instrumental inestablishing a new network of knowledge based businessesin the City – the Exeter Initiative for Science and Technology(ExIST) which already has over 100 members.
The University is in the midst of a five year researchinvestment plan worth £230 million. The vast majority of thisfunding is directed at expanding science activities and includesnew facilities and equipment, an increase in staffing plus extraearned income from research grants and contracts.
ECONOMIC AND SOCIAL BENEF IT
The University delivered more than £400 million worth ofeconomic benefit in 2010/11. This has risen by over £150million since 2002 and is forecast to reach nearly £500 millionby 2012. Year-on-year the University has decreased itsdependence on direct UK Government funding which nowrepresents less than 31 per cent of its income. Strong financialperformance and partnership with the private sector hasallowed the University to deliver an investment programmeof over £300 million, including new facilities for Biosciencesand the Business School plus a major redevelopment of theheart of the Streatham Campus called the Forum Project,which is due to open in spring 2012. The capital programmehas provided a much-needed boost for the constructionsector at a time of economic uncertainty.
Overall the University supports more than 5,000 jobs andis looking to increase its academic staff numbers to around1,000 in 2012. This is designed to improve the staff/studentratio.
In 2011 student numbers grew to 17,950 of which 4,615were postgraduates. Some 68% came from State Schoolsand 32% from Public Schools. International admissionscontinued to be strong, which reflects the University’sInternational Strategy and the strong performance in INTOUniversity of Exeter LLP. Students are active in their localcommunities providing thousands of hours of volunteering ayear which is aimed at helping local elderly, disadvantaged anddisabled people. The University and the Students’ Guild workhard to integrate students into the local community throughthe use of special community wardens, residents’ liaisongroups and educational programmes around issues such aslate night noise and refuse collection.
Exeter is making rapid progress up the UK and internationaluniversity rankings. In the Times Good University Guide, Exetermoved from 34th position in the UK in 2005 to 10th in2012. For the second year, Exeter was rated as one of the
PUBL IC BENEF IT STATEMENT

13
INTRODUCTION
The following statement is provided to enable readers of the Financial Statements of the Group, which comprises of the University and its subsidiaries, to obtain a betterunderstanding of the governance and legal structure of the University.
PR INCIPLES OF OPERAT ION
The University conducts its business in accordance with theseven principles identified by the Committee on Standards inPublic Life (selflessness, integrity, objectivity, accountability,openness, honesty and leadership) and with the guidance touniversities which has been provided by the Committee ofUniversity Chairmen in its Guide for Members of HigherEducation Governing Bodies in the UK. It also fully complieswith the code for governance as set out in this guidance.
LEGAL STATUS OF THE UNIVERS ITY
The University is an independent corporation, whose legalstatus derives from a Royal Charter granted in 1955. Itsobjects, powers and framework of governance are set out inthe Charter and its supporting Statutes, and approved by thePrivy Council.
The University is also an exempt charity and is regulated byHigher Education Funding Council for England on behalf ofthe Charities Commission under the Charities Act 2006.
MANAGEMENT
The Charter and Statutes require the University to have twoseparate bodies, each with clearly defined functions andresponsibilities, to oversee and manage its activities, asfollows:
• The Council – is the supreme governing body, responsiblefor the finance, property, investments and general businessof the University, and for setting the general strategicdirection of the institution. The approval by Council of anychanges to the Charter and Statutes is required beforethey can be submitted to the Privy Council.
It has a majority of members from outside the University(described as lay members), from whom its Chair must bedrawn. Also included in its members are representatives ofthe staff of the University and the student body. None ofthe lay members receives payment, apart from thereimbursement of expenses, for the work that themember does for the University.
• The Senate – is the academic authority of the Universityand draws its membership from the academic staff and thestudents of the institution. Its role is to direct and regulatethe teaching and research work of the University.
In addition to the above two bodies, Council has an AuditCommittee, a Council Nominations Committee and aRemuneration Committee. The University is required tomaintain an Audit Committee in accordance with its FinancialMemorandum with the Higher Education Funding Council forEngland (HEFCE) in order to ensure that it is fulfilling itsresponsibilities for proper financial management, effectiveinternal control, risk management and value for money.
• The Audit Committee – and its chair are appointed byCouncil and consist of members with no executiveresponsibility for the management of the University. TheCommittee is authorised to investigate any activity within its Terms of Reference. It is authorised to seek anyinformation it requires from any employee and allemployees are directed to co-operate with any requestmade by the Committee. The Committee is responsiblefor reviewing and commenting on the University’sgovernance, internal control and risk managementarrangements.
The Committee is authorised to obtain outside legal orother independent professional advice and to secure theattendance of non-members with relevant experience and expertise if it considers this necessary, normally inconsultation with the Vice-Chancellor and/or Chair ofCouncil.
The Committee considers detailed reports from theUniversity’s external and internal auditors that includerecommendations for the improvement of the institution’ssystems of risk management and internal control, togetherwith management responses and implementation plans.The Committee also receives and considers reports fromthe HEFCE as they affect the University’s business andmonitors adherence to regulatory requirements. TheCommittee takes into account the internal auditors’statement on internal control in forming its own opinion.
The Audit Committee meets four times a year with theUniversity’s senior officers and the external and internalauditors in attendance. At least once a year the Committeemeets the auditors without the University officers present.
CORPORATE GOVERNANCE AND INTERNAL CONTROL STATEMENT
GOVERNANCE

14 U N I V E R S I T Y O F E X E T E R : F I N A N C I A L S TAT E M E N T S F O R T H E Y E A R E N D E D 3 1 J U L Y 2 0 1 1
It is our policy to set base salary at the median of ourcompetitors and to reward upper quartile performancewith upper quartile rewards through a combination offixed salary and variable rewards paid for achievement ofagreed objectives and targets. Performance will be subjectto annual review and senior staff will all have the sameopportunity for salary progression.
Remuneration Committee takes great care to ensure that it complies with the HEFCE Accounts Direction onsenior staff salaries. For example the Vice-Chancellor’sbase salary is positioned against the median salaries ofVice-Chancellors of a Comparator Group of Universitieswhose performance on Key Performance Indicators isused by the University to measure its own progress. Theaim of the Committee is to position the Vice-Chancellor’sbase salary at the median for this Group and to use anelement of variable reward if performance in that yearwarrants it.
There are two meetings of the Remuneration Committeewithin each calendar year: the first meeting (which takesplace just before the financial year commences) agreesperformance targets for VCEG and reviews remunerationstrategy and comparative market data; the second meeting(which is held after the financial year ends) reviewsperformance against the previous year’s targets, decideson salaries and the level of awards to be made and agreesa statement for inclusion in the Annual Report of theUniversity.
Professors are invited to submit a statement describingtheir achievements over the previous twelve months.Statements are reviewed by their Dean, the Deputy Vice-Chancellor responsible for the College and the Director of Human Resources who jointly produce a draft salaryplan to reflect the strategy agreed by RemunerationCommittee. The finalised Professorial Salary Plan ispresented for approval to the second meeting of theRemuneration Committee. Detailed gender analysis isundertaken to ensure consistency and equality oftreatment in the review process. As a result of this year’sreview, the gender pay gap has been closed to just3.25%, the lowest figure since monitoring of this kindbegan in 2006 and well within the tolerance bandrecommended by the Equality Challenge Unit.
• The Council Nominations Committee – is responsiblefor making recommendations to Council in relation tonominations for the posts for Chancellor, Pro-Chancellorand Chair of Council. In addition it makesrecommendations in relation to the nominations forexternal members of Council, nominations to otherCouncil and joint Senate and Council committees andnominations for Trusts associated with the University. Italso reviews the criteria for appointments having regard for Council’s and the University’s; equality and diversityand other policies. The Committee is comprised of fivelay members, three of whom are the University’s Pro-Chancellors, the Vice-Chancellor and the Senior DeputyVice-Chancellor.
During the year the Committee conducted an extensiveexternal process to identify and recruit a new Chair ofCouncil at the end of the term of office of Russell Seal on31 July 2012. This process, led by a Pro-Chancellor of theUniversity, was conducted in accordance with guidelinesfor public appointments and involved the use of nationalpress advertising including advertisement on the CabinetOffice website, the engagement of independentrecruitment consultants and interviews with appropriatelyqualified candidates. The Committee was pleased with thestrength of response and quality of the candidates for thispost. On 13 October 2011 Council approved therecommendation of the Committee and confirmed theappointment of Sarah Turvill, from 1 August 2012, as thenew Chair of Council and Pro-Chancellor.
• The Remuneration Committee – is responsible forsetting the remuneration of all senior staff including the Vice-Chancellor’s Executive Group (VCEG), Deans of Colleges, Professors and senior staff within theProfessional Services. The Committee is comprised of fivelay governors and is chaired by the Chair of Council. TheVice-Chancellor and the Senior Deputy Vice-Chancellorattend meetings but no member of staff is present for thediscussion of their own remuneration.
The University’s remuneration strategy, approved byCouncil, is to provide sustainable remuneration packagesthat enable us to retain and attract the best availabletalent, that are competitive against the appropriate marketand which encourage and support a high-performanceculture in a way that is fair and externally transparent.
CORPORATE GOVERNANCE AND INTERNAL CONTROL STATEMENT

15
The retention of key research staff is also clearly key tofuture institutional success and an innovative incentivescheme has been introduced for key members of theprofessoriate with the aim of securing their long-termcommitment to the University.
In parallel to this process the Registrar and Deputy Chief Executive develops a draft salary plan for seniorprofessional staff. The plan reflects individuals’ performanceas assessed through the appraisal process and takesaccount of comparative market data. The plan, followingconsultation with the Deputy Vice-Chancellors, isdiscussed with the Vice Chancellor before it too ispresented to the second meeting of the RemunerationCommittee for approval.
Remuneration Committee considers recommendationsfrom the Vice-Chancellor and makes decisions on thesalaries of VCEG members before finally, in closed sessionand informed by the findings of the annual Committee ofUniversity Chairmen (CUC) Survey of Vice-Chancellors’Remuneration, the Lay Members of RemunerationCommittee decide the salary of the Vice-Chancellor.These decisions are then summarised in a statementwhich appears in the Annual Report of the University.
The Remuneration Committee favours a close linkbetween performance and reward and the use ofperformance linked incentive schemes has now beenextended to cover College Executive teams (Deans,Associate Deans and College Managers) and to Heads ofProfessional Services in addition to members of VCEG.The Committee determines the awards to be paid underthis scheme by reference to a balanced scorecard, withthe expectation that 50% of the available payments willrelate to the achievement of operating surplus targets andthe remaining 50% to the achievement of personalobjectives.
2010/11 was another very successful year for theUniversity. Highlights included an operating surplus of£14.6 million (against a target of £7 million); being rankedas the 23rd fastest growing business in the UK (62ndfastest in Europe) by the independent business analysts,Dunn and Bradstreet; appearing in the Top 10 of theSunday Times University Guide for the first time, up eightplaces from the previous year’s position of 17th; rising 28places to 156th in the Times HigherWorld Universityrankings; continued improvement in the quality of the
undergraduates with Exeter now placed 6th in terms ofAAB student attainment; the new Business School BuildingOne opening on time and within budget; maintaining ourTop 10 position in the National Student Survey, coming8th out of 118 institutions; and exceeding by £2.5 million,the campaign target of £23 million for the “Creating aWorld-Class University Together” appeal.
For the third year in a row and at their own request, thebase salaries of VCEG members were frozen. WhilstRemuneration Committee again agreed to accede to thisrequest, the Committee is mindful of the need to ensurethe long term retention of key staff and is anxious tomaintain the market competitiveness of senior officers’salaries. As reported last year, Remuneration Committeedecided to increase the bonus opportunity available toVCEG members from 12.5% to 20% of base salary.Whereas performance in 2009/10 resulted in the releaseof 80% of the available bonus, Remuneration Committeedecided that the full 100% bonus opportunity should beopen to members of VCEG and, indeed, to all membersof the other incentive schemes referred to above. Theactual payments made to each individual were determinedby reference to their performance against their agreedobjectives.
V ICE -CHANCELLOR AND CHIEF EXECUTIVE
The principal academic and administrative officer of theUniversity is the Vice-Chancellor who has a generalresponsibility to the Council for maintaining and promotingthe efficiency and good order of the University. Under theterms of the formal Financial Memorandum between theUniversity and the Higher Education Funding Council forEngland, the Vice-Chancellor is the designated officer of theUniversity and in that capacity can be summoned to appearbefore the Public Accounts Committee of the House ofCommons.
As Chief Executive of the University, the Vice-Chancellorexercises considerable influence on the development ofinstitutional strategy, the identification and planning of newdevelopments and the shaping of the institutional ethos. The Deputy Vice-Chancellors and the senior administrativeofficers all contribute in various ways to this aspect of thework, but the ultimate responsibility for what is done restswith the Vice-Chancellor.
CORPORATE GOVERNANCE AND INTERNAL CONTROL STATEMENT
GOVERNANCE

CORPORATE GOVERNANCE AND INTERNAL CONTROL STATEMENT
16 U N I V E R S I T Y O F E X E T E R : F I N A N C I A L S TAT E M E N T S F O R T H E Y E A R E N D E D 3 1 J U L Y 2 0 1 1
UNIVERS ITY COMMITTEES
Council met five times during the 2010/11 academic yearand in addition was supported by three Council committees,whose decisions were formally reported to Council. Thesecommittees were the Audit Committee, RemunerationCommittee, and Council Nominations Committee. They areformally constituted as committees of Council with writtenterms of reference and specified membership, whichincludes lay members. A lay member chaired the Audit,Remuneration and Council Nominations Committees.
Concerning its strategic and developmental responsibilities,Council receives recommendations and advice from theVice-Chancellor’s Executive Group and the SeniorManagement Group, including a recommendation on theannual revenue budget, and monitoring reports onperformance against the approved budget. Two strategicgroups, led by Council members, being the Risk GovernanceCommittee and the Infrastructure Strategy Group, alsosupported the Council in much of its detailed work. From2011/12 the Risk Governance Committee will stand downand risk-related objectives will be coordinated and deliveredby the Vice-Chancellor’s Executive Group.
The University’s business is governed through a mechanismknown as dual assurance. This model involves two people –the first of these is a member of the Vice-Chancellor'sExecutive Group, who takes responsibility for themanagement and development of policy in a particular areaof business. The second member of the dual assurancepartnership is a lay member of Council, knowledgeable inthe same area, who provides assurance to Council that thisactivity is well-managed and that decisions have beenreached following due process and appropriate consultation.
The University also has formal standing committees in theareas of Health and Safety, Ethics, Honorary Degrees, andalso the Senate, its academic decision-making body.
STATEMENT OF INTERNAL CONTROL
As the governing body of the University of Exeter, Councilhas responsibility for maintaining a sound system of internalcontrol that supports the achievement of policies, aims andobjectives, while safeguarding the public and other funds andassets for which it is responsible, in accordance with theresponsibilities assigned to Council in the Charter andStatutes and the Financial Memorandum with HEFCE.
The system of internal control is designed to manage ratherthan eliminate the risk of failure to achieve policies, aims andobjectives; it can therefore only provide reasonable and notabsolute assurance of effectiveness.
The system of internal control is based on an ongoingprocess designed to identify the principal risks to theachievement of policies, aims and objectives, to evaluate the nature and extent of those risks and to manage themefficiently, effectively and economically. This process has beenin place for the year ended 31 July 2011 and up to the date of approval of the financial statements.
Council has responsibility for reviewing the effectiveness ofthe system of internal control. It meets at regular intervals (at least four times a year) to consider the plans and strategicdirection of the institution and receives periodic reports fromthe Chair of Audit Committee concerning internal controland the minutes of Audit Committee.
The Audit Committee receives regular reports from theinternal audit, which includes an independent opinion on the adequacy and effectiveness of the University’s system of internal control, together with recommendations forimprovement.
The University has established the Risk ManagementCommittee (formerly the Performance and Risk SteeringGroup) to manage the development of risk management at Exeter and the Audit Committee oversees the workundertaken through the consideration of regular reports andan annual meeting with representatives of the Group. Aregular programme of facilitated workshops is held acrossthe University to identify and keep up to date the record of risks facing the organisation. The Risk ManagementCommittee also reports regularly to Council, via managers,on the steps they are taking to manage risks in their areas ofresponsibility, including progress reports on key projects.
The University continues to undertake a programme of riskawareness training and a robust risk prioritisationmethodology based on risk ranking has been developed,together with the on-going maintenance of an organisation-wide risk register.

CORPORATE GOVERNANCE AND INTERNAL CONTROL STATEMENT
17
A system of key performance and risk indicators has beendeveloped and these are continually updated. This, togetherwith reports received from budget holders, departmentheads and project managers on internal control activities,ensures compliance is maintained.
The review of the effectiveness of the system of internalcontrol is informed by the internal audit team contracted toExeter, which operates to standards defined in the HEFCEAudit Code of Practice and which was last reviewed foreffectiveness by the HEFCE Audit Services in July 2009. Theinternal auditors submit regular reports, which include thehead of internal audit’s independent opinion on theadequacy and effectiveness of the University’s system ofinternal control, with recommendations for improvement.The internal auditors’ annual opinion on the internal controlenvironment is taken into account by Audit Committee inpreparing their own opinion on internal control.
The review of the effectiveness of the system of internalcontrol is also informed by the work of the executivemanagers within the University, who have responsibility forthe development and maintenance of the internal controlframework, and by comments made by the external auditorsin their management letter and other reports.
D I SABLED EMPLOYEES
The University gives full consideration to applications foremployment from disabled persons where the candidate'sparticular aptitudes and abilities are consistent withadequately meeting the requirements of the job.Opportunities are available to disabled employees fortraining, career development and promotion.
Where existing employees become disabled, it is theUniversity’s policy to provide continuing employmentwherever practicable in the same or an alternative positionand to provide appropriate training to achieve this aim.
REG ISTER OF INTERESTS
The University maintains a Register of Interests of membersof the Council and senior officers, which may be consultedby arrangement with the Registrar and Deputy ChiefExecutive.
FURTHER INFORMAT ION
The Statutes of the University specify that the Registrar andDeputy Chief Executive should act as Secretary of theCouncil to whom any enquiries about the constitution andgovernance of the University should be addressed.
GOVERNANCE

18 U N I V E R S I T Y O F E X E T E R : F I N A N C I A L S TAT E M E N T S F O R T H E Y E A R E N D E D 3 1 J U L Y 2 0 1 1
Members of Council
1) Mr P Lacey: Pro-Chancellor
2) Professor Sir S M Smith: Vice-Chancellor and Chief Executive
3) Mr K R Seal: Chair and Pro-Chancellor
4) Professor N Armstrong: Deputy Vice-Chancellor (International)
5) Mr R M P Hughes: Chair of Audit Committee and Pro-Chancellor (Finance)
8) Professor J M Kay: Deputy Vice-Chancellor (Education)
9) Mr M Choules: Lord Mayor of Exeter
11) Mr N Bull: Corporate Finance Banking
13) Professor S Banducci: Associate Dean of Education*
14) Ms J Hargadon: Lay member of Council
15) Sir Robin Nicholson: Former Professor of Metallurgy, Chief Scientific Adviser to the Cabinet Office
16) Mr C J Allwood: Managing Director of the Telegraph Group
17) Ms B Rigg: Partner, Bond Pearce LLP
18) Mr M Jordan: Management Consultant
19) Lady Studholme: Lay member of Council
20) Mrs S Buck: Director, BSW Consulting
22) Professor S J Rippon: College of Humanities
24) Mr N Davies: President of Students’ Guild*
In attendance:
6) Mr D Allen OBE: Registrar and Deputy Chief Executive
7) Ms M Shoebridge: Director of Academic Services
10) Mr J C Lindley: Director of Finance and Deputy Registrar
21) Mr S Cooper: Director of Human Resources
Members of Council 2011-12 not pictured:
Dame S Leather OBE: Chair of the Charity Commission
Professor K E Evans: Dean, College of Engineering, Mathematics and Physical Sciences
Members of Council whose appointment ended in 2010/11:
Pictured and in attendance:
12) Professor M Overton: Deputy Vice-Chancellor (External Affairs) – retired 13 October 2010
23) Professor N Talbot: Deputy Vice-Chancellor (Research and Knowledge Transfer) – retired 13 October 2010
Not pictured:
Professor R L Lamming: ex Dean, University of Exeter Business School – resigned 31 July 2011
Mr J Beddall: President of Students’ Guild – appointed from 1 August 2010 to 31 July 2011
*Appointed 1 August 2011
MEMBERSH I P OF THE COUNC I L

1 72
83
45 6
910
11
18 19
24
14
2322
13
1716
1215
20 21
19

20 U N I V E R S I T Y O F E X E T E R : F I N A N C I A L S TAT E M E N T S F O R T H E Y E A R E N D E D 3 1 J U L Y 2 0 1 1
In accordance with the Royal Charter of Incorporation andStatutes of the University of Exeter, the Council of theUniversity is responsible for the administration andmanagement of the affairs of the University and is requiredto present audited financial statements for each financial year.
Working through its Audit Committee, Council is responsiblefor the proper maintenance of accounting records whichdisclose with reasonable accuracy at any time the financialposition of the University and related parties and whichenable it to ensure that the financial statements are preparedin accordance with the University’s Charter of Incorporationand Statutes, the Statement of Recommended Practice onAccounting for Further and Higher Education Institutions(SORP) and other relevant accounting and financial reportingstandards. In addition, within the terms and conditions of aFinancial Memorandum agreed between the HigherEducation Funding Council for England and the Council ofthe University, the Council, through its designated officeholder (the Vice-Chancellor), is required to prepare financialstatements for each financial year which give a true and fairview of the state of affairs of the University and of thesurplus or deficit and cash flows for that year.
In causing the 2010/11 financial statements to be prepared,the Council has ensured through its senior officers and AuditCommittee that:
• suitable accounting policies are selected and applied consistently. The Council notes that legislation in the United Kingdom governing the preparation and dissemination of financial statements may differ from legislation in other jurisdictions;
• judgements and estimates are made that are reasonable;
• applicable accounting and financial reporting standards have been followed, subject to any material departures disclosed and explained in the financial statements; and
• financial statements are prepared on the going concern basis unless it is inappropriate to presume that the Group will continue in operation. The Council is satisfied that the Group has adequate resources to continue in operation for the foreseeable future: for this reason the going concern basis continues to be adopted in the preparation of the financial statements.
The Council, through the Director of Finance, ensures thatthe publication of the Financial Statements, including accessvia the University’s website, is consistent with these auditedfinancial statements; the work carried out by the auditorsdoes not involve consideration of these matters and,accordingly, the auditors accept no responsibility for anychanges that may have occurred to the financial statementssince they were initially presented on the website.
The Council has taken reasonable steps through its seniorofficers and Audit Committee to:
• ensure that funds from the Higher Education Funding Council for England (HEFCE) and the Training and Development Agency for Schools are used only for the purposes for which they have been given and in accordance with the Financial Memorandum with the Higher Education Funding Council and the funding agreement with the Training and Development Agency for Schools and any other conditions which the Funding Council and the Agency may from time to time prescribe;
• ensure that there are appropriate financial and management controls in place to safeguard public funds and funds from other sources;
• safeguard the assets of the University and of the Group and to prevent and detect fraud and other irregularities;
• secure the economical, efficient and effective management of the University’s resources and expenditure; and
• ensure that the key principles of effective risk managementhave been applied in line with the requirements of HEFCE’s Accounts Direction.
R E S PONS I B I L I T I E S OF THE COUNC I L OF THE UN I V ER S I TY

21
INTERNAL F INANCIAL CONTROL
The key elements of the University’s system of internalfinancial control, which is designed to discharge theresponsibilities set out above, include the following:
• clear definitions of the responsibilities of, and the authority delegated to, Deans of Colleges and directors of professional services;
• experienced and suitably qualified staff who take responsibility for the finance and control functions within the University and its subsidiary companies;
• a comprehensive medium and short term planning processsupplemented by detailed annual income, expenditure andcapital budgets and cash flow forecasts;
• regular reviews of academic performance and monthly reviews of financial results involving variance reporting and updates of forecast outturns;
• clearly defined and formalised requirements for approval and control of expenditure, with investment decisions involving capital or revenue expenditure being subject to detailed appraisal;
• Financial Regulations supplemented by a comprehensive Financial Handbook, detailing financial controls and procedures, which is updated on an annual basis;
• a professional Internal Audit team whose annual programme is approved by the Audit Committee and endorsed by Council and whose head provides Council with a report on internal audit activity within the Universityand an opinion on the adequacy and effectiveness of the University’s system of internal control, including internal financial control, corporate governance and management of risk; and
• a formalised treasury and investment management policy.
R E S PONS I B I L I T I E S OF THE COUNC I L OF THE UN I V ER S I TY
Council’s review of the effectiveness of the system of internalfinancial control is informed by the work of the internalauditors, the Audit Committee (which oversees the work ofthe internal audit service), the individual members of staffwithin the University who have responsibility for thedevelopment and maintenance of the financial controlframework and comments made by the External Auditors inthe management letter and in other reports. The Universitycurrently contracts out the internal audit function to MazarsLLP.
Any system of internal financial control can, however, onlyprovide reasonable, but not absolute, assurance againstmaterial misstatement or loss.
The Corporate Governance Statement and Responsibilities of the Council of the University on pages 13 to 21 wereapproved by Council on 28 November 2011 and signed onits behalf by:
K R Seal
Chair of Council
D J Allen
Registrar and Deputy Chief Executive
GOVERNANCE

22 U N I V E R S I T Y O F E X E T E R : F I N A N C I A L S TAT E M E N T S F O R T H E Y E A R E N D E D 3 1 J U L Y 2 0 1 1
We have audited the group and University financial
statements (the ‘‘financial statements’’) of the University of
Exeter for the year ended 31 July 2011 which comprise the
Statement of Principal Accounting Policies, Consolidated
Income and Expenditure Account, Note of Historical Cost
Results, Statement of Consolidated Total Recognised Gains
and Losses, Consolidated Balance Sheet, Balance Sheet,
Consolidated Cash Flow Statement and related notes. The
financial reporting framework that has been applied in their
preparation is applicable law and United Kingdom Accounting
Standards (United Kingdom Generally Accepted Accounting
Practice).
This report is made solely to the Council of the University of
Exeter (“Council”), in accordance with the Charters and
Statutes of the institution. Our audit work has been
undertaken so that we might state to the Council those
matters we are required to state to it in an auditor’s report
and for no other purpose. To the fullest extent permitted by
law, we do not accept or assume responsibility to anyone
other than the Council for our audit work, for this report, or
for the opinions we have formed.
RESPECT IVE RESPONS IB I L IT I ES OF THE
COUNCIL AND AUDITORS
As explained more fully in the Responsibilities of the Council
of the University Statement set out on pages 20 and 21, the
Council is responsible for the preparation of financial
statements which give a true and fair view. Our responsibility
is to audit, and express an opinion, on the financial
statements in accordance with applicable law and
International Standards on Auditing (UK and Ireland). Those
standards require us to comply with the Auditing Practices
Board’s Ethical Standards for Auditors.
SCOPE OF THE AUDIT OF THE F INANCIAL
STATEMENTS
An audit involves obtaining evidence about the amounts and
disclosures in the financial statements sufficient to give
reasonable assurance that the financial statements are free
from material misstatement, whether caused by fraud or
error.
I NDEPENDENT AUD ITOR ’ S R E PORT TO THE COUNC I L OF THE UN I V ER S I TY OF EXETER
This includes an assessment of: whether the accounting
policies are appropriate to the group’s and University’s
circumstances and have been consistently applied and
adequately disclosed; the reasonableness of significant
accounting estimates made by the Council; and the overall
presentation of the financial statements. In addition, we read
all the financial and non-financial information in the Business
Review to identify material inconsistencies with the audited
financial statements. If we become aware of any apparent
material misstatements or inconsistencies we consider the
implications for our report.
OP IN ION ON F INANCIAL STATEMENTS
In our opinion the financial statements:
• give a true and fair view of the state of the affairs of the
Group and University as at 31 July 2011 and of the
Group’s income and expenditure, recognised gains and
losses and cash flows for the year then ended;
• have been properly prepared in accordance with United
Kingdom Generally Accepted Accounting Practice; and
• have been prepared in accordance with the Statement of
Recommended Practice – Accounting for Further and
Higher Education.
OP IN ION ON OTHER MATTERSPRESCR IBED IN THE HEFCE AUDIT CODEOF PRACT ICE I S SUED UNDER THEFURTHER AND H IGHER EDUCAT ION ACT 1992
In our opinion, in all material respects:
• funds from whatever source administered by the
University for specific purposes have been properly
applied to those purposes;
• income has been applied in accordance with the
University’s Statutes; and
• funds provided by HEFCE have been applied in
accordance with the Financial Memorandum and any
other terms and conditions attached to them.

FINANCIAL STATEMENTS
23
I NDEPENDENT AUD ITOR ’ S R E PORT TO THE COUNC I L OF THE UN I V ER S I TY OF EXETER
MATTERS ON WHICH WE ARE REQUIRED
TO REPORT BY EXCEPT ION
We have nothing to report in respect of the following matter
where the HEFCE Audit Code of Practice issued under the
Further and Higher Education Act 1992 requires us to report
to you if, in our opinion:
• the statement of internal control included as part of the
Corporate Governance Statement is inconsistent with our
knowledge of the University and group.
E Holiday
for and on behalf of KPMG LLP, Statutory Auditor
Chartered Accountants
Plym House
Plymouth
PL6 8LT
28 November 2011
UN IV ER S I TY OF EXETERSTATEMENT OF P R INC I PA L ACCOUNT ING POL IC I E S
24 U N I V E R S I T Y O F E X E T E R : F I N A N C I A L S TAT E M E N T S F O R T H E Y E A R E N D E D 3 1 J U L Y 2 0 1 1
1. GENERAL
In accordance with FRS 18 ‘Accounting Policies’ these
accounting policies have been reviewed by the University’s
Council and are considered appropriate to the University’s
activities.
The financial statements have been prepared under the
historical cost convention modified by the revaluation of
certain fixed assets and investments, and in accordance with
the Statement of Recommended Practice (SORP): Accounting
for Further and Higher Education 2007 and applicable
accounting standards. They conform to guidance published by
the Higher Education Funding Council for England.
2. GOING CONCERN
The University’s activities, together with the factors likely to
affect its future development and performance, are set out in
the Business Review on pages 2 to 9. The financial position of
the University, its cash flows and liquidity position are
described in the Financial Overview section of that review.
The Council has reviewed a detailed performance budget
and cash flow which indicates that the University and its
subsidiaries will be able to operate within the level of its
current facilities for at least twelve months from the date of
signing these financial statements and will be able to meet its
cash commitments and debt repayments as they fall due.
Based on this review, the Council has a reasonable
expectation that the University has adequate resources to
continue in operational existence for the foreseeable future.
Accordingly they continue to adopt the going concern basis in
preparing these financial statements.
3. BAS I S OF CONSOL IDAT ION
The results of the University’s subsidiary undertakings and
undertakings that it has a controlling interest in have been
consolidated in the financial statements and details of these
are provided in note 13. The University’s share of the results
in its joint ventures has been consolidated in the financial
statements and details of these and the basis of consolidation
are provided in note 14.
The activities of the University of Exeter Students’ Guild have
not been consolidated on the grounds that the University
does not operate dominant influence over its activities.
Details of these are provided in note 32.
4. RECOGNITION OF INCOME
The recurrent grants from the funding bodies represent the
funding allocations, which are attributable to the current
financial year and are credited direct to the income and
expenditure account.
Tuition fees represent all fees chargeable to students or their
sponsors received and receivable attributable to the current
accounting period net of discounts. The costs of any fees
waived by the University are deducted from tuition fee
income and reported in note 2.
Income from research grants, contracts and other services
rendered is included to the extent of the completion of the
contract or service concerned. This is generally equivalent to
the sum of the relevant expenditure incurred during the year
and any related contribution towards overhead costs.
All income from short-term deposits is credited to the
income and expenditure account in the period in which
it is earned.
Income from endowments and donations is included in full in
the Income and Expenditure Account. Income from
endowment assets held for restricted purposes imposed by
the donor or funder is recognised in full on a receivable basis
unless conditions attaching to the funding limit the University’s
right to the investment income.
Non-recurrent grants from the funding bodies or other
bodies received in respect of the acquisition or construction
of fixed assets are treated as deferred capital grants and
amortised in line with depreciation over the life of the assets.
The University acts as an agent in the collection and payment
of hardship funds and training bursaries from the funding
bodies. Related receipts from the HEFCE and Training and
Development Agency for Schools (TDA) and subsequent
disbursement to students are excluded from the income and
expenditure account and are shown separately in notes 33
to 36.

UN IV ER S I TY OF EXETERSTATEMENT OF P R INC I PA L ACCOUNT ING POL IC I E S
FINANCIAL STATEMENTS
25
Income within the University’s subsidiary companies
represents the fair value of consideration receivable,
excluding Value Added Tax, in the ordinary course of that
Company’s business for goods and services provided. In
respect of long-term contracts and contracts for on-going
services, turnover represents the value of work done in the
year, including estimates of amounts not invoiced. Turnover in
respect of long-term contracts for on-going services is
recognised by reference to the stage of completion.
5. FORE IGN CURRENCIES
Transactions denominated in foreign currencies are
recorded at the rate of exchange ruling at the date of the
transactions. Monetary assets and liabilities denominated
in foreign currencies are translated into sterling at year-end
rates. Resulting exchange differences are dealt with in the
determination of income and expenditure for the financial
year.
6. PENS ION SCHEMES AND OTHER POST-
RET IREMENT BENEF ITS
Retirement benefits for employees of the University are
provided by defined benefit schemes, which are funded by
contributions from the University and employees.
The two principal pension schemes for University staff are
the Universities Superannuation Scheme (USS) and the
University of Exeter Retirement Benefits Scheme (ERBS).
The schemes are defined benefit schemes, which are
externally funded and contracted out of the State Second
Pension.
Both funds are valued every three years by professionally
qualified independent actuaries. Pension costs are assessed in
accordance with the advice of the actuaries, based on the
latest actuarial valuations of the schemes.
The assets of the USS scheme are held in a separate trustee-
administered fund. Because of the mutual nature of the
scheme, the University is unable to separately identify its
share of the underlying assets and liabilities of the scheme on
a consistent and reasonable basis and therefore, as required
by FRS 17 ‘Retirement benefits’, accounts for the scheme as if
it were a defined contribution scheme.
As a result, the amount charged to the income and
expenditure account represents the contributions payable to
the scheme in respect of the accounting period.
Following FRS 17 the ERBS current service cost of providing
retirement benefits to employees during the year is charged
to the operating surplus or deficit in the year. The full cost of
providing amendments to benefits in respect of past service is
also charged to the operating surplus or deficit in the year.
The expected return on the assets during the year based on
the market value of scheme assets at the start of the financial
year is included within other finance (charges)/income. This
also includes a charge representing the expected increase in
the liabilities of the scheme during the year, arising from the
liabilities of the scheme being one year closer to payment.
Differences between actual and expected returns on assets
during the year are recognised in the statement of recognised
gains and losses in the year, together with differences from
changes in assumptions. The net deficit on the ERBS is
reported on the balance sheet within the pension liability.
Further information on both the USS and ERBS pension
schemes and post-retirement benefits is disclosed in note 30.
7. RESEARCH AND DEVELOPMENT
EXPENDITURE
Expenditure on research and development is written off to
the income and expenditure account in the year in which it is
incurred.
8. REPA IRS AND MA INTENANCE
The University has a five-year rolling long-term maintenance
plan, which forms the basis of the on-going maintenance of
the estate. Expenditure on long-term maintenance which
does not either enhance an asset beyond its original condition
or increase its expected economic life; and expenditure on all
routine corrective maintenance, is charged to the income and
expenditure account as incurred.
26 U N I V E R S I T Y O F E X E T E R : F I N A N C I A L S TAT E M E N T S F O R T H E Y E A R E N D E D 3 1 J U L Y 2 0 1 1
Leasehold buildings are depreciated over their expected
useful lives, subject to a maximum of 50 years, on a straight-
line basis.
Improvements, adaptations and remodelling of buildings are
capitalised at cost and are depreciated over their expected
useful life, subject to a maximum of 50 years, on a straight-
line basis.
Where expenditure incurred on the development of new
premises includes the cost of equipping the premises with
furniture and equipment, etc., irrespective of the cost of
individual items, this expenditure is capitalised together with
the construction cost.
Finance costs directly attributable to the construction of land
and buildings are capitalised as part of the cost of those
assets.
Where buildings are acquired or improved with the aid of
specific grants, they are capitalised and depreciated in
accordance with the policy above. The related grants are
treated as deferred capital grants and released to the income
and expenditure account over the expected useful life of the
buildings.
All buildings are regularly reviewed for indications of
impairment. Where there is impairment caused by a clear
consumption of economic benefit the difference between the
assessed recoverable value of the building and its written
down value is charged to the income and expenditure
account. Other impairment losses on revalued fixed assets
are recognised in the statement of total recognised gains and
losses and set against any revaluation surplus until the carrying
amount of the fixed asset reaches depreciated historical cost
and thereafter in the income and expenditure account.
11. MA JOR REFURB ISHMENTS
Major replacement and refurbishment work is capitalised if
the work creates or enhances an existing asset, or improves
or substantially overhauls an asset. The costs are depreciated
over the appropriate period as described elsewhere within
the statement of principal accounting policies.
9. TAXAT ION
The University is considered to pass the tests set out in
Paragraph 1 Schedule 6 Finance Act 2010 and therefore it
meets the definition of a charitable company for UK
corporation tax purposes. Accordingly, the University is
potentially exempt from taxation in respect of income or
capital gains received within categories covered by Chapter 3
Part 11 Corporation Tax Act 2010 or Section 256 of the
Taxation of Chargeable Gains Act 1992, to the extent that
such income or gains are applied exclusively to charitable
purposes.
The University is partially exempt in respect of Value Added
Tax, so that it can only recover a minor element of VAT
charged on the majority of its inputs. Irrecoverable VAT on
inputs is included in the costs of such inputs and added to the
cost of tangible fixed assets as appropriate, where the inputs
themselves are tangible fixed assets by nature.
The University’s subsidiary companies are subject to
Corporation Tax and VAT in the same way as any other
commercial organisation.
10. LAND AND BU ILD INGS
Land and buildings are stated at valuation or, in the case of
buildings in the course of construction or constructed since
the last valuation, at cost. The basis of valuation is existing use
value for non-specialised buildings, depreciated replacement
cost for specialised buildings or, if appropriate and in certain
circumstances, open market value.
The University has adopted a policy to fully revalue land and
buildings every five years with an interim valuation in the third
year.
Freehold land is not depreciated as it is considered to have an
indefinite useful life.
Freehold buildings are depreciated over their expected
remaining useful lives, subject to a maximum of 50 years, on
a straight-line basis. Buildings in the course of construction are
not depreciated.
UN I V ER S I TY OF EXETERSTATEMENT OF P R INC I PA L ACCOUNT ING POL IC I E S

27
12. EQUIPMENT
Equipment, including computers and software, that
individually has a cost equal to or greater than £25,000
is capitalised.
Equipment, including computers and software, that
collectively have a cost equal to or greater than £25,000
where the assets are functionally interdependent or are
purchased together and intended to be used for a common
purpose and are under common management control are
capitalised.
Capitalised equipment is stated at cost and depreciated over
its expected useful life, as follows:
Computer equipment 4 to 8 years
and IT infrastructure
Equipment acquired for project life remaining
specific research projects (generally 3 years)
Other equipment 8 years
Where equipment is acquired with the aid of specific grants it
is capitalised and depreciated in accordance with the above
policy, with the related grant being credited to a deferred
capital grant account and released to the income and
expenditure account over the expected useful economic life
of the related equipment (the period of the grant in respect
of specific research projects).
13. LEASED ASSETS
Where assets are financed by leasing arrangements that give
rights approximating to ownership (finance leases), the assets
are treated as if they had been purchased outright and the
corresponding liability to the leasing company is included as
an obligation under finance leases. Depreciation on leased
assets is charged to the income and expenditure on the
same basis as above. Leasing payments are treated as
consisting of capital and interest elements and the interest is
charged to the income and expenditure account over the
period of the lease.
All other leases are operating leases and the annual rentals
payable are charged to the Income and Expenditure
Account.
14. HER ITAGE ASSETS
The group holds at the Bill Douglas Centre for the History of
Cinema and Popular Culture one of the largest public
collections of books, prints, artefacts and ephemera relating
to the history and pre-history of cinema. This centre contains
both a public museum and an academic research centre.
The collection contains many irreplaceable originals to which
no reliable cost or value can be attributed. As a result, no
value is reported for these assets in the group’s Balance
Sheet. Any costs of maintaining and displaying the collection
are reported in the Income and Expenditure Account in the
year that it is incurred.
15. CHAR ITABLE DONAT IONS
Unrestricted donations
Charitable donations are recognised in the accounts when
the charitable donation has been received or if, before
receipt, there is sufficient evidence to provide the necessary
certainty that the donation will be received and the value of
the incoming resources can be measured with sufficient
reliability.
Endowment funds
Where charitable donations are to be retained for the benefit
of the University as specified by the donors, these are
accounted for as endowments. There are three main types:
1. Unrestricted permanent endowments – the donor has
specified that the fund is to be permanently invested to
generate an income stream for the general benefit of the
University.
2. Restricted permanent endowments – the donor has
specified that the fund is to be permanently invested to
generate an income stream to be applied to a particular
objective.
3. Restricted expendable endowments – the donor has
specified a particular objective other than the purchase or
construction of tangible fixed assets, and the University
can convert the donated sum into income.
Donations for fixed assets
Donations received to be applied to the cost of a tangible
fixed asset are shown on the balance sheet as a deferred
capital grant. The deferred capital grant is released to the
income and expenditure account over the same estimated
useful life that is used to determine the depreciation charge
associated with the tangible fixed asset.
UN I V ER S I TY OF EXETERSTATEMENT OF P R INC I PA L ACCOUNT ING POL IC I E S
FINANCIAL STATEMENTS

28 U N I V E R S I T Y O F E X E T E R : F I N A N C I A L S TAT E M E N T S F O R T H E Y E A R E N D E D 3 1 J U L Y 2 0 1 1
Gifts in kind, including donated tangible fixed assets
Gifts in kind are included in ‘other income’ or ‘deferred
capital grants’ as appropriate using a reasonable estimate of
their gross value or the amount actually realised.
16. INVESTMENTS
Fixed asset investments are included in the balance sheet at
market value. Increases/decreases in value arising on the
revaluation of fixed asset investments are carried to the
revaluation reserve. Where permanent diminution in value of
an asset occurs, the excess will be charged to the income
and expenditure account to the extent it is not covered by a
revaluation surplus.
Endowment asset investments are carried at market value.
Such investments held at the previous year-end, and carried
at market value at that date, may be sold during the year.
This crystallises the value and any difference between the
opening market value and the sale proceeds represents a
revaluation movement. There is no differentiation in the
treatment of valuation adjustments for restricted permanent
endowments that have been disposed during the year, or
valuation adjustments that relate to endowments that
continue to be held at year end.
Current asset investments are included at the lower of cost
and net realisable value.
17. STOCK
Stock is shown at the lower of cost and net realisable value
for building maintenance, bars, residences and catering
stores, and the University Shop. Where necessary, provision
is made for obsolete, slow-moving and defective stocks.
Stocks of consumables held for administration purposes and
in Colleges are not valued.
18.CASH FLOWS AND L IQUID RESOURCES
Cash flows comprise increases and decreases in cash. Cash
includes cash in hand, deposits repayable on demand and
overdrafts. Deposits are repayable on demand if they are in
practice available within 24 hours without penalty.
UN I V ER S I TY OF EXETERSTATEMENT OF P R INC I PA L ACCOUNT ING POL IC I E S
Liquid resources comprise assets held as a readily disposable
store of value. They include term deposits, government
securities and certificates of deposit held as part of the
University’s treasury management activities. They exclude
any such assets held as endowment asset investments.
19. PROV IS IONS , CONTINGENT L IAB I L IT I ES
AND CONTINGENT ASSETS
Provisions are recognised in the financial statements when
the University has a present obligation (legal or constructive)
as a result of a past event, it is probable that a transfer of
economic benefits will be required to settle the obligation
and a reliable estimate can be made of the amount of the
obligation.
Contingent liabilities are disclosed by way of a note, when
the definition of a provision is not met and includes three
scenarios: possible rather than a present obligation; a possible
rather than a probable outflow of economic benefits; an
inability to measure the economic outflow.
Contingent assets are disclosed by way of a note, where
there is a possible, rather than present, asset arising from
a past event.

2929

30 U N I V E R S I T Y O F E X E T E R : F I N A N C I A L S TAT E M E N T S F O R T H E Y E A R E N D E D 3 1 J U L Y 2 0 1 1
UN I V ER S I TY OF EXETERCONSOL IDATED INCOME AND EXPEND ITURE ACCOUNT for the year ended 31 July 2011
Year Ended Year Ended
31 July 2011 31 July 2010
Note £’000 £’000
INCOME
Funding body grants 1 74,815 71,631
Tuition fees and education contracts 2 81,261 74,181
Research grants and contracts 3 46,327 37,728
Other income (incl. share of joint ventures) 4 54,784 53,822
Endowment and investment income 5 1,939 1,572
Total income 259,126 238,934
Less: Share of income from joint ventures 14 (12,956) (11,720)
Net Income 246,170 227,214
EXPENDITURE
Staff costs 6 127,957 118,988
Other operating expenses 7 84,739 82,828
Depreciation 8 15,803 13,106
Impairment of buildings 12 3,121 2,559
18,924 15,665
Interest payable 9 4,883 5,522
Total expenditure 236,503 223,003
Operating surplus 9,667 4,211
Share of operating surplus in joint ventures 14 869 801
Total operating surplus 10,536 5,012

31
UN IV ER S I TY OF EXETERCONSOL IDATED INCOME AND EXPEND ITURE ACCOUNT
for the year ended 31 July 2011
Year Ended Year Ended
31 July 2011 31 July 2010
Note £’000 £’000
Total operating surplus 10,536 5,012
Exceptional items: continuing operations
Surplus on disposal of land and buildings 10 – 812
Surplus on continuing operations 10,536 5,824
Surplus for the year transferred from accumulated
income in endowment funds 15/21 640 301
Surplus for the year 11 11,176 6,125
The income and expenditure account in both years is in respect of continuing activities.
Year Ended Year Ended
31 July 2011 31 July 2010
£’000 £’000
NOTE OF HISTORICAL COST RESULTS
Surplus for the year 11,176 6,125
Difference between historical cost depreciation and the actual
charge for the year calculated on the re-valued amount 22 3,380 3,396
Release of previous years property revaluation
surpluses on current year disposals and impairments – 10,121
Historical cost surplus for the year 14,556 19,642
FINANCIAL STATEMENTS

UN IV ER S I TY OF EXETERSTATEMENT OF CONSOL IDATED TOTAL RECOGNISED GA INS AND LOSSESfor the year ended 31 July 2011
32 U N I V E R S I T Y O F E X E T E R : F I N A N C I A L S TAT E M E N T S F O R T H E Y E A R E N D E D 3 1 J U L Y 2 0 1 1
Year Ended Year Ended
31 July 2011 31 July 2010
Note £’000 £’000
Surplus on continuing operations 10,536 5,824
Revaluation gain on tangible assets 22 51,456 –
Revaluation loss on impairment of tangible assets – (1,349)
Revaluation gain on fixed asset investments 22 1,094 654
Appreciation of endowment asset investments 15/21 2,160 2,570
New endowments 15/21 1,290 703
Actuarial (loss)/gain on pension scheme 30 (1,024) 7,153
Actuarial gain/(loss) on pension scheme in joint venture 127 (16)
Total recognised gains in the year 65,639 15,539
Reconciliation
Opening reserves and endowments 290,800 275,261
Total recognised gains for the year 65,639 15,539
Closing reserves and endowments 356,439 290,800
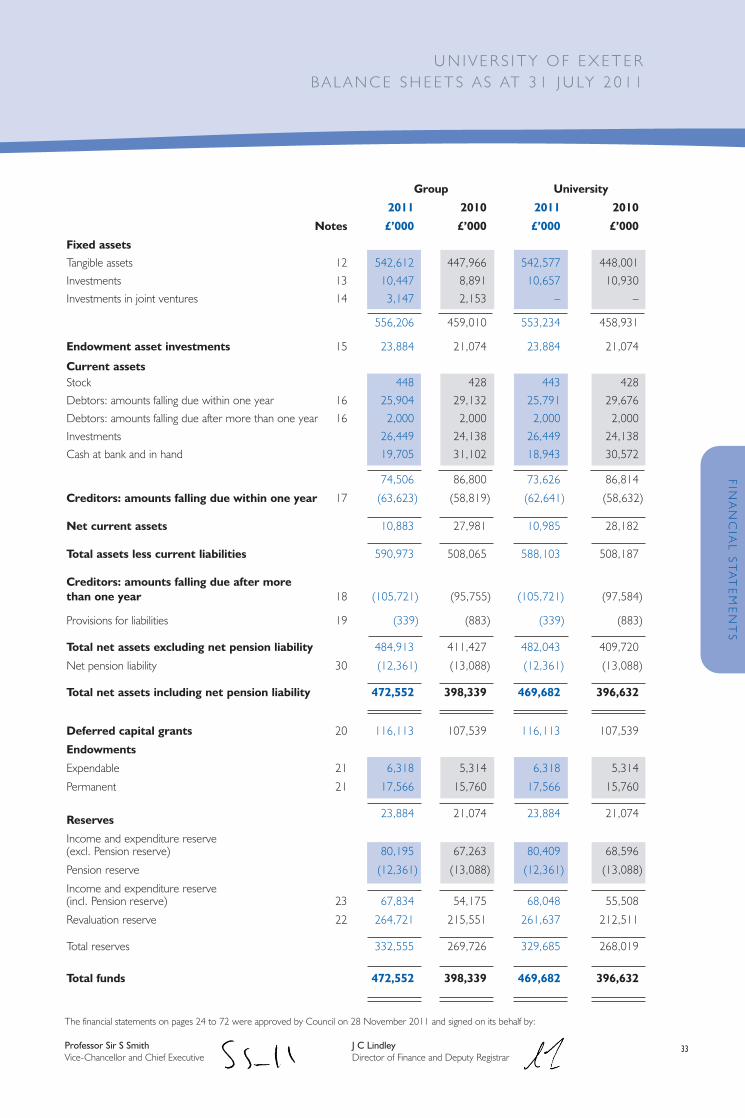
Group University
2011 2010 2011 2010
Notes £’000 £’000 £’000 £’000
Fixed assets
Tangible assets 12 542,612 447,966 542,577 448,001
Investments 13 10,447 8,891 10,657 10,930
Investments in joint ventures 14 3,147 2,153 – –
556,206 459,010 553,234 458,931
Endowment asset investments 15 23,884 21,074 23,884 21,074
Current assetsStock 448 428 443 428
Debtors: amounts falling due within one year 16 25,904 29,132 25,791 29,676
Debtors: amounts falling due after more than one year 16 2,000 2,000 2,000 2,000
Investments 26,449 24,138 26,449 24,138
Cash at bank and in hand 19,705 31,102 18,943 30,572
74,506 86,800 73,626 86,814
Creditors: amounts falling due within one year 17 (63,623) (58,819) (62,641) (58,632)
Net current assets 10,883 27,981 10,985 28,182
Total assets less current liabilities 590,973 508,065 588,103 508,187
Creditors: amounts falling due after more than one year 18 (105,721) (95,755) (105,721) (97,584)
Provisions for liabilities 19 (339) (883) (339) (883)
Total net assets excluding net pension liability 484,913 411,427 482,043 409,720
Net pension liability 30 (12,361) (13,088) (12,361) (13,088)
Total net assets including net pension liability 472,552 398,339 469,682 396,632
Deferred capital grants 20 116,113 107,539 116,113 107,539
Endowments
Expendable 21 6,318 5,314 6,318 5,314
Permanent 21 17,566 15,760 17,566 15,760
23,884 21,074 23,884 21,074Reserves
Income and expenditure reserve(excl. Pension reserve) 80,195 67,263 80,409 68,596
Pension reserve (12,361) (13,088) (12,361) (13,088)
Income and expenditure reserve (incl. Pension reserve) 23 67,834 54,175 68,048 55,508
Revaluation reserve 22 264,721 215,551 261,637 212,511
Total reserves 332,555 269,726 329,685 268,019
Total funds 472,552 398,339 469,682 396,632
UN IV ER S I TY OF EXETERSTATEMENT OF CONSOL IDATED TOTAL RECOGNISED GA INS AND LOSSESfor the year ended 31 July 2011
32 U N I V E R S I T Y O F E X E T E R : F I N A N C I A L S TAT E M E N T S F O R T H E Y E A R E N D E D 3 1 J U L Y 2 0 1 1
The financial statements on pages 24 to 72 were approved by Council on 28 November 2011 and signed on its behalf by:
Professor Sir S Smith J C LindleyVice-Chancellor and Chief Executive Director of Finance and Deputy Registrar
UN I V ER S I TY OF EXETERBALANCE SHEET S A S AT 3 1 JU LY 2 0 1 1
Year Ended Year Ended
31 July 2011 31 July 2010
Note £’000 £’000
Surplus on continuing operations 10,536 5,824
Revaluation gain on tangible assets 22 51,456 –
Revaluation loss on impairment of tangible assets – (1,349)
Revaluation gain on fixed asset investments 22 1,094 654
Appreciation of endowment asset investments 15/21 2,160 2,570
New endowments 15/21 1,290 703
Actuarial (loss)/gain on pension scheme 30 (1,024) 7,153
Actuarial gain/(loss) on pension scheme in joint venture 127 (16)
Total recognised gains in the year 65,639 15,539
Reconciliation
Opening reserves and endowments 290,800 275,261
Total recognised gains for the year 65,639 15,539
Closing reserves and endowments 356,439 290,800
FINANCIAL STATEMENTS
33

34 U N I V E R S I T Y O F E X E T E R : F I N A N C I A L S TAT E M E N T S F O R T H E Y E A R E N D E D 3 1 J U L Y 2 0 1 1
UN I V ER S I TY OF EXETERCONSOL IDATED CASH F LOW STATEMENTfor the year ended 31 July 2011
Year Ended Year Ended
31 July 2011 31 July 2010
Note £’000 £’000
Cash inflow from operating activities 24 29,714 14,598
Returns on investments and servicing of finance 25 (4,148) (4,241)
Capital expenditure and financial investment 26 (44,379) (8,845)
Management of liquid resources 27 (2,311) 6,635
Financing 28 9,992 (454)
(Decrease)/increase in cash in the year 29 (11,132) 7,693
Reconciliation of net cash flow to movement in net debt
2011 2010
£’000 £’000
(Decrease)/increase in cash in the year 29 (11,132) 7,693
Cash (inflow) from new secured loans 28 (10,000) –
Cash outflow from repayment of loans 28 8 454
Cash outflow/(inflow) from liquid resources 27 2,311 (6,635)
Movement in net debt in the year (18,813) 1,512
Net debt at 1 August (37,751) (39,263)
Net debt at 31 July 29 (56,564) (37,751)

35
NOTE 1 – FUNDING BODY GRANTSYear Ended 31 July 2011 Year Ended
31 July 2010HEFCE TDA TOTAL TOTAL£’000 £’000 £’000 £’000
Recurrent teaching grant 46,007 3,126 49,133 46,542
Recurrent research grant 18,591 – 18,591 18,220
Specific grants 3,831 360 4,191 3,925
Deferred capital grants released in year (note 20) 2,900 – 2,900 2,944
71,329 3,486 74,815 71,631
NOTE 2 – TUITION FEES AND EDUCATION CONTRACTSYear Ended Year Ended31 July 2011 31 July 2010
£’000 £’000
Home/EU undergraduates: full-time 35,641 33,320
Home/EU undergraduates: part-time 36 71
Home/EU postgraduates: full-time 9,848 9,093
Home/EU postgraduates: part-time 2,566 1,974
International students 30,564 27,726
Non-credit bearing courses and other tuition fees 2,360 1,781
Research Training Support Grants 246 216
81,261 74,181
NOTE 3 – RESEARCH GRANTS AND CONTRACTSYear Ended Year Ended31 July 2011 31 July 2010
£’000 £’000
Research councils 16,968 14,583
UK based charities 5,258 4,375
UK central government, local authorities, health and hospital authorities 12,913 10,599
UK industry, commerce and public corporations 3,721 3,247
European Union governments 4,892 3,064
European Union industry and other bodies 480 232
Other grants and contracts 2,095 1,628
46,327 37,728
Included above are deferred capital grants released in the year of £1,742,000 (2010: £982,000) (see note 20).
NOTES TO THE ACCOUNTS
NOTES TO
ACCOUNTS
FINANCIAL STATEMENTS

36 U N I V E R S I T Y O F E X E T E R : F I N A N C I A L S TAT E M E N T S F O R T H E Y E A R E N D E D 3 1 J U L Y 2 0 1 1
NOTE 4 – OTHER INCOMEYear Ended Year Ended31 July 2011 31 July 2010
£’000 £’000
Residences, catering and conferences 21,790 21,809
Other services rendered:
Validation fees 66 178
UK central government, local authorities, health and hospital authorities 448 1,177
Others 1,085 920
Income from health and hospital authorities 2,075 3,764
Other operating income:
Other external grants 2,234 3,525
Summer schools, fair and degree day income 458 375
Donations and other fundraising 2,305 1,966
Erasmus 883 706
Sports and swimming pools 1,306 1,057
Externally recharged staff time 133 148
Supplies and services to external customers 3,189 1,307
Rental income and room hire 1,047 1,211
Tremough Campus Services 6,255 5,376
INTO University of Exeter LLP 6,701 6,344
Release of deferred capital grants (note 20) 1,583 1,333
Other income 3,226 2,626
54,784 53,822
NOTE 5 – ENDOWMENT AND INVESTMENT INCOMEYear Ended Year Ended31 July 2011 31 July 2010
£’000 £’000Income from expendable endowments (note 21) 347 335
Income from permanent endowments (note 21) 557 492
Income from short term investments 334 463
Income from fixed asset investments 213 121
Surplus on disposal of fixed asset investments 80 101
Net credit on pension scheme funds (note 30) 341 –
Other interest receivable 67 60
1,939 1,572
The interest receivable from group undertakings, that are not subsidiaries, in the current year amounted to £900 (2010: £4,000).
NOTES TO THE ACCOUNTS

37
NOTE 6 – STAFF COSTS
The average number of persons (including senior post-holders) employed by the University during the year, expressed as
full-time equivalents, was:Year Ended Year Ended31 July 2011 31 July 2010Number Number
Academic staff 656 636Research staff 367 306Teaching fellows 149 108
Occasional lecturers 62 69
Support staff 1,713 1,677
Casuals 144 142
Total 3,091 2,938
Staff costs for the above persons:Year Ended Year Ended31 July 2011 31 July 2010
£’000 £’000Salaries and wages 106,921 98,865
Social security costs 7,642 7,126
Pension costs (note 30) 13,394 12,997
127,957 118,988
Year Ended Year Ended31 July 2011 31 July 2010
£’000 £’000Emoluments of the Vice-Chancellor and Chief Executive:
Non-performance related remuneration (including benefits in kind) 265 265
Performance related remuneration 53 27
Pension contributions to USS 51 49
369 341
Emoluments for senior staff are determined by the Remuneration Committee as set out in the Corporate Governance andInternal Control Statement on page 13.
None of the lay members receives payment, apart from the reimbursement of expenses, for the work that the memberdoes for the University. The reimbursement of expenses amounted to £9,000 (2010: £6,000).
NOTES TO THE ACCOUNTS
NOTES TO
ACCOUNTS
FINANCIAL STATEMENTS

38 U N I V E R S I T Y O F E X E T E R : F I N A N C I A L S TAT E M E N T S F O R T H E Y E A R E N D E D 3 1 J U L Y 2 0 1 1
NOTE 6 – STAFF COSTS continued
Remuneration of higher paid staff, excluding employer’s pension contributions but inclusive of payments made on behalf of
the NHS and partner institutions in respect of its contractual obligations to University staff under separate NHS contracts of
employment and which are excluded in the University’s income and expenditure account:
Year Ended Year Ended31 July 2011 31 July 2010
£100,000 – £109,999 17 11
£110,000 – £119,999 2 7
£120,000 – £129,999 3 4
£130,000 – £139,999 4 2
£140,000 – £149,999 1 2
£150,000 – £159,999 3 2
£160,000 – £169,999 3 1
£180,000 – £189,999 1 1
£200,000 – £209,999 1 1
£220,000 – £229,999 1 –
£230,000 – £239,999 – 1
£290,000 – £299,999 – 1
£310,000 – £319,999 1 –
Included in the above are members of staff whose annual salary falls into one of the above bands but who joined the
University part way through the year.
NOTES TO THE ACCOUNTS

39
NOTE 7 – OTHER OPERATING EXPENSES
Year Ended Year Ended31 July 2011 31 July 2010
£’000 £’000
Residences, catering and conferences 11,650 12,202
Rents and rates 1,024 926
Heat, light, water and power 2,529 2,430
Repairs and general maintenance 5,798 6,983
Laboratory equipment and consumables 4,911 4,379
IT hardware, software and licences 1,720 1,533
Other equipment 6,546 5,786
Books and periodicals 2,943 2,813
Non-contract staff and external examiners 5,282 4,526
Administrative costs including postage and telephones 3,025 3,315
Insurances 619 592
Publicity, publications and student recruitment 2,611 2,433
Travel, accommodation, subsistence and hospitality 8,018 6,792
Fellowships, scholarships and prizes 14,847 14,327
Field courses and other student support 4,969 4,453
Legal, professional and consultancy fees 3,817 3,267
Auditor’s remuneration 67 64
Auditor’s remuneration in respect of non–audit services 21 122
Cornwall Combined Services 2,901 2,856
Other expenses 1,441 3,029
84,739 82,828
Included within Legal, professional and consultancy fees is the internal audit fee for the University of £82,000 (2010: £98,000).
Included within Auditor’s remuneration is the external audit fee for the University of £55,000 (2010: £52,000).
NOTES TO THE ACCOUNTS
NOTES TO
ACCOUNTS
FINANCIAL STATEMENTS

NOTE 8 – ANALYSIS OF EXPENDITURE BY ACTIVITY
2010/11 OtherStaff Operating Depreciation/ Interest TotalCosts Expenses Impairment Payable£’000 £’000 £’000 £’000 £’000
Academic colleges 61,388 15,217 1,341 – 77,946
Academic services 12,043 7,958 2,189 – 22,190
Administration and central services 18,264 25,397 204 – 43,865
Premises 5,914 10,993 10,098 1,986 28,991
Residences, catering and conferences 5,787 11,650 3,138 2,897 23,472
Research grants and contracts 25,971 13,524 1,954 – 41,449
Other expenses – FRS17 adjustment (1,410) – – – (1,410)
127,957 84,739 18,924 4,883 236,503
The depreciation charge has been funded by:
Deferred capital grants released – buildings (note 20) 3,020
Deferred capital grants released – equipment (note 20) 3,205
Revaluation reserve released (note 22) 3,380
General income 6,198
15,803
The impairment charge has been funded by:
General income 3,121
18,924
40 U N I V E R S I T Y O F E X E T E R : F I N A N C I A L S TAT E M E N T S F O R T H E Y E A R E N D E D 3 1 J U L Y 2 0 1 1
NOTES TO THE ACCOUNTS

41
NOTE 8 – ANALYSIS OF EXPENDITURE BY ACTIVITY
2009/10 OtherStaff Operating Depreciation/ Interest TotalCosts Expenses Impairment Payable£’000 £’000 £’000 £’000 £’000
Academic colleges 57,634 15,399 1,311 – 74,344
Academic services 11,143 7,640 1,815 – 20,598
Administration and central services 18,054 24,169 132 – 42,355
Premises 6,312 13,726 9,293 1,921 31,252
Residences, catering and conferences 6,083 9,859 2,132 2,888 20,962
Research grants and contracts 20,458 12,035 982 – 33,475
Other expenses – FRS 17 adjustments (696) – – 713 17
118,988 82,828 15,665 5,522 223,003
The depreciation charge has been funded by:
Deferred capital grants released – buildings 2,814
Deferred capital grants released – equipment 2,445
Revaluation reserve released 3,396
General income 4,451
13,106
The impairment charge has been funded by:General income 2,559
15,665
NOTE 9 – INTEREST PAYABLE
Year Ended Year Ended31 July 2011 31 July 2010
£’000 £’000
On bank loans and overdrafts:
Repayable wholly or partly in more than five years 4,883 4,840
Net charge on pension scheme funds (note 30) – 682
4,883 5,522
NOTES TO THE ACCOUNTS
NOTES TO
ACCOUNTS
FINANCIAL STATEMENTS

NOTE 10 – EXCEPTIONAL ITEMS
Year Ended Year Ended31 July 2011 31 July 2010
£’000 £’000
Surplus on disposal of land and buildings – 812
– 812
On 23 September 2009 the University, with University Partnerships Programme (UPP), Barclays and Royal Bank of Scotland
concluded phase 1 of a £133 million transaction; phase 2 concluded on 11 November 2009. This transaction involved the
transfer of 980 University bed spaces to UPP and the obligation of UPP to construct a further 1,948 bed spaces over the next
three years. The student demand risk for this transfer is being taken by UPP. Following the close of the transaction the
University received proceeds of £13.8 million – which has been disclosed as a disposal of buildings. UPP has a 43 year lease
concession from the University for the residences and development sites. The proceeds from these sales were reinvested into
the University’s strategic aims.
There were no significant property disposals in the current year. In the prior year four outlying, off-campus residences were
sold. The proceeds from these sales were reinvested into the University’s strategic aims.
NOTE 11 – SURPLUS ON CONTINUING OPERATIONS FOR THE YEAR
The surplus on continuing operations for the year is made up as follows:
Year Ended Year Ended31 July 2011 31 July 2010
£’000 £’000
University’s surplus for the year on continuing operations 9,606 4,764
Surplus/(deficit) generated by subsidiary undertakings and
joint ventures 930 1,060
Consolidated surplus on continuing operations 10,536 5,824
Surplus for the year transferred from accumulated income in endowment funds 640 301
Consolidated surplus for the year 11,176 6,125
42 U N I V E R S I T Y O F E X E T E R : F I N A N C I A L S TAT E M E N T S F O R T H E Y E A R E N D E D 3 1 J U L Y 2 0 1 1
NOTES TO THE ACCOUNTS

NOTE 12 – TANGIBLE FIXED ASSETS
Group Land and Buildings Equipment TotalFreehold Long
Leasehold£’000 £’000 £’000 £’000
Cost or Valuation
At 1 August 2010 410,052 36,661 34,542 481,255
Additions 54,099 – 8,013 62,112
Disposals – – (253) (253)
Surplus on revaluation 34,174 693 – 34,867
At 31 July 2011 498,325 37,354 42,302 577,981
Depreciation
At 1 August 2010 11,571 3,909 17,809 33,289
Charge for the year (note 8) 8,590 1,475 5,738 15,803
Impairment – historic cost (note 8) 3,121 – – 3,121
Disposals – – (256) (256)
Eliminated on revaluation (11,783) (4,805) – (16,588)
At 31 July 2011 11,499 579 23,291 35,369
Net Book Value
At 31 July 2011 486,826 36,775 19,011 542,612
At 31 July 2010 398,481 32,752 16,733 447,966
Financed by capital grant 79,210 28,158 8,745 116,113
Other 407,616 8,617 10,266 426,499
At 31 July 2011 486,826 36,775 19,011 542,612
a) The total cost of land and buildings is mainly attributable to the development or purchase of property for teaching, research or
accommodation purposes.
b) Freehold and leasehold land and buildings with a value of £63.1 million (2010: £66.4 million) have been financed, in whole or in part, by
Exchequer funds. If the University fails one of two ‘trigger events’ noted in the Financial Memorandum with HEFCE, then the full amount of
the Exchequer interest would become repayable.
c) At 31 July 2011 freehold and leasehold land and buildings included £49.4 million (2010: £45 million) in respect of buildings under
construction.
d) Included in the cost of freehold land and buildings is £1.1 million (2010: £1.1 million) bank loan interest payable that has been capitalised.
This has been calculated at the loan interest rate of 5.88%. These finance costs are directly attributable to the construction of student
residences and were capitalised as part of the cost of those assets whilst they were in the course of construction. There has been no
capitalisation of interest payable in the current or prior year.
43
NOTES TO THE ACCOUNTS
NOTES TO
ACCOUNTS
FINANCIAL STATEMENTS

44 U N I V E R S I T Y O F E X E T E R : F I N A N C I A L S TAT E M E N T S F O R T H E Y E A R E N D E D 3 1 J U L Y 2 0 1 1
NOTE 12 – TANGIBLE FIXED ASSETS continued
e) Long leasehold land and buildings comprise the University owned buildings on the Tremough Campus, which were acquired under a
125 year lease (117 years remaining).
f) During the current and previous years there has been on-going refurbishment to the Geoffrey Pope building. Following consultation with
the contractors and valuers it was decided to impair this building to reflect the existing use value to the University. The valuation was
undertaken by Jones Lang Lasalle as part of their valuation of the University’s land and buildings as discussed below.
University Land and Buildings Equipment TotalFreehold Long
Leasehold£’000 £’000 £’000 £’000
Cost or Valuation
At 1 August 2010 410,157 36,661 34,331 481,149
Additions 54,099 – 7,992 62,091
Disposals – – (253) (253)
Surplus on revaluation 34,069 693 – 34,76
At 31 July 2011 498,325 37,354 42,070 577,749
Depreciation
At 1 August 2010 11,571 3,909 17,668 33,148
Charge for the year 8,590 1,475 5,682 15,747
Impairment – historic cost 3,121 – – 3,121
Disposals – – (256) (256)
Eliminated on revaluation (11,783) (4,805) – (16,588)
At 31 July 2011 11,499 579 23,094 35,172
Net Book Value
At 31 July 2011 486,826 36,775 18,976 542,557
At 31 July 2010 398,586 32,752 16,663 448,001
NOTES TO THE ACCOUNTS

45
NOTE 12 – TANGIBLE FIXED ASSETS continued
As stated in the Statement of Principal Accounting Policies the University adopts the policy of revaluing land and buildings.
The external Chartered Surveyors, Messrs. James Lang Lasalle (formerly King Sturge), performed a full valuation as at 31 July
2011 (the previous interim valuation was at 31 July 2009) on the basis of Existing Use Value or Depreciated Replacement
Cost according to the nature and use of each building. This valuation has been prepared in accordance with the Valuation
Standards published by the Royal Institution of Chartered Surveyors.
The valuations at this date were as follows:
Group and University
£’000
Freehold land and buildings 445,221
Long leasehold land and buildings 36,775
The valuations include a notional amount for professional fees and other incidental expenses.
If this revaluation had not taken place the historical cost net book values are as follows:
Group University
£’000 £’000
Freehold land and buildings 243,090 243,195
Long leasehold land and buildings 28,359 28,359
NOTES TO THE ACCOUNTS
NOTES TO
ACCOUNTS
FINANCIAL STATEMENTS

46 U N I V E R S I T Y O F E X E T E R : F I N A N C I A L S TAT E M E N T S F O R T H E Y E A R E N D E D 3 1 J U L Y 2 0 1 1
NOTE 13 – INVESTMENT
Group University2011 2010 2011 2010£’000 £’000 £’000 £’000
Fine art collection 1,811 1,511 1,811 1,511
Library special collection 2,728 2,354 2,728 2,354
Listed investments 5,831 4,949 5,831 4,949
Subsidiary undertakings – – 210 2,039
Other investments 77 77 77 77
10,447 8,891 10,657 10,930
The University’s fine art collection of paintings, drawings, sculptures, furniture, silverware and ceramics were professionally
valued during the year ended 31 July 2011 by external Fine Art Auctioneers and Valuers, Messrs. Bearnes Hampton and
Littlewood, on an open market value basis. The amount of the valuation, plus a piano valued separately at £75,000 (2010:
£75,000) is included above.
The University’s library special collections were also professionally valued during the year ended 31 July 2011 by external Fine
Art Auctioneers and Valuers, Messrs. Bearnes Hampton and Littlewood, on an open market value basis. The amount of the
valuation is detailed above.
Heritage Assets
The group holds at the Bill Douglas Centre for the History of Cinema and Popular Culture one of the largest public collections
of books, prints, artefacts and ephemera relating to the history and pre-history of cinema. The initial collection was donated to
the Exeter University Foundation in 1991 but since then other collections have also been donated. No value is reported in the
group’s balance sheet as no reliable cost or valuation can be attributed to this unique and irreplaceable collection. These assets
are managed by the curator and her staff to ensure their cataloguing, safe keeping and preservation and are insured against
accidental damage or loss at the University’s expense. The museum was opened to the public in 1997 and is open, free of
charge, each weekday.
The investment in subsidiary undertakings, as consolidated in these financial statements comprises the following:
Name Shareholding Principal business activityExeter Enterprises Limited 60,110 Ordinary £1 Consultancy activitiesExeter ISC Limited 100 Ordinary £1 and Holding company
149,900 Redeemable preference £1
The Exeter Northcott Limited by Guarantee Theatre company Theatre Company
The University wholly owns and controls the above holdings and all companies are registered in England and Wales.
The investment in subsidiary undertakings as at 31 July 2010 also included 2,000,002 ordinary £1 shares in Dartvale Limited,
a property development company. This company ceased to operate and was struck off during the year ended 31 July 2011.
NOTES TO THE ACCOUNTS

47
NOTE 13 – INVESTMENTS continued
Exeter Enterprises Limited wholly owns the following undertakings, both of which are registered in England and Wales:
Name Shareholding Principal business activity
UEC Enterprises Limited 1,000 Ordinary £1 Consultancy activities
Peninsula Innovations Limited 2 Ordinary £1 Property management services
ESI Enterprises Limited 1 Ordinary £1 Dormant
Other investments of the University comprise the following:
Name Holding
Adsfab Limited 1,000 Ordinary “C” £1 shares
Auxetix Limited 107,143 Ordinary £0.001 shares
Curzon 1011 Limited 1 Ordinary £1 shares
CVCP Properties Plc 37,355 Ordinary £1 shares
Exeter Nanobacteria Limited 400 Ordinary £0.10 shares
Exeter Science Park Limited 3,587 Ordinary £10 shares
Industrial Tomography Systems Plc 249,564 Ordinary £0.01 shares
Simpleware Limited 100 Ordinary £1 shares
Skipworth Engelhardt Asset
Management Strategists Limited 152 Ordinary “A” £1 and 405 Deferred £1 shares
Trireme Systems 287 Series B preferred stock $0.01
The Exeter University Foundation
The activities of The Exeter University Foundation (Foundation), a registered charity, are consolidated on the grounds that
the University has a controlling influence over its activities.
The majority of the activities of the Foundation, which was established as a development trust, have been transferred to the
University during the year ended 31 July 2009 as it was agreed that these activities could be streamlined and that many of
them are now being carried out directly by the Development and Alumni Relations Office (DARO) team within the
University. The Foundation continues to own the collections of The Bill Douglas Centre for the History of Cinema and
Popular Culture but no longer actively solicits donations. It will however, continue to accept donations from donors who
prefer to donate to the Foundation rather than the University.
The transfer has been approved by the Charity Commission.
DARO continues to work to generate philanthropic financial and non-financial support for the University.
NOTES TO THE ACCOUNTS
NOTES TO
ACCOUNTS
FINANCIAL STATEMENTS
48 U N I V E R S I T Y O F E X E T E R : F I N A N C I A L S TAT E M E N T S F O R T H E Y E A R E N D E D 3 1 J U L Y 2 0 1 1
NOTE 14 – INVESTMENT IN JOINT VENTURES
Peninsula College of Medicine and Dentistry
The Peninsula College of Medicine and Dentistry (PCMD) is not a legal entity in its own right – it is a joint arrangement
entered into by the University of Exeter and the University of Plymouth. A 50% share of the income, expenditure and
balance sheet items of the “Community Chest” of PCMD (excluding research) is included within the income and expenditure
account and balance sheet of each of the universities. The items comprising the externally funded research activity of PCMD
are included within the statements of the University employing each project’s Principal Investigator.
PCMD’s principal place of business is The John Bull Building, Tamar Science Park, Research Way, Plymouth.
See note 37 for a detailed analysis of PCMD, representing 100% of the Colleges activities, results, assets and liabilities.
Tremough Campus Services
The University holds a 50% share of Tremough Campus Services (TCS), a company limited by guarantee, having no share
capital and for which exempt charitable status has been obtained. TCS is a joint venture company owned equally by the
University and University College Falmouth.
TCS has been established to operate student and commercial services for the Combined Universities in Cornwall campus at
Tremough in Penryn under a combined services agreement and commenced trading in August 2004.
Tremough Development Vehicle Limited (TDV) is a wholly owned subsidiary of TCS. It has been established to provide the
construction of the main campus for the Combined Universities in Cornwall project based at Tremough in Penryn.
TCS and TDV have financial years that end on 31 July.
INTO University of Exeter LLP
The University holds a 100% share of Exeter ISC Limited. Exeter ISC Limited, in turn, holds a 50% share of INTO University
of Exeter LLP, a limited liability partnership. INTO University of Exeter LLP is a joint venture partnership with INTO University
Partnerships Limited and the remaining 50% share is owned by INTO Exeter Limited, a wholly owned subsidiary of INTO
University Partnerships Limited.
INTO University of Exeter LLP was formed in December 2006 and operates from the University of Exeter’s Streatham
Campus. Its principal activity is the provision of English language and pre university foundation, diploma and pre-masters’
courses. Its principal place of business is INTO Building, Stocker Road, Exeter EX4 4PY.
Exeter ISC Limited and INTO University of Exeter LLP have financial years that end on 31 July.
Both the TCS and INTO University of Exeter LLP arrangements are treated as joint ventures and are accounted for using the
gross equity method, such that 50% of each of the companies net equity (gross assets less gross liabilities) are included in the
consolidated balance sheet of the University and 50% of their net income is reported in the University’s consolidated income
and expenditure account. Both companies have entered into a gift aid arrangement to distribute surpluses arising on their
activities to the University and joint venture partners accordingly.
NOTES TO THE ACCOUNTS

49
NOTES TO THE ACCOUNTS
NOTES TO
ACCOUNTS
FINANCIAL STATEMENTS
NOTE 14 – INVESTMENT IN JOINT VENTURES continued
The University’s share in its joint ventures are as follows:2011 2010£’000 £’000
Share of income:
Tremough Campus Services 6,255 5,376
INTO University of Exeter LLP 6,701 6,344
12,956 11,720
Share of operating surplus:
Tremough Campus Services 190 146
INTO University of Exeter LLP 679 655
869 801
Share of gross assets:
Tremough Campus Services 30,178 30,516
INTO University of Exeter LLP 6,847 5,222
37,025 35,738
Share of gross liabilities:
Tremough Campus Services (28,289) (28,940)
INTO University of Exeter LLP (5,589) (4,645)
(33,878) (33,585)
Share of net assets:
Tremough Campus Services 1,889 1,576
INTO University of Exeter LLP 1,258 577
3,147 2,153
NOTE 15 – ENDOWMENT ASSET INVESTMENTS – Group and University
2011 2010
£’000 £’000
Balance at 1 August 21,074 18,102
New endowments invested 1,290 703
Increase in market value of investments 2,160 2,570
(Decrease) in cash balances held for endowment funds (640) (301)
Balance at 31 July 23,884 21,074
The investments comprise:
Fixed interest stocks 5,197 3,964
Equities 14,994 15,577
Property 459 521
Alternative investments 276 326
Bank balances 2,958 686
23,884 21,074

50 U N I V E R S I T Y O F E X E T E R : F I N A N C I A L S TAT E M E N T S F O R T H E Y E A R E N D E D 3 1 J U L Y 2 0 1 1
NOTE 16 – DEBTORSGroup University
2011 2010 2011 2010£’000 £’000 £’000 £’000
Amounts falling due within one year:
Debtors 7,634 6,670 7,351 6,916
Prepayments and accrued income 16,346 20,325 16,315 20,318
Amounts owed by group undertakings:
Subsidiary companies – – 201 305
Related parties 1,924 2,137 1,924 2,137
25,904 29,132 25,791 29,676
Amounts falling due after more than one year:
Debtors 2,000 2,000 2,000 2,000
27,904 31,132 27,791 31,676
Included within debtors falling due after more than one year is an amount of £2,000,000 (2010: £2,000,000) that relates to
deposits previously placed with Landsbanki Islands hf. This balance is net of the provision of £500,000 (2010: £500,000)
which is based on current professional advice. The deposits are expected to be repaid after more than one year.
On 18 April 2008 the University of Exeter on behalf of the Peninsula College of Medicine and Dentistry (PCMD), placed
£1 million with the Icelandic bank, Landsbanki Islands hf. The deposit was placed in line with the University of Exeter’s
investment policy and per the terms of the PCMD Memorandum of Agreement that ensured that no more than £3 million
was held in a single bank or £5 million in the case of UK clearing banks. At this date Landsbanki Islands hf had the appropriate
short term credit rating with Fitch (F1) and Moodys (P1). It was due to mature on 20 October 2008.
The University placed a further £2 million with Landsbanki Islands hf on 8 August 2008 (£1 million) and 25 September 2008
(£1 million) again in line with its investment policy at that time.
On 7 October 2008 Landsbanki Islands hf issued a statement that it had gone into receivership and, like all other Icelandic
banks taken into Icelandic Government control, all payments in and out of the bank were stopped. To date, there has been
no movement of funds and this will not happen until the administrators / receivers have completed their work and are in
position to fund payments or declare actual loss – although the results of recent court cases have been encouraging.
The most current professional advice indicates that amounts ranging up to 94% of such deposits could be recoverable by
preferred creditors. The University of Exeter and PCMD have continued to assume 80% of the sum will be recovered until
the final outcome and payment is more certain.
NOTES TO THE ACCOUNTS

51
NOTE 17 – CREDITORS: AMOUNTS FALLING DUE WITHIN ONE YEAR
Group University2011 2010 2011 2010£’000 £’000 £’000 £’000
Bank loans and overdrafts (note 18) – 265 – 265
Research grants received on account 17,855 15,152 17,855 15,152
Trade creditors 12,151 11,441 11,682 11,300
Other creditors 14,438 11,681 14,444 11,698
Social security and other taxation payable 3,165 2,867 3,163 2,867
Accruals and deferred income 13,875 16,408 13,358 16,345
Amounts owed to group undertakings:
Related parties 2,139 1,005 2,139 1,005
63,623 58,819 62,641 58,632
Other creditors include an amount of £nil (2010: £276,000) due in respect of pension liabilities following early retirements.
NOTE 18 – CREDITORS: AMOUNTS FALLING DUE AFTER MORE THAN ONE YEAR
Group University2011 2010 2011 2010£’000 £’000 £’000 £’000
Bank loans (see below) 102,690 92,690 102,690 92,690
Inherited Liability – Cornwall County Council 19 28 19 28
Accruals and deferred income 3,012 3,037 3,012 3,037
Amounts owed to group undertakings:
Subsidiary companies – – – 1,829
105,721 95,755 105,721 97,584
i) Bank loans and overdrafts – Group and University
2011 2010£’000 £’000
Bank loans and overdrafts are repayable as follows:
Bank overdrafts – 265
Bank loans:
Less than one year – –
In one to two years – –
In two to five years 8,269 5,513
In five years or more 94,421 87,177
102,690 92,955
NOTES TO THE ACCOUNTS
NOTES TO
ACCOUNTS
FINANCIAL STATEMENTS
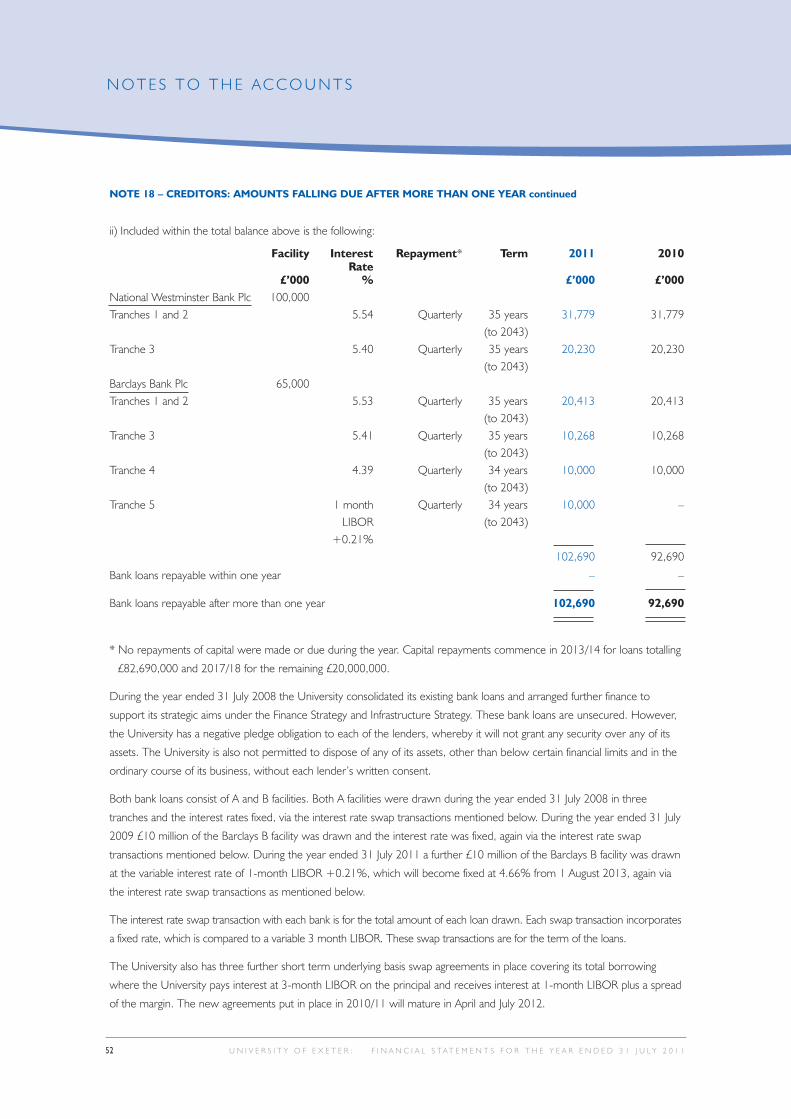
52 U N I V E R S I T Y O F E X E T E R : F I N A N C I A L S TAT E M E N T S F O R T H E Y E A R E N D E D 3 1 J U L Y 2 0 1 1
NOTE 18 – CREDITORS: AMOUNTS FALLING DUE AFTER MORE THAN ONE YEAR continued
ii) Included within the total balance above is the following:
Facility Interest Repayment* Term 2011 2010Rate
£’000 % £’000 £’000National Westminster Bank Plc 100,000Tranches 1 and 2 5.54 Quarterly 35 years 31,779 31,779
(to 2043)Tranche 3 5.40 Quarterly 35 years 20,230 20,230
(to 2043)Barclays Bank Plc 65,000Tranches 1 and 2 5.53 Quarterly 35 years 20,413 20,413
(to 2043)Tranche 3 5.41 Quarterly 35 years 10,268 10,268
(to 2043)Tranche 4 4.39 Quarterly 34 years 10,000 10,000
(to 2043)Tranche 5 1 month Quarterly 34 years 10,000 –
LIBOR (to 2043)+0.21%
102,690 92,690
Bank loans repayable within one year – –
Bank loans repayable after more than one year 102,690 92,690
* No repayments of capital were made or due during the year. Capital repayments commence in 2013/14 for loans totalling
£82,690,000 and 2017/18 for the remaining £20,000,000.
During the year ended 31 July 2008 the University consolidated its existing bank loans and arranged further finance to
support its strategic aims under the Finance Strategy and Infrastructure Strategy. These bank loans are unsecured. However,
the University has a negative pledge obligation to each of the lenders, whereby it will not grant any security over any of its
assets. The University is also not permitted to dispose of any of its assets, other than below certain financial limits and in the
ordinary course of its business, without each lender’s written consent.
Both bank loans consist of A and B facilities. Both A facilities were drawn during the year ended 31 July 2008 in three
tranches and the interest rates fixed, via the interest rate swap transactions mentioned below. During the year ended 31 July
2009 £10 million of the Barclays B facility was drawn and the interest rate was fixed, again via the interest rate swap
transactions mentioned below. During the year ended 31 July 2011 a further £10 million of the Barclays B facility was drawn
at the variable interest rate of 1-month LIBOR +0.21%, which will become fixed at 4.66% from 1 August 2013, again via
the interest rate swap transactions as mentioned below.
The interest rate swap transaction with each bank is for the total amount of each loan drawn. Each swap transaction incorporates
a fixed rate, which is compared to a variable 3 month LIBOR. These swap transactions are for the term of the loans.
The University also has three further short term underlying basis swap agreements in place covering its total borrowing
where the University pays interest at 3-month LIBOR on the principal and receives interest at 1-month LIBOR plus a spread
of the margin. The new agreements put in place in 2010/11 will mature in April and July 2012.
NOTES TO THE ACCOUNTS

53
NOTE 19 – PROVISIONS – Group and UniversityDeferred Total
capital grant£’000 £’000
Balance at 1 August 2010 883 883
Transfer to deferred capital grants receivable (544) (544)
Utilised in year – –
Balance at 31 July 2011 339 339
Deferred capital grant
In the development of its activities at the Tremough Campus in Cornwall the University of Exeter and University College
Falmouth have been in receipt of two phases of funding from the European Union. The European Court of Auditors undertook
an audit of Phase 2 of this funding during the years prior to 31 July 2010. This audit identified some areas where it was asserted
that the procurement processes which utilised these funds were not fully compliant with the European Union Procurement
Regulations. Following the results of the on-going discussions between the University of Exeter and University College Falmouth
and the relevant authorities, a reduced provision of £339,013 has been recognised as at 31 July 2011 which represents
management’s current estimate of the liability based on correspondence and professional advice received in respect of this matter.
The provision also correspondingly reduces the deferred capital grant balance.
NOTE 20 – DEFERRED CAPITAL GRANTS – Group and University
Funding Other TotalCouncil Grants£’000 £’000 £’000
At 1 August 2010
Land and buildings 57,048 42,016 99,064
Equipment 5,598 2,877 8,475
62,646 44,893 107,539
Grants receivable:
Land and buildings 3,364 7,960 11,324
– 3,475 3,475
3,364 11,435 14,799
Released to Income and Expenditure Account:
Land and buildings 1,741 1,279 3,020
Equipment 1,159 2,046 3,205
2,900 3,325 6,225
At 31 July 2011
Land and buildings 58,671 48,697 107,368
Equipment 4,439 4,306 8,745
63,110 53,003 116,113Released to Income and Expenditure Account:
Funding body grants 2,900
Research grants and contracts 1,742
Other income 1,583
6,225
NOTES TO THE ACCOUNTS
NOTES TO
ACCOUNTS
FINANCIAL STATEMENTS

54 U N I V E R S I T Y O F E X E T E R : F I N A N C I A L S TAT E M E N T S F O R T H E Y E A R E N D E D 3 1 J U L Y 2 0 1 1
NOTE 21 – ENDOWMENTS – Group and University
2011 2010Restricted RestrictedPermanent Expendable Total Total
£’000 £’000 £’000 £’000
At 1 August Capital 15,382 5,305 20,687 17,777
Accumulated income 378 9 387 325
15,760 5,314 21,074 18,102
New endowments – 1,290 1,290 703
– 1,290 1,290 703
Investment income 557 347 904 827
Expenditure (479) (1,065) (1,544) (1,128)
78 (718) (640) (301)
Increase in market value of investments 1,728 432 2,160 2,570
At 31 July 17,566 6,318 23,884 21,074
Represented by: Capital 17,110 6,251 23,361 20,687
Accumulated income 456 67 523 387
17,566 6,318 23,884 21,074
The University does not hold any endowments classed as unrestricted permanent.
Represented by: 2011 2010 £’000 £’000
Trustees Security Pool 3,630 3,237
Institute for Arab and Islamic Studies 14,691 13,205
PMS Vandervell 1,028 894
Fundraising 4,535 3,738
23,884 21,074
NOTES TO THE ACCOUNTS

55
NOTES TO THE ACCOUNTS
NOTES TO
ACCOUNTS
FIN
ANCIAL STATEMENTS
NOTE 22 – REVALUATION RESERVE
Group Freehold FixedLand and AssetBuildings Investments Total
£’000 £’000 £’000
At 1 August 2010 209,992 5,559 215,551
Revaluation in the yearFixed assets – land and buildings 51,456 – 51,456Fixed assets investments – fine art and books – 674 674 Fixed assets investments – quoted shares – 420 420
51,456 1,094 52,550
Transfer from revaluation to general reserve:Depreciation on re-valued assets (3,380) – (3,380)
(3,380) – (3,380)
At 31 July 2011 258,068 6,653 264,721
University Freehold FixedLand and AssetBuildings Investments Total
£’000 £’000 £’000
At 1 August 2010 206,952 5,559 212,511
Revaluation in the yearFixed assets – land and buildings 51,350 – 51,350Fixed assets investments – fine art and books – 674 674Fixed assets investments – quoted shares – 420 420
51,350 1,094 52,444
Transfer from revaluation to general reserve:Depreciation on re-valued assets (3,318) – (3,318)
(3,318) – (3,318)
At 31 July 2011 254,984 6,653 261,637
The impairment on re-valued assets is in relation to the Geoffrey Pope building. See note 12 for further details.

56 U N I V E R S I T Y O F E X E T E R : F I N A N C I A L S TAT E M E N T S F O R T H E Y E A R E N D E D 3 1 J U L Y 2 0 1 1
NOTE 23 – INCOME AND EXPENDITURE RESERVEGroup University
2011 2010 2011 2010£’000 £’000 £’000 £’000
Balance at 1 August 54,175 27,396 55,508 29,835
Surplus for the year 11,176 6,125 10,246 5,065
Transfers from revaluation reserve 3,380 13,517 3,318 13,455
Actuarial (loss)/gain on pension schemes (897) 7,137 (1,024) 7,153
Balance at 31 July 67,834 54,175 68,048 55,508
NOTE 24 – RECONCILIATION OF CONSOLIDATED OPERATING SURPLUS TO NET CASH
INFLOW FROM OPERATING ACTIVITIES2011 2010£’000 £’000
Surplus on continuing operations 11,176 6,125
FRS 17 – Pension adjustment (1,751) (14)
Depreciation (note 8) 15,803 13,106
Impairment of land and buildings (note 12) 3,121 2,559
Surplus on disposal of tangible fixed assets – (801)
Deferred capital grants released (note 20) (6,225) (5,259)
Endowment and investment income (note 5) (1,939) (1,572)
Interest payable (note 9) 4,911 4,840
(Increase)/decrease in stock (20) 87
Decrease/(increase) in debtors 3,185 (9,491)
Increase in creditors 1,453 5,018
Net cash inflow from operating activities 29,714 14,598
NOTE 25 – RETURNS ON INVESTMENTS AND SERVICING OF FINANCE2011 2010£’000 £’000
Income from short term investments 681 526
Other interest received 67 60
Interest paid (4,896) (4,827)
Net cash outflow from returns on investments and servicing of finance (4,148) (4,241)
NOTES TO THE ACCOUNTS

57
NOTES TO THE ACCOUNTS
NO
TES T
OAC
CO
UN
TS
FIN
AN
CIA
L S
TATEM
EN
TS
NOTE 26 – CAPITAL EXPENDITURE AND FINANCIAL INVESTMENT2011 2010£’000 £’000
Purchase of tangible assets (59,082) (39,104)
Payments to acquire long term investments (2,158) (1,491)
Total fixed and endowment assets acquired (61,240) (40,595)
Receipts from the sale of tangible assets – 17,641
Receipts from the sale of long term investments 74 192
Receipts from the sale of endowment assets 624 1,462
Deferred capital grants received 14,873 11,752
Endowments received 1,290 703
Net cash outflow from capital expenditure and financial investment (44,379) (8,845)
Included within receipts from the sale of tangible assets are cash inflows relating to items presented as exceptional in the
primary financial statements.
NOTE 27 – MANAGEMENT OF LIQUID RESOURCES2011 2010£’000 £’000
Cash (deposited)/withdrawn from short term deposits (2,311) 6,635
Net cash (outflow)/inflow from management of liquid resources (2,311) 6,635
NOTE 28 – FINANCING2011 2010£’000 £’000
New loans repayable by 2043 10,000 –
10,000 –
Repayment of amounts borrowed (8) (454)
Net cash inflow/(outflow) from financing 9,992 (454)

58 U N I V E R S I T Y O F E X E T E R : F I N A N C I A L S TAT E M E N T S F O R T H E Y E A R E N D E D 3 1 J U L Y 2 0 1 1
NOTE 29 – ANALYSIS OF CHANGES IN NET DEBT
At 1 August Cash At 31 July2010 Flows 2011£’000 £’000 £’000
Cash in hand and at bank 31,102 (11,397) 19,705
Overdrafts (265) 265 –
30,837 (11,132) 19,705
Debt due within one year (8) (1) (9)
Debt due after one year (92,718) (9,991) (102,709)
Current asset investments 24,138 2,311 26,449
(37,751) (18,813) (56,564)
NOTE 30 – PENSION SCHEMES
The two principal schemes for the University’s staff are the national Universities Superannuation Scheme (USS) and the
University of Exeter Retirement Benefits Scheme (ERBS), which are externally invested defined benefit (final salary) schemes,
contracted out of the State Second Pension. The assets of the schemes are held in separate trustee-administered funds.
The University also makes contributions to the National Health Superannuation Scheme (NHSS) in respect of a small number
of staff at its Department of Sport and Health Sciences and the Peninsula College of Medicine and Dentistry.
The latest finalised actuarial valuation for USS was at 31 March 2008 and for ERBS was 6 April 2009. The pension costs for
both schemes are assessed using the projected unit method. The assumptions that have the most significant effect on the
result of the valuations are those relating to the rate of return on investments (i.e. the valuation rate of interest) and the rates
of increase in salary and pensions. In relation to the past service liabilities the financial assumptions were derived from market
yields prevailing at the valuation date.
(i) Universities Superannuation Scheme (USS)
The University participates in the Universities Superannuation Scheme, a defined benefit scheme which is contracted out of
the State Second Pension. The assets of the Scheme are held in a separate fund administered by the trustee, Universities
Superannuation Scheme Limited.
Because of the mutual nature of the Scheme, the Scheme’s assets are not hypothecated to individual institutions and a
scheme-wide contribution rate is set. The University is therefore exposed to actuarial risks associated with other institutions’
employees and is unable to identify its share of the underlying assets and liabilities of the Scheme on a consistent and
reasonable basis and therefore, as required by FRS 17 ‘Retirement benefits’, accounts for the Scheme as if it were a defined
contribution scheme. As a result, the amount charged to the income and expenditure account represents the contributions
payable to the Scheme in respect of the accounting period.
The latest triennial actuarial valuation of the scheme was at 3 March 2008 and was carried out using the projected unit
method. To calculate the technical provisions, it was assumed that the valuation rate of interest would be 6.4% per annum,
salary increases would be 4.3% per annum (plus an additional allowance for increases in salaries due to age and promotion
reflecting historic Scheme experience, with a further cautionary reserve on top for past service liabilities) and pensions would
increase by 3.3% per annum.
NOTES TO THE ACCOUNTS

59
NOTE 30 – PENSION SCHEMES continued
At the valuation date, the value of the assets of the scheme was £28,842.6 million and the value of the Scheme’s technical
provisions was £28,135.3 million indicating a surplus of £707.3 million. The assets therefore were sufficient to cover 103%
of the benefits which had accrued to members after allowing for expected future increases in earnings.
Since 31 March 2008 global investment markets have continued to fluctuate and as at 31 March 2011 the actuary has
estimated that the funding level under the scheme specific funding regime had fallen from 103% to 98% (a deficit of circa
£700 million). Compared to the previous twelve months, the funding level has improved from 91% (as at 31 March 2010)
to 98%.
The contribution rate payable by the University was 16% of pensionable salaries. The next formal triennial actuarial valuation,
as at 31 March 2011, is now due. The contribution rate will be reviewed as part of each valuation and may be reviewed
more frequently. Surpluses or deficits which arise at future valuations may impact on the University’s future contribution
commitment. A deficit may require additional funding in the form of higher contribution requirements, where a surplus could,
perhaps, be used to similarly reduce contribution requirements.
At 31 March 2011, USS had over 142,000 active members and the University had over 1,800 active members participating
in the Scheme.
The total pension cost for the University was £11,595,000 (2010: £10,348,000). This includes £1,458,000 (2010: £1,298,000)
outstanding contributions at the balance sheet date.
(ii) University of Exeter Retirement Benefits Scheme (ERBS)
The latest actuarial valuation of the Scheme was dated 5 April 2009. This valuation continued to show that the funds held by
the Scheme were insufficient to meet anticipated future commitments. The University has set a revised target of 25 years
and nine months from the date of the valuation, to eliminate this deficit and had already increased the employer’s
contributions in order to fund the projected shortfall. The employee contribution rate has also increased to 6.25% (from
6.00%) as from 1 August 2010. The assumptions and other data, which have the most significant effect on the determination
of contribution levels, are as follows:
Latest actuarial valuation 6 April 2009
Investment return – past service per annum 6.50%
Investment return – future service per annum 6.50%
Pensionable salary increases per annum 4.70%
Pension increases per annum 2.95%
Price inflation per annum 3.20%
Actuarial value of assets at date of last valuation £55.6m
Value of past service liabilities £107.9m
Proportion of members’ accrued benefits covered
by the actuarial value of the assets 51.5%
NOTES TO THE ACCOUNTS
NOTES TO
ACCOUNTS
FINANCIAL STATEMENTS

60 U N I V E R S I T Y O F E X E T E R : F I N A N C I A L S TAT E M E N T S F O R T H E Y E A R E N D E D 3 1 J U L Y 2 0 1 1
NOTE 30 – PENSION SCHEMES continued
The principal assumptions used were in accordance with those used by independent qualified actuaries in updating the most
recent reviews of the UK schemes for Financial Reporting Standard (FRS 17) purposes as follows:
2011 2010 2009
% % %
Discount rate for scheme liabilities 5.3 5.6 6.3
Inflation assumption – RPI 3.5 3.3 3.7
Inflation assumption – CPI 3.0 2.8 N/A
Long-term salary growth increases* 4.2 4.0 4.7
Increases on CARE benefits before
retirement (in active service) 3.5 3.3 N/A
Pension payment increases – pre 01/08/10 service 3.0 2.8 3.7
Pension payment increases – post 01/08/10 service 2.3 2.3 N/A
* A lower rate averaging 2% per annum is assumed for the two years immediately following the year-end.
The mortality assumptions are based on standard mortality tables which allow for minimum future mortality improvements.
The assumptions are as follows:
2011 2010 2009
Years Years Years
Future life expectancies at age 65:
Male currently aged 65 20.2 20.1 20.1
Female currently aged 65 22.2 22.2 22.2
Male currently aged 45 22.0 22.0 21.9
Female currently aged 45 23.4 23.4 23.4
The assets in the scheme and the expected rates of return together with the reconciliation of funded status to the balance
sheet were as follows:
31 July 2011 31 July 2010 31 July 2009Long-term rate Long-term rate Long-term rate
of return of return of returnexpected expected expected% p.a. £’000 % p.a. £’000 % p.a. £’000
Equities 7.9 54,630 8.2 49,073 8.5 40,475
Corporate bonds 5.3 6,896 5.4 5,834 6.0 5,548
Government bonds 3.9 16,461 4.2 13,937 4.0 12,944
Cash/Other 3.5 2,078 3.3 517 4.8 810
6.7 80,065 7.1 69,361 7.2 59,777
Present value of scheme liabilities (92,426) (82,449) (80,032)
Pension liability (12,361) (13,088) (20,255)
NOTES TO THE ACCOUNTS

61
NOTE 30 – PENSION SCHEMES continued
The University of Exeter employs a building block approach in determining the long-term rate of return on pension plan assets.
Historical markets are studied and assets with higher volatility are assumed to generate higher returns consistent with widely
accepted capital market principles. The assumed long-term rate of return on each asset class is set out within this note. The
overall expected rate of return on assets is then derived by aggregating the expected return for each asset class over the actual
asset allocation for the Scheme at 31 July 2011.
Income and Expenditure Account
Analysis of the amount charged to the income and expenditure account
2011 2010
£’000 £’000
Current service cost 2,426 2,256
Past service cost – 180
Total operating charge 2,426 2,436
Analysis of the amount charged to the income and expenditure account
2011 2010
£’000 £’000
Within salaries and wages – members’ contributions 842 –
Within pension costs – monthly contributions 2,994 3,132
Within pension costs – FRS 17 (1,410) (696)
Total operating charge (note 6) 2,426 2,436
Contributions of £842,000 (2010: £nil) represent contributions made by current members under a salary sacrifice
arrangement and charged to salaries and wages but treated as if part of the University’s contributions by the Scheme
and for FRS 17 purposes.
Analysis of amount credited to investment income/(charged to interest payable)
2011 2010
£’000 £’000
Expected return on pension scheme assets 4,898 4,218
Interest on pension scheme liabilities (4,557) (4,900)
Net credit/(charge) on pension scheme funds 341 (682)
NOTES TO THE ACCOUNTS
NOTES TO
ACCOUNTS
FINANCIAL STATEMENTS

62 U N I V E R S I T Y O F E X E T E R : F I N A N C I A L S TAT E M E N T S F O R T H E Y E A R E N D E D 3 1 J U L Y 2 0 1 1
NOTE 30 – PENSION SCHEMES continued
Analysis of amounts recognised in the Statement of Recognised Gains and Losses (STRGL)
2011 2010
£’000 £’000
Total actuarial (losses)/gains (1,024) 7,153
Total (loss)/gain recognised in the STRGL (1,024) 7,153
Cumulative amount of losses recognised in the STRGL (28,404) (27,380)
In its June 2010 budget, the government announced that it intended for future increases in public sector pension schemes to
be linked to changes in the Consumer Prices Index (CPI) rather than, as previously, the Retail Price Index (RPI). In the year
ended 31 July 2010, the University considered the University of Exeter Retirement Benefits Scheme rules and associated
members’ literature and concluded that, as a result, revised actuarial assumptions about the level of inflation indexation should
be adopted with the resultant gain being recognised through the Statement of Total Recognised Gains and Losses (‘STRGL’)
for the year ended 31 July 2010. Following the issue of Urgent Issues Task Force (‘UITF’) Abstract 48 in December 2010, the
University has reconsidered its position in respect of the above and has concluded that the above treatment of the gain
remains appropriate. CPI continues to be adopted as the bases of inflation indexation since this change.
Movement in the scheme deficit during the year
2011 2010 £’000 £’000
Deficit on scheme at 1 August (13,088) (20,255)
Movements in the year:
Current service cost (2,426) (2,256)
Past service cost – (180)
Contributions paid 3,836 3,132
Other finance income/(expenditure) 341 (682)
Actuarial (losses)/gains (1,024) 7,153
Deficit on scheme at 31 July (12,361) (13,088)
NOTES TO THE ACCOUNTS
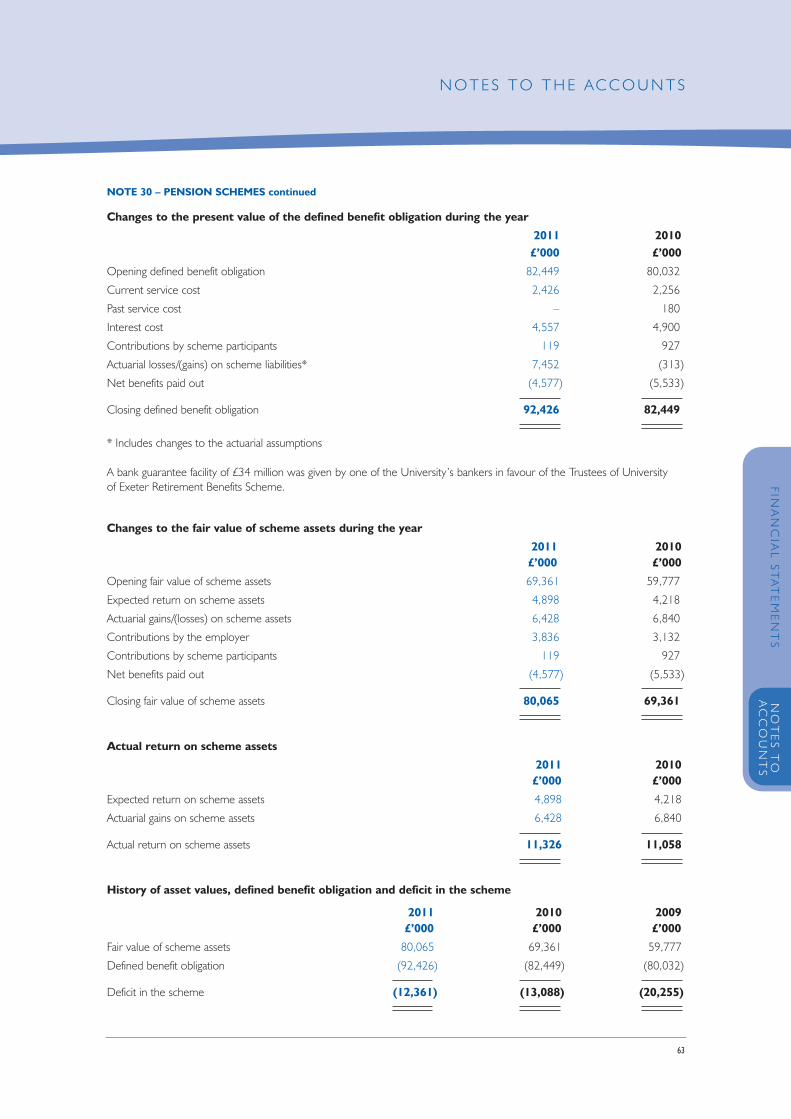
63
NOTE 30 – PENSION SCHEMES continued
Changes to the present value of the defined benefit obligation during the year
2011 2010 £’000 £’000
Opening defined benefit obligation 82,449 80,032
Current service cost 2,426 2,256
Past service cost – 180
Interest cost 4,557 4,900
Contributions by scheme participants 119 927
Actuarial losses/(gains) on scheme liabilities* 7,452 (313)
Net benefits paid out (4,577) (5,533)
Closing defined benefit obligation 92,426 82,449
* Includes changes to the actuarial assumptions
A bank guarantee facility of £34 million was given by one of the University’s bankers in favour of the Trustees of University of Exeter Retirement Benefits Scheme.
Changes to the fair value of scheme assets during the year
2011 2010£’000 £’000
Opening fair value of scheme assets 69,361 59,777
Expected return on scheme assets 4,898 4,218
Actuarial gains/(losses) on scheme assets 6,428 6,840
Contributions by the employer 3,836 3,132
Contributions by scheme participants 119 927
Net benefits paid out (4,577) (5,533)
Closing fair value of scheme assets 80,065 69,361
Actual return on scheme assets
2011 2010£’000 £’000
Expected return on scheme assets 4,898 4,218
Actuarial gains on scheme assets 6,428 6,840
Actual return on scheme assets 11,326 11,058
History of asset values, defined benefit obligation and deficit in the scheme
2011 2010 2009£’000 £’000 £’000
Fair value of scheme assets 80,065 69,361 59,777
Defined benefit obligation (92,426) (82,449) (80,032)
Deficit in the scheme (12,361) (13,088) (20,255)
NOTES TO THE ACCOUNTS
NOTES TO
ACCOUNTS
FINANCIAL STATEMENTS
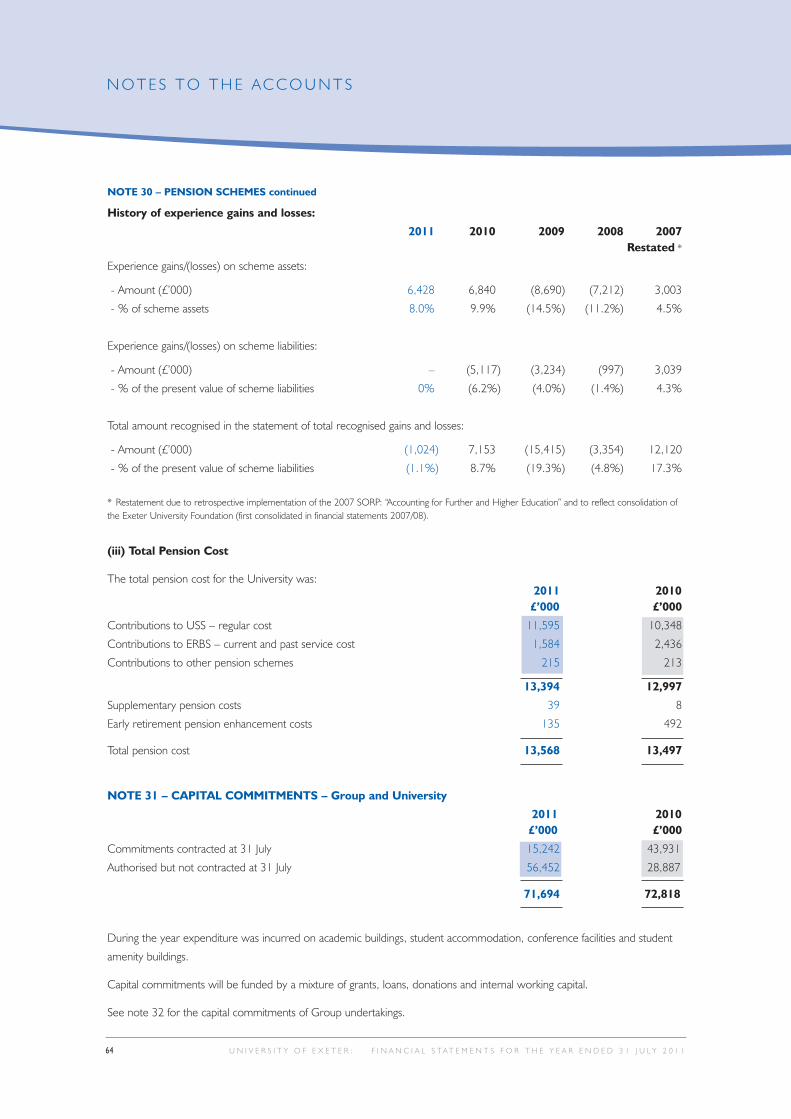
64 U N I V E R S I T Y O F E X E T E R : F I N A N C I A L S TAT E M E N T S F O R T H E Y E A R E N D E D 3 1 J U L Y 2 0 1 1
NOTES TO THE ACCOUNTS
NOTE 30 – PENSION SCHEMES continued
History of experience gains and losses:
2011 2010 2009 2008 2007Restated *
Experience gains/(losses) on scheme assets:
- Amount (£’000) 6,428 6,840 (8,690) (7,212) 3,003
- % of scheme assets 8.0% 9.9% (14.5%) (11.2%) 4.5%
Experience gains/(losses) on scheme liabilities:
- Amount (£’000) – (5,117) (3,234) (997) 3,039
- % of the present value of scheme liabilities 0% (6.2%) (4.0%) (1.4%) 4.3%
Total amount recognised in the statement of total recognised gains and losses:
- Amount (£’000) (1,024) 7,153 (15,415) (3,354) 12,120
- % of the present value of scheme liabilities (1.1%) 8.7% (19.3%) (4.8%) 17.3%
* Restatement due to retrospective implementation of the 2007 SORP: “Accounting for Further and Higher Education” and to reflect consolidation ofthe Exeter University Foundation (first consolidated in financial statements 2007/08).
(iii) Total Pension Cost
The total pension cost for the University was:2011 2010 £’000 £’000
Contributions to USS – regular cost 11,595 10,348
Contributions to ERBS – current and past service cost 1,584 2,436
Contributions to other pension schemes 215 213
13,394 12,997
Supplementary pension costs 39 8
Early retirement pension enhancement costs 135 492
Total pension cost 13,568 13,497
NOTE 31 – CAPITAL COMMITMENTS – Group and University
2011 2010 £’000 £’000
Commitments contracted at 31 July 15,242 43,931
Authorised but not contracted at 31 July 56,452 28,887
71,694 72,818
During the year expenditure was incurred on academic buildings, student accommodation, conference facilities and student
amenity buildings.
Capital commitments will be funded by a mixture of grants, loans, donations and internal working capital.
See note 32 for the capital commitments of Group undertakings.

65
NOTES TO THE ACCOUNTS
NOTES TO
ACCOUNTS
FINANCIAL STATEMENTS
NOTE 32 – RELATED PARTY TRANSACTIONS
Due to the nature of the University’s operations and the composition of the University Council (with members being drawn
from local, public and private sector organisations) it is inevitable that transactions will take place with organisations in which
a member of Council may have an interest. All transactions involving organisations in which a member of Council may have
an interest are conducted at arm’s length and in accordance with the University’s financial regulations and normal
procurement procedures, which require individuals to declare any interest.
The University undertakes transactions for architectural services with Lacey Hickie & Caley Limited, a wholly owned
subsidiary of LHC Group Limited. These transactions are conducted at arm’s length and in the normal course of business.
Mr Peter Lacey, a Pro-Chancellor of the University is a shareholder of LHC Group Limited. During the year an amount of
£12,275 (2010: £48,746) was invoiced to the University.
The University has taken advantage of the exemption under FRS 8 ‘Related party disclosures’ not to disclose transactions
with subsidiaries that are wholly owned.
Tremough Campus Services
The University holds a 50% share of Tremough Campus Services (TCS), a company limited by guarantee, having no share
capital and for which exempt charitable status has been obtained. TCS is a joint venture company owned equally by the
University and University College Falmouth (UCF).
TCS has been established to operate student and commercial services for the Combined Universities in Cornwall campus
at Tremough in Penryn under a combined services agreement and commenced trading in August 2004.
During 2009 TCS commenced drawing down a loan with Barclays Bank Plc for new residences. The facility is for £20.5
million and is repayable over 30 years. The University and UCF have jointly and equally guaranteed this facility and also
continued to guarantee sums of £9.3 million and £6.25 million each to Lloyds TSB Bank Plc, in respect of the borrowings
of £18.6 million and £12.5 million respectively to TCS.
Tremough Development Vehicle Limited (TDV) is a wholly owned subsidiary of TCS. It was established to provide the
construction of the main campus for the Combined Universities in Cornwall project based at Tremough on behalf of the
University and UCF. The University and UCF receive capital grants that are released to TDV to fund the academic
development at the Tremough Campus. TDV is also receiving grants to construct non-academic facilities related to the
infrastructure and shared spaces development. These grants are received by TDV acting as an agent for the University and
UCF. The grants and related costs are passed to the University and UCF on an agreed 50:50 basis.
During the year TDV continued to contract for the design and construction of infrastructure, shared and academic spaces for
the further development for the Tremough campus. TDV will contract the works with third parties and will recover funds
from the University and UCF on the basis of an agreed split of costs and usage of space. The TCS Group has capital
commitments as follows:
2011 2010£’000 £’000
Commitments contracted at 31 July 21,610 2,808
Authorised but not contracted at 31 July 12,013 47,686
33,623 50,494
Amounts authorised are in respect of various construction projects at Tremough, Penryn less commitments to date in TDV.
Commitments relate to the construction of the Phase 2A residences together with new construction projects in progress.

66 U N I V E R S I T Y O F E X E T E R : F I N A N C I A L S TAT E M E N T S F O R T H E Y E A R E N D E D 3 1 J U L Y 2 0 1 1
NOTE 32 – RELATED PARTY TRANSACTIONS continued
Transactions between the University and TCS were as follows:
2011 2010 £’000 £’000
Income derived from the TCS Group 837 1,951
Expenditure incurred with the TCS Group 1,908 24
Payments by the TCS Group on behalf of the University 7,018 2,188
‘Payments by TCS on behalf of the University’ represents amounts paid to contractors for the University’s share of the design
and construction of the further development of the Tremough Campus.
The balances owing between the University and TCS at the year end were as follows:
2011 2010£’000 £’000
Amount owing from University of Exeter to the TCS Group 828 73
Amount due to University of Exeter from the TCS Group 3 55
INTO University of Exeter LLP / Exeter ISC Limited
On 30 October 2006 the University formed the wholly owned subsidiary Exeter ISC Limited. Exeter ISC Limited has an
issued share capital of 100 Ordinary £1 shares and 149,900 redeemable £1 preference shares.
Exeter ISC Limited holds a 50% share of INTO University of Exeter LLP, a limited liability partnership.
INTO University of Exeter LLP is a joint venture partnership with INTO University Partnerships Limited and the remaining
50% share is owned by INTO Exeter Limited, a wholly owned subsidiary of INTO University Partnerships Limited.
Transactions between the University and INTO University of Exeter LLP in the normal course of business were as follows:
2011 2010 £’000 £’000
Operating costs recharged to INTO University of Exeter LLP 2,029 3,168
Expenditure incurred with INTO University of Exeter LLP 378 320
The balances owing between the University and INTO University of Exeter LLP:
2011 2010
£’000 £’000
Amount owing from INTO University of Exeter LLP 755 992
Amount due to INTO University of Exeter LLP 267 320
The balances owing between Exeter ISC Limited and its related parties at the year end were as follows:
2011 2010
£’000 £’000
Amount owing from Exeter ISC to the University of Exeter 6 1
NOTES TO THE ACCOUNTS

67
NOTES TO THE ACCOUNTS
NOTES TO
ACCOUNTS
FINANCIAL STATEMENTS
NOTE 32 – RELATED PARTY TRANSACTIONS continued
University of Exeter Students’ GuildIn accordance with FRS 2, the activities of the University of Exeter Students’ Guild have not been consolidated on the groundsthat the University does not operate dominant influence over its activities. During the year ended 31 July 2011 the surplus onthe Guilds’ activities was £40,000 (2010: £74,000 surplus) and its capital and reserves totalled £374,000 at this date (2010:£334,000).
Thomas Hall Estates Limited
The University has an arrangement with a local construction company to renovate and refurbish Thomas Hall. The nature
of the arrangement is that a company, Thomas Hall Estates Limited, will work in association with the University to develop
a hotel and conference centre on the Thomas Hall site at the University.
A lay member of the University’s Council and a senior member of staff are directors of Thomas Hall Estates Limited.
If the project was aborted each party would be liable to 50% of the direct costs incurred to date by the company. The
University has continued to accrue its share of these costs of £293,000 (2010: £263,000) until the outcome of the project
is more certain.
NOTE 33 – ACCESS FUNDS
Summary of transactions for the year ended 31 July 20112011 2010
£’000 £’000
Balance at 1 August 12 28
Funding Council grants 187 219
Interest earned 1 1
200 248
Disbursed to students (183) (228)
Administration costs (6) (8)
Balance at 31 July 11 12
Funding Council grants are available solely for students; the University acts only as paying agent.
The grants and related disbursements are therefore excluded from the Income and Expenditure Account.
NOTE 34 – TDA INITIAL TEACHER TRAINING BURSARIES
Summary of transactions for the year ended 31 July 20112011 2010
£’000 £’000
Balance at 1 August (65) 127
TDA grants received 3,167 3,466
Total TDA training bursary funding available for the year 3,102 3,593
Disbursements to students (2,935) (3,658)
Balance at 31 July 167 (65)
TDA training bursaries are available solely for students; the University acts only as paying agent.
The training bursaries are therefore excluded from the Income and Expenditure Account.

68 U N I V E R S I T Y O F E X E T E R : F I N A N C I A L S TAT E M E N T S F O R T H E Y E A R E N D E D 3 1 J U L Y 2 0 1 1
NOTES TO THE ACCOUNTS
NOTE 35 – MAINSTREAM RECRUITMENT AND RETENTION FUNDING
Summary of transactions for the year ended 31 July 2011
2011 2010 £’000 £’000
Balance at 1 August 15 –
TDA funds (repaid)/received (15) 26
Total TDA funding available for the year – 26
TDA recruitment and retention expenditure – (11)
Balance at 31 July – 15
NOTE 36 – TDA STUDENT ASSOCIATES SCHEME (SAS)
Summary of transactions for the year ended 31 July 2011
2011 2010
£’000 £’000
Funds received 94 293
Disbursements to students (88) (260)
Excess of income over expenditure for the year 6 33

69
NOTES TO THE ACCOUNTS
NOTES TO
ACCOUNTS
FINANCIAL STATEMENTS
NOTE 37 – PENINSULA COLLEGE OF MEDICINE AND DENTISTRY
INCOME AND EXPENDITURE ACCOUNT of the Higher Education (HE) Community Chest for the year ended 31 July 2011
University University of Total Totalof Exeter Plymouth
2011 2011 2011 2010
INCOME Note £’000 £’000 £’000 £’000
Funding Council grants iii 8,729 8,729 17,458 16,964
Tuition fees and education contracts 2,707 2,745 5,452 4,574
NHS funding iv 2,075 2,075 4,150 7,528
Research grants and contracts 10,348 2,220 12,568 11,107
Other income v 1,284 1,322 2,606 4,854
Endowment and investment income 98 98 196 209
Total income 25,241 17,189 42,430 45,236
EXPENDITURE
Staff costs vi 14,763 9,233 23,996 20,797Other operating expenses 9,806 7,320 17,126 20,214Depreciation vii 260 224 484 234
Total expenditure 24,829 16,777 41,606 41,245
Surplus on continuing operations 412 412 824 3,991
BALANCE SHEET of the Higher Education (HE) Community Chest as at 31 July 2011
2011 2010
Note £’000 £’000
Fixed assetsTangible assets vii 5,204 3,717
Current assetsStock 4 –Debtors viii 7,765 12,452Cash at bank and in hand ix 30,192 25,359
37,961 37,811
Creditors: amounts falling due within one year x (17,477) (18,151)
Net current assets 20,484 19,660
Total assets less current liabilities 25,688 23,377
NET ASSETS 25,688 23,377
Deferred capital grants vii 5,204 3,717
Reserves xi 20,484 19,660
TOTAL 25,688 23,377

70 U N I V E R S I T Y O F E X E T E R : F I N A N C I A L S TAT E M E N T S F O R T H E Y E A R E N D E D 3 1 J U L Y 2 0 1 1
NOTES TO THE ACCOUNTS
NOTE 37 – PENINSULA COLLEGE OF MEDICINE AND DENTISTRY continued
Explanatory Notes
i. Background
The Peninsula College of Medicine and Dentistry (PCMD) is not a legal entity in its own right. It is a joint arrangement
not an entity entered into in partnership by the University of Exeter and the University of Plymouth. PCMD, in turn,
has partnership arrangements with three NHS Trusts (The Royal Devon and Exeter NHS Foundation Trust, Plymouth
Hospitals NHS Trust and Royal Cornwall Hospitals Trust) and further arrangements with healthcare providers
throughout the South West peninsula.
The Planning and Performance Committee is accountable to the Council of the University of Exeter and the Board of
Governors of the University of Plymouth and is responsible to the Universities in respect of the overall management of
PCMD within the policies and parameters set by the Universities’ governing bodies. In making recommendations the
Planning and Performance Committee has due regard to the statutory and other legal obligations of the Universities and
the NHS institutions.
ii. Audit arrangements
A 50% share of the Income, Expenditure and Balance Sheet items (excluding research) of the Peninsula College of
Medicine and Dentistry is included within the Income and Expenditure Account and Balance Sheet of each of the
Universities. The items comprising the externally funded research activity of PCMD are included within the statements
of the University employing each project’s Principal Investigator.
These transactions are part of the audited financial statements of each University for the year ended 31 July 2011.
iii. Funding Council grants2011 2010£’000 £’000
Recurrent grant 16,689 15,928
Other specific grants 685 953
Deferred capital grants released in the year: Equipment 84 83
17,458 16,964
iv. NHS funding
2011 2010
£’000 £’000
NHS funding 4,150 7,528
This funding was receivable to cover HE expenditure attributable to the
NHS aspects of the Peninsula College of Medicine and Dentistry.
v. Other income
2011 2010
£’000 £’000
Other grant income 1,467 4,630
Other income 1,139 224
2,606 4,854

71
NOTES TO THE ACCOUNTS
NOTES TO
ACCOUNTS
FINANCIAL STATEMENTS
NOTE 37 – PENINSULA COLLEGE OF MEDICINE AND DENTISTRY continued
vi. Staff numbers
The average number of persons (including senior post-holders) employed on behalf of PCMD by either the University
of Exeter and the University of Plymouth during the year, expressed as full-time equivalents, was:
Year Ended Year Ended31 July 2011 31 July 2010Number Number
Academic staff 111 100
Research staff 131 108
Teaching fellows (formerly tutors) 8 7
Support staff 208 197
Total 458 412
Those staff employed by the University of Exeter are included in the staff numbers for the University in note 6.
vii. Fixed assets
Equipment costing less than £25,000 per individual item or group of related items is written off in the year of acquisition.
All other equipment is capitalised. Capitalised equipment is stated at cost and depreciated over its useful life as follows:
Computer equipment and IT Infrastructure 4 to 8 years
Equipment acquired for specific
research projects remaining project life (generally 3 years)
Other equipment 8 years
Where equipment is acquired with the aid of specific grants it is capitalised and depreciated as above. The related grant
is treated as a deferred capital grant and released to income over the expected life of the equipment. The equipment
capitalised in this statement is solely acquired with funding made available from the HE Community Chest and the
equipment is jointly owned by the two universities. The principal items are for telematics.
viii. Debtors2011 2010£’000 £’000
Debtors 2,685 3,141
Prepayments and accrued income 4,668 8,043
Due from partner university 412 1,268
7,765 12,452
Included within debtors is an amount of £800,000 (2010: £800,000) that relates to a deposit placed with Landsbanki
Islands hf. This balance is net of a provision of £200,000 (2010: £200,000) that was written off in the year ended
31 July 2009. The deposits are contractually due to be repaid after more than one year. Note 16 provides further
information on this matter.
The Universities of Exeter and Plymouth would each bear 50% of any future loss that may arise.
Included in Debtors are amounts owing from University of Plymouth Enterprise Limited, a University of Plymouth
owned subsidiary company, of £63,531 (2010: £39,119).

72 U N I V E R S I T Y O F E X E T E R : F I N A N C I A L S TAT E M E N T S F O R T H E Y E A R E N D E D 3 1 J U L Y 2 0 1 1
NOTE 37 – PENINSULA COLLEGE OF MEDICINE AND DENTISTRY continued
ix. Cash at bank and in hand
2011 2010
Held by: £’000 £’000
University of Exeter 11,038 11,654
University of Plymouth 19,152 13,704
University of Plymouth – PCMD 2 1
30,192 25,359
These balances are held under the agreed management arrangements. The University of Plymouth Peninsula College of
Medicine and Dentistry account facilitates payments to suppliers whilst the balances held by the University of Exeter and
the University of Plymouth are held in instant access accounts and short-term deposits.
x. Creditors: amounts falling due within one year
2011 2010
£’000 £’000
Trade creditors 407 263
Other creditors 11 44
Due to partner universities 997 –
Deferred income:
HEFCE Capital funding – 2,131
HEFCE Dental start-up funding 785 1,468
NHS Capital funding 263 1,118
NHS Dental start-up funding 4,485 2,451
NHS SIFT 2,116 1,440
Accruals and other deferred income 8,413 9,236
17,477 18,151
xi. Reserves
2011 2010
£’000 £’000
Opening balance 19,660 15,669
Surplus for the year 824 3,991
Closing balance 20,484 19,660
NOTES TO THE ACCOUNTS
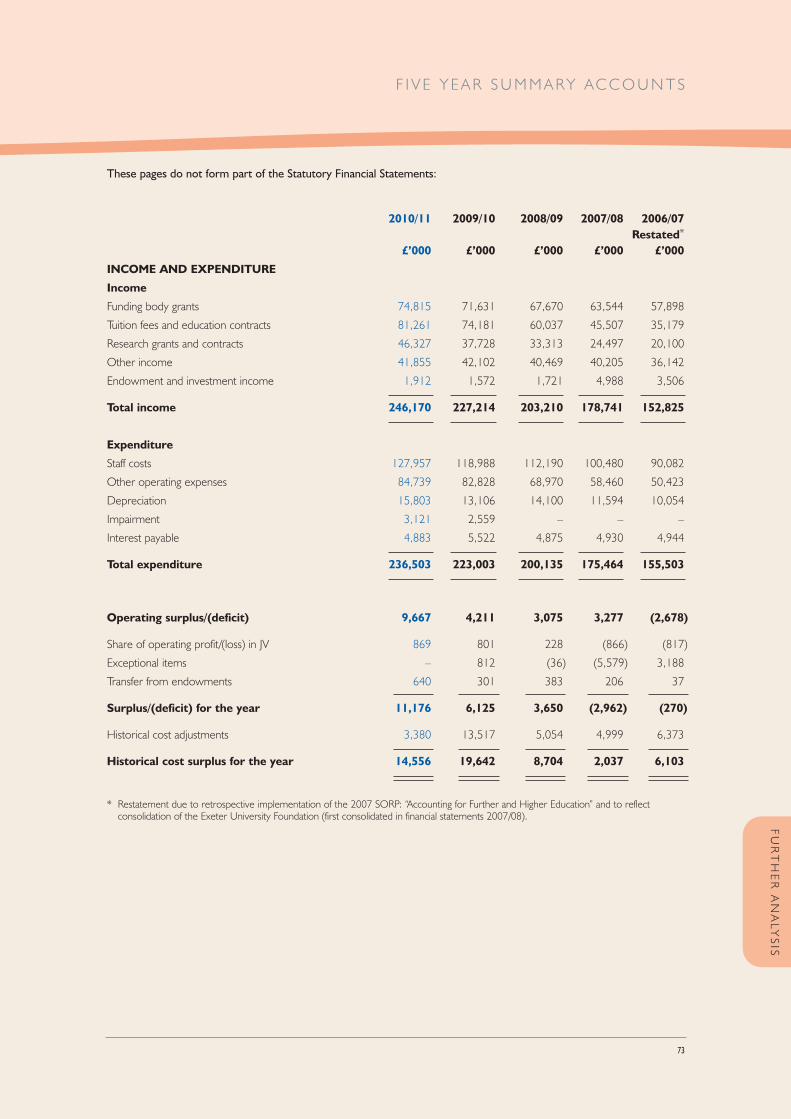
73
F I V E Y EAR SUMMARY ACCOUNTS
2010/11 2009/10 2008/09 2007/08 2006/07Restated*
£’000 £’000 £’000 £’000 £’000
INCOME AND EXPENDITURE
Income
Funding body grants 74,815 71,631 67,670 63,544 57,898
Tuition fees and education contracts 81,261 74,181 60,037 45,507 35,179
Research grants and contracts 46,327 37,728 33,313 24,497 20,100
Other income 41,855 42,102 40,469 40,205 36,142
Endowment and investment income 1,912 1,572 1,721 4,988 3,506
Total income 246,170 227,214 203,210 178,741 152,825
Expenditure
Staff costs 127,957 118,988 112,190 100,480 90,082
Other operating expenses 84,739 82,828 68,970 58,460 50,423
Depreciation 15,803 13,106 14,100 11,594 10,054
Impairment 3,121 2,559 – – –
Interest payable 4,883 5,522 4,875 4,930 4,944
Total expenditure 236,503 223,003 200,135 175,464 155,503
Operating surplus/(deficit) 9,667 4,211 3,075 3,277 (2,678)
Share of operating profit/(loss) in JV 869 801 228 (866) (817)
Exceptional items – 812 (36) (5,579) 3,188
Transfer from endowments 640 301 383 206 37
Surplus/(deficit) for the year 11,176 6,125 3,650 (2,962) (270)
Historical cost adjustments 3,380 13,517 5,054 4,999 6,373
Historical cost surplus for the year 14,556 19,642 8,704 2,037 6,103
* Restatement due to retrospective implementation of the 2007 SORP: “Accounting for Further and Higher Education” and to reflect consolidation of the Exeter University Foundation (first consolidated in financial statements 2007/08).
These pages do not form part of the Statutory Financial Statements:
FURTHER ANALYSIS

2010/11 2009/10 2008/09 2007/08 2006/07Restated*
£’000 £’000 £’000 £’000 £’000
BALANCE SHEET
Fixed assets 556,206 459,010 450,045 449,370 457,408
Endowment asset investments 23,884 21,074 18,102 15,974 18,534
Net current assets 10,883 27,981 22,480 20,791 20,940
Creditors: amounts falling due
after more than one year (105,721) (95,755) (92,978) (83,180) (77,871)
485,252 412,310 397,649 402,955 419,011
Provisions for liabilities (339) (883) (846) (893) (1,899)
Pension liability (12,361) (13,088) (20,255) (5,308) (2,990)
Total net assets 472,552 398,339 376,548 396,754 414,122
Represented by:
Deferred capital grants 116,113 107,539 101,287 93,213 85,558
Endowment reserve 23,884 21,074 18,102 15,974 18,534
Revaluation reserve 264,721 215,551 229,763 250,217 271,376
Income and expenditure reserve 67,834 54,175 27,396 37,350 38,654
Total funds 472,552 398,339 376,548 396,754 414,122
74 U N I V E R S I T Y O F E X E T E R : F I N A N C I A L S TAT E M E N T S F O R T H E Y E A R E N D E D 3 1 J U L Y 2 0 1 1
F I V E Y EAR SUMMARY ACCOUNTS
These pages do not form part of the Statutory Financial Statements:
* Restatement due to retrospective implementation of the 2007 SORP: “Accounting for Further and Higher Education” and to reflect consolidation of the Exeter University Foundation (first consolidated in financial statements 2007/08).

75
2010/11 2009/10 2008/09 2007/08 2006/07 Restated
% % % % * %
Sources of income (% of income)
Funding body grants 30.4 31.5 33.3 35.6 37.9
Tuition fees – Home and EU 19.5 19.6 19.4 17.3 15.2
Tuition fees – Overseas and other 13.5 13.1 10.1 8.2 7.8
Research grants and contracts 18.8 16.6 16.4 13.7 13.2
Residences, catering and conferences 8.5 9.6 10.7 11.9 13.6
Other income 8.7 8.9 9.2 10.6 10.0
Endowment and investment income 0.6 0.7 0.9 2.7 2.3
Total income 100.0 100.0 100.0 100.0 100.0
Analysis of expenditure (% of expenditure)
Staff costs 54.1 53.4 56.1 57.3 57.9
Other operating expenses 35.8 37.1 34.4 33.3 32.4
Depreciation 6.7 5.9 7.0 6.6 6.5
Impairment 1.3 1.1 – – –
Interest payable 2.1 2.5 2.5 2.8 3.2
Total expenditure 100.0 100.0 100.0 100.0 100.0
Operating surplus/(deficit) as a % of total income 3.9 1.8 1.5 1.8 (1.8)
Indicators of financial strength Days ratio of available funds**to total expenditure*** 104.2 90.5 50.3 45.8 60.3The number of days expenditure that could be sustained from available funds
% Ratio of long-term liabilities** to total net assets 22.4 24.0 24.7 21.0 18.8Measures the extent to which an institution is funded by long-term debt
Indicators of liquidity and solvency
Ratio of liquid assets to current liabilities 0.73 0.94 0.99 0.95 0.75Extent to which current liabilities could be met from cash and liquid investments
Days ratio of liquid assets to total expenditure*** 77.5 97.6 105.9 98.4 73.5Days that total expenditure could be met from cash and liquid investments
Ratio of current assets to current liabilities 1.18 1.48 1.41 1.45 1.54Extent to which current liabilities could be met from current assets
Days of total income**** represented by debtors 41.8 50.0 40.7 45.9 51.1Days of total income (excluding Funding body grants) represented by debtors
* Restatement due to retrospective implementation of the 2007 SORP: “Accounting for Further and Higher Education” and to reflect consolidation of the Exeter University Foundation (first consolidated in financial statements 2007/08)
** Excluding FRS17 pension liability/reserve
*** Excluding depreciation and FRS17 expenditure
**** Excluding FRS17 income
F I V E Y EAR SUMMARY ACCOUNTS
These pages do not form part of the Statutory Financial Statements:
FURTHER ANALYSIS
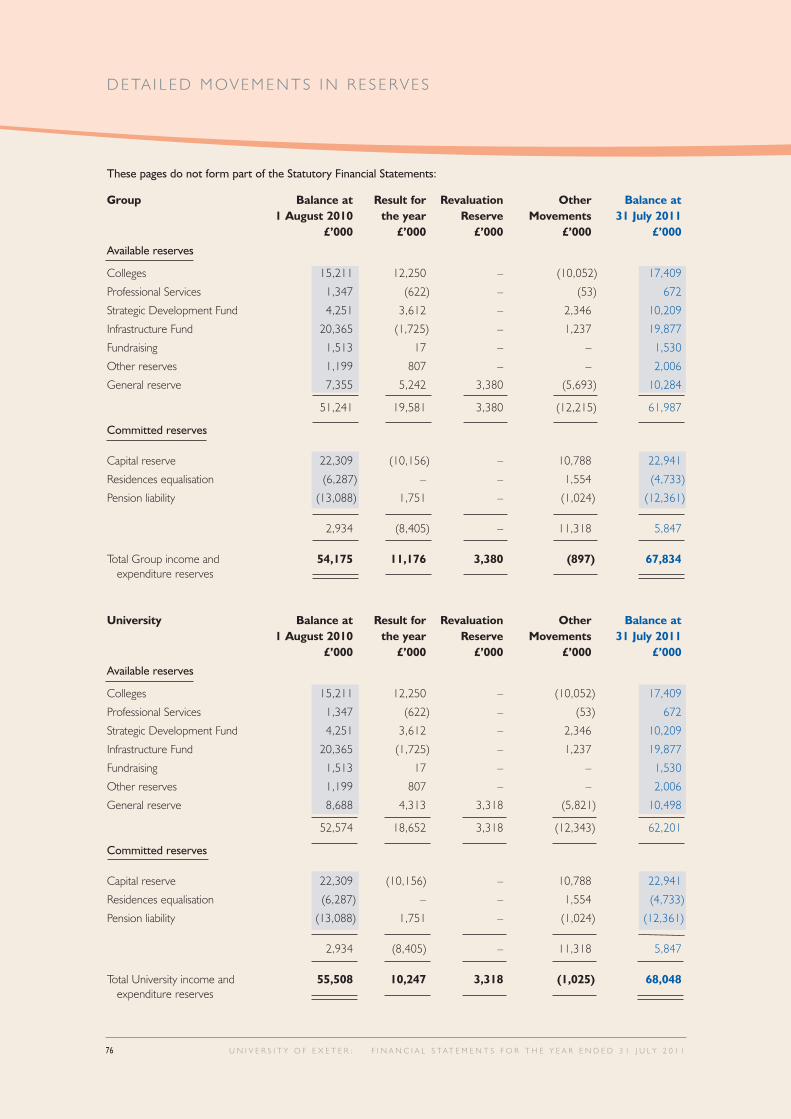
DETA I L ED MOVEMENTS IN R E S ERVE S
These pages do not form part of the Statutory Financial Statements:
76 U N I V E R S I T Y O F E X E T E R : F I N A N C I A L S TAT E M E N T S F O R T H E Y E A R E N D E D 3 1 J U L Y 2 0 1 1
Group Balance at Result for Revaluation Other Balance at1 August 2010 the year Reserve Movements 31 July 2011
£’000 £’000 £’000 £’000 £’000
Available reserves
Colleges 15,211 12,250 – (10,052) 17,409
Professional Services 1,347 (622) – (53) 672
Strategic Development Fund 4,251 3,612 – 2,346 10,209
Infrastructure Fund 20,365 (1,725) – 1,237 19,877
Fundraising 1,513 17 – – 1,530
Other reserves 1,199 807 – – 2,006
General reserve 7,355 5,242 3,380 (5,693) 10,284
51,241 19,581 3,380 (12,215) 61,987
Committed reserves
Capital reserve 22,309 (10,156) – 10,788 22,941
Residences equalisation (6,287) – – 1,554 (4,733)
Pension liability (13,088) 1,751 – (1,024) (12,361)
2,934 (8,405) – 11,318 5,847
Total Group income and 54,175 11,176 3,380 (897) 67,834expenditure reserves
University Balance at Result for Revaluation Other Balance at1 August 2010 the year Reserve Movements 31 July 2011
£’000 £’000 £’000 £’000 £’000
Available reserves
Colleges 15,211 12,250 – (10,052) 17,409
Professional Services 1,347 (622) – (53) 672
Strategic Development Fund 4,251 3,612 – 2,346 10,209
Infrastructure Fund 20,365 (1,725) – 1,237 19,877
Fundraising 1,513 17 – – 1,530
Other reserves 1,199 807 – – 2,006
General reserve 8,688 4,313 3,318 (5,821) 10,498
52,574 18,652 3,318 (12,343) 62,201
Committed reserves
Capital reserve 22,309 (10,156) – 10,788 22,941
Residences equalisation (6,287) – – 1,554 (4,733)
Pension liability (13,088) 1,751 – (1,024) (12,361)
2,934 (8,405) – 11,318 5,847
Total University income and 55,508 10,247 3,318 (1,025) 68,048expenditure reserves

CHANCELLOR
Baroness Floella Benjamin, OBE HonDLitt Exon
PRO -CHANCELLORS
K Russell Seal, BA HonDSc KeelePeter Lacey, BSc BArch Bath RIBARichard M P Hughes (Finance), MA Oxon FCA
V ICE-CHANCELLOR AND CHIEF EXECUTIVE
Professor Sir Steven M Smith, BSc MSc PhD S’ton AcSS FRSA
DEPUTY V ICE-CHANCELLORS
Professor Neil Armstrong, BEd MSc Lough PhD Exon DSc Exon CBiolFIBiol FRSH FRSA
Professor Janice M Kay, BA Newc PhD Cantab AFBPsSProfessor Mark Overton, BA Exon MA PhD CantabProfessor Nick Talbot, BSc PhD UEA
REGISTRAR AND DEPUTY CHIEF EXECUTIVE
David J Allen, OBE BA MEd Wales
DIRECTOR OF F INANCE AND DEPUTY REGISTRAR
Jeremy C Lindley, BSoc Sci Bham ACA
DIRECTOR OF ACADEMIC SERV ICES
Michele I Shoebridge, BA (Hons), PG Dip.Lib MA
BANKERS
National Westminster Bank plc Barclays Bank plcStocker Road 3 Bedford StreetExeter ExeterEX4 4RH EX1 1LX
INVESTMENT MANAGERS
From 9 November 2011 Until 8 November 2011J P Morgan International Investec Wealth & Investment LimitedBank Ltd (formerly Rensburg Sheppards)125 London Wall 2 Gresham StreetLondon LondonEC2Y 5AJ EC2V 7QN
EXTERNAL AUDITORS INTERNAL AUDITORS
KPMG LLP Mazars LLPPlym House Clifton Down House3 Longbridge Road Clifton DownPlymouth BristolPL6 8LT BS8 4AN
Total income up 8% to £246 million – up 50% since 2007
International student numbers reach 3,450 –up 156% since 2007
£62 million direct capital investment in year –£372 million on campus investment since 2006
Historic cost operating surplus £14 million –increasing every year from £0.8 million in 2007
Net assets up 15% to £458 million Long termliabilities to net assets only 22.4% See page 75
As you read these financial statements you will see that2010/11 has been another very successful year for theUniversity of Exeter. These highlights show that we havecome a long way in a relatively short period of time interms of growth, financial performance and recognitionamongst our peers.
At the same time our students achieve ever higher entrytariffs, our drop-out rates are low, student satisfactionremains consistently ‘top ten’ and our research base is rapidly growing in both size and international reputation.
This performance reflects the rewards from the strategicobjectives undertaken and implemented by the Universityand its staff over a number of years now. These initiatives are all aligned with our aim to be a world-class, research-ledUniversity which retains its student-focused philosophy anddrive for academic excellence. We have reorganised ourColleges; internationalised our student base and ourresearch; redirected resources to support our faculty andstudents; continued to invest in top academics and tosupport their research, their teaching and the wider transfer of knowledge.
However, this only tells a part of the story. The coming yearsmark a period of significant change for both the Universityand the sector as a whole. As the future of Higher Educationand the new funding regime becomes clearer we nowrecognise that our past investments and achievements havepositioned us well to benefit from these changes. But ourefforts must continue.
Over several years we have invested heavily in ourinfrastructure – at our campuses in Exeter and at ourTremough Campus in Cornwall – and this continues. You will read more about these ongoing investments –
FOREWORD
These pages do not form part of the Statutory Financial Statements

Financial Statements for the year ended 31 July 2011
UNIVERSITY OF EX
ETER
FINANCIAL STA
TEMENTS FO
R THE YEAR EN
DED 31 JU
LY 2011
Please recycle this brochure when you have finished with it.
Northcote HouseThe Queen’s DriveExeter EX4 4QJ
Telephone: +44 (0)1392 723146Fax: +44 (0)1392 723060
www.exeter.ac.uk
2011CORP172
100% recycled :


