

UNIVERSITY OF WALESINSTITUTE OF NON-NEWTONIAN FLUID MECHANICS
CONFERENCE ON INDUSTRIAL RHEOLOGY
Hoole Hall Hotel, Chester5 - 7 April 2004
PROGRAMME
27. Mar. 2004

PROGRAMME
Monday 5 April - Afternoon
12:30 Lunch
Session 1 Chairman: K Walters
14:00 - 14:40 D V BogerSomething old , something new, and something very new in industrial rheology
14:40 - 15:20 J R A PearsonThe role of diffusion in non-Newtonian fluid mechanics
15:20 - 15:45 D R OliverSimultaneous shear and squeezing flow applied to a ceramic paste
15:45 - 16:15 Coffee/Tea
Session 2 Chairman: K Walters
16:15 – 16:45 I EmriThe effect of boundary conditions on structure formation of PA fibers
16:45 - 17:15 G N GreavesSolid state rheology of zeolites under thermobaric stress
17:15 - 17:40 B DebbautThe double convected pom-pom model: a numerical validation for the contraction flow
17:40 - 18:05 E I FrenkinThermophysical characteristics of PP/LCP blends under high pressure
19:30 Dinner
27. Mar. 2004

PROGRAMME
Tuesday 6 April - Morning
Session 3 Chairman: M H Wagner
09:00 - 10:00 H M LaunThirty years of industrial polymer rheology at BASF
10:00 - 10:25 P MoldenaersMorphology development of two-phase blends during capillary flow
10:25 - 10:55 Coffee/Tea
Session 4 Chairman: M H Wagner
10:55 - 11:35 C GallegosRheology of recycled-EVA modified bitumen
11:35 - 12:05 M P EscudierExperiments and numerical simulations of laminar viscoelastic flow throughsudden expansions
12:05 – 12:30 J M MaiaInfluence of the operating conditions on the gelatinisation of rice flour during extrusion
12:30 - 14:00 Lunch
27. Mar. 2004

PROGRAMME
Tuesday 6 April - Afternoon
12:30 – 13:45 Lunch
Session 5 Chairman: A R Davies
13:45 - 14:40 H A BarnesThirty years of industrial dispersion rheology at Unilever
14:40 - 15:20 J-M PiauMacro and micro rheometry of carbopol gels
15:20 - 15:45 H P HürlimannA new multipass-type polymer compounding machine approaches industrial application
15:45 - 16:15 Coffee/Tea
Session 6 Chairman: A R Davies
16:15 - 16:55 D G BairdRheology of highly filled polymers using squeezing flow
16:55 - 17:35 M H WagnerMelt rheology of industrial polymers: relating stress to strain and energy
17:35– 18:00 O KulikovThe use of thermoplastic and raw elastomers to delay the melt fracture onset in extrusion of polyethylene
19:00 for 19:30 Conference Dinner
27. Mar. 2004

PROGRAMME
Wednesday 7 April - Morning
Session 7 Chairman: P Townsend
09:00 - 09:40 G C MaitlandComplex fluids for hydrocarbon recovery - rheology in extremus
09:40 - 10:20 R KeuningsThe CRAFT tube model: a new constitutive equation for blends of entangled linear polymers
10:20 - 10:45 Ch BaillyPrediction of linear viscoelastic properties from molecular structure for blends of linear and x entangled polymers
10:45 - 11:15 Coffee/Tea
Session 8 Chairman: P Townsend
11:15 - 11:40 F T PinhoOptimisation of profile extrusion dies: numerical and experimental work
11:40 - 12:00 F Chinestraα-NEM and model reduction: two new and powerful numerical techniques for simulating complex flows
12:00 - 12:30 O WallevikRheology of coarse particle suspensions such as fresh concrete
12:30 End of Conference
27. Mar. 2004

Experiments and numerical simulations of laminarviscoelastic flow through sudden expansions
M P Escudier1, P J Oliveira2, F T Pinho3, A Afonso3 and R J Poole1
1Department of Engineering, University of Liverpool, UK2Departmento de Engenharia Electromecanica, Universidade da Beira Interior,
Portugal3Departamento de Engenharia Mecanica, Universidade do Minho, Portugal
Industrial Rheology Conference, Hoole Hall, Chester, UK. April 5th –7th 2004

Outline
• Introduction
• Expansion geometry
• Fluid Rheology
(Shear rheology, N1, extensional viscosity)
• Approach flow (smooth contraction)
• Downstream flow (sudden expansion)
• Conclusions
Introduction
• Experimental and numerical investigation of laminar viscoelastic fluid flowthrough a plane sudden expansion of expansion ratio (D/d) 1.43 and aspectratio (w/h) 13.3.
Why?• Investigate viscoelastic fluid flow in a basic geometry which exhibits
interesting fluid-dynamic behaviour.
• Extend previous studies (Re < 1) to higher Reynolds numberswhere inertia starts to play an important role.
• Are there qualitative changes compared to Newtonian fluidflow? Is the flow 2D?
• Extend previous studies by providing L.D.A velocity data forquantitative comparisons with numerical simulations.
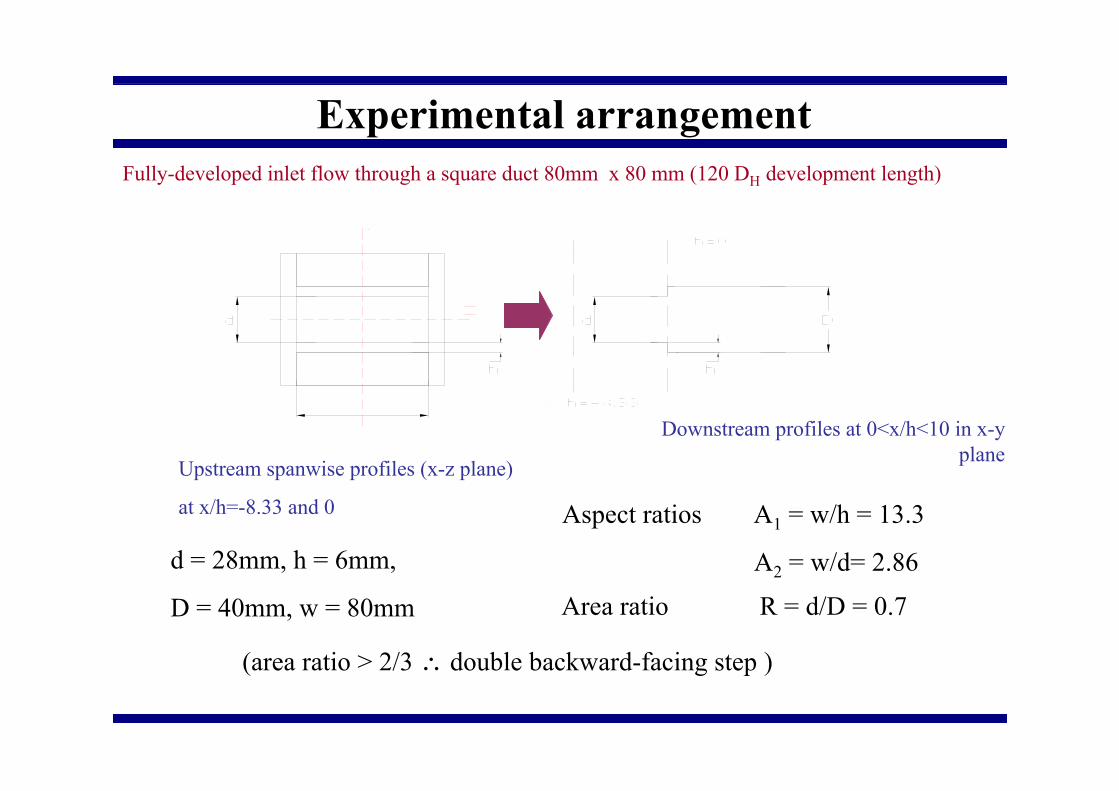
Experimental arrangement
Area ratio R = d/D = 0.7
Upstream spanwise profiles (x-z plane)
at x/h=-8.33 and 0
d = 28mm, h = 6mm,
D = 40mm, w = 80mm
Fully-developed inlet flow through a square duct 80mm x 80 mm (120 DH development length)
(area ratio > 2/3 ! double backward-facing step )
Downstream profiles at 0<x/h<10 in x-yplane
Aspect ratios A1 = w/h = 13.3
A2 = w/d= 2.86

RheologyFluid: Polyacrylamide (PAA) Seperan AP 273 E 0.05%, 0.1% 0.4% w/wincluding Carreau-Yasuda (5-parameter) model fits
c
BhUµ
!=Re
hUB
C =!!
Figure 2.4: Viscosity versus shear rate for various concentrations of polyacrylamide(including Carreau-Yasuda fit)
Shear rate (1/s)
Viscosity(Pas)
10-3 10-2 10-1 100 101 102 103 10410-3
10-2
10-1
100
101
102
0.05%0.1%0.4%CY fit
!c

Rheology
Fluid: Polyacrylamide (PAA) Seperan AP 273 E 0.1%, 0.4% w/w
! (Pa)
Firstnormalstressdif fere nceN1(Pa)
100 101 102101
102
103
0.4%PAA
0.1%PAA
N1 = a!b
! (Pa)
N1/2!
100 101 102
100
101
0.1%PAA
0.4%PAA
N1/2! > 0.5

Extensional rheology
Fluid: Polyacrylamide (PAA) Seperan AP 273 E 0.05%, 0.1%,0.2% and 0.4% w/w
Thermo Haake CaBER Extensional rheometer
0
200
400
600
800
1000
1200
1400
1600
0 0.05 0.1 0.15 0.2 0.25 0.3 0.35 0.4 0.45
% concentration of PAA (w/w)
Ext
ensi
onal
vis
cosi
ty (
Pa.
s)

EXTµ!µ0µ
Extensional rheology
160 000915069.371620.4
115 0004110879.4426.60.2
125 000635484.378.830.1
165 0007604662.820.6140.05
(Pa.s)(mPa.s)(Pa.s)c
(%)0µ
µEXT!µ
µEXT
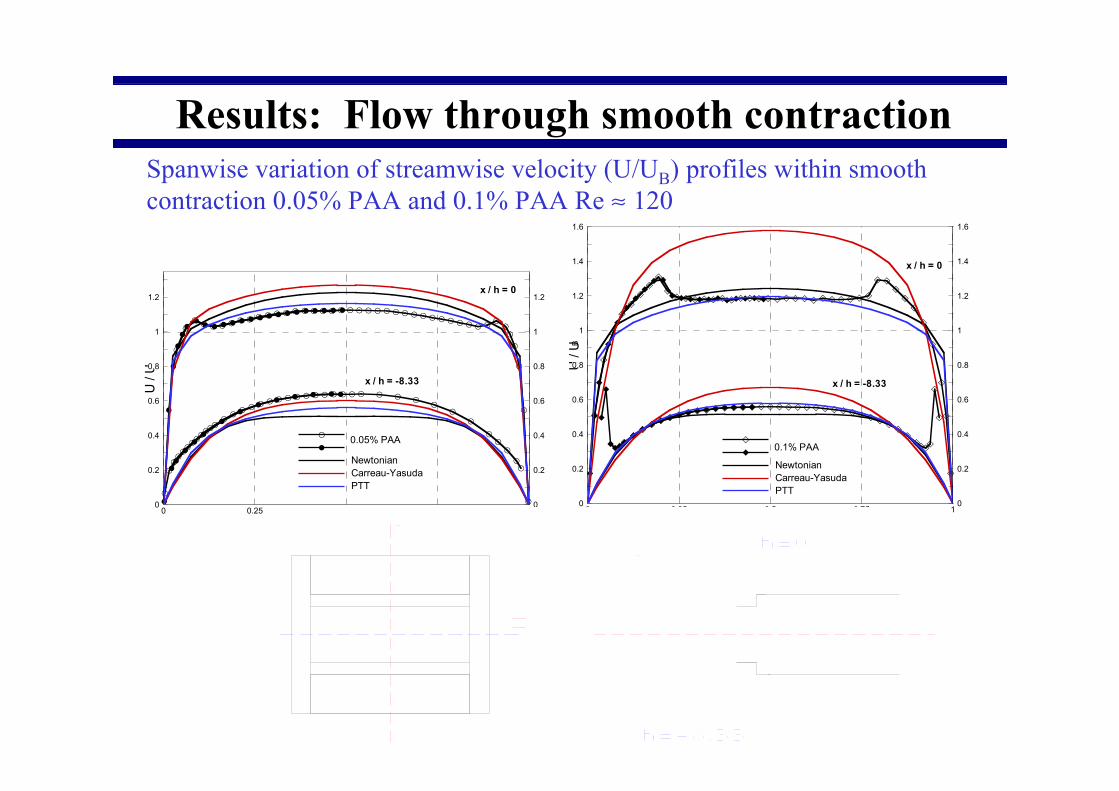
Results: Flow through smooth contractionSpanwise variation of streamwise velocity (U/UB) profiles within smoothcontraction 0.05% PAA and 0.1% PAA Re " 120
Figure : Spanwise variation of mean streamwise velocity ( U/UB ) profiles for 0.1% PAA
z / w
U/UB
0 0.25 0.5 0.75 10
0.2
0.4
0.6
0.8
1
1.2
1.4
1.6
0
0.2
0.4
0.6
0.8
1
1.2
1.4
1.6
NewtonianCarreau-YasudaPTT
x / h = 0
0.1% PAA
x / h = -8.33
Figure : Spanwise variation of mean streamwise velocity ( U/UB ) profiles for 0.05% PAA
z / w
U/UB
0 0.25 0.5 0.75 10
0.2
0.4
0.6
0.8
1
1.2
0
0.2
0.4
0.6
0.8
1
1.2
NewtonianCarreau-YasudaPTT
x / h = 0
0.05% PAA
x / h = -8.33

Figure : Spanwise variation of mean streamwise velocity ( U/UB ) profiles for 0.1% PAA
z / w
U/UB
0 0.25 0.5 0.75 10
0.2
0.4
0.6
0.8
1
1.2
1.4
1.6
1.8
2
0
0.2
0.4
0.6
0.8
1
1.2
1.4
1.6
1.8
2
0.4% PAANewtonianCarreau-YasudaPTT
x / h = 0
Results: Flow through smooth contraction
Figure : Spanwise variation of mean streamwise velocity ( U/UB ) profiles for 0.1% PAA
z / wU/UB
0 0.25 0.5 0.75 10
0.2
0.4
0.6
0.8
1
1.2
1.4
1.6
1.8
2
0
0.2
0.4
0.6
0.8
1
1.2
1.4
1.6
1.8
2
PTT0.4% PAA
y/D = 0.3
x / h = 0 y/D = 0.5
y/D = 0.4
y/D = 0.20
y/D = 0.25
Spanwise variation of streamwise velocity (U/UB) profiles within smoothcontraction 0.4% PAA Re " 5

Results: Flow downstream of expansionStreamwise velocity (U/UB) profiles downstream of expansion for 0.05% PAA Re=120
Figure : Streamwise velocity ( U/UB ) profiles for 0.05% PAA Re =185
y/D
0
0.05
0.1
0.15
0.2
0.25
0.3
0.35
0
0.05
0.1
0.15
0.2
0.25
0.3
0.35
Newtonianx/h0 1 2 3 4
1U = 0
PTTCarreau-Yasuda

Results: Flow downstream of expansionStreamwise velocity (U/UB) profiles downstream of expansion for 0.05% PAA Re=120
Figure : Mean streamwise velocity ( U/UB ) profiles for 0.05% PAA
y/D
0
0.05
0.1
0.15
0.2
0.25
0.3
0.35
0
0.05
0.1
0.15
0.2
0.25
0.3
0.35
Newtonianx/h5 6 8 10
1
7
U = 0
XR = 7.5
PTTCarreau-Yasuda

Results: Flow downstream of expansionStreamwise velocity (U/UB) profiles downstream of expansion for 0.1% PAA Re=120
Figure : Mean streamwise velocity ( U/UB ) profiles for 0.1% PAA
y/D
0
0.05
0.1
0.15
0.2
0.25
0.3
0.35
0
0.05
0.1
0.15
0.2
0.25
0.3
0.35
PTTx/h0 1 2 3 4
1
U = 0
XR = 2.3
Newtonian Carreau-Yasuda

Results: Flow downstream of expansionStreamwise velocity (U/UB) profiles downstream of expansion for 0.1% PAA Re=120
Figure : Mean streamwise velocity ( U/UB ) profiles for 0.1% PAA
y/D
0
0.05
0.1
0.15
0.2
0.25
0.3
0.35
x/h5 6 7 8 10
1
Newtonian PTTCarreau-Yasuda

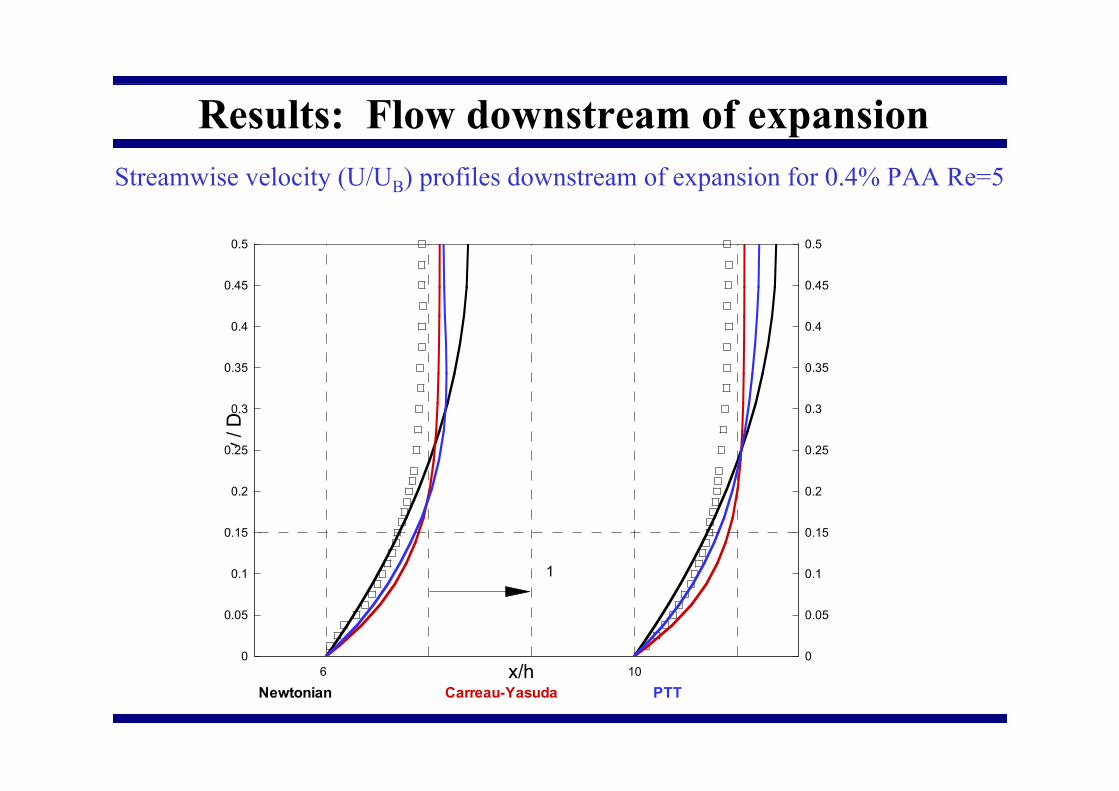
Results: Flow downstream of expansionStreamwise velocity (U/UB) profiles downstream of expansion for 0.4% PAA Re=5
Figure : Mean streamwise velocity ( U/UB ) profiles for 0.4% PAA
y/D
0
0.05
0.1
0.15
0.2
0.25
0.3
0.35
0.4
0.45
0.5
PTT0 1 2 3 4
1
x/h
No recirculation
Newtonian Carreau-Yasuda
Results: Flow downstream of expansionStreamwise velocity (U/UB) profiles downstream of expansion for 0.4% PAA Re=5
Figure : Mean streamwise velocity ( U/UB ) profiles for 0.4% PAA
y/D
0
0.05
0.1
0.15
0.2
0.25
0.3
0.35
0.4
0.45
0.5
0
0.05
0.1
0.15
0.2
0.25
0.3
0.35
0.4
0.45
0.5
x/h6 10
Newtonian
1
PTTCarreau-Yasuda

Conclusions
Flow through smooth contraction• Flow becomes increasingly three-dimensional (but symmetrical about x-y
centreplane) and complex with increasing concentration.• Simulations fail to predict velocity overshoot near side-walls.
Flow over double backward-facing step• Flow symmetrical about x-z centreplane.• 0.05% PAA flow predicted reasonably well by PTT model (consequence of
flow being more two-dimensional?)• 0.1% and 0.4% PAA profiles not predicted well by any model (consequence
of poor agreement through contraction and hence inlet velocity profiles?)• PTT model corrects shear-thinning “over-prediction”
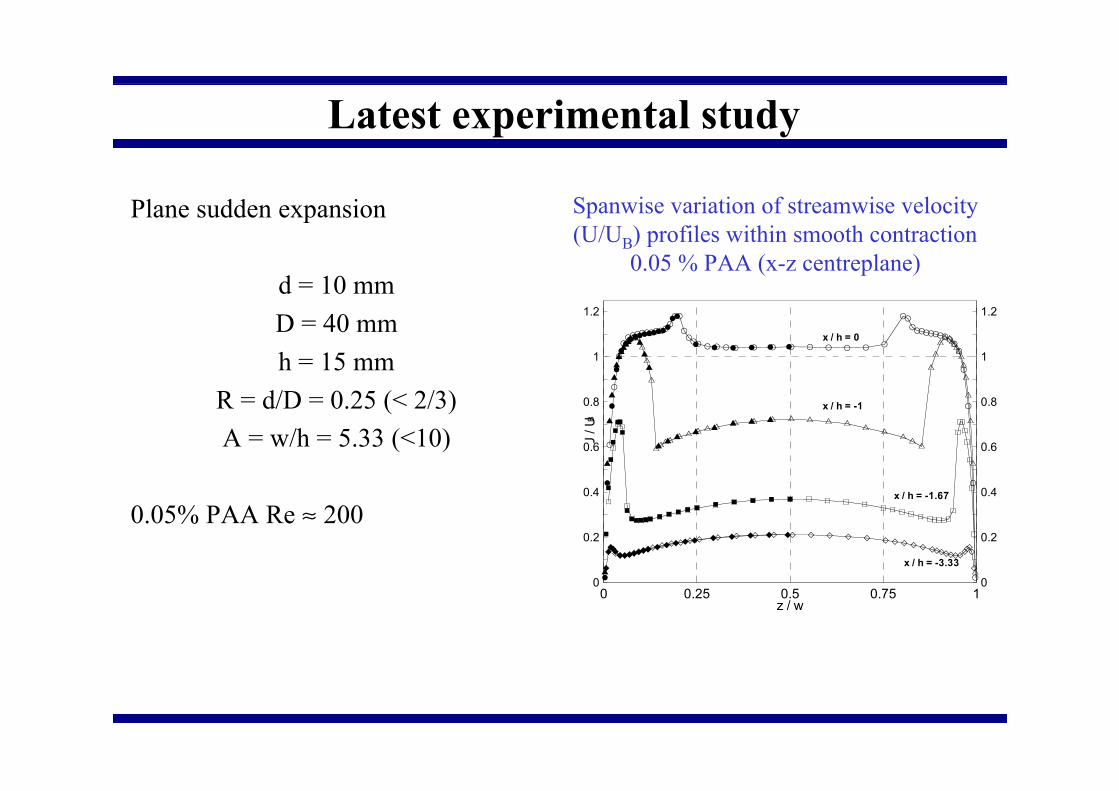
Latest experimental study
Figure : Spanwise variation of mean streamwise velocity ( U/UB ) profiles for 0.05% PAA
z / wU/UB
0 0.25 0.5 0.75 10
0.2
0.4
0.6
0.8
1
1.2
0
0.2
0.4
0.6
0.8
1
1.2
x / h = 0
x / h = -3.33
x / h = -1.67
x / h = -1
Plane sudden expansion
d = 10 mmD = 40 mmh = 15 mm
R = d/D = 0.25 (< 2/3)A = w/h = 5.33 (<10)
0.05% PAA Re " 200
Spanwise variation of streamwise velocity(U/UB) profiles within smooth contraction
0.05 % PAA (x-z centreplane)


