

Upper Watershed Health Effects on Downstream UsersWater and Natural Resources Committee 9/7/2021
Dr. Connie MaxwellWater and Community Collaboration Lab Leader, NM WRRI
Yasser AlmalkiM.S. Student, Animal and Range Sciences Dept., NMSU
Dr. Sam FernaldProfessor of Watershed Management NMSU
NM WRRI, Director
1
The New Mexico Water Resource Research Institute (NM WRRI) (est. 1963) supports water research for improved water management. It is one of 54 national water institutes supported by the USGS (US Water Resources Research Act). It is located at NMSU and serves all of NM as the water research institute of NM (Statute NMSA 1978 21-8-40).
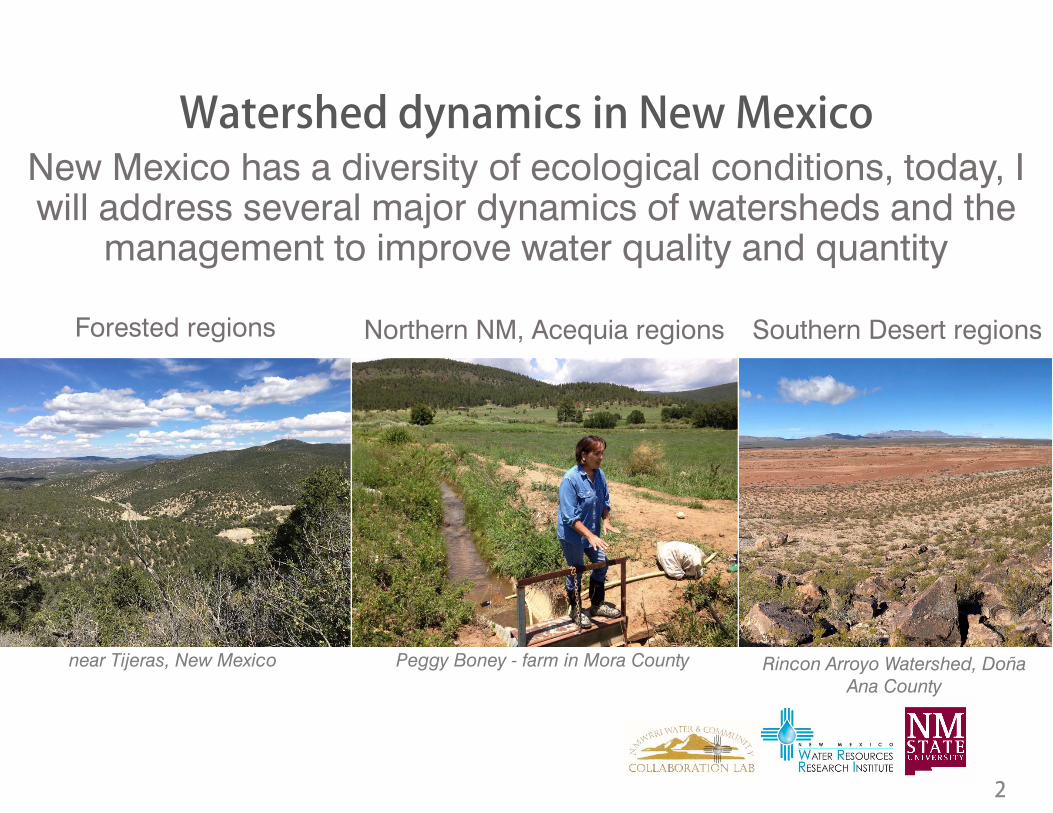
Watershed dynamics in New MexicoNew Mexico has a diversity of ecological conditions, today, I will address several major dynamics of watersheds and the
management to improve water quality and quantity
2
Southern Desert regionsForested regions Northern NM, Acequia regions
Peggy Boney - farm in Mora Countynear Tijeras, New Mexico Rincon Arroyo Watershed, Doña Ana County

Watershed Dynamics in Forested Regions
3
Issue: Woody plant encroachment into
grasslands and savannas

Understory vegetation and runoff response to thinning of a pinon-juniper woodland: Santa Fe Ranch
4
0
200
400
600
800
1000
2009 2014 2019 2009 2014 2019
Grass Forb
(Kg/
ha)
Plant Type
The average of herbage production from unthinned and thinned pinon-juniper
woodland in 5 and 10 years post-treatment
Unthinned
Thinned*
*
Study on 3 watersheds paired with 3 control watersheds (untreated)
Results: I) Thinning increased grass cover, II) In this area with low precipitation levels, did not have significant effect on annual runoff1,2.1. Ochoa, C., Fernald, A., Tidwell, V., 2008. Rainfall , Soil Moisture , and Runoff Dynamics in New Mexico Piñón-Juniper Woodland Watersheds. USDA Forest Service Proceeding RMRS-P-51. 67–74.
2. Almalki, Y., Fernald, A., Cibils, A., Cram, D., Ochoa, C.G., Steiner, R.L., 2015. Understory vegetation and soil moisture response to thinning piñón-juniper woodlands. New Mexico State University.

Santa Fe Ranch and similar study results for stakeholder goals to increase downstream water yield
• In order to detect increase in water yield, a high amount of precipitation is needed. No water yield increases below 18’’ annual precipitation. The precipitation is too low to increase water yield by clearing trees3,4.
• Managing ponderosa forests for water yield and water quality: Water yield increase occurs in spring (when least needed); Usually need to remove more than 50% of basal area to increase water yield; Even with 100% tree removal, water yield will temporarily increase by 25% maximum or much less3,4.
• In general, forest clearing has many benefits, but studies are not supporting the strategy an easy source of lots of water for New Mexico4.
5
3. MacDonald, L.H., Stednick, J.D., 2003. Forests and Water: A State-of-the-Art Review for Colorado. Chapter2. PPT 7-9. CWRRI Complet. Rep. 65.4. Fernald, A.. Watershed Management Presentation RGSC 318/518. New Mexico State University.

Runoff and sediment yield in areas subjected to four different forest thinning operations in a
northern New Mexico mixed-conifer forest near Mora
6
Study: Effect of four different forest thinning operations on
hydrological function
Results: Significantly longer time to peak flow, indicating lower flow
energy, and lower sediment yield, indicating less erosion
Atalar, F., O. Beyazoglu, A. Fernald, O. Burney, D. VanLeeuwen, and D. Cram. 2021. A case study of runoff and sediment yield in areas subjected to different forest thinning operations in a northern New Mexico forest. Journal of Soil and Water Conservation.

Simulated browsing and soil-plant water dynamics in relation to sapling size and density:
Corona – Savanna ecosystem
7
Study to determine how different types of thinning effect soil moisture and understory. Study is still running, with initial results indicating:
1) Simulated browsing (sapling defoliation) frees up (retains) detectable amounts of soil moisture, which results in increased runoff, increased understory growth, and new seedling establishment.
2) The effects of defoliation are contingent on sapling size and stand density.

8https://aces.nmsu.edu/pubs/_ritf/RITF86/welcome.html
Research on the potential hazards of a wildfire
The community of La Jara, New Mexico, relies on perennial surface water from the La Jara Watershed for drinking and irrigation. The community’s drinking water treatment infrastructure is located just one half-mile from the base of this watershed in the direct path of a potential debris flow.
Results found that if there ever were a wildfire a high probability of a debris flow even with a common rain event due to the current fuel load. Reduction treatments, such as thinning followed by prescribed fire and so-called “fire use for resource benefit,” have been shown to reduce subsequent fire severity, thereby reducing the potential for damaging postfire debris flows.

Acequia irrigation system clues to water resilience
9
Dr. Fernald presented results of NM WRRI research on Acequias at the August 12th WNRC meeting
https://aces.nmsu.edu/pubs/research/water/RR796/welcome

River flow
Crop seepage into soil
Acequias perform the function of floodplains, storing and conveying water slowly
The farmers spread flow across the floodplain fields, where it infiltrates into the soil, is stored and released slowly to the river, as well as recharges groundwater, which also contributes to surface flow
Valley Bottom
Ditch
10
Valley in Alcalde, NM
Groundwater

Acequias delay spring runoff that is projected to be earlier in the year
11
0
500
1000
1500
2000
2500
J F M A M J J A S O N D
Flow
(cub
ic fe
et/s
econ
d)
Month
Rio Grande at Embudo mean dailyflow
Climate change scenario earlierrunoff
Acequia modulated later runoff
CLIMATE
ACEQUIAS
Acequias mimic snowpacks, they perform the same delay function by storing water and releasing it slowlyThat delay can help offset some of the effects of climate change, which result in snowpack melting earlier

One result of protecting Acequias is the protection of surface water flows for downstream users
12
~60% increase in
non-irrigated (fallowed) lands over 79 years
Sabie, R., A. Fernald, and M. Gay. 2018. Estimating land cover for three acequia-irrigated valleys in New Mexico using historical aerial imagery between 1935 and 2014. The Southwestern Geographer 21:36-56.
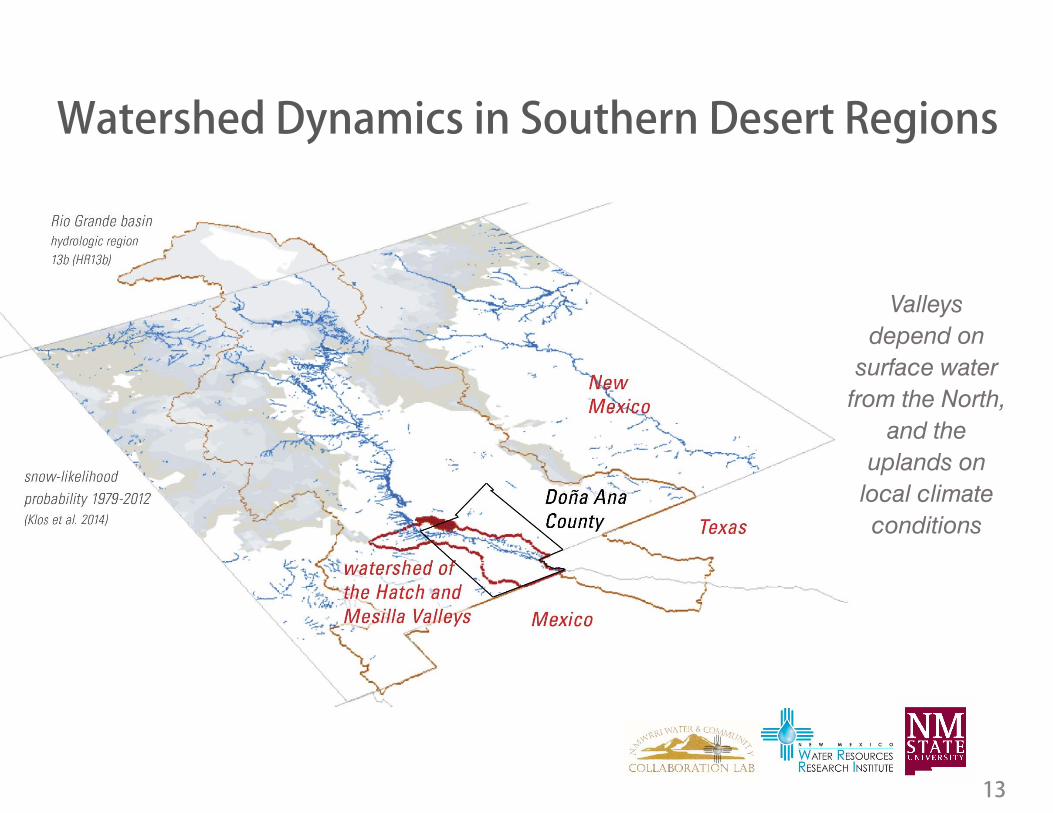
Watershed Dynamics in Southern Desert Regions
13
Valleys depend on
surface water from the North,
and the uplands on
local climate conditions

Hatch and Mesilla Valley Watershed
Planning Process
14
Preliminary identified issues by stakeholders:
1) Increasing erosion and flooding from degraded upper watersheds
2) Water scarcity and aquifer depletion
3) Urban development in arroyo flow zones
4) Increase coordination to achieve goals and reduce conflict
5) Coordinated watershed planning efforts in the National Monument

Understand and
manage the natural dynamics
15
• Maxwell, C. M., A. G. Fernald, D. Cadol, A. M. Faist, and J. P. King. 2021. Managing flood flow connectivity to landscapes to build buffering capacity to disturbances: An ecohydrologic modeling framework for drylands. Journal of Environmental Management 278:111486.
• Opperman, J. J., R. Luster, B. A. McKenney, M. Roberts, and A. W. Meadows. 2010. Ecologically functional floodplains: connectivity, flow regime, and scale. JAWRA Journal of the American Water Resources Association 46:211-226.
Vegetationcoverage
Drought, highertemperatures,
land use /management
High-intensitystorm
Infiltration andrecharge
Flood volumeand energy
ErosionSoils back uparroyos, Rio
Grande
Increasedflooding
Management tospread and slow
flow
increasethese
processes
decreasethese
processes
Soil moisture andgroundwater
aquifers
Manage flow to increase
vegetation to kick start
restoration processes

On scale of restoration practices -pilot project to quantify effects
16
Restore dynamics upstream from erosion: Quantify effects on runoff, soil moisture,
vegetation coverage, and E. coli transport

On watershed scales, we synthesize complex ecosystem characteristics
17
Tool developed to identify best locations for spreading flow and how much restoration is needed to achieve goals
Topographic indicators• Upstream from erosion• Widest floodplains • Channel depth < 3.5’• Low slope areas with flow
Soil indicators• High infiltration capacity• Soil available water storage capacity (AWS)
that supports vegetation
Flow indicators• Volume• Frequency
Maxwell, C. M., A. G. Fernald, D. Cadol, A. M. Faist, and J. P. King. 2021 draft. Managing the buffering capacity of dryland watersheds using vegetation pattern indicators: An ecohydrologic modeling framework to predict the effects of connecting flood flow to the landscape. Target journal: Journal of Environmental Management.
The Rincon Arroyo
watershed in the Hatch Valley –
135 sq. mi.

On regional scales, we collaboratively develop critical understandings and evidence to inform management of the watershed
We work collaboratively with land and water managers and the larger community to understand their visions and challenges. We test the ability of strategies to achieve these visions using customized models that integrate the best science and data:• Dynamic Statewide Water
Budget Model results• Regional unique dynamics• Socio-economic factors Initial modeling has estimated strategies of flow managementthat can reduce upland flow energy and maintain enough flows for valley aquifer recharge.
18

19
Thank you!
Water and Natural Resources Committee 9/7/2021
Dr. Connie Maxwell, Water and Community Collaboration Lab Leader, NM WRRI
Yasser Almalki, M.S. Student, Animal and Range Sciences Dept., NMSU
Dr. Sam Fernald, Professor of Watershed Management NMSU, NM WRRI, Director


