

WHAT IF...
energy accountability series
ENERGY PRODUCTION WAS BANNED ON FEDERAL LANDS AND WATERS?

OUR MISSIONThe mission of the U.S. Chamber of Commerce’s Institute for 21st Century Energy is to unify policymakers, regulators,
business leaders, and the American public behind a common sense energy strategy to help keep America secure,
prosperous, and clean. Through policy development, education, and advocacy, the Institute is building support for
meaningful action at the local, state, national, and international levels.
The U.S. Chamber of Commerce is the world’s largest business federation representing the interests of more than
3 million businesses of all sizes, sectors, and regions, as well as state and local chambers and industry associations.
Copyright © 2013 by the United States Chamber of Commerce. All rights reserved. No part of this publication may be reproduced or transmitted in any form—print, electronic, or otherwise—without the express written permission of the publisher.
This paper marks the first in a series of reports that we will be releasing this summer and fall, each taking a
substantive look at what might have happened in the past – or could happen in the future – if certain energy-related
ideas and policy prescriptions put forth by prominent politicians and their supporters were actually adopted. We are
calling it the Energy Accountability Series.
Certainly, one doesn’t need to look far these days to find platforms or outlets that claim to be definitive “fact-
checkers” of all manner of utterances candidates make on the campaign trail. On that, the Energy Accountability
Series will not seek to reinvent the wheel. What we are much more interested in – and what we think will be much
more valuable to voters, as well – is taking a step back to better understand (and quantify where possible) the real-
world, economy-wide consequences of living in a world in which candidates’ rhetoric on critical energy issues were to
become reality.
Too often, there is a temptation to dismiss statements made by candidates as things said “off the cuff, or in the “heat
of the moment,” or offered up merely to “appeal to their base.” This is incredibly cynical, and it needs to change. A
candidate’s views and the things he or she says and does to win the support of interest groups have a real impact on
how policy is shaped, and ultimately implemented. That is especially true on energy issues today, as groups continue
to advance a “Keep It In the Ground” agenda that, if adopted, would force our country to surrender the enormous
domestic benefits and clear, global competitive advantages that increased energy development here at home have
made possible. Accordingly, candidates and public opinion leaders should be taken at their word, and this series will
evaluate what those words mean.
The Energy Accountability Series will ask the tough questions and provide quantitative, clear-eyed answers on the
full impacts and implications of these policies, and it will do so irrespective of which candidates, groups or political
parties happen to support or oppose them. Our hope is that these reports help promote and inform a fact-based
debate of the critical energy issues facing our country. Armed with this information, voters will have the opportunity
this fall to make the right choices for themselves and their families.
6
energy accountability series
About the

The public debate over federal-lands energy
development has changed significantly in
recent years. Less than a decade ago, only the
most extreme members of Congress were
antagonistic enough to argue against energy
development on federal lands. In the face of
rising gasoline prices, companies engaged in the
exploration and production of oil and natural gas
on federally controlled acreage were actually
criticized for not developing their leases fast
enough.
However, today it is quite rare to find bipartisan
support for energy development on federal
lands, with the 2016 Democratic Party Platform
aggressively proposing a “phase down” of energy
development. Prominent Democrats have
evolved from a “use it or lose it” strategy less
than a decade ago to today simply favoring a
“lose it” approach, which itself is as an offshoot
of the more transparent “Keep It In the Ground”
philosophy.
Unfortunately, this rhetoric has already
translated into anti-energy executive actions.
Under the Obama administration, federal
energy production has lagged behind a huge
expansion of oil and natural gas development
on state and private lands, in part because of
overly burdensome regulations and continued
foot-dragging on leasing decisions. Initially, the
administration appeared to support an “all of
the above” energy policy, but instead restricted
energy development on federal lands with some
of its first official actions.
In the past year alone, the Obama administration
has canceled lease sales in the Arctic and
Atlantic offshore planning areas, and even
rescinded leases that had already been issued,
including the post-hoc withdrawal in July of 25
previously awarded leases in Colorado. On other
occasions, federal agencies required to hold
quarterly onshore lease sales in western states
have decided not to comply with the law. Since
2014 federal agencies have illegally refused
to conduct 34 separate lease sales in eight
separate states.
The administration has also imposed a blanket
moratorium banning the leasing of coal on
federal lands. This is a remarkable turnaround
from the days when leading Democrats
demanded more energy production from federal
lands and pressured companies to develop their
leases as quickly as possible.
What explains the change? Principally, it is the
growing political influence of “Keep It In the
Ground” activists who reflexively oppose the
development and consumption of all fossil
fuels. These activists have relentlessly lobbied
the administration in recent years to oppose
energy projects in the name of fighting climate
change. They also benefit from a support base
in Congress, with more than 20 lawmakers in
the Senate and House supporting the “Keep It
In the Ground” Act, which would ban oil, natural
gas and coal leasing on federal lands as a first
step toward banning fossil-fuel production
everywhere.
What If Energy Production Was Banned on Federal Lands and Waters?

3
Perhaps most concerning, the “Keep It In the
Ground” concept gained major attention during
this year’s Democratic presidential primary. It
was the central plank of the energy platform
proposed by U.S. Sen. Bernie Sanders (I-Vt.) and
his rival for the Democratic nomination, former
Secretary of State Hillary Clinton, came under
intense pressure to follow suit. When asked if she
would ban fossil fuel extraction on federal lands,
Clinton responded “That’s a done deal.”
This begs an obvious, heretofore unexamined
question: What would a ban on fossil fuel
extraction on federal lands and waters
actually look like? This report, the first in the
Energy Institute’s Energy Accountability Series,
seeks to answer that very question.
To estimate the economic impacts, we examined
data on jobs, royalties and production levels
from federal lands. We then used IMPLAN,
a macro-economic model, to estimate the
overall macroeconomic effects of blocking
future energy development on federal lands.
We examined both a ban on all production –
from existing and future leases – and a ban on
future leases only. With the help of the IMPLAN
model, we quantified the “ripple” (or multiplier)
effect through the economy and ultimately to
households.
As explained in this report, the impact of a “Keep
It In the Ground” policy towards federal energy
resources would be dramatically negative,
especially in the Western U.S and Gulf of Mexico.
Yet, the prospect of such a policy is very real,
based on existing Obama administration policy
coupled with the proposals and rhetoric coming
from candidates and special-interest groups this
election season. On the following page are just a
few examples of the deeply concerning political
promises and political rhetoric that have given
such momentum to the “Keep It In the Ground”
concept.

““ ”
““
”
”“ ”
350.org activist: “What did you mean by extraction on public lands is a done deal?” Hillary Clinton: “That’s where the president is moving: No future extraction. I agree with that.” Hillary Clinton, Democratic Nominee for Preident, Feb. 4, 2016
350.org activist: “Will you support Hillary Clinton and support a ban on offshore drilling?” U.S. Sen Tim Kaine (D-Va.), vice presidential nominee,
“I actually am now in that position.
U.S. Sen. Tim Kaine (D-VA), Democratic Vice Presidential Nominee, Aug 14, 2016
We will phase down extraction of fossil fuels from our public lands.” 2016 Democratic Party Platform
“In the future, federal land – the land that is owned by all of us – will not be used for the extraction of fossil fuel: Coal, oil or gas.
U.S. Sen. Bernie Sanders (I-Vt.), Nov. 4, 2015
Let’s make our federal lands off limits, and let’s do the smart thing and keep it in the ground.” U.S. Sen. Jeff Merkley (D-Ore.), Nov. 4, 2015
“The natural place to start phasing out supply is on our public lands... Kieran Suckling, Executive Director, Center for Biological Diversity, Nov. 4, 2015
We must keep fossil fuels in the ground — starting with public lands — and transition rapidly to a clean, renewable energy future.” Micah Parkin, 350 Colorado, Nov. 9, 2015
“These public lands are one of the easiest places for us to control the flow of carbon into the atmosphere.
Bill McKibben, founder of 350.org & DNC platform committee member; Nov. 5, 2016
If President Obama is to keep his commitment to curbing climate change, he must do everything he can to keep fossil fuels in the ground and stop drilling and fracking on public lands.” Wenonah Hauter, Executive Director, Food & Water Watch, Sept. 14, 2015

3

Contents
Executive Summary
Contribution of Federal Lands and Waters to U.S. Energy Production
Regulatory Barriers Impeding Production
Scenario 1: Economic Review of Immediately Ceasing Energy Production on Federal Lands and Waters
Scenario 2: Economic Impact of Limiting Ban to Future Leasing1
Technical Appendix
What Would Individual States Lose Under a Federal Lands and Waters Production Ban?
3
7
13
17
25
27
35

1

1
EXECUTIVE SUMMARY

2
On January 15, 2016, the Obama administration
announced its decision to immediately
implement a moratorium on the leasing of
federally controlled land for coal production,
while also initiating a broader programmatic
review of the leasing program that officials
estimated would take at least three years to
complete.1
Activists aligned with the so-called “Keep It
In the Ground” effort, a campaign that has
called for the cessation of all development
and consumption of oil, natural gas and coal,
cheered the news, with Greenpeace hailing the
announcement as a “historic day.”
Three weeks after the new policy was issued,
Democratic presidential nominee Hillary Clinton
was asked after a campaign event whether she
agreed with the administration’s decision, and
also whether she would support a policy to ban
all fossil-fuel extraction on public lands. Clinton’s
response, captured on video, was “Yeah, that’s
a done deal.”2 Asked to clarify, Clinton said
“that’s where the president is moving. No future
extraction. I agree with that.”3
U.S. Sen. Bernie Sanders (I-Vt.), previously Sec.
Clinton’s main challenger for the Democratic
presidential nomination, had already staked
out a position in support of halting all fossil-
fuel extraction on public lands, including the
development of oil and natural gas.
In November 2015, he and several members of
the Senate Democratic caucus introduced the
“Keep It In the Ground Act,” which, according to
the bill text, would prohibit the Department of
the Interior from entering into “any new lease” or
“renew, reinstate, or extend any” existing lease
for the purpose of developing “onshore fossil
fuels.”4 “I applaud the president for taking bold
action,” Sanders said in a statement following the
Interior moratorium announcement. The best
way to protect the environment, he said, “is by
keeping fossil fuels in the ground.”5
Aside from statements by political figures, most
media coverage of the movement to end energy
production on federal lands to-date has only
focused on how these positions might narrowly
impact the coal industry. Various news outlets
have characterized the policy as only having a
“modest” impact on markets, while the White
House itself claimed in a June 2016 report that
it would have “no impact on [coal] capacity
investment and dispatch decisions.”6
However, this new study paints a starkly different
picture. In fact, we find that restricting or
eliminating production of oil, natural gas and
coal on federal lands would carry significant and
wide-ranging negative economic consequences.
Federal lands currently account for roughly 24
percent of our nation’s oil, natural gas, and coal
production. Development of these resources,
while dwarfed by massive production increases
on private and state-controlled acreage, has
substantially contributed to the recent energy
development renaissance that the United States
has experienced and has made a meaningful
and positive impact by lowering energy prices
for consumers and dramatically reducing energy
imports from abroad.
Instituting a ban on future federal-lands leasing
and stopping the current production of these
resources would increase energy prices for
consumers by removing low-cost resources
from the available supply stream. The impact
would be immediate and severe to the U.S.
economy, leading to the loss of hundreds of
thousands of American jobs, and robbing the

3
federal government and primarily Western states
of potentially billions of dollars in revenues in the
form of lost royalties.
All told, our analysis finds that stopping energy
production on federal lands and waters would
result in:
• The loss of nearly a quarter of the nation’s
current production of coal, oil and natural
gas
• The loss of more than $11.3 billion per year
in annual royalties and rental fees for federal
and state governments;7
• Over $70 billion in annual U.S. GDP
threatened; and
• The loss of more than 100,000 direct jobs
associated with energy development on
federal lands (both onshore and offshore),
impacting another 280,000 indirect and
induced jobs across the broader economy
Several U.S. states and regions would be
disproportionately affected by a cessation in
federal-lands energy development. Among them:
• Wyoming would lose 32,600 jobs (13,300
direct, 19,300 indirect and induced) and
almost $900 million in annual royalty
collections (2015), representing about 20
percent of the state’s education-related
expenditures.
• New Mexico would lose 24,300 jobs
(10,000 direct, 14,300 indirect and induced)
and $496 million in annual royalty
collections (2015), representing eight
percent of the state’s total General Fund
revenues;
• Colorado would lose 50,000 jobs (15,300
direct, 34,700 indirect and induced), and as
much as $125 million in annual royalty
collections (2015); and
• Along the Gulf Coast, the loss of
39,000 direct jobs associated with Outer
Continental Shelf oil and gas development,
and the loss of another 71,000 indirect and
induced jobs across the broader Gulf Coast
economy -- on top of $28 million in lost
annual state royalty collections (2015).
Our report also includes an analysis of the
potential impacts associated with imposing
a ban on future federal lands energy leases,
keeping intact, for now, the ability of existing
lease-holders to continue production. In the end,
our analysis finds that the economic impact
would be about the same under Scenario 2,
if just delayed slightly over time as existing
production falls off and is not replaced by new
development activities owing to the ban on the
issuance of future leases.
What if Energy Production was Banned on Federal Lands and Waters? Potential Consequences:

4
Under Scenario 2, we find that royalties
generated from federal-lands development
would decrease by more than 75 percent over
the next 15 years, with the federal government
experiencing a drop in annual royalty collections
of more than $6 billion.
States would lose out on $780 million in annual
royalties. And more than 200,000 jobs tied
directly and indirectly to existing federal-lands
development activities would also be lost. It
is possible that some of these jobs might be
“picked up” as a result of a shift in production
to private and state lands. But this would be of
minor consolation to the handful of states in
which the majority of federal-lands resource
development takes place today. For these states,
the jobs, revenue, and royalties generated by
these existing activities would be lost forever.

5
CITATIONS
1 “U.S. Halts Issuing Leases of Federal Land for Coal Mining,” Bloomberg News; Jan. 15, 2016 (http://www.bloomberg.com/news/articles/2016-01-15/u-s-halts-new-leases-of-public-land-for-coal-exploration)
2 “Clinton: Banning fossil fuels on public land a ‘done deal,’” The Hill; Feb. 5, 2016 (http://thehill.com/policy/en-ergy-environment/268397-clinton-banning-fossil-fuels-on-public-land-a-done-deal)
3 “Clinton Calls Ban on Future Extraction on Public Lands a ‘Done Deal,’” 350.org; Feb. 5, 2016 (http://350action.org/clinton-calls-ban-on-future-extraction-on-public-lands-a-done-deal)
4 “Introducing ‘Keep It in the Ground’ Bill, Sanders Goes Big on Climate,” Common Dreams; Nov. 4, 2015 (http://www.commondreams.org/news/2015/11/04/introducing-keep-it-ground-bill-sanders-goes-big-climate)
5 Sen. Sanders on Twitter, Jan. 15, 2016 (https://twitter.com/sensanders/status/688104138559729664)
6 “The Economics of Coal Leasing on Federal Lands,” Executive Office of the President; June 2016 (https://www.whitehouse.gov/sites/default/files/page/files/20160622_cea_coal_leasing.pdf)
7 Based on the Department of the Interior Office of Natural Resources Revenue (ONRR) average royalty data from 2011 through 2015.


7
1CHAPTER
CONTRIBUTION OF FEDERAL LANDS TO U.S.
ENERGY PRODUCTION

8
Over the past decade, and in particular the past
five years, development of oil and natural gas
resources in the United States has increased
significantly, driven in large part by advances
in drilling and completions technology that has
allowed producers to dramatically increase the
available supply of energy.
But because these developments have largely
taken place on state and private-controlled
lands, it’s easy to lose sight of the still-significant
role that federal lands development continues
to play in contributing to the nation’s overall
production.
Acreage administered by the federal government
includes both the 28 percent of the nation’s total
onshore land area controlled by the government,
as well as the submerged federal acreage that
exists along the Outer Continental Shelf1. In
2015, 24 percent of our nation’s coal, oil, and
natural gas was mined or extracted from federal
lands (Figure 1).
But even as the United States continues to
experience and benefit from the significant
expansion of domestic energy production in the
aggregate, the amount of energy produced on
federal lands has declined both in terms of total
volume and share of overall U.S. production.
Figure 2 highlights the steady decline that has
taken place over the past 10 years, with federal
lands previously accounting for 35 percent of
total U.S. fossil fuel production in 2006 and in
2015 only accounting for 24 percent.
These declines have come amidst a renaissance
in overall fossil fuel production in the United
States. Advances in drilling, completions, and
seismic mapping technology have fundamentally
reshaped America’s energy landscape, helping
the country increase oil production by 88
percent since 2006 and natural gas production
by 51 percent. Much of the growth in this
production has occurred in states with relatively
little federally-administered acreage, such as
Texas, North Dakota, and Pennsylvania.
The decrease in federal-lands energy production
has primarily been driven by significant drop-offs
in offshore natural gas and coal development, as
shown in Figure 3.
Offshore natural gas production, virtually all
of which takes place on submerged lands
administered by the federal government, has
decreased by more than 50 percent over the last
decade. Although federal lands’ share of coal
produced in the United States has held steady
at 40 percent over the past decade, overall coal
production has decreased by 14.5 percent.
COAL
The Powder River Basin (PRB) in Wyoming and
southern Montana is the largest and most prolific
coal-producing region in the United States. Over
the last two decades, the PRB has yielded an
annual average of 500 million short-tons of coal,
accounting for approximately 40 percent of our
nation’s coal production.
Figure 1 - Total U.S. Fossil Fuel Production (2015), (energy equivalent basis)
Source: Office of Natural Resources Revenue (ONRR)
Federal 24%

9
The PRB has historically yielded a cost-effective
and environmentally advantageous form of coal
relative to its peer basins. Coal in this region
resides relatively close to the surface, allowing
producers to access it more economically than
other reserves. These efficiencies have been
translated into cost savings that, in turn, have
helped keep electricity prices low for consumers
in the United States. In addition, the low-sulfur
content of PRB coal has allowed producers to
comply with stringent EPA regulations and to
limit the need for installing costly desulfurization
equipment at plants.
Coal production on federal, state, and private
lands across the United States has declined by
18 percent since 2006 (Figure 4). This decrease
is due in large part to three factors. First, natural
gas prices have plummeted to historically low
levels, from $9.04/MMBtu in 2008 to $3.22/
MMBtu in 2015.2 Second, massive new supplies
of thermal coal have flooded the international
market, pushing down global commodity prices
and eroding the economic viability of some
projects in the United States. And third, EPA
has instituted dramatically more restrictive
standards for air emissions, cooling water
Figure 2 - Federal Lands’ Share of U.S. Fossil Fuel Production (energy equivalence)
Source: ONRR
Figure 3 - Total Coal, Oil & Natural Gas Production on Federal Lands (Quadrillion Btu)
Source: ONRR
18.5 Quad. Btu 2006 Total
16.8 Quad. Btu 2015 Total

intakes, and coal ash containment, which has led
owners of coal-fired plants either to incur higher
costs or to shut down. These three factors have
made coal plants less cost-competitive relative
to natural gas facilities. Over the last five years,
36.5 GW of coal-fired capacity has been retired
as a result of these market and regulatory
forces.3
NATURAL GAS
Total U.S. natural gas production has increased
by an enormous amount over the past decade,
growing by 51 percent from 19.0 trillion cubic feet
(Tcf) per year in 2006 to 28.7 Tcf in 2015 (Figure
5). This has been driven by new production
volumes coming online from state and private
lands, which have nearly doubled since 2006
from 12.8 Tcf to 24.1 Tcf. Production on federal
lands, however, has declined 26 percent, from
6.2 to 4.6 Tcf during the same period. The overall
federal share of the production has declined
from 33 percent in 2006 to 16 percent in 2015.
The decline in overall federal natural gas
production has been driven principally by
the significant drop-off in federal offshore
production. Since 2006, offshore production,
which is primarily centered in the Gulf of Mexico,
has declined by 52 percent.
Meanwhile production on state and private lands
has experienced tremendous growth, primarily
driven by the shale renaissance. A large share
of this new development has taken place in
Pennsylvania, Texas, Ohio, and West Virginia –
states in which the federal government owns on
average two percent or less of total land area.
8
Figure 5 - U.S. Natural Gas Production: Federal & State/Private Areas (Tcf)
Figure 4 - U.S. Coal Production: Federal & State/Private Areas (Million Short Tons)
Source: ONRR
Source: ONRR
10

8
Figure 6 - U.S. Crude Oil Production: Federal & State/Private Lands (billion barrels)
Source: ONRR
CRUDE OIL
U.S. crude oil production also has risen
substantially since 2006. Similar to natural gas,
just about every bit of that growth has come
from non-federal lands where most of these
deposits are located. Texas, where the federal
government owns two percent of the land, and
North Dakota (four percent) in particular have
seen dramatic increases in oil production.
Federal offshore oil production, primarily in the
U.S. Gulf of Mexico, has not experienced the
11
same decline as has been the case for natural
gas. In 2015, oil production was up 7.5 percent
over the prior year, and up 19 percent since
2006. Federal onshore oil production volumes
are still relatively small, representing only five
percent of total U.S. production. Federal lands’
share of production has declined from 31 percent
in 2006 to 21 percent in 2015, driven primarily
by the high growth in state and private lands

12
production (Figure 6).
CITATIONS
1 Federal Land Ownership: Overview and Data. Congressional Research Service. Dec. 29, 2014.
2 EIA, Form EIA-860, “Annual Electric Generator Report.”
3 Ibid.

13
2CHAPTER
REGULATORY BARRIERS IMPEDING PRODUCTION

14
As production volumes of energy have continued
to decline on U.S. federal lands, additional
attention has been paid to the myriad factors
that have conspired over the past decade
to perpetuate this trend. Poor federal land
management and an onerous application
and approval process have frustrated many
potential development opportunities. Additional
regulatory requirements on developing energy
offshore currently being contemplated by policy-
makers have the potential to inflict further harm
on the long-term viability and prospectivity of
offshore projects currently being considered.
One of the primary factors that has helped
contribute to the diminution of energy resource
production on federal lands is the length and
inherent uncertainty embedded in the permitting
process. According to the Bureau of Land
Management (BLM), it takes on average 220
days for the agency to approve an Application for
Permit to Drill (APD),1 this despite a provision in
the Energy Policy Act of 2005 directing BLM to
take action on submitted APDs within 30 days.
More than half of this BLM delay (116 days) can
be traced back to the time it takes to fill out all of
the required forms. It then takes on average an
additional 104 days for BLM to complete the
permitting process (Figure 7). In comparison,
approval of submitted applications by state
regulators overseeing development on state
and private lands averages 30 days, but at times
approval can be granted in as little as 10 days.2
Myriad factors contribute to the inefficacy of
this system, but ultimately the responsibility
to fix it resides with the federal government.
In June 2014, Interior’s Inspector General (IG)
released a report finding that the agency lacked
the systems needed to ensure permits were
approved on time.3
The IG report found that it takes BLM nearly
three times as long as state regulators to
approve each permit, even when faced with the
same request circumstances and workload.
The report warned that federal, state, and local
governments as well as Native communities “risk
Figure 7 – BLM: Average No. of Days to Approve APD for Onshore Project
Source: BLM

15
losing royalties” from delayed production and
that these “delays cause some wells not to be
drilled, resulting in additional lost production and
royalties”. The IG also acknowledged that BLM
was operating on a limited budget, which led to
severe understaffing in many key administrative
and supervisory roles.4
In April 2016, the Interior Department
released new regulations on offshore energy
development in the Gulf of Mexico. Although
there remains some disagreement on how
much these new rules will cost producers, there
is no disagreement that developing offshore
resources will be made more expensive as a
result. The Interior Department estimates the
additional costs to amount to $1 billion over
10 years, while some large offshore producers
estimate costs could be as high as $25 billion
over that same period.5
In January, the Obama administration imposed
a moratorium on new coal leases on federal
lands. This action is not likely to have a near-term
impact on coal production, given that there have
only been three coal-lease applications filed
since 2006, two of which are still pending.
The Department of the Interior believes enough
coal can be extracted from existing mines to
maintain current production levels for the next
20 years.6 Nevertheless, the precedent this
regulatory action sets is a troubling one, and
under a new administration could be expanded
dramatically (and relatively easily, without the
approbation of Congress) to limit or completely
eliminate production from existing mines on
federal lands.
To answer this, we have undertaken two
separate and distinct analyses. In Scenario 1,
we look at the impacts of canceling all federal
leases immediately and the subsequent
elimination of oil, natural gas, and coal
production on federal lands.
As such, Scenario 1 provides a snapshot of
the economic output that would be lost and/
or placed at risk if energy development was
immediately stopped on all federal acreage.
Our methodology is inherently conservative
and represents the lower bands of economic
impact from such a precipitous action. While
it is possible some number of jobs and some
amount of GDP could be salvaged under
such a policy, as some production activities
shift over to non-federal lands and displaced
workers eventually find employment in other
sectors, the vast majority of this output would
be lost in the near-term.
In Scenario 2, we analyze the cumulative
impacts of immediately ceasing new leasing
while leaving existing leases untouched. Since
elected officials, candidates, and activist
organizations have made comments and put
forth proposals specifically aimed at stopping
energy production on federal lands, we felt
it was important to look at impacts from
both of these scenarios to demonstrate the
tremendous consequences that either policy
would have, especially in states that host
federal energy production.
THIS DISCUSSION leads us back to the underlying question of this report: “What if energy production was banned on federal lands and waters?”

16
CITATIONS
1 Onshore Oil & Gas Order # 1: An Overview of the Application for Permit to Drill Process Posting and Processing. http://www.blm.gov/style/medialib/blm/wo/MINERALS__REALTY__AND_RESOURCE_PROTECTION_/ener-gy/onshore_order_documents.Par.22284.File.dat/Posting %20and%20Processing.doc.
2 U.S. Chamber of Commerce Foundation, 2013. Energy Policy—Building on Abundance.
3 DOI Inspector General, 2015. Onshore Oil and Gas Permitting, U./S. Department of the Interior. https://www.doioig.gov/sites/doioig.gov/files/CR-EV-MOA-0003-2013Public.pdf.
4 Ibid. https://www.doioig.gov/sites/doioig.gov/files/CR-EV-MOA-0003-2013Public.pdf
5 View EO 12866 Meeting 1014-AA11, 2016. Blowout Prevention Systems and Well Control. http://www.reginfo.gov/public/do/viewEO12866Meeting?viewRule=true&rin=1014-AA11&meetingId=1738&acronym=1014-DOI/BSEE.
6 BLM Press Release: Secretary Jewell Launches Comprehensive Review of Federal Coal Program (January 15, 2016).

17
3CHAPTER
SCENARIO 1: ECONOMIC REVIEW OF
IMMEDIATELY CEASING ENERGY PRODUCTION ON FEDERAL
LANDS AND WATERS

18
Scenario 1 models and analyzes the impact
on economic output if the production of oil,
natural gas, and coal were immediately ceased.
In ascertaining the economic output of these
activities today, we are able to establish what is
at risk immediately on day one if this policy is
implemented as proposed.
Notwithstanding all the attention that has
been paid to the expansion of U.S. oil and gas
development on state and private lands, federal-
lands energy development continues to account
for a significant share of total U.S. energy
development. On that basis, it remains a driver
of jobs retention and wage growth for American
workers, and a critical source of revenue for
states and localities that host these activities.
Losing these jobs, resources and revenues would
have a severe, deleterious and immediate impact
on the U.S. economy and its workforce.
TOTAL EMPLOYMENT
Energy production on federal lands is currently
responsible for 380,300 jobs across the United
States. Over 100,000 of these jobs are directly
tied to oil and gas extraction and coal mining.
Another 75,300 workers are employed indirectly
by suppliers to these industries. In addition,
the wages earned and spent by these direct
and indirect workers contribute to growth in
employment in other sectors of the economy.
These “induced” jobs support an additional
203,400 jobs (Table 1).
Table 1 - U.S. Jobs from Fossil Fuel Production on Federal Lands
Type Employment (2015)
Direct 101,600
Indirect 75,300
Induced 203,400
Total 380,300
OIL AND GAS
The production of oil and natural gas on federal
lands is the source of the vast majority of jobs
supported by federal-lands energy development,
with 336,500 jobs associated either directly or
indirectly with these activities.
Nearly 92,000 employees work directly for
companies that produce on federal lands,
either as in-house employees or contractors.1
The industry is responsible for generating and
supporting an additional 60,300 jobs among
suppliers, and 184,300 jobs in other sectors that
are induced as a result of the work it does (Table
2).
Table 2 - U.S. Jobs from Oil and Gas Extraction on Federal Lands
Type Employment (2015)
Direct 91,900
Indirect 60,300
Induced 184,300
Total 336,500
Among U.S. states, Colorado has the most direct
oil and gas employees operating on federal
lands, followed by Louisiana and Texas, primarily
on the basis of those states’ proximity to offshore
operations in the Gulf of Mexico (Figure 8).
COAL
Coal mining activities on federal lands are
responsible for nearly 44,000 jobs, with 9,700
jobs tied directly to mining itself. This number
may appear small given the volume of coal
production on federal lands, but it’s important to
note that a large amount of coal on the western
federal lands is produced from surface mines,
which often require less labor than underground
projects in eastern states.

19
As a result, per-miner coal production on federal
lands in states such as Wyoming is much greater
than production volumes in sub-surface mining
operations in the eastern United States. More
than half of the number of direct coal-mining
employees work in Wyoming and represent
two percent of that state’s workforce. Coal
production on federal lands also generates
more than 15,000 jobs among suppliers to the
industry and more than 19,000 induced jobs
(Table 3).
Table 3 - U.S. Jobs from Coal Mining on Federal Lands
Type Employment (2015)
Direct 9,700
Indirect 15,100
Induced 19,100
Total 43,900
EMPLOYMENT COMPENSATION
Oil, natural gas, and coal production is not
only responsible for supporting hundreds of
thousands of U.S. jobs, but it also offers both
direct and indirect employee wages that are
much higher than the national average. As Table
4 shows, labor income in the oil and gas industry
is 199 percent higher than the national average,
and labor income in the coal industry is 83
percent higher. The indirect jobs, or jobs created
for suppliers to these industries, have an income
level that is 48 percent higher than the national
average.
OIL AND NATURAL GAS
Labor income associated with the development
of oil and natural gas on federal lands is
particularly high relative to median incomes in
states that support significant energy production
activities from federal lands.
Figure 9 compares oil and gas wages from
federal lands with wages collected in states that
have the greatest amount of direct employment
on federal lands. In each instance, federal-land
oil and gas incomes are much higher than the
median income level for all other jobs in that
state. The comparison is particularly stark when
Figure 8 – Direct Oil & Natural Gas Employment of Federal Lands (2015)
Source: Bureau of Economic Analysis

the income levels are compared against those in
the Gulf States.
COAL
The difference in worker income levels is not as
great for coal as it is for oil and gas, but direct
and indirect coal incomes are still higher than
the median income in each state with the highest
federal coal mining employment. Direct coal
incomes on federal lands are approximately 80
percent higher than the median state income
levels in Utah, Colorado and Wyoming and 126
percent higher than those in Montana (Figure
10).
GROSS DOMESTIC PRODUCT
Oil, natural gas, and coal extraction on federal
lands contributes an estimated $72.3 billion
in gross domestic product. The majority of
these impacts, $44.7 billion, can be traced back
directly to extraction and mining. The remaining
$10.7 billion is realized in the form of indirect
impacts from suppliers and an additional $16.8
billion from induced impacts to other segments
of the economy (Table 5).
Table 5 - GDP from Fossil Fuel Production on Federal Lands
Type GDP ($2015 billions)
Direct $44.7
Indirect $10.7
Induced $16.8
Total $72.3
Table 4 - Labor Income from Fossil Fuel Production on Federal Lands
Figure 9 - Oil and Gas Labor Income on Federal Lands vs. Select States
Type Labor Income (2015) Above U.S. Average
Direct – Oil &Gas $173,000 199%
Direct – Coal $105,900 83%
Indirect (Both) $85,800 48%
U.S. Average $57,900
Source: IMPLAN, Census, Chamber of Commerce analysis
20

ROYALTIES
Royalties generated from energy production on
federal lands are a significant source of revenue
for the federal government as well as state and
local governments, helping to balance budgets
and fund education, infrastructure, public safety
and other critical projects. More than $57 billion
was distributed to various federal and state
funds from federal lands development over the
last five years alone (Table 6).
The U.S. government collected $7.2 billion in
royalties from fossil fuel production on federal
lands in 2015 and a cumulative $46.5 billion from
2011 to 2015 – enough to fund the budgets of the
EPA or the Army Corps of Engineers over that
time. Over $10 billion in royalties was distributed
to states, primarily from onshore development.
Some of the biggest benefactors of royalties
generated from federal land production have
been Wyoming, New Mexico, Colorado, and
Table 6 - Total Royalty Disbursements from Fossil Fuel Production on Federal Lands ($Millions)
Figure 10 - Coal Labor Income on Federal Lands vs. Select States
Source: IMPLAN, Census, Chamber of Commerce analysis
FUND 2011 2012 2013 2014 2015 Grand Total
U.S. Government 8,625 9,308 11,287 10,081 7,186 46,487
State Share: Onshore 1,957 2,088 1,964 2,188 1,815 10,012
State Share: Offshore 42 37 41 38 25 183
Grand Total 10,624 11,433 13,292 12,307 9,026 56,682
21

Utah, which combined received more than $1.6
billion in royalties -- about 88 percent of the 2015
U.S. total -- from hydrocarbon development on
federally controlled acreage (Table 7).
Wyoming received the largest share of royalty
revenue from federal-lands development. The
state is home to 80 percent of the coal mined on
federal lands, 40 percent of the onshore natural
gas and 18 percent of the onshore oil.
These royalties amounted to nearly $900
million for the state in 2015. New Mexico, with
approximately one-quarter of all federal natural
gas and oil production, collected the second-
highest federal royalty share, with development
activities delivering it nearly half a billion dollars
in 2015. Colorado derives most of its federal
royalties, $124 million in 2015, from natural gas
development and sales.
It can be argued that the imposition of an
immediate ban on all federal lands development
is unlikely. After all, the recent Obama
administration policy promulgation on coal
leases applies only to new leases. According
to the Interior Department, there is enough
coal from existing mines in Wyoming’s PRB to
maintain current production levels for the next
20 years, and applications filed by producers for
new leases have been sparse.
Nevertheless, taking at face-value the
statements that continue to be made by various
politicians, and incorporating into that analysis
the known-positions of interest groups that have
assigned a high priority to attacking federal-
lands resource development, it’s not difficult to
imagine a scenario in which a policy that forbids
future federal-land development can be adapted
to restrict current development as well.
Under such a scenario, the coal market would
stand to be hit particularly hard, with 379
million tons of low-sulfur coal disappearing
from the supply mix. Those volumes represent
42 percent of the nation’s current tonnage, and
at present, there is not enough non-coal capacity
in the U.S. electricity market to shift generation
away from this much coal in a reasonable
timeframe. As a result, electricity prices would
dramatically increase across the country and
$1.5 billion in federal land royalties would
disappear, including $700 million annually for
Wyoming.
2015 Royalties (millions)
% of TotalNatural Gas
(bcf)Oil
(mill. barrels)Coal
(million short tons)
Total $1,835 3,790 706 421
Wyoming $ 886 48% 29% 5% 80%
New Mexico 496 27% 18% 8% 3%
Colorado 124 7% 13% 1% 4%
Utah 116 6% 7% 3% 3%
California 62 3% 0% 3% 0%
North Dakota 47 3% 1% 8% 1%
Montana 34 2% 0% 0% 6%
Alaska 18 1% 0% 0% 0%
Louisiana 14 1% 1% 1% 0%
All Others 38 2% 4% 2% 2%
Gulf of Mexico 26% 68%
Table 7 - Federal Royalties Disbursed to States by Energy Source
22

23
CITATIONS
1 Bureau of Economic Analysis, Table SA25N, www.bea.gov; supplemented by U.S. Chamber of Commerce analy-sis.

1

25
SCENARIO 2: ECONOMIC IMPACT
OF LIMITING BAN TO FUTURE LEASING
4CHAPTER

26
Proposals being discussed that seek to prevent
future leases from being issued for federal-lands
development would also have a severe impact on
many states – it’s just that these impacts would
be more delayed in arriving relative to Scenario 1 in
which existing production is also taken off the table.
Under Scenario 2, most of the 4.5 Tcf of natural gas
and the 719 million barrels of oil that are produced
on federal lands would either shift to other states
or be replaced by foreign sources. In either case,
the impact on states where that development had
previously occurred would be significant.
The most identifiable impact would be on
royalties from federal land production, which
would decrease by more than 75 percent over
the next 15 years, with annual royalties dropping
by more than $6 billion. States would lose $780
million in annual royalties (Figure 11). At the
same time, 73,000 direct jobs would immediately
be impacted, as would 195,000 indirect and
induced jobs. Some of these may be “picked up” by
production on private lands, but those that would be
lost to foreign producers (imports) would disappear.
At a state level, New Mexico would be the hardest
hit by a ban on new federal leases. Its annual
royalties would decline by $363 million over the
next 15 years, and cumulative royalty losses would
amount to more than $4 billion (Table 8).
Figure 11 - Oil and Natural Gas Royalties from Federal Lands (millions)
Table 8 – Projected Royalty Losses
StateAnnual Royalty Loss by
2030 (millions)Cumulative Loss -- 2016-2030
(millions)
1 New Mexico ($363) ($4,091)
2 Wyoming (132) (1,470)
3 Utah (76) (991)
4 Colorado (74) (792)
5 California (51) (591)
Source: ONRR

27
5CHAPTER
WHAT WOULD INDIVIDUAL STATES LOSE UNDER A
FEDERAL-LANDS AND WATERS
PRODUCTION BAN?

28
Colorado Colorado has the highest number of direct oil
and gas employees and contractors working
on federal lands, registering 15,300 in 2015. In
addition, the federal-lands oil and gas sector
is responsible for 13,000 indirect jobs from
suppliers and 21,700 induced jobs.
The sector contributes $2.4 billion dollars in
direct labor income, with a total impact of $4.5
billion. The overall GDP impact to the state’s
economy is $8.3 billion. If future leases for oil
and gas development were disallowed, these
jobs would be at risk of moving to other states in
the best case, or disappearing altogether in the
most likely one (Table 9).
In addition, Colorado received the third largest
disbursement of federal royalties of any state
in 2015, collecting $124 million. That’s down
from an average of $153 million in the previous
four years. Roughly half, or about $62 million in
2015, was earmarked by the state to be spent on
education programs. Approximately 40 percent,
or $50 million last year, was distributed to
local governments. Education systems and local
Employment Labor Income GDP State Royalties
Direct 15,300 $2.4 billion $4.9 billion
Indirect 13,000 $1.1 billion $1.6 billion
Induced 21,700 $1.0 billion $1.8 billion
Total 50,000 $4.5 billion $8.3 billion $124 million
Table 9 – Economic Impact of Production on Federal Lands in Colorado
governments would need to quickly identify
alternative funding sources to be made whole.
The remaining 10 percent was distributed to
the Colorado Water Conservation Board, which
is an agency that provides policy direction on
the state’s water issues.1 As Figure 12 shows, a
ban on future leases would deplete these funds,
reducing them by $64 million over the next 10
years.
Figure 12 – Colorado Project Royalties from Federal Lands ($millions)
Source: ONRR, Chamber of Commerce analysis

29
Employment Labor Income GDP State Royalties
Direct 10,000 $0.9 billion $2.7 billion
Indirect 7,000 $0.5 billion $0.8 billion
Induced 7,400 $0.3 billion $0.5 billion
Total 24,300 $1.6 billion $4.0 billion $496 million
New Mexico’s oil and gas sector, combined with
coal, is responsible for 10,000 direct jobs in
the state, with an additional 7,000 indirect
and 7,400 induced jobs for a total job impact
of 24,300. As Table 10 shows, these industries
contribute $1.6 billion in labor impact, with
more than half of that amount coming from
direct impacts. That income translates into a $4
billion boost to New Mexico’s state GDP.
New Mexico likewise would be devastated under
a scenario in which energy production was
curtailed or halted entirely on federal lands. Our
analysis indicates the state would stand to lose
nearly a half-billion dollars ($496 million) in
annual royalty collections, which represent more
than eight percent of the entire New Mexico
General Fund. Outside of sales and personal
income taxes, this is the highest source of
revenue for the state.
All told, 42 percent of all crude oil production
and 62 percent of all natural gas production in
New Mexico comes from federal lands.2 Those
who support instituting bans on federal-lands
energy development have offered no economic
alternatives that can serve as a sustaining
substitute for the loss of revenue from federal
fossil fuel production in states such as New
Mexico, where the budget is heavily dependent
on federal royalties.
This figure does not account for any residual
revenues generated as a result of businesses
investing and operating within New Mexico; in
that way, the half billion dollar loss estimate
represents a minimum impact figure. The
indirect and induced impacts would likely be
even greater.
New Mexico
Table 10 – Economic Impact of Production on Federal Lands in New Mexico

30
In Wyoming, oil, gas and coal development
activities provide 32,500 total jobs and roughly
$2.7 billion in labor income. When Wyoming’s
total population and the size of its state economy
are taken into account, the $7.2 billion in direct
GDP impacts as well as $1.5 billion in indirect
and $0.6 billion in induced economic impacts
show how important these industries are to
the state. All these economic benefits currently
enjoyed by the state would virtually disappear
should production on federal land be curtailed
(Table 11).
In Wyoming, coal is the second largest source
of revenue for the state and local government,
contributing over $1 billion annually in revenue
to state and local governments. Wyoming
generated royalties of $886 million from federal
lands in 2015, which represents 20 percent of
Wyoming’s entire annual expenditures for that
year.3
Wyoming in particular would be forced to
confront a difficult economic situation if energy
production were to come to a halt on federal
acreage. Figure 13 shows how the $886 million
that the state received from federal-land
production is appropriated within the state
budget.
Wyoming
Table 11 – Economic Impact of Production on Federal Lands in Wyoming
Wyoming is projected to spend $1.5 billion on
all education related expenditures for FY 2015.4
Thirty percent of that amount comes directly
from federal royalty disbursements. The ability
of the state to deliver on its public-education
related priorities would be negatively and
disproportionately affected by any decrease in
federal royalty revenues.
Figure 13 - Wyoming Federal Royalty Disbursements (2015)
Employment Labor Income GDP State Royalties
Direct 13,300 $1.6 billion $7.2 billion
Indirect 10,800 $0.8 billion $1.5 billion
Induced 8,500 $0.3 billion $0.6 billion
Total 32,500 $2.7 billion $9.3 billion $886 million
Source: Wyoming State Government Revenue Forecast5
31Table 12 – Economic Impact of Production on Federal Lands in the Gulf Coast
Table 13 – Offshore Disbursements by State (2015)
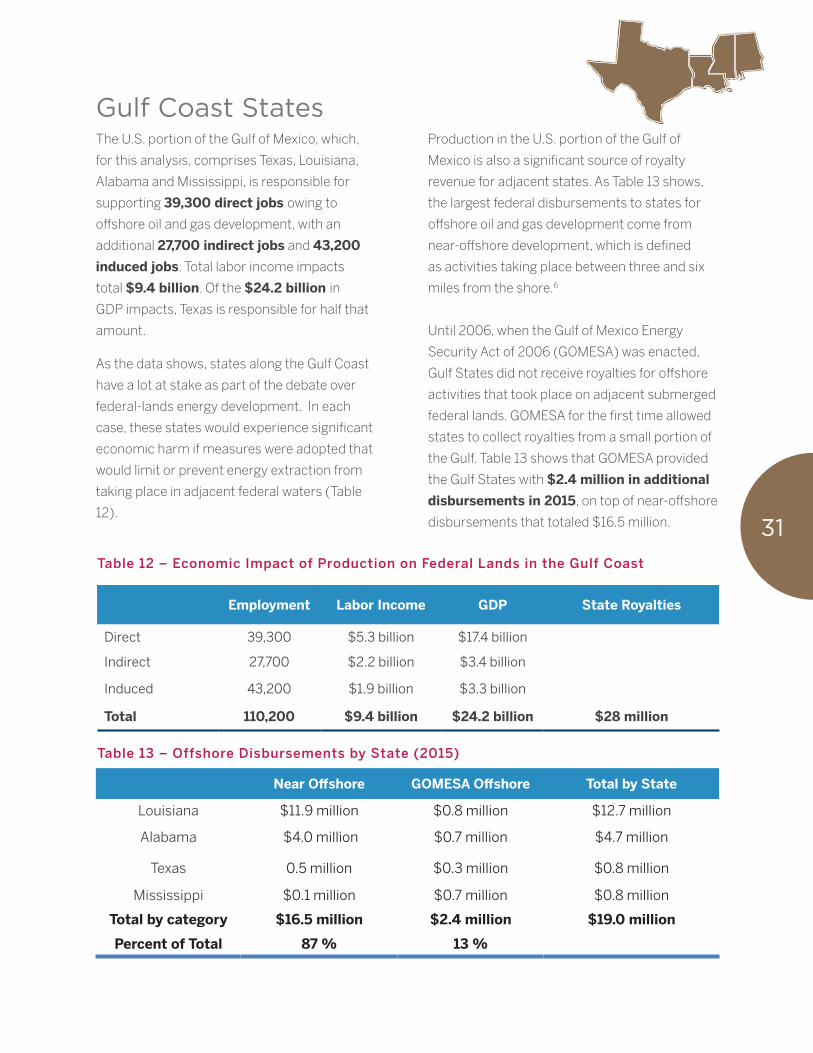
The U.S. portion of the Gulf of Mexico, which,
for this analysis, comprises Texas, Louisiana,
Alabama and Mississippi, is responsible for
supporting 39,300 direct jobs owing to
offshore oil and gas development, with an
additional 27,700 indirect jobs and 43,200
induced jobs. Total labor income impacts
total $9.4 billion. Of the $24.2 billion in
GDP impacts, Texas is responsible for half that
amount.
As the data shows, states along the Gulf Coast
have a lot at stake as part of the debate over
federal-lands energy development. In each
case, these states would experience significant
economic harm if measures were adopted that
would limit or prevent energy extraction from
taking place in adjacent federal waters (Table
12).
Production in the U.S. portion of the Gulf of
Mexico is also a significant source of royalty
revenue for adjacent states. As Table 13 shows,
the largest federal disbursements to states for
offshore oil and gas development come from
near-offshore development, which is defined
as activities taking place between three and six
miles from the shore.6
Until 2006, when the Gulf of Mexico Energy
Security Act of 2006 (GOMESA) was enacted,
Gulf States did not receive royalties for offshore
activities that took place on adjacent submerged
federal lands. GOMESA for the first time allowed
states to collect royalties from a small portion of
the Gulf. Table 13 shows that GOMESA provided
the Gulf States with $2.4 million in additional
disbursements in 2015, on top of near-offshore
disbursements that totaled $16.5 million.
Gulf Coast States
Employment Labor Income GDP State Royalties
Direct 39,300 $5.3 billion $17.4 billion
Indirect 27,700 $2.2 billion $3.4 billion
Induced 43,200 $1.9 billion $3.3 billion
Total 110,200 $9.4 billion $24.2 billion $28 million
Near Offshore GOMESA Offshore Total by State
Louisiana $11.9 million $0.8 million $12.7 million
Alabama $4.0 million $0.7 million $4.7 million
Texas 0.5 million $0.3 million $0.8 million
Mississippi $0.1 million $0.7 million $0.8 million
Total by category $16.5 million $2.4 million $19.0 million
Percent of Total 87 % 13 %

32
The second phase of GOMESA, scheduled to
take effect next year, will substantially increase
disbursements to Gulf States. While the first
phase was limited to a small area of the Gulf,
phase two will expand that area to include nearly
all of the Central and Western Planning Areas of
the Gulf.
The Obama administration has threatened to
prevent phase two from being implemented, but
these actions have been met by stiff resistance
in Congress and among representatives of both
parties from Gulf States. Louisiana’s revenues
from federal offshore oil and gas are expected
to increase by more than 10-fold under phase
two provisions, and the other Gulf States are
expected to benefit similarly (Figure 14).
Figure 14 - Louisiana: Estimated Disbursements from Oil and Gas Activity on Offshore Federal Lands ($ Millions)
Source: ONRR
33
CITATIONS
1 “Federal Mineral Lease and State Severance Tax Direct Distribution: Program Guidelines,” Colorado Depart-ment of Local Affairs. July 2015.
2 https://www.nmlegis.gov/lcs/handouts/Oilpercent20andpercent20Natural percent20Gas percent20Taxing percent20in percent20New percent20Mexico.pdf
3 http://ai.wyo.gov/budget-division/budget-fiscal-years/2015-2016-budget. Biennium total spending is $8.8 billion for FY 2015-2016
4 http://ai.wyo.gov/budget-division/budget-fiscal-years/2015-2016-budget see page 31 of budget, $3 billion for education for FY 2015-2016
5 http://eadiv.state.wy.us/creg/GreenCREG_Jan16.pdf
6 The area from the shoreline to approximately three miles offshore is considered to be the jurisdiction of the adjacent state.


35
TECHNICAL APPENDIX

36
This technical appendix describes the economic impact modeling data, assumptions, and methodology
for natural gas, oil and coal. IMPLAN was used to calculate:
• Indirect and Induced Employment
• Labor Income
• GDP
SCENARIO 1NATURAL GAS AND OIL
• For royalties:
• Started with royalty data for 2015 broken out by state and federal.1
• State royalties are further broken out by offshore (8g, CPS and GOMESA) and onshore.2
• Broke out onshore federal between coal and NG/Oil using production data from Dept. of
Interior.3
• For employment:
• Started with 2014 (most recent) employment for NAICS 211 (Oil and Gas Extraction) by state.
• Used data from the Bureau of Labor Statistics (BLS) rather than Bureau of
Economic Analysis (BEA) since BLS data is more detailed; it breaks out coal mining,
while BEA aggregates all mining. Also coal mining does not have the same issue
regarding contract workers as oil and gas.
• Broke out employment in each state between federal and state/private lands.
• Used EIA data to determine overall production of coal in each state.
• Used Department of the Interior data to determine production on federal lands.
• Applied federal production percentage to employment levels in each state.
Adjusted to 2015 using BLS data, which showed a 3% decline in average monthly direct oil and gas
employment from 2014 to 2015.
COAL
• For royalties:
• Started with royalty data for 2015 broken out by state and federal.4
• Broke out onshore federal between coal and NG/Oil using production data from Dept. of
Interior.5
• For employment:
• Started with 2014 (most recent) Census employment data for NAICS 2121 (Coal Mining) by
state. (http://ledextract.ces.census.gov/)

37
• Broke out employment in each state between federal and state/private lands.
• Used 2014 EIA data to determine overall production of coal in each state.
• Used Department of the Interior data to determine production on federal lands.
• Applied federal production percentage to employment levels in each state.
• Adjusted employment to 2015 based on total EIA production data for each state.
SCENARIO 2
• The forecasted impact is based on a scenario where no future leases are granted, and
extraction would continue on current leases.
• We only calculated the impact for oil and gas.
• There is enough coal in the ground within existing leases to last 15-20 years, so a
scenario that only impacts future leases would not have much of an impact on coal.
• We based the impacts on 2015 employment and royalties, which implicitly assumes that
volumes would decline based off 2015 volumes and that prices would remain constant.
Forecasted future employment and royalties using decline rates for each state/region:
• Used a straight-line decrease in rates from 1st year to 10th year.
State/Region 1st Year Decline Rate >=10 Year Decline Rate
Onshore
Colorado 12 percent 5 percent
Wyoming 14 percent 5 percent
Utah 35 percent 10 percent
New Mexico 15 percent 5 percent
All Others (average of onshore) 19 percent 6 percent
Offshore 20 percent 10 percent
Table 14 - Future Royalty Decline
38
CITATIONS
1 Office of Natural Resources Revenue (www.onrr.gov).
2 8g represents the area between 3 and 6 miles offshore. CPS payments are royalties paid to coastal counties. GOMESA is the Gulf of Mexico Energy Security Act, which governs payments to states from extraction in federal waters.
3 https://useiti.doi.gov/downloads/federal-production/
4 Office of Natural Resources Revenue (www.onrr.gov).
5 https://useiti.doi.gov/downloads/federal-production/

Institute for 21st Century EnergyU.S. Chamber of Commerce
1615 H Street, NWWashington, DC 20062
Phone: (202) 463-5558 Fax: (202) [email protected]
www.energyxxi.org
AN AFFILIATE OF THE U.S. CHAMBER OF COMMERCE


