
USAGE OF NATIONAL INBOUND TOURISM STATISTICS AT PROVINCIAL
LEVEL
Khumbu Sithole, Snr Mgr: Research & ICT
Statistics for Africa Workshop
Tuesday, 10 February 2009
The GTA approach: How and Why?
• SAT’s Quarterly and Annual Tourism Reports (greater detail):
Glean Gauteng-specific information and repackage to answer Gauteng
questions (e.g. performance indicators in our Strategic Plan) – (MS PP/MS Word)
• Present to Board/management in a simplified, less ‘intimidating’ fashion
(non-research oriented managers) to encourage application
• External stakeholders 1-stop intelligence point – enhance brand equity
• Cross-referencing statistics collected at provincial level (primary or
desktop – e.g. Econometrics)
• Gauging of perceptions, mainly tourists’ safety
• Close working relationship with SAT’s SRU (survey inputs, raw data)
• Future: Guide implementation of sub-national TSA or RTEA (following UNWTO
Malaga conference) – benefits on the ground…
Prepared by: GTA Strategic Research Unit
For Senior Management
22 September 2008
An Overview of Inbound TourismA comparative analysis from a Global, National and
Provincial perspective - 2006 and 2007
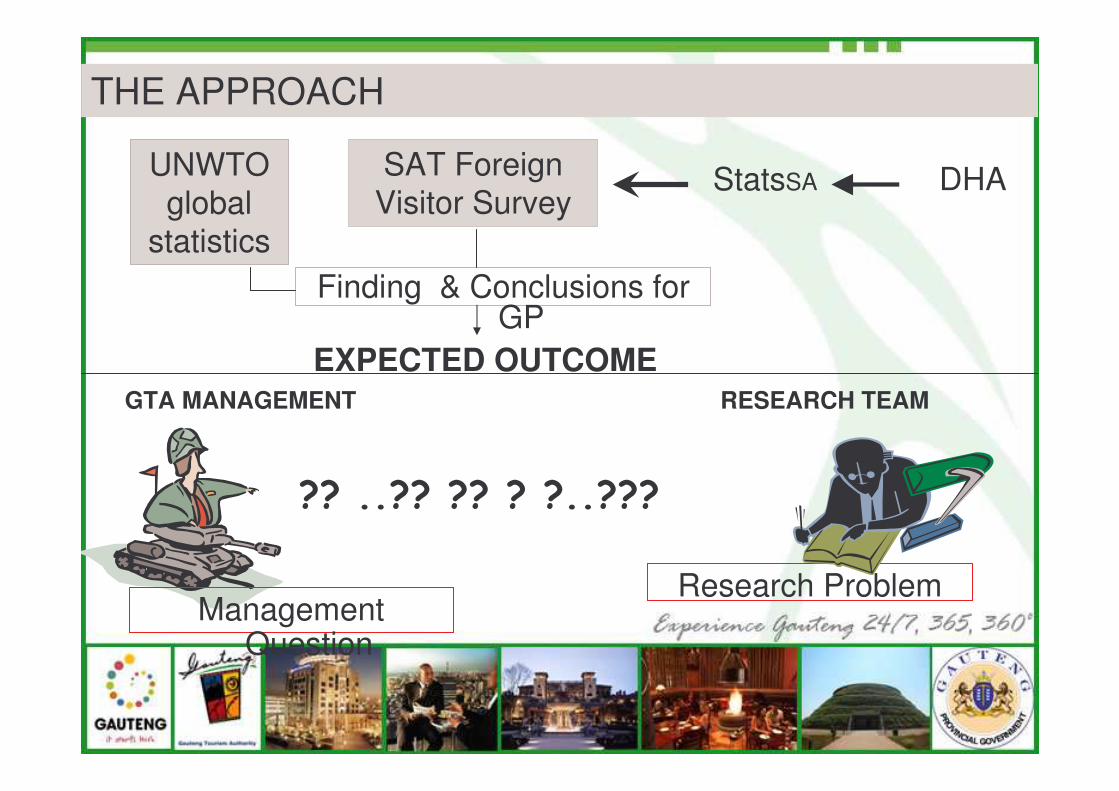
THE APPROACH
Finding & Conclusions for GP
UNWTO global
statistics
SAT Foreign Visitor Survey
DHAStatsSA
Research ProblemManagement
Question
EXPECTED OUTCOMEGTA MANAGEMENT RESEARCH TEAM
�������������������
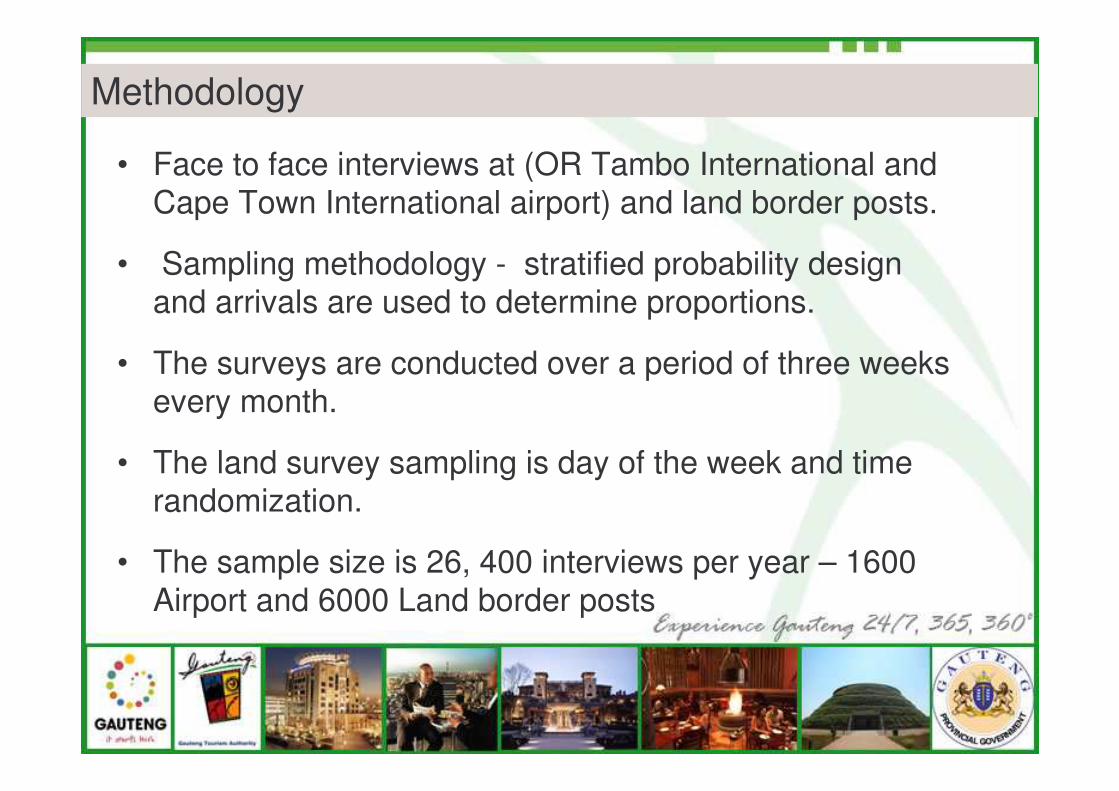
• Face to face interviews at (OR Tambo International and Cape Town International airport) and land border posts.
• Sampling methodology - stratified probability design and arrivals are used to determine proportions.
• The surveys are conducted over a period of three weeks every month.
• The land survey sampling is day of the week and time randomization.
• The sample size is 26, 400 interviews per year – 1600 Airport and 6000 Land border posts
Methodology
• Global Tourism Statistics
• South African Foreign Tourism Statistics
• Interpretation of Gauteng’s Performance
AGENDA
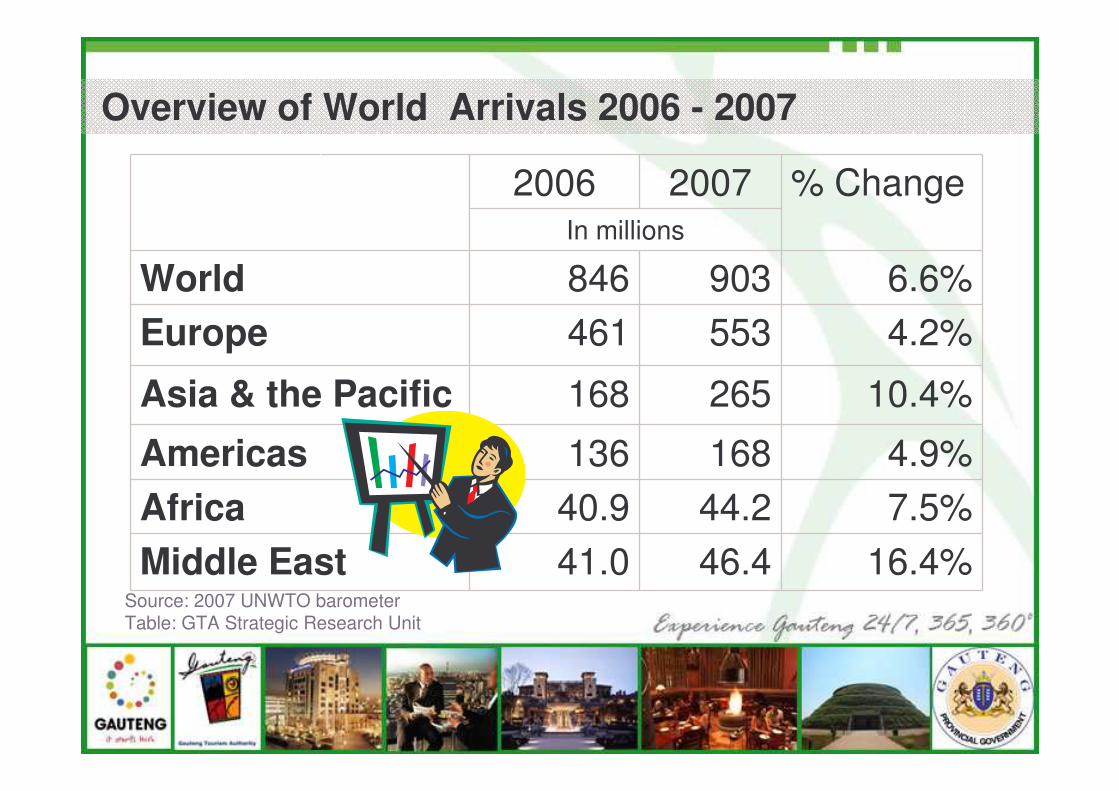
Overview of World Arrivals 2006 - 2007
16.4%46.441.0Middle East7.5%44.240.9Africa
In millions
6.6%903846World4.2%553461Europe
4.9%168136Americas
10.4%265168Asia & the Pacific
20072006 % Change
Source: 2007 UNWTO barometerTable: GTA Strategic Research Unit
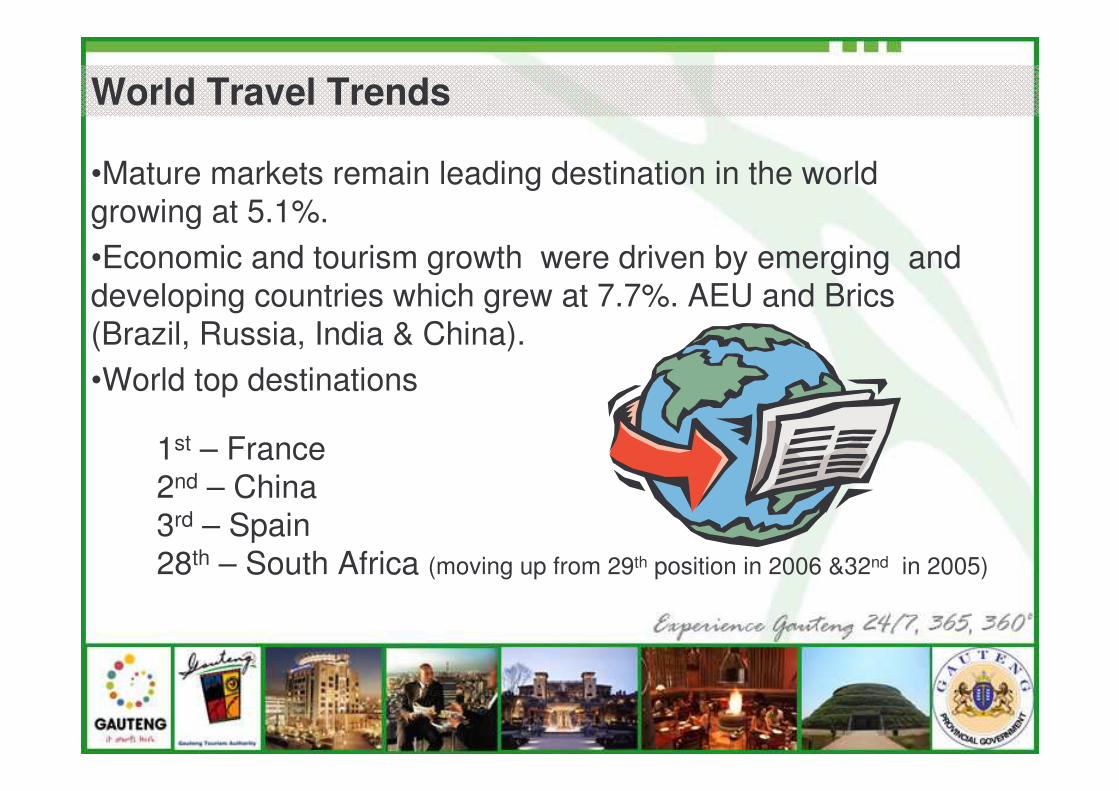
World Travel Trends
•Mature markets remain leading destination in the world growing at 5.1%. •Economic and tourism growth were driven by emerging and developing countries which grew at 7.7%. AEU and Brics(Brazil, Russia, India & China).•World top destinations
1st – France2nd – China3rd – Spain 28th – South Africa (moving up from 29th position in 2006 &32nd in 2005)
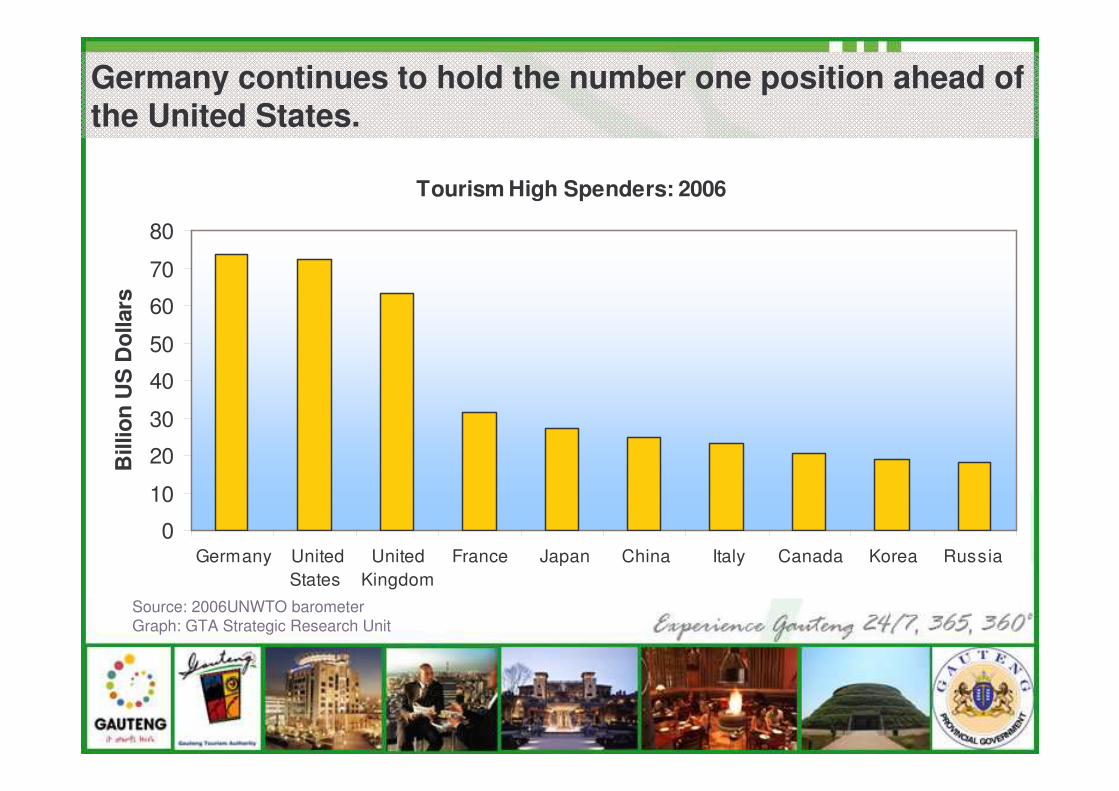
Tourism High Spenders: 2006
0
10
20
30
40
50
60
70
80
Germany UnitedStates
UnitedKingdom
France Japan China Italy Canada Korea Russia
Bill
ion
US
Dol
lars
Germany continues to hold the number one position ahead of the United States.
Source: 2006UNWTO barometerGraph: GTA Strategic Research Unit
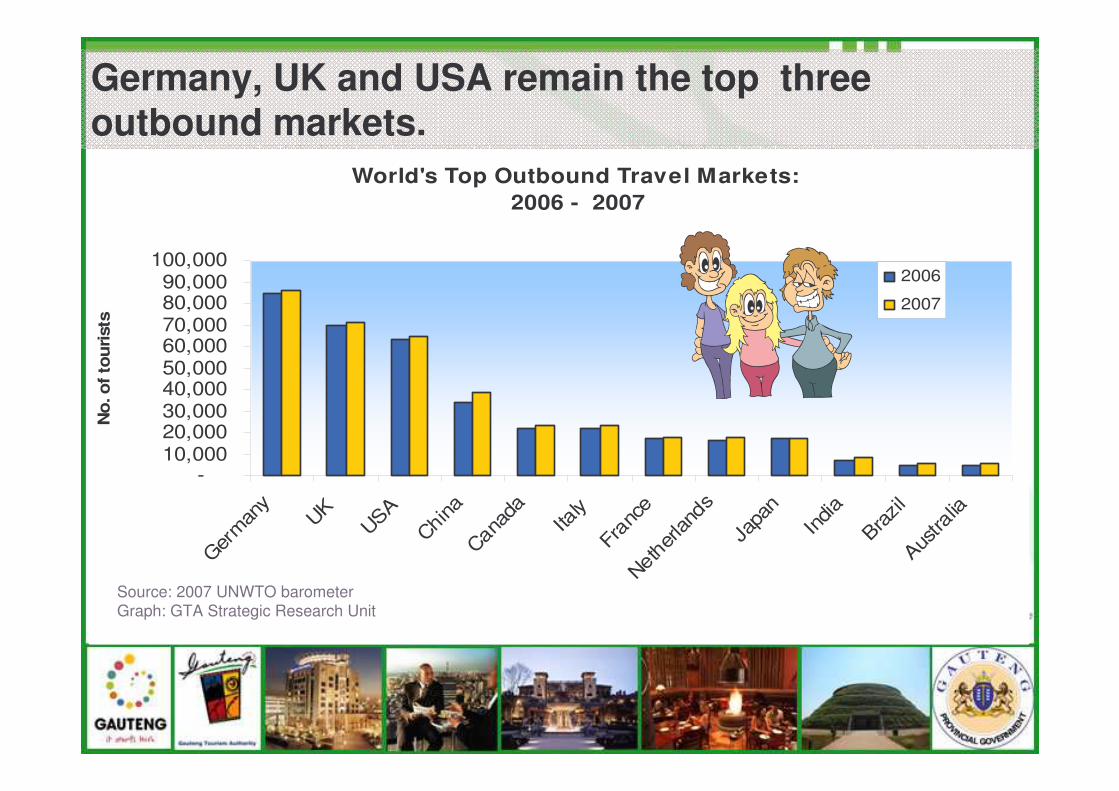
World's Top Outbound Travel Markets: 2006 - 2007
-10,00020,00030,00040,00050,00060,00070,00080,00090,000
100,000
Germ
any
UK
USA
China
Canad
a
Italy
Fran
ceNet
herla
nds
Japa
n
India
Brazil
Austra
lia
No
. of
tou
rist
s
2006
2007
Germany, UK and USA remain the top three outbound markets.
Source: 2007 UNWTO barometerGraph: GTA Strategic Research Unit
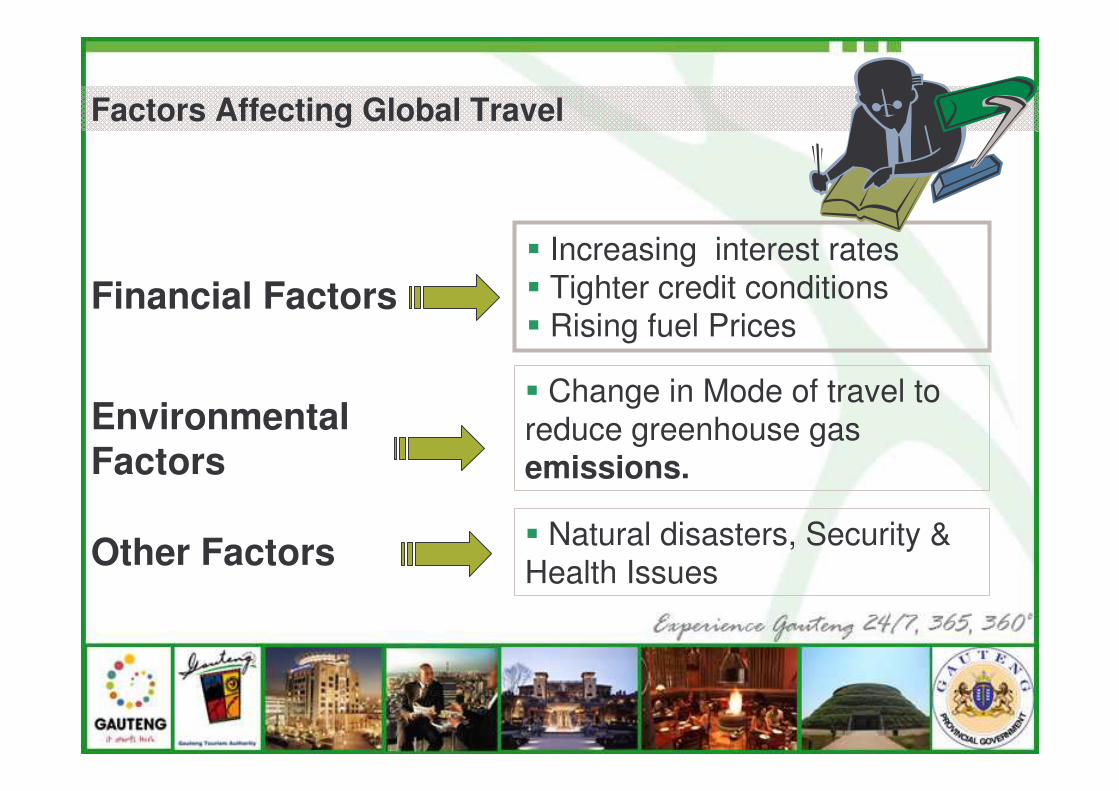
Factors Affecting Global Travel
Financial Factors
Environmental Factors
Other Factors
� Increasing interest rates� Tighter credit conditions� Rising fuel Prices
� Change in Mode of travel to reduce greenhouse gas emissions.
� Natural disasters, Security & Health Issues
• Global Tourism Statistics
• South African Foreign Tourism Statistics
• Interpretation of Gauteng’s Performance
AGENDA
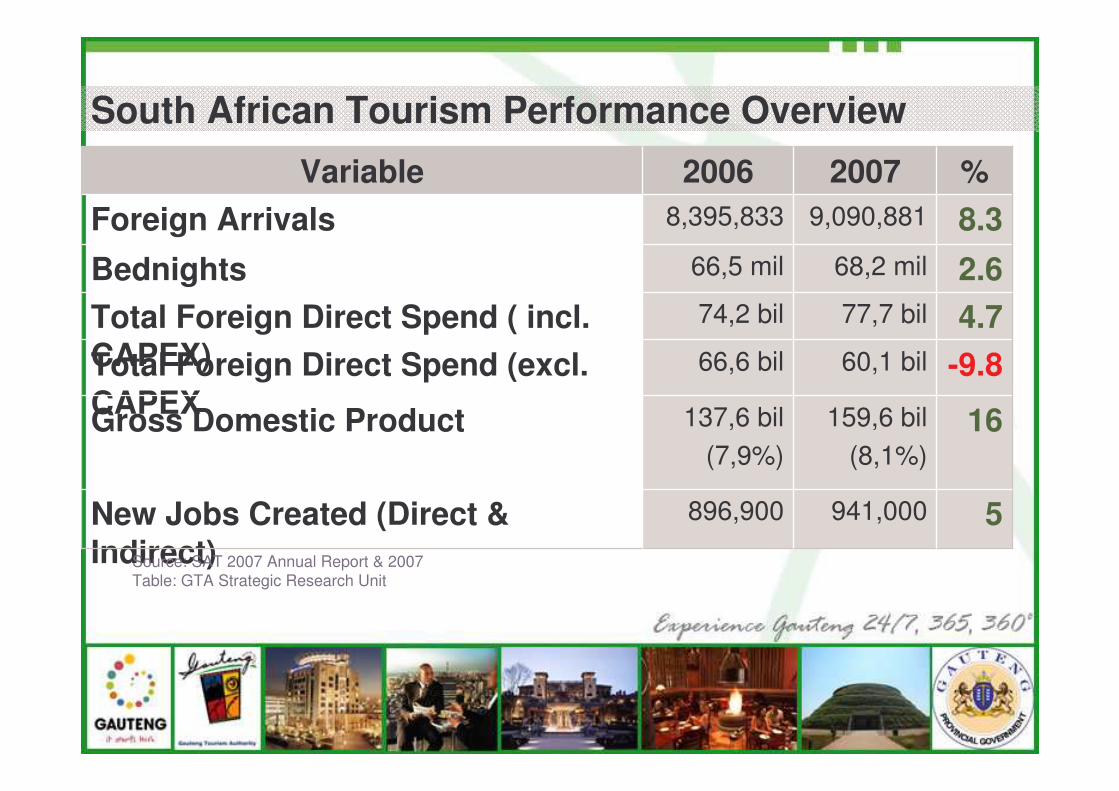
South African Tourism Performance Overview
%
5
16
-9.84.72.68.3
77,7 bil74,2 bilTotal Foreign Direct Spend ( incl. CAPEX)
9,090,8818,395,833Foreign Arrivals68,2 mil66,5 milBednights
159,6 bil(8,1%)
137,6 bil(7,9%)
Gross Domestic Product
941,000896,900New Jobs Created (Direct & Indirect)
60,1 bil66,6 bilTotal Foreign Direct Spend (excl. CAPEX
20072006Variable
Source: SAT 2007 Annual Report & 2007 Table: GTA Strategic Research Unit
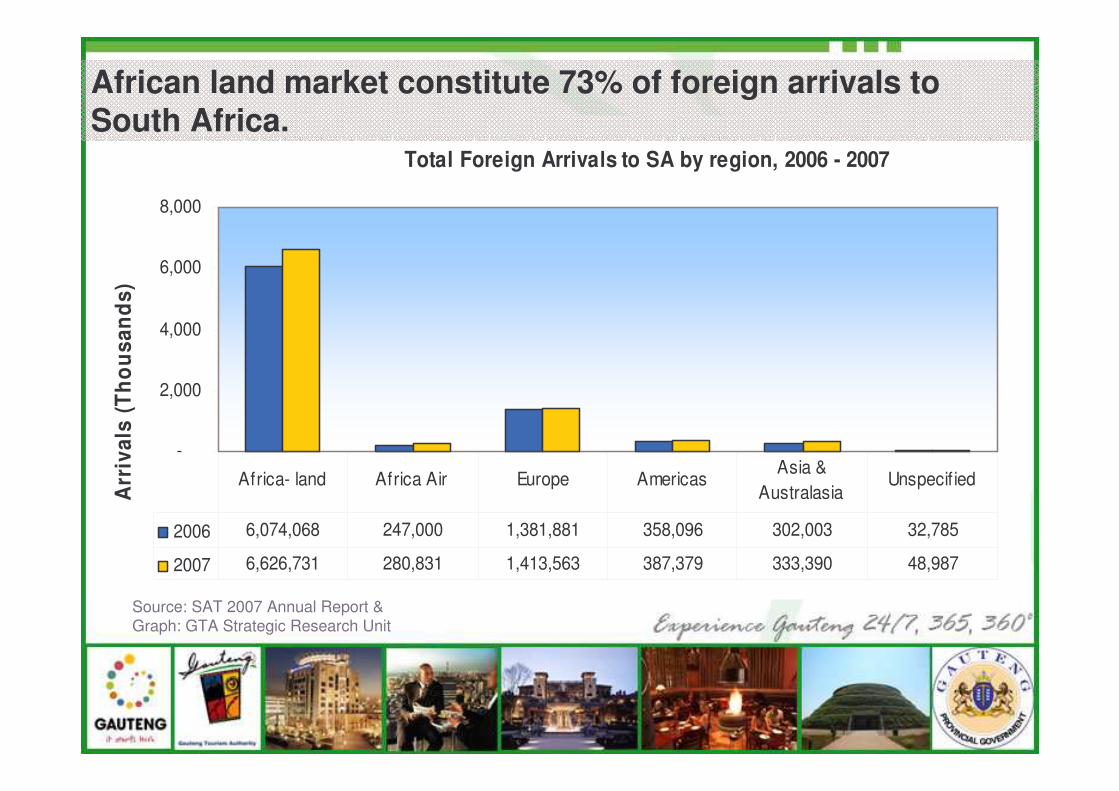
Total Foreign Arrivals to SA by region, 2006 - 2007
-
2,000
4,000
6,000
8,000
Arr
ival
s (T
hous
ands
)
2006 6,074,068 247,000 1,381,881 358,096 302,003 32,785
2007 6,626,731 280,831 1,413,563 387,379 333,390 48,987
Africa- land Africa Air Europe AmericasAsia &
AustralasiaUnspecif ied
African land market constitute 73% of foreign arrivals to South Africa.
Source: SAT 2007 Annual Report &Graph: GTA Strategic Research Unit
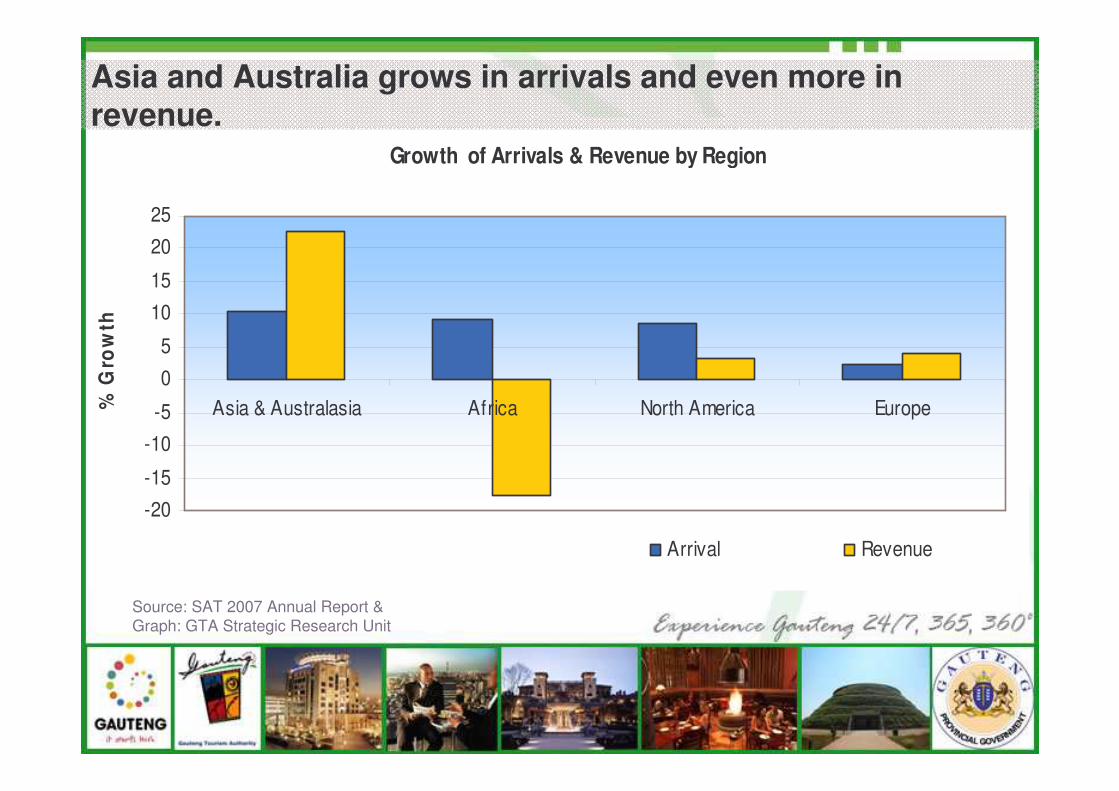
Growth of Arrivals & Revenue by Region
-20-15
-10-5
0
5
1015
2025
Asia & Australasia Africa North America Europe% G
row
th
Arrival Revenue
Asia and Australia grows in arrivals and even more in revenue.
Source: SAT 2007 Annual Report &Graph: GTA Strategic Research Unit
Travel Trends in SA
• SA broke a 9 million mark and recorded an 8,3% increase exceeding global average of 6,6%.
• Despite the high growth in volume, revenue generated decreased.
• The greatest decline on spend was on shopping for resale goods (African land markets).
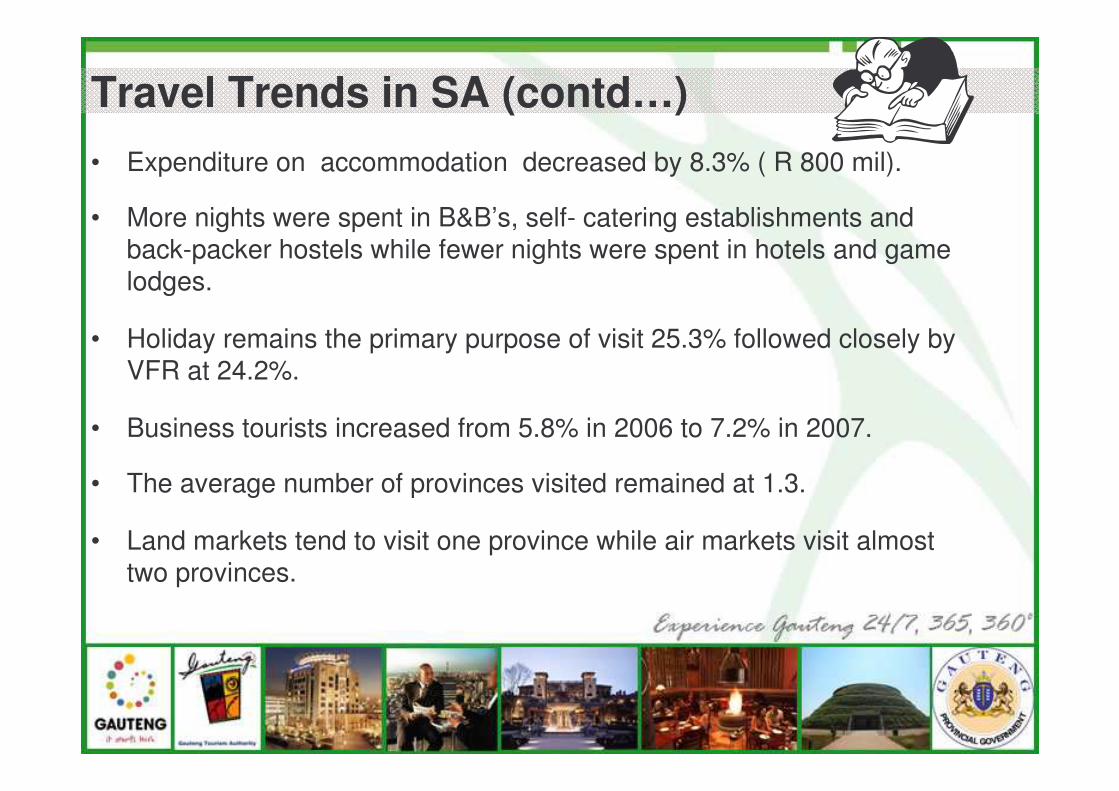
• Expenditure on accommodation decreased by 8.3% ( R 800 mil).
• More nights were spent in B&B’s, self- catering establishments and back-packer hostels while fewer nights were spent in hotels and game lodges.
• Holiday remains the primary purpose of visit 25.3% followed closely by VFR at 24.2%.
• Business tourists increased from 5.8% in 2006 to 7.2% in 2007.
• The average number of provinces visited remained at 1.3.
• Land markets tend to visit one province while air markets visit almost two provinces.
Travel Trends in SA (contd…)
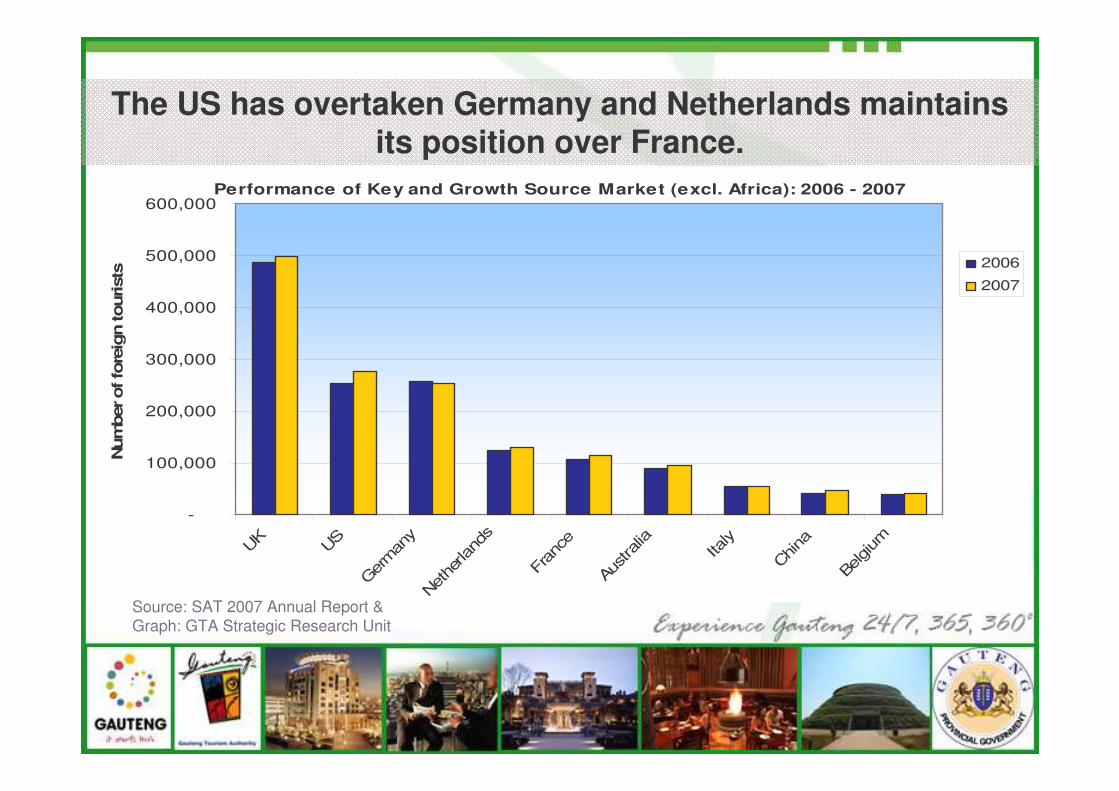
Performance of Key and Growth Source Market (excl. Africa): 2006 - 2007
-
100,000
200,000
300,000
400,000
500,000
600,000
UK US
Germ
any
Nethe
rland
s
Fran
ce
Austr
alia
Italy
China
Belgi
um
Num
ber
of fo
reig
n tourist
s 2006
2007
The US has overtaken Germany and Netherlands maintains its position over France.
Source: SAT 2007 Annual Report &Graph: GTA Strategic Research Unit
• Global Tourism Statistics
• South African Foreign Tourism Statistics
• Interpretation of Gauteng’s Performance
AGENDA
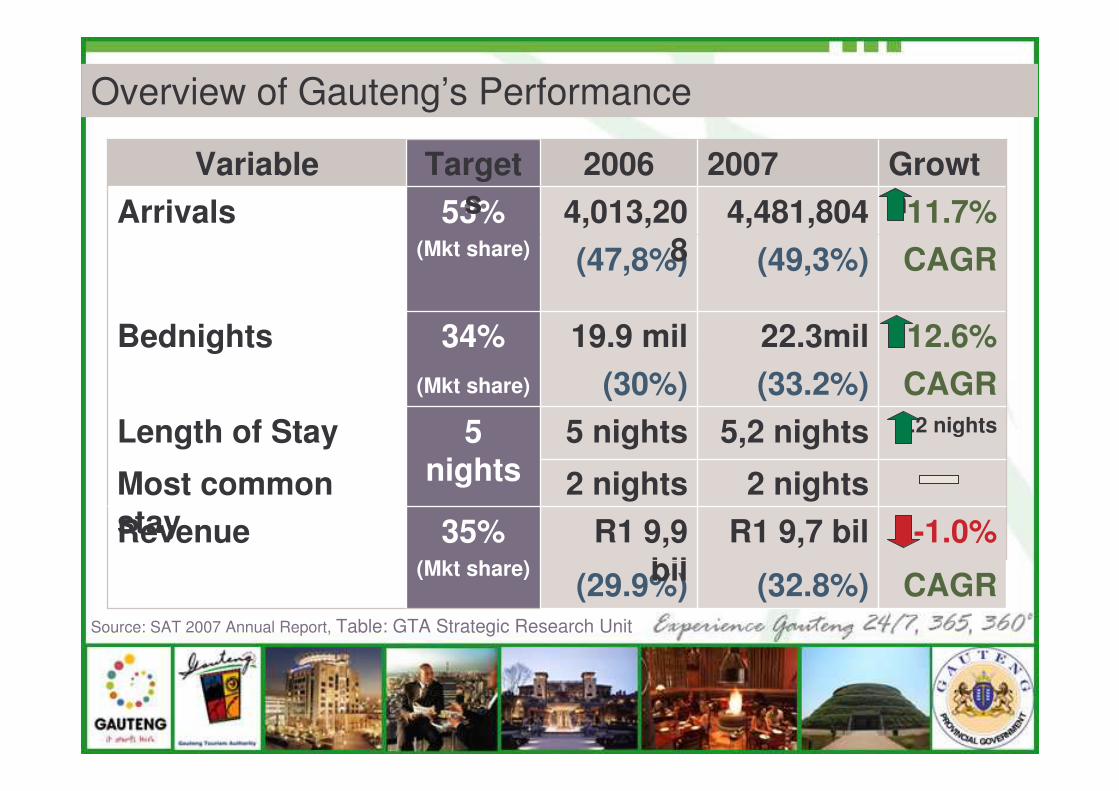
Overview of Gauteng’s Performance
35%(Mkt share)
5 nights
34%(Mkt share)
53% (Mkt share)
Targets
CAGR(32.8%)(29.9%)
CAGR(33.2%)(30%)
-1.0%
.2 nights
12.6%
CAGR11.7%
Growth
(49,3%)(47,8%)4,481,8044,013,20
8Arrivals
22.3mil19.9 milBednights
2 nights2 nightsMost common stay R1 9,7 bilR1 9,9
bilRevenue
5,2 nights5 nightsLength of Stay
20072006Variable
Source: SAT 2007 Annual Report, Table: GTA Strategic Research Unit
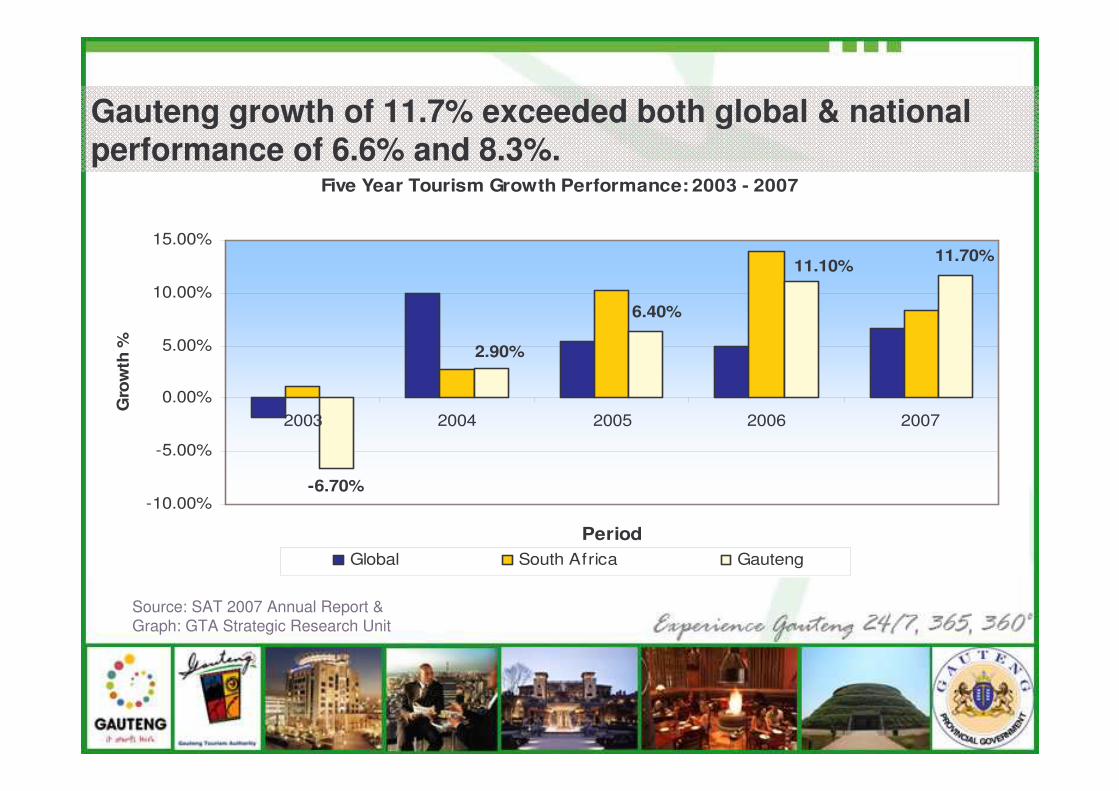
Five Year Tourism Growth Performance: 2003 - 2007
-6.70%
11.10%11.70%
6.40%
2.90%
-10.00%
-5.00%
0.00%
5.00%
10.00%
15.00%
2003 2004 2005 2006 2007
Period
Gro
wth
%
Global South Africa Gauteng
Gauteng growth of 11.7% exceeded both global & national performance of 6.6% and 8.3%.
Source: SAT 2007 Annual Report &Graph: GTA Strategic Research Unit
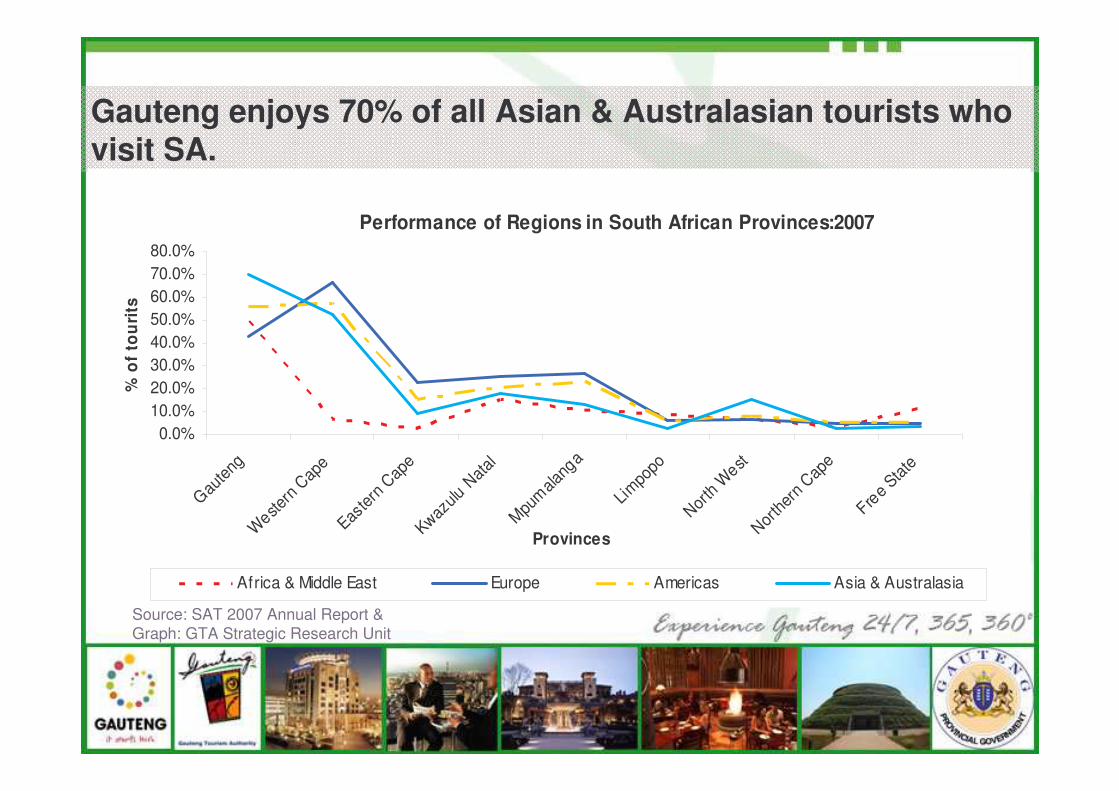
Gauteng enjoys 70% of all Asian & Australasian tourists who visit SA.
Performance of Regions in South African Provinces:2007
0.0%10.0%20.0%30.0%40.0%50.0%60.0%70.0%80.0%
Gauten
g
Western
Cape
Easter
n Cap
e
Kwazulu
Nata
l
Mpumala
nga
Limpo
po
North W
est
Northe
rn Cap
e
Free Stat
e
Provinces
% o
f to
uri
ts
Africa & Middle East Europe Americas Asia & Australasia
Source: SAT 2007 Annual Report &Graph: GTA Strategic Research Unit
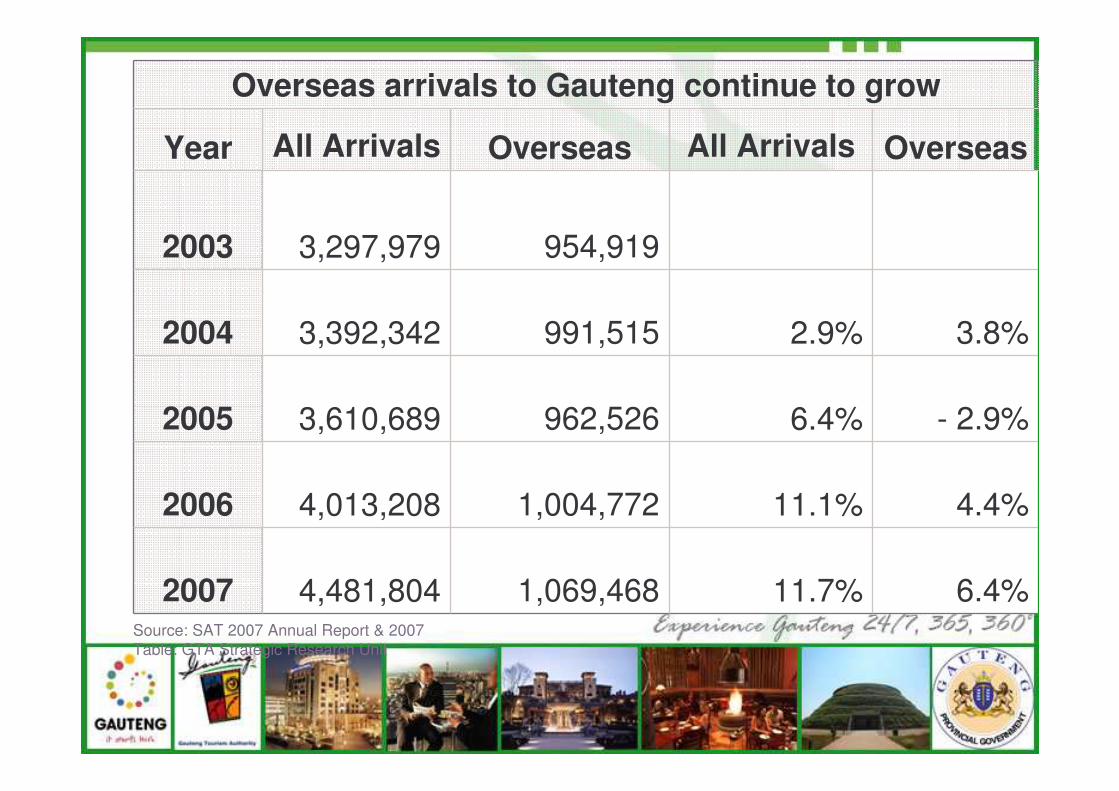
Year
6.4%11.7%1,069,468 4,481,8042007
4.4%11.1%1,004,7724,013,2082006
- 2.9%6.4%962,526 3,610,6892005
3.8%2.9%991,515 3,392,3422004
954,919 3,297,9792003
OverseasAll ArrivalsOverseasAll Arrivals
Overseas arrivals to Gauteng continue to grow
Source: SAT 2007 Annual Report & 2007 Table: GTA Strategic Research Unit
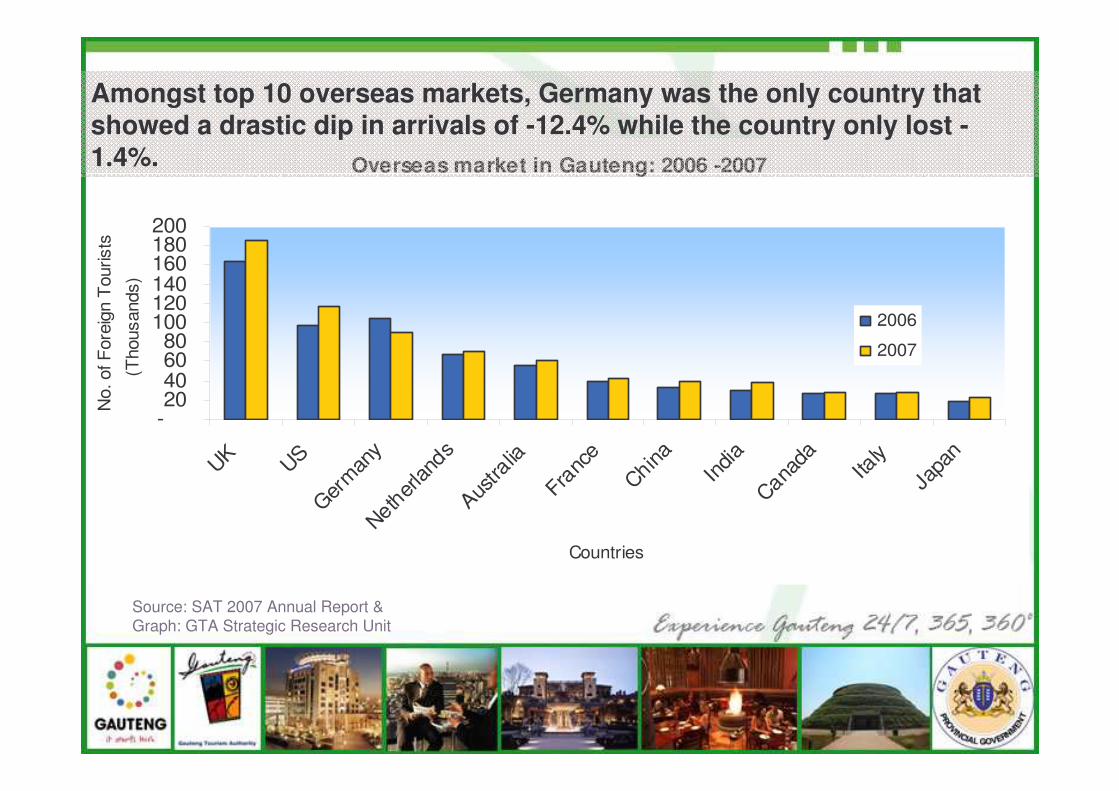
Overseas market in Gauteng: 2006 -2007
-20406080
100120140160180200
UK USGer
many
Netherlan
dsAus
tralia
Franc
e
China
India
Canada
Italy
Japa
n(T
hous
ands
)
Countries
No.
of F
orei
gn T
ouris
ts
2006
2007
Amongst top 10 overseas markets, Germany was the only country that showed a drastic dip in arrivals of -12.4% while the country only lost -1.4%.
Source: SAT 2007 Annual Report &Graph: GTA Strategic Research Unit
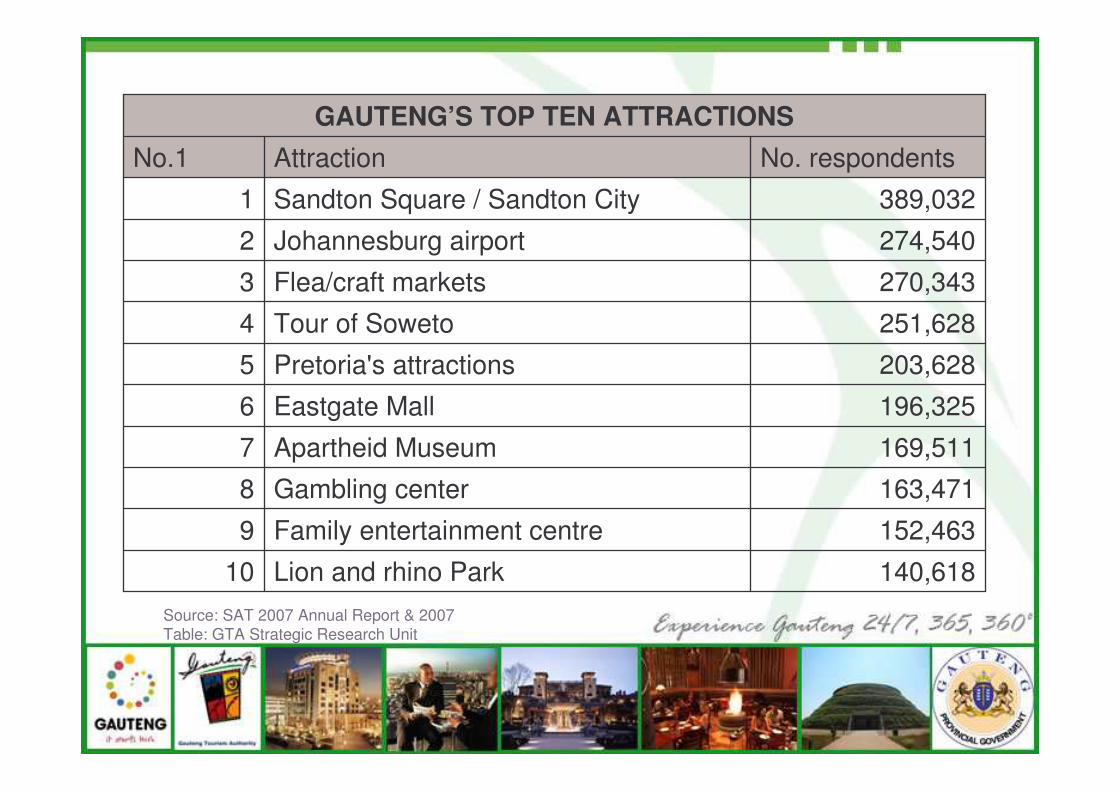
No. respondentsAttractionNo.1
140,618Lion and rhino Park10
152,463Family entertainment centre9
163,471Gambling center8
169,511Apartheid Museum7
196,325Eastgate Mall6
203,628Pretoria's attractions5
251,628Tour of Soweto4
270,343Flea/craft markets3
274,540Johannesburg airport2
389,032Sandton Square / Sandton City1
GAUTENG’S TOP TEN ATTRACTIONS
Source: SAT 2007 Annual Report & 2007 Table: GTA Strategic Research Unit
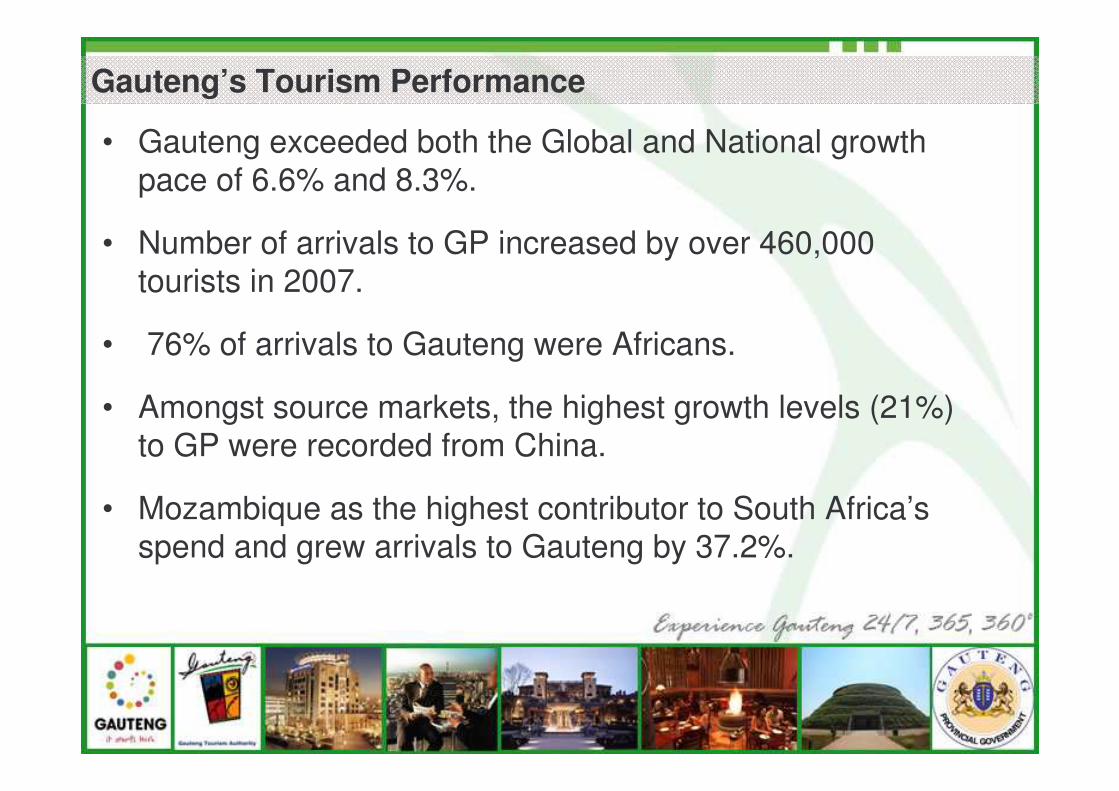
• Gauteng exceeded both the Global and National growth pace of 6.6% and 8.3%.
• Number of arrivals to GP increased by over 460,000 tourists in 2007.
• 76% of arrivals to Gauteng were Africans.
• Amongst source markets, the highest growth levels (21%) to GP were recorded from China.
• Mozambique as the highest contributor to South Africa’s spend and grew arrivals to Gauteng by 37.2%.
Gauteng’s Tourism Performance
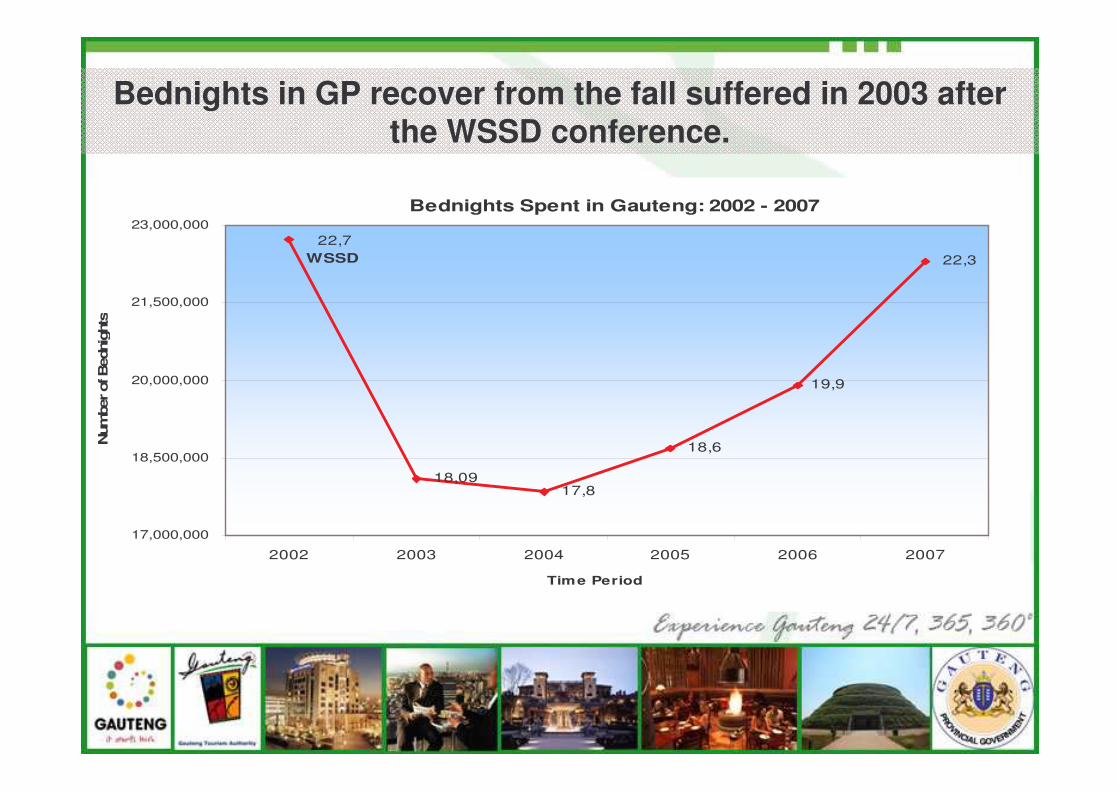
Bednights Spent in Gauteng: 2002 - 2007
22,3
19,9
22,7WSSD
18,09 17,8
18,6
17,000,000
18,500,000
20,000,000
21,500,000
23,000,000
2002 2003 2004 2005 2006 2007
Time Period
Num
ber of
Bed
nigh
tsBednights in GP recover from the fall suffered in 2003 after
the WSSD conference.
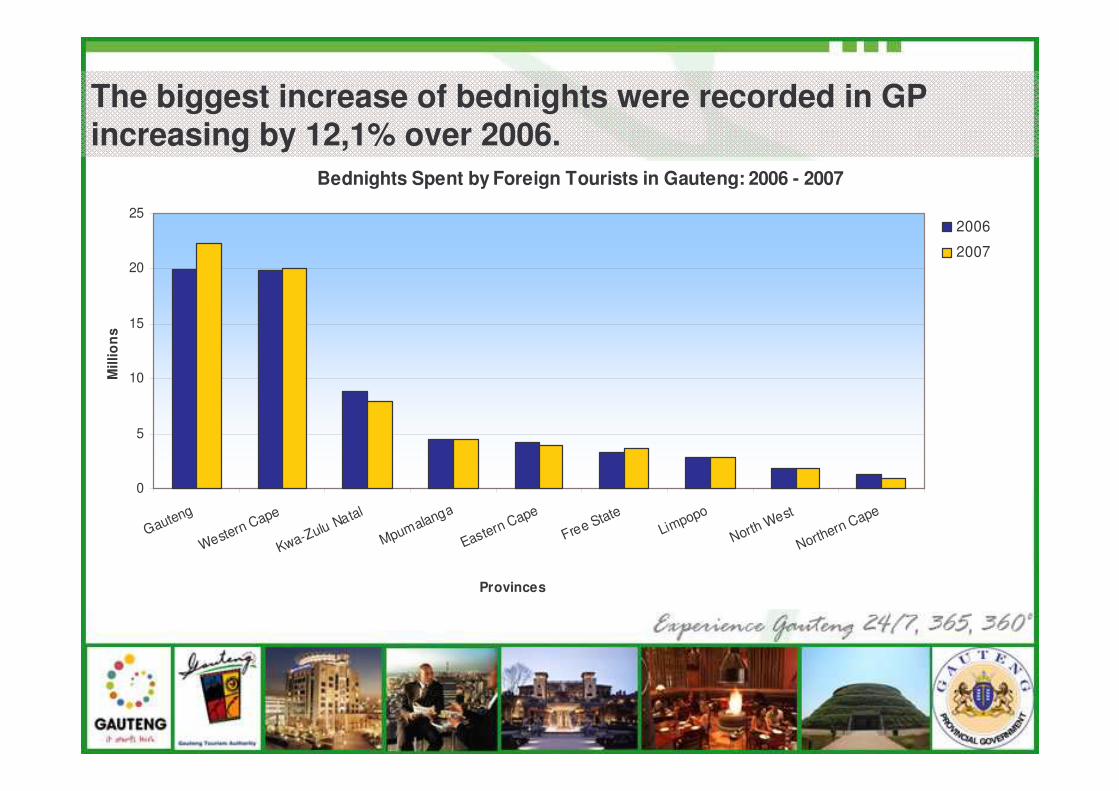
Bednights Spent by Foreign Tourists in Gauteng: 2006 - 2007
0
5
10
15
20
25
Gauteng
Western Cape
Kwa-Zulu Natal
Mpumalanga
Eastern Cape
Free StateLimpopo
North West
Northern Cape
Mill
ion
s
Provinces
2006
2007
The biggest increase of bednights were recorded in GP increasing by 12,1% over 2006.
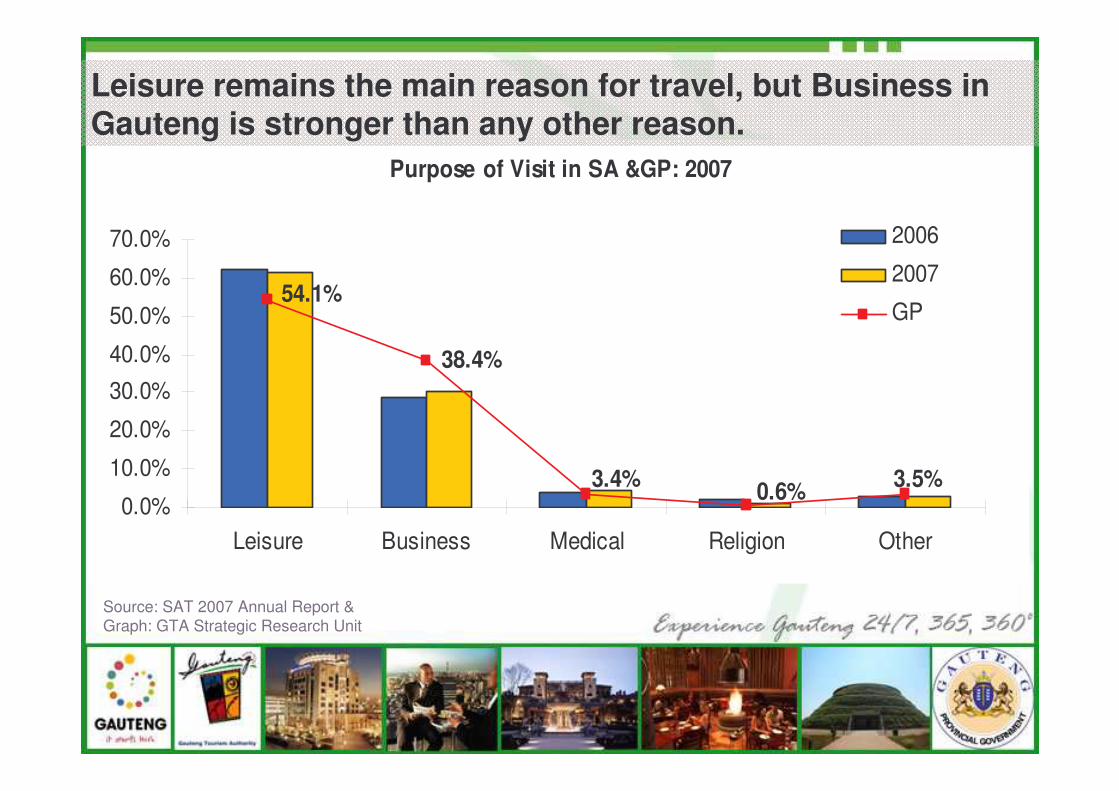
Purpose of Visit in SA &GP: 2007
38.4%
3.4% 0.6% 3.5%
54.1%
0.0%
10.0%
20.0%
30.0%40.0%
50.0%
60.0%
70.0%
Leisure Business Medical Religion Other
2006
2007
GP
Leisure remains the main reason for travel, but Business in Gauteng is stronger than any other reason.
Source: SAT 2007 Annual Report &Graph: GTA Strategic Research Unit
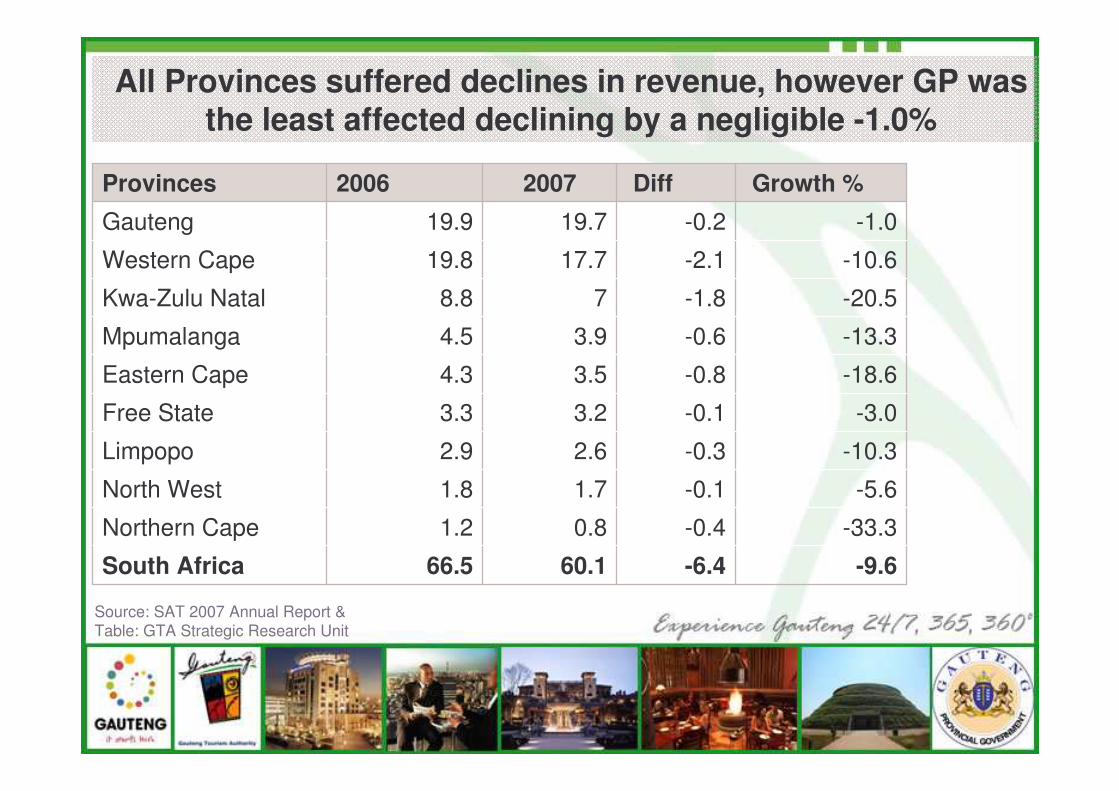
-9.6-6.460.166.5South Africa
-33.3-0.40.81.2Northern Cape
-5.6-0.11.71.8North West
-10.3-0.32.62.9Limpopo
-3.0-0.13.23.3Free State
-18.6-0.83.54.3Eastern Cape
-13.3-0.63.94.5Mpumalanga
-20.5-1.878.8Kwa-Zulu Natal
-10.6-2.117.719.8Western Cape
-1.0-0.219.719.9Gauteng
Growth %Diff20072006Provinces
All Provinces suffered declines in revenue, however GP was the least affected declining by a negligible -1.0%
Source: SAT 2007 Annual Report &Table: GTA Strategic Research Unit
• The gloomy global economy owed to the increasing price of oil and the weakening of the rand against major currencies contributed to the 9.8% decline TFDS (excl. Capex) suffered by the country.
• However, Gauteng experienced a negligible decline of -0.1% in TFDS – a minor blow compared to all other provinces.
• In spite of the decrease in spend, GP’s growth (yoy) in arrivals exceeded both the national and global growth of 6.6% and 8.3%, respectively.
In Conclusion
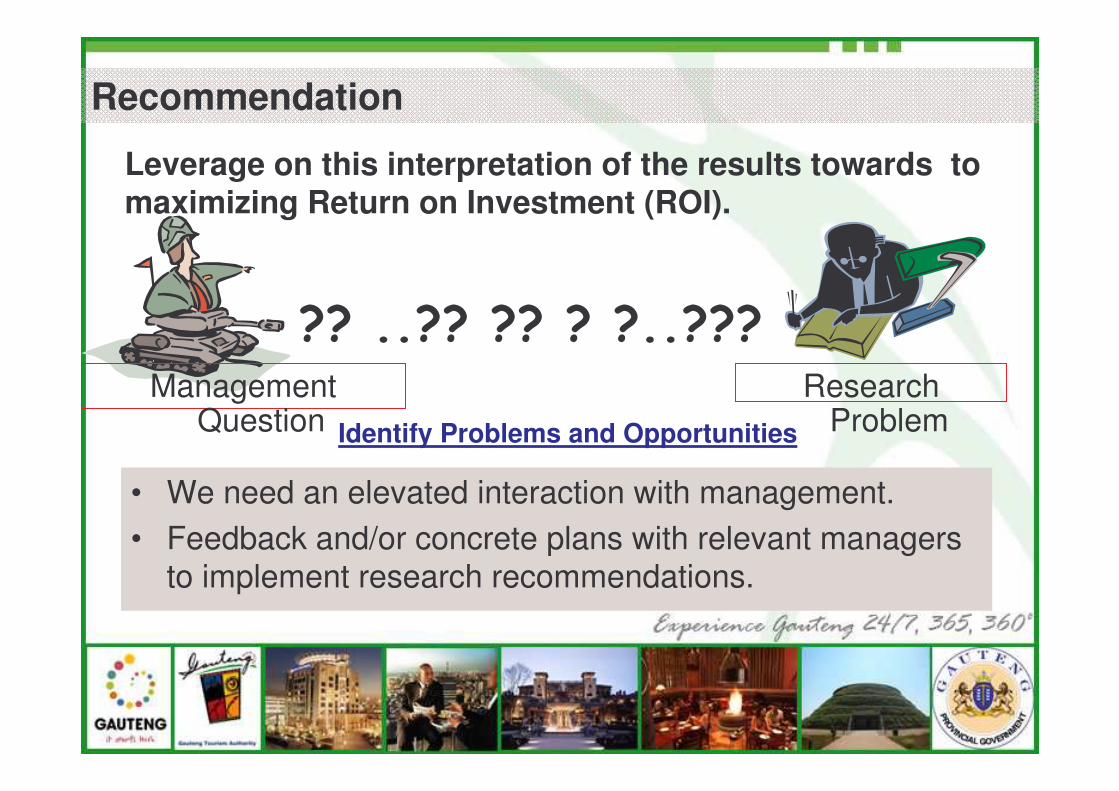
• We need an elevated interaction with management.• Feedback and/or concrete plans with relevant managers
to implement research recommendations.
Recommendation
Leverage on this interpretation of the results towards to maximizing Return on Investment (ROI).
�������������������
Research Problem
Management Question Identify Problems and Opportunities

THANK YOU!
![INBOUND MARKETING DOES NOT CLOSE DEALS [INBOUND 2014]](https://static.documents.pub/doc/80x56/559419561a28ab650d8b4634/inbound-marketing-does-not-close-deals-inbound-2014.jpg)

![SELLING INBOUND: TRANSFORM YOUR REP'S INBOUND SELLING SKILLS [INBOUND 2014]](https://static.documents.pub/doc/80x56/55d54cf8bb61ebdb228b46ca/selling-inbound-transform-your-reps-inbound-selling-skills-inbound.jpg)


