

Using ArcGIS to Study the Correlation between
Lightning Strike Density and Terrain Elevation
Alex DeCaria and Michael BabijDepartment of Earth Sciences
Millersville University

Raster vs. Vector
Vector data
• Uses points, lines, and polygons
• Attributes are assumed valid only on the given shape
• ArcGIS stores in shape files
Raster data
• Gridded data
• Attributes are assumed valid over entire cell
• ArcGIS stores in GRID files

Raster vs. Vector

Raster vs. Vector

Example of Attribute Table
232658212537122386182805122784122673151882192621PressureTemperaturePoint ID

Lightning Data
• Lightning strike positions for 1995-2001 acquired from the National Lightning Detection NetworkTM (NLDN)
– NLDN detects only cloud-to-ground lightning
– Positions are lat/lon on WGS84 datum
– Positions are accurate to within 1 km

Formatting Data• Data came as ASCII file with each record representing a
single lightning strike.– Lat/lon– Time– Signal (+ or −)
• Wrote Fortran90 program to parse data into separate years and specific location.
• Data files then read into Microsoft Access database program and converted into ArcGIS shape files (one for each calendar year)

Lightning Strike Positions for 2001

Calculating Density
• First converted data from lat/lon coordinates to meters easting and northing
• Spatial Analyst then used to calculate density.
– The density calculation creates a raster from the vector (point) lightning locations
– Need to specify search radius and cell size.

How ArcGIS* Calculates Density
( )2rcount πρ = r = search radiusd = cell size
* Need Spatial Analyst extension

Effect of Search Radius on Density Calculations
Radius = cell size Radius >> cell size

Calculating Density
• First converted data from lat/lon coordinates to meters easting and northing
• Spatial Analyst then used to calculate density.
– The density calculation creates a raster from the vector (point) lightning locations
– Need to specify search radius and cell size.
– Need to specify “simple” or “kernal” for calculations

“Simple” vs. “Kernal” for Density Calculations
Simple Kernal

Calculating Density (cont.)
• Density data are adjusted based on estimated detection efficiencies– Efficiency was 61% in 1995 and increased to
100% in 1998 and later
• Adjusted yearly densities were averaged to calculate annual average flash density map

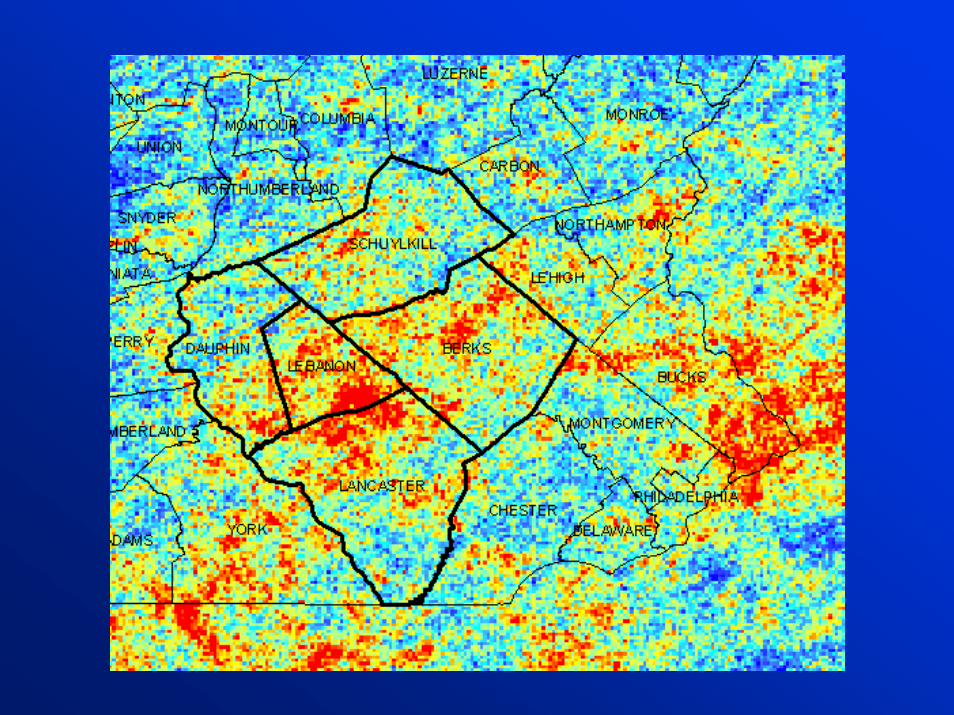
Annual Average Strike Density 1995-2001

Elevation Data
• Used USGS National Elevation Data set (~30-meter horizontal grid).
• Converted to 1-km horizontal grid using Raster Calculator feature of Spatial Analyst extension

Low-resolution Terrain Elevation

Joining Density and Elevation Data
• Used Raster Calculator to re-map density and elevation data sets onto their shared domain.

Comparision of Strike Density and Terrain Elevation

Creating Joined Elevation/Density Data File
• Converted both the elevation and density data sets into vector (point) format using the “convert” feature of Spatial Analyst.
– ArcGIS only converts integer rasters to vector form.
– Used Raster Calculator to convert real raster to integer raster
– Needed to multiply density by 10 to preserve information in decimal place.


Creating Joined Elevation/Density Data File (cont.)
• Joined the two vector data sets using the “Join” feature of Spatial Analyst.
• This creates a joined “attribute table” that contains both density and elevation information at each point.

Statistical Analysis
• Exported joined attribute table to ASCII file and then imported it into a Microsoft Excel worksheet.
• Used Microsoft Excel to create scatter plot and perform linear regression.


Conclusions• There exists a weak, yet statistically significant negative
correlation between terrain elevation and annual average lightning strike density for SE Pennsylvania.
• Suggests that orography is not the dominant factor in thunderstorm formation in this region.– Consistent with Orville and Huffines (2001)*
• Next step: Analyze data over Rio Grande Valley in New Mexico, where there appears to be a positive correlation between flash density and elevation.
* Orville, R.E. and G.R. Huffines, 2001: “Cloud-to-ground lightning in the United States: NLDN results in thefirst decade, 1989-98, Mon. Wea. Rev., 129, pp. 1179-1193

Acknowledgements
• Ken Cummins, Väisälä-GAI, Inc.– Provided lightning position data free of charge.
• Millersville University Faculty Grants Committee– Funded student research hours.
• Tom Whitfield, PA Geological and Topographic Survey– Provided topographic data and advice.


![[Arcgis] Riset ArcGIS JS & Flex](https://static.documents.pub/doc/80x56/55cf96d7550346d0338e2017/arcgis-riset-arcgis-js-flex.jpg)