

Using Social Media in Public Organizations: Promising Practices from North Carolina’s
Parks and Recreation Departments
By
Ashley Anne Barriga
A paper submitted to the faculty of
The University of North Carolina at Chapel Hill (UNC-CH)
in partial fulfillment of the requirements for the degree
Master of Public Administration
February 22, 2011
This paper represents work done by a UNC-Chapel Hill Master of Public Administration student.
It is not a formal report of the Institute of Government, nor is it the work of School of
Government faculty.
Executive Summary
This capstone explores how governmental agencies use social media, specifically Facebook and
Twitter, to present information, facilitate conversation and receive feedback. Seventy-four of the 231
County and Municipal Parks and Recreation (P&R) Departments in North Carolina have a Facebook
and/or Twitter account, each of which is managed uniquely. Despite these differences, the following
recommendations can help organizations manage social sites: (1) create the appropriate account early,
(2) use the site to its fullest capacity, (3) identify and establish roles and responsibilities and (4) plan
for, monitor and evaluate the site. By understanding the social media trend and following these
measures, local governments can take control of social media, rather than letting the individual site or
the trend manage the organization.

1 | P a g e
Background
Social media are inexpensive, if not free, online tools used to communicate and interact with others. Since
the early 21st Century, many types of social sites, such as blogs
* (LiveJournal), micro-blogs
* (Twitter), social
networks* (Facebook) and video sharing
* (YouTube), have emerged.
i But today, Facebook and Twitter are
the most popular. Launched in 2004, Facebook helps members communicate information and facilitate
dialogue; Facebook has over 500 million members.ii Twitter, which started in 2006, allows users to send
messages of 140 characters or less;iii Twitter should reach 200 million users soon.
iv (Given the nature of this
topic, technology terms are asterisked and described in Appendix Table 1.)
Government agencies have varying opinions of these sites. Many are skeptical about their impact, potential
political humiliation and legal implications, so they disregard these options.v Others believe the sites help
achieve the International City/County Management Association‟s Code of Ethics “of keeping the community
informed on local government affairs and encouraging communication …”vi Currently, 66 percent of
government agencies employ a social site, with counties and municipalities at the forefront.vii
Governmental departments can benefit from using these sites. For example, Parks and Recreation (P&R)
Departments can communicate information to a larger audience and build community at little to no cost.viii
And as Waller states, if P&R “embrace social media applications it will enable a more direct and positive
relationship with consumers, which will in turn drive increased engagement and loyalty.”ix
This study has two parts which explore social media in the public sector. First, the study examines how
North Carolina P&R Departments employ Facebook and Twitter to provide guidance on creating and
managing social sites. Second, the study analyzes social media policies and presents items to consider for a
policy. These practices apply to local governments that use or consider using a site.
Methodology
After a thorough literature review, this study spanned three stages. Each step, including the initial literature
review, is explained further in Table 2 of the Appendix.
Phase 1: Identify the P&R Departments with Facebook and/or Twitter
A three-part search identified P&R Departments with Facebook and/or Twitter. First, each County and
Municipal P&R Department website was explored for a link to a departmental Facebook or Twitter account.
If no account was discovered, a search was done on Facebook and Twitter, under predetermined titles, for
each P&R Department. Finally, if no account was located, the P&R Director was emailed and asked whether
the Department uses either social site. Of the 231 County and Municipal P&R Departments, 74 were found
to have Facebook and/or Twitter (see Appendix Table 3 and Chart 1).
Phase 2: Survey P&R Departments with Facebook or Twitter
An electronic survey, consisting of 30 questions, was administered to the Director, or designee, of each
Department identified in Phase One. To understand how and why P&R Departments invest their efforts with
Facebook and/or Twitter, the survey examined:
Whether Facebook or Twitter was used and when each site was launched;
The purpose and reason for the sites;
How the sites are employed and managed;
What type of social media policy is in place and
What challenges or issues the Department faced.

2 | P a g e
For accurate and representative results, two measures were taken. First, three jurisdictions piloted the survey;
the feedback was valuable but did not drastically alter the questions. Second, Directors who did not initially
respond received up to two electronic reminders (see Appendix Image 1 for the survey).
Phase 3: Analyze the Policies of Survey Respondents
All Departments included in the survey analysis were contacted regarding their policies. These organizations
were asked whether the County or Municipality or the Department itself had a social media policy. An
analysis of the obtained policies revealed similarities and other essential factors. Thus, this step uncovered
additional data about how the Departments manage social media.
This study had a few limitations. One was the lack of scholarly research on social media and P&R. Another
was the low response rate to the email in Phase One; these data categorized Departments to be surveyed.
Last, the number of qualified participants led to a small number of observations, making statistical analysis
nearly impractical. Given these limitations, this research draws conclusions and offers recommendations
regarding the (1) creation and management of social sites and (2) formulation of a social media policy.
Findings and Recommendations
Part I: Survey Results and Recommendations
Of the 74 P&R Departments with Facebook and/or Twitter, 63% responded to the survey. The analysis
excludes five responses – one because the respondent only answered three survey questions and the others
because they said they are not a Facebook or Twitter account holder. Therefore, the analysis and
recommendations are based on 42 respondents.
Survey Findings
The survey reveals the following conclusions.
Use and Age of Accounts
P&R Departments employ Facebook more than Twitter. All 42 respondents have Facebook, with
page accounts* as the most common type, while 14 have Twitter (see Appendix Chart 2). Most of
these accounts, as Appendix Charts 3 and 4 show, are less than two years old. Also, the longer a
Department has had Facebook, the more likely it is to use Twitter (see Appendix Table 4).
Overall Motives
Two reasons P&R Departments create social sites are to communicate and engage citizens and to
market programs and services. More than half of survey respondents post information about events,
programs, classes, arts and/or cultural arts and parks, greenways and facilities. Thus, the content
posted on these sites align with the Departments‟ stated purpose for starting and maintaining social
sites (see Appendix Chart 5 and Table 5).
Main Concerns
Respondents express minimal concern over the potential problems of these sites. The main concern
is the legal implications, but only five Departments identified this issue. Other factors are the lack of
staffing knowledge, staffing time and funding (see Appendix Table 6). The survey respondent‟s
expertise and the nature of his/her work could influence the items emphasized; for example IT staff
may worry about security breach while HR employees may agonize about reputational damage.
Time Necessary to Update and Maintain Accounts
Although Departments update these sites frequently, they do not require excessive time. Many P&R
update Facebook weekly (42.9%) or daily (28.6%) (see Appendix Chart 6). More than half of them,
however, allocate less than five hours a month to the account. The frequency of updating Twitter is

3 | P a g e
more dispersed; but 12 of the 14 Departments spend less than five hours a month on the site, which
further corroborates this finding (see Appendix Chart 7 and 8).
Responsibilities for Supervising and Updating
In many Departments, the Director, Supervisor and/or Staff oversee the account as well as post and
update content (see Appendix Chart 9 and Chart 10). Several organizations designate more than one
employee to each of these tasks (see Appendix Table 7). In addition, many departments – 29 users of
Facebook and 13 of Twitter – assign the same employees to fulfill both functions.
Evaluation Methods
A majority of respondents do not analyze their use of these sites. Of the 42 Facebook account
holders, 14 evaluate their use of Facebook. As Table 8 in the Appendix details, these Departments:
Track the activity manually, such as counting fans, posts, etc,
Analyze weekly reports provided by Facebook and
Ask citizens how they heard about the event and if they utilize the social media site.
In addition, the one Twitter user that tracks its activity does so by measuring outputs, such as
number of retweets and responses.
Use of Third Party Systems
Organizations tend to overlook third-party systems*, like Twitterfeed or Hootsuite. Only six
Departments with Facebook and six with Twitter have implemented a third-party system (see
Appendix Table 9). Analysis indicates that larger Departments are more likely to use these systems
for Facebook (see Appendix Table 10).
Governing Policies
P&R Departments regulate these sites differently. Of the 42 respondents, 17 follow a County or
Municipal policy; of the adopted policies, most became official within the last two years.
Additionally, only one department has a departmental policy while 19 have an informal social media
policy (see Appendix Chart 11 and Chart 12).
Recommendations
The following recommendations apply to governments with or without existing social sites.
1. Don‟t wait – create an appropriate account for the organization: Organizations should create an
account early and understand the specific terms of agreement to set up the right type of account.
Creating an account early can prevent others from establishing one in the organization‟s name. In
this study, for instance, four respondents say they do not have Facebook or Twitter, but the
Department has a searchable account; someone not currently affiliated with the organization must
have started the account. Additionally, agencies must understand the terms of agreement so they
employ the proper type of account. Facebook, for example, requires organizations to use a page
account* not a friend account; entities using the wrong type can lose privileges on the site.
x As Cole
explains, “Yes it is risky to be a pioneer, but in a rapidly changing world, it‟s even riskier to be left
behind.”xi So, create the right type of account and create it early.
2. Use the site to its fullest capacity: Linking social sites to municipal and departmental webpages and
using third party systems are two tactics to maximize the use of Facebook and Twitter. Social media
and webpages have unique purposes. xii
By linking social sites to the webpage, the organization
establishes consistency and credibility; by linking the webpage to social media, through identifiable
icons, the audience that knows about and possibly uses the site increases.xiii
Furthermore, third-party

4 | P a g e
systems*, like Twitterfeed and Hootsuite feed data from one site into multiple sites. These tools help
communicate consistent information, save time, increase collaboration and monitor as well as track
data.xiv
Several practitioners found these tactics to maximize the benefits of social media.
3. Identify and establish roles and responsibilities: To effectively manage social sites, organizations
should clarify and communicate employee roles and responsibilities. As Di Maio and McClure
explain, having a “standardized content management process to release and retire content, as well as
to monitor user comments and tags” ensures the account positively portrays the organization. xv
Thus, agencies should identify different employees to post and update content and to oversee the site.
Employees should also understand the importance of communicating accurate, timely and pertinent
information through authentic messages.xvi
As research shows, the most flourishing municipalities
update sites, like Facebook and Twitter, at least once a day with relevant postings.xvii
Moreover,
clearly determined and communicated roles and responsibilities are vital to the site‟s success.
4. Plan for, monitor and evaluate the site and make necessary changes: Organizations should have an
established and implemented policy and evaluation plan. A social media policy can mitigate
communication problems and protect the agency‟s reputation.xviii
To create this policy, the
organization should discuss the site‟s potential risks and strategies with employees with various
expertise as they bring different ideas and solutions to the table. As Walls and Di Maio state, assess
the risks “in terms of probability of occurrence and scale of impact to … establish risk management
priorities.”xix
Furthermore, an evaluation plan, which draws on a combination of output, efficiency
and effectiveness measures, can identify if the organization is using the correct site, if objectives are
being met and if changes are needed. xx
A policy and evaluation plan are essential in managing the
site.
Part II: Policy Analysis and Recommendations
Policy Analysis
To further understand how jurisdictions manage social sites, 17 County or Municipal policies and one
departmental policy were obtained and analyzed in detail. Of the 18 policies, 11 are standalone social
media/network policies. The other seven address this topic in a section of or throughout an existing policy.
Of these 18 policies, 13 have been officially adopted.
Many items appear in the policies. Over half of the documents state the:
Definition of social media.
Purpose of social media.
Employees covered by the policy.
Way an employee should carry him/herself or present information on these sites.
Site is department managed.
Basic information on public record and retention laws.
Restrictions on an employee‟s personal use of these sites.
Several policies also explain who and how many employees supervise and/or maintain the site; the process to
create a social site; the type of inappropriate information that can and will be edited and/or removed and the
process to edit or remove information or an entire site. Table 11 in the Appendix lists all 25 items.
Recommendations
When creating a policy it is critical to include employees with various expertise. Each employee can
emphasize different ideas. So although Human Resources should spearhead the development and

5 | P a g e
implementation of the policy, the County/Municipal Attorney, Manager, Information Technology
Department, Communications Department and other Departments that can use social sites should be
represented. This team of employees can “matter a great deal” with the social site.xxi
In creating a policy, refer to the items in Appendix Table 11. Strongly consider the factors below.
1. Explain that social sites are secondary to the webpage: As Waller explains, “your website is the most
stable communication tool the agency owns and social media should be used in tandem with the
website for effective communication and marketing.”xxii
The policy should highlight the value of the
website and the fact that it takes precedence over social media.
2. Require a business case or proposal for the site: A business proposal helps organizations clarify the
intended goal, audience and strategy which influences the site to use. Research found that
governments without a carefully considered plan for a social site have been less successful.xxiii
Thus,
the policy should state this requirement and the importance of the document.
3. Centralize the management of the site: Many municipalities emphasize the value of having
centralized control over the posting of information on these sites.xxiv
So, identify who maintains the
log-ins and passwords to ensure one employee does not own access to the site. And determine how
often an individual outside the department will monitor the site. Both of these actions help protect
the reputation of the organization and should be explained in the policy.
4. Describe the process for handling problems: Analyze, communicate and discuss anticipated issues as
well as specific mitigation strategies.xxv
At minimum, the policy should include the process for
identifying and communicating current as well as potential challenges and, if possible, the
predetermined mitigation strategies.
5. Explain or reference the disciplinary procedure for inappropriate behavior: As Bittinger and Di Maio
found, staff should know and understand “relevant organizational strategies, policies, governance
mechanisms, risks and potential implications of their action[s].”xxvi
To clarify these expectations, the
policy should specifically address acceptable versus unacceptable behavior of employees and the
consequences of inappropriate actions.
6. Create guidelines for the public; communicate them internally and externally: Many jurisdictions
have a policy regulating the public‟s use of social sites. Kingsley found that these guidelines “make
editorial decisions much less painful” since they provide justification for what to remove or edit.xxvii
Thus, the policy and social site should communicate the guidelines for or expectations of the public.
Three comprehensive, yet unique, policies to reference as a guide are: the City of Greensboro‟s Employee
Use of Social Networks; Alamance County‟s Social Media Web Site Policy and Cabarrus County‟s External
Communication Policy.
Conclusion
As this research shows and the recommendations suggest, governments should invest effort in social media.
Social sites provide innovative ways to communicate, allow for discussion, increase collaboration and build
relationships.xxviii
Although social media is constantly evolving, the low costs and resource requirements
make it a valuable tool. When considering which sites to use, Facebook and Twitter are “must haves;” they
are currently the most popular, each with a unique purpose and audience.xxix
There is not one correct way to
employ these or other social sites. But to be successful, organizations should at least understand the site‟s
purpose, detail the reason and strategy for using the site, create and implement necessary policies and design
an evaluation plan. It is better to control social media than to let social media control the organization.

6 | P a g e
i (n.a.). (2010, February 17). 23 Types of Social Media Sites [Social Media Description]. Retrieved from
http://onbloggingwell.com/23-types-of-social-media-sites/ ii Zuckerburg, M. (2010). Facebook Factsheet. Retrieved from
http://www.facebook.com/press/info.php?factsheet iii
Chavez, C. (2009). Do Local Governments tweet? Public Management, 91, 13. iv Murphy, D. (2010). Twitter: On-Track for 200 Million Users by Year’s End. Retrieved from
http://www.pcmag.com/article2/0,2817,2371826,00.asp v Kingsley, C. (2010). Making the Most of Social Media: 7 Lessons from Successful Cities. Retrieved from:
http://www.fels.upenn.edu/news/making-most-social-media, 6. vi Perego, M. (2009). SOCIAL MEDIA IN PUBLIC LIFE. Public Management, 91, 2.
vii Smith, D. (2010). Connecting Government to Improve It. T + D, 64, 24.
viii Cole, R. (2009). SOCIAL MEDIA: What Does It Mean for Public Managers? Public Management, 91, 10-11.
ix Waller, S.N. (2010). Social Media for Public Parks and Recreation Organizations: Bridging the
Communication Gap. PA Times, 33, 6. x (n.a.). (2010). Facebook Pages Terms. Retrieved from http://www.facebook.com/terms.php#!/ terms_pages.php
xi Cole, R. (2009). SOCIAL MEDIA: What does it Mean for Public Managers? Pubic Management, 91, 11.
xii Waller, S.N. (2010). Social Media for Public Parks and Recreation Organizations: Bridging the
Communication Gap. PA Times, 33, 6. xiii
Kingsley, C. (2010). Making the Most of Social Media: 7 Lessons from Successful Cities. Retrieved from:
http://www.fels.upenn.edu/news/making-most-social-media, 16. xiv
http://hootsuite.com// xv
Di Maio, A. and McClure, D. (2009). Facebook, YouTube or None? Opportunities and Risks With
Government Use of Social Media. Gartner, 4. xvi
Ramers, J. (2010). Using Social Media to Connect with Your Community. Retrieved from
http://www.activecommunities.com/resources/on-demand-webinars.htm xvii
Kingsley, C. (2010). Making the Most of Social Media: 7 Lessons from Successful Cities. Retrieved from:
http://www.fels.upenn.edu/news/making-most-social-media, 18. xviii
Waller, S.N. (2010). Social Media for Public Parks and Recreation Organizations: Bridging the
Communication Gap. PA Times, 33, 7. xix
Walls, A. and Di Maio, A. (2009). New U.S. Government Security Guidelines for Social Media Are a Start,
but Only a Start. Gartner, 4. xx
Yost, L. (2010). You‟ve Got … Tweets. Parks and Recreation, 45, 50. xxi
Kingsley, C. (2010). Making the Most of Social Media: 7 Lessons from Successful Cities. Retrieved from:
http://www.fels.upenn.edu/news/making-most-social-media, 14. xxii
Waller, S.N. (2010). Social Media for Public Parks and Recreation Organizations: Bridging the
Communication Gap. PA Times, 33, 6. xxiii
Kingsley, C. (2010). Making the Most of Social Media: 7 Lessons from Successful Cities. Retrieved from:
http://www.fels.upenn.edu/news/making-most-social-media, 13. xxiv
Kingsley, C. (2010). Making the Most of Social Media: 7 Lessons from Successful Cities. Retrieved from:
http://www.fels.upenn.edu/news/making-most-social-media, 10. xxv
Walls, A. and Di Maio, A. (2009). New U.S. Government Security Guidelines for Social Media Are a Start,
but Only a Start. Gartner, 4. xxvi
Bittinger, S. and Di Maio, A. (2010). Four T‟s Framework Facilitates Employee Social-Media Engagement
With External Stakeholders. Gartner, 4. xxvii
Kingsley, C. (2010). Making the Most of Social Media: 7 Lessons from Successful Cities. Retrieved from:
http://www.fels.upenn.edu/news/making-most-social-media, 13. xxviii
Kingsley, C. (2010). Making the Most of Social Media: 7 Lessons from Successful Cities. Retrieved from:
http://www.fels.upenn.edu/news/making-most-social-media, 4. xxix
Yost, L. (2010). You‟ve Got … Tweets. Parks and Recreation, 45, 50.

7 | P a g e
Table 1: Definition of Technical Terms
Term Definition
Social Networks Social Networks are a type of social media. Social Networks are online sites that
work to build and maintain the social relationships among individuals and entities.
These networks allow users to communicate and share activities, ideas, events,
interests with others that they choose to connect with.
Blogs Blogs are another type of social media. Researchers define blogs “as interactive,
non-synchronous webpages whose host uploads postings that center around a topic.”
Typically, blogs include a comments section in which viewers can comment on the
original posting or other comments made.
Micro-Blogs Micro-blogs are another type of social media. Micro-blogs are similar to blogs in
that through this technology information around any topic is communicated. Micro-
blogs differ from blogs in that the size of the content is limited. For example,
Twitter, a micro-blogging site, supports the communication of messages that are 140
characters or less.
Video Sharing Video sharing is another type of social media. Through this site, users can upload
videos or video clips. The host of the site will store the video and allow others to
view the video.
Page Accounts Pages are a type of Facebook account that users can create. A page account should
be created by businesses or political, commercial or charitable organizations. These
entities can use page accounts to promote their cause.
Third-party systems Third-party systems are technologies that enable individuals and organizations to
have data that are entered into one site feed into many other sites. For example,
when a message is entered into a third-party system, the message can post on
Facebook and Twitter simultaneously. Examples of third-party systems include
Twitterfeed, Hootsuite and RSS.

8 | P a g e
Table 2: Detailed Description of the Methodology
Detailed Description of Step
Pre-
Step
The goal was to gather preliminary information on social media. Research centered on the background of social
media and its use by local governments and Parks and Recreation. I referenced the University of North Carolina
at Chapel Hill‟s Library Resources heavily throughout this step.
Step 1
This step uncovered which P&R Departments use Facebook and/or Twitter. To achieve this objective, I:
1. Conducted a search on each of the 76 County and 155 Municipal P&R Department websites. If the
website had a link to a department Facebook or Twitter account, I explored and confirmed the social site
and documented the information. If the website did not have a link or the site could not be confirmed,
the investigation continued onto the next stage.
2. Searched Facebook and Twitter, for each county or municipality, under the following predetermined
titles of: (1) „County/Municipality Parks and Recreation‟, (2) „County/Municipality Park(s)‟, (3)
„County/Municipality Recreation‟ and (4) „County/ Municipality‟ for the first 75 results. If I found an
account, I documented the information; if not, the search continued.
3. Contacted the P&R Director. This email briefly explained the project and asked whether the Department
used Facebook and/or Twitter.
This process identified a total of 74 P&R Departments.
Step 2
All 74 P&R Departments identified in Step One as using Facebook and/or Twitter received an electronic survey,
consisting of 30 questions. This survey examined:
1. Whether Facebook and/or Twitter are used and when each one was started.
2. The purpose of or reasons for using these sites.
3. How these accounts are managed.
4. What type of social media policy is in place and when it was adopted.
5. Whether these sites are evaluated and what types of evaluation measures are used.
6. What challenges or issues were faced in establishing and/or managing these sites.
Two measures ensured that results were accurate and representative. First, before the administration of the test,
three jurisdictions piloted the survey; the feedback was valuable but did not significantly alter the survey. In
addition, the Director, or designee, of Departments that had yet to participate in the study received up to two
electronic reminders that encouraged heir participation.
Of the 74 Departments identified in Step One, 47 responded to the survey. The analysis excludes five
respondents -- one respondent only answered three questions and the other four said they did not have a
Facebook or Twitter account. So, only 42 Departments are included in the analysis.
Step 3
All 42 Departments included in the survey analysis were contacted regarding their social media policies. These
departments were asked whether the County or Municipality had a policy governing the use of social sites and
whether the Department had its own policy. An analysis of the obtained policies helped identify similarities and
other essential factors. This step gathered additional data about how the Departments manage social media.

9 | P a g e
Table 3 : Number of P&R Departments with a Facebook and/or Twitter Account
Using Facebook
and/or Twitter
Total
Departments
Percentage of
Departments
County P&R Dept. 20 76 26.3%
Municipal P&R Dept. 54 155 34.8%
Total Population 74 231 32.0%
Chart 1: Percentage of P&R Departments with Facebook and/or Twitter
Chart 2: Types of Facebook Accounts Employed by P&R Departments
Yes
32%
No
68%
P&R Depts Using Facebook and/or Twitter
13
29
9 9
0
5
10
15
20
25
30
35
People (Friend) Page (Fan) Group Event
Nu
mb
er o
f D
epts
.
Type of Account
Types of Facebook Accounts Used

10 | P a g e
Chart 3: Length of Time Respondent have Used Facebook
Chart 4: Length of Time Respondents have Used Twitter
Table 4: Relationship Between Length of Time with Facebook and Twitter Usage
How long ago did the
Department start
using Facebook?
Does the Department or a Division/
Program have a Twitter account?
Pearson
Correlation .398
**
Sig. (2-tailed) .009
N 42
**The longer a Department had Facebook, the more likely it is to have a Twitter account.
28.6%
33.3%
33.3%
4.8%
Length of Time Using Facebook
0 - 6 months
7 months - 1 year
1 - 2 years
2+ years
7.1%
35.7%
42.9%
14.3%
Length of Time Using Twitter
0 - 6 months
7 months - 1 year
1 - 2 years
2+ years

11 | P a g e
Chart 5: Reasons Respondents Established Social Sites
Table 5: Content that P&R Departments Post on Social Sites
Type of Information Facebook Twitter
Event Information 88.10% 92.86%
Program Information 85.71% 78.57%
Class Information 78.57% 64.29%
Arts and/or Cultural Arts 69.05% 57.14%
Park, Greenways and Facility Information 47.62% 50.00%
Hours of Operation 42.86% 7.14%
Public Meetings 35.71% 35.71%
Construction Updates 30.95% 14.29%
Job Opportunities 4.76% 0.00%
Policy Information 2.38% 14.29%
I Don't Know 2.38% 0.00%
Other (please specify) 2.38% 0.00%
Table 6: Challenges with Social Media Faced by Respondents
Type of Challenge Number of Depts.
Legal implications (1st Amendment, Public Records Law) 5
Lack of staffing knowledge 2
Lack of staffing time 2
Lack of funding resources 1
Increased bandwidth consumption 0
Loss of control 0
Productivity Loss 0
Reputational Damage 0
Security breach 0
39
36
17
13
2
1
0 10 20 30 40 50
Communicating/Engaging
Marketing …
Networking
Updating for Emergencies
Recruiting and Hiring
Other
Number of Departments
Rea
son
sReasons for using Social Sites

12 | P a g e
Chart 6: Frequency that Departments Update Facebook
Chart 7: Frequency that Departments Update Twitter
Chart 8: Time Respondents Allocate to Twitter
0.0%
28.6%
42.9%
2.4%
4.8%
4.8%
16.7%
Frequency of Updating Facebook
Hourly
Daily
Weekly
Bi-monthly
Monthly
I Don't Know
Other (please
specify)
0%
29%
14%
7%22%
7%
21%
How frequently is Twitter updated?
Hourly
Daily
Weekly
Bi-monthly
Monthly
I Don't Know
Other
85.7%
7.1%7.1%
Time Spent on Twitter a Month
0-5 hours
6-10 hours
11-15 hours
16-20 hours
21+ hours

13 | P a g e
Chart 9: Assignment of Responsibilities for Facebook
Chart 10: Assignment of Twitter Responsibilities
0
1
25
14
4
14
2
1
0
1
20
15
4
22
2
2
0 10 20 30
Volunteer
Intern of P&R
Staff of P&R
Supervisor of P&R
Assistant Director of P&R
Director of P&R
Marketing Coordinator
County or Municipal PIO
Number of Depts.
Em
plo
yee
Management of Facebook
Supervising
Posting,
Updating
0
1
8
6
2
3
1
1
8
6
2
4
1
0 2 4 6 8 10
Volunteer
Intern
Staff
Supervisor
Assistant Director
Director
County/Municipal PIO
Number of Depts.
Em
plo
yee
Designated Responsibilities for Twitter
Supervising
Posting,Updating

14 | P a g e
Table 7: P&R Departments with One, Two and Three Employees doing Each Function
Number of Departments
Supervising
Posting/Updating
Supervising
Posting/Updating
One Employee 21 24 6 7
Two Employees 18 17 8 7
Three Employees 3 1 0 0
Table 8: Evaluation Methods for Facebook Utilized by Respondents
Type of Evaluation Done Number of Depts.
Track Activity Only 4
Analyze Weekly Reports Only 2
Follow-up with Citizens Only 3
Track Activity and Analyze Weekly Reports 3
Track Activity and Follow-up with citizens 2
Table 9: Respondents’ Use of Third Party System
Number of Depts. Using Type
Type of Third Party System For Facebook For Twitter
Twitterfeed 3 2
Hootsuite 1 1
Another RSS 0 0
Other 0 1
Use 2 or More Systems 2 2
For Facebook and Twitter, a department that uses 2 or more third party systems is
either using Twitterfeed and Hootsuite or Twitterfeed and Another RSS feed.
But as seen through the number of departments that use third party systems, not
many departments are taking advantage of these tools.
Table 10: Relationship Between Size and Third Party System
How many FTEs are in
the Parks and
Recreation
Department?
The P&R does NOT
use a third party
system.
Pearson Correlation -.582**
Sig. (2-tailed) .001
N 30
**The larger the department, the more likely it is to use a third party system for Facebook.

15 | P a g e
Chart 11: Types of Policies Respondents Have in Place
Chart 12: Length of Time County/Municipal Policy has been Adopted
40.5%
2.4%
45.2%
59.5%
97.6%
50.0%
0.0% 0.0%4.8%
0.0%
10.0%
20.0%
30.0%
40.0%
50.0%
60.0%
70.0%
80.0%
90.0%
100.0%
County/City
Policy
Department
Policy
Informal Policy
Per
cen
tage
of
Dep
art
men
ts
Type of Policy
Existing Policies by Type
Yes
No
I Don‟t Know
18%
23%
24%
6%
29%
Length of Time Policy withAdopted Policy
0 - 6 months
7 months - 1 year
1 - 2 years
2+ years
No Response

16 | P a g e
Table 11: Common Policy Items
Details on Policies Count Percentage
Policy for the County/City 17 94.4%
Policy for the Department 1 5.6%
Adopted Policy 13 72.2%
Own Social Media/Network Policy 11 61.1%
Item in Policy Count Percentage
Way an employee should carry him/herself or present info on
these sites 15 83.3%
Definition of Social Media or examples 14 77.8%
Purpose of Social Media 13 72.2%
The employees covered by the policy 12 66.7%
Restrictions on Employee's Personal Use 11 61.1%
Department Managed 10 55.6%
Information on the public record and retention laws 10 55.6%
Who/how many people supervise and/or maintain the site 9 50.0%
Process to Create 8 44.4%
State what information is inappropriate (it can be edited or
removed) 8 44.4%
The process to edit or remove information or to completely
remove a site 8 44.4%
Someone outside the Department checks the site periodically
and/or maintains log-in information 7 38.9%
Disciplinary Action for misuse of the site 7 38.9%
Incorporation into other marketing and communication tools
(website) 6 33.3%
The types of social sites that can be used 5 27.8%
The frequency in which to check/update the site 5 27.8%
Types of Facebook accounts allowed 4 22.2%
The types of information that must be posted on the site 4 22.2%
Requirement of a business case or proposal to create a site 4 22.2%
Policy/Guidelines for the Public's Use of these Sites 4 22.2%
Statement that any social site is second to the website 3 16.7%
Create and/or use an evaluation plan or evaluation tools 2 11.1%
Restrictions on the Public's abilities with these sites 2 11.1%
Steps/Process to fix issues on or with these sites 1 5.6%
Declaration to the public that it is a moderated site 1 5.6%

17 | P a g e
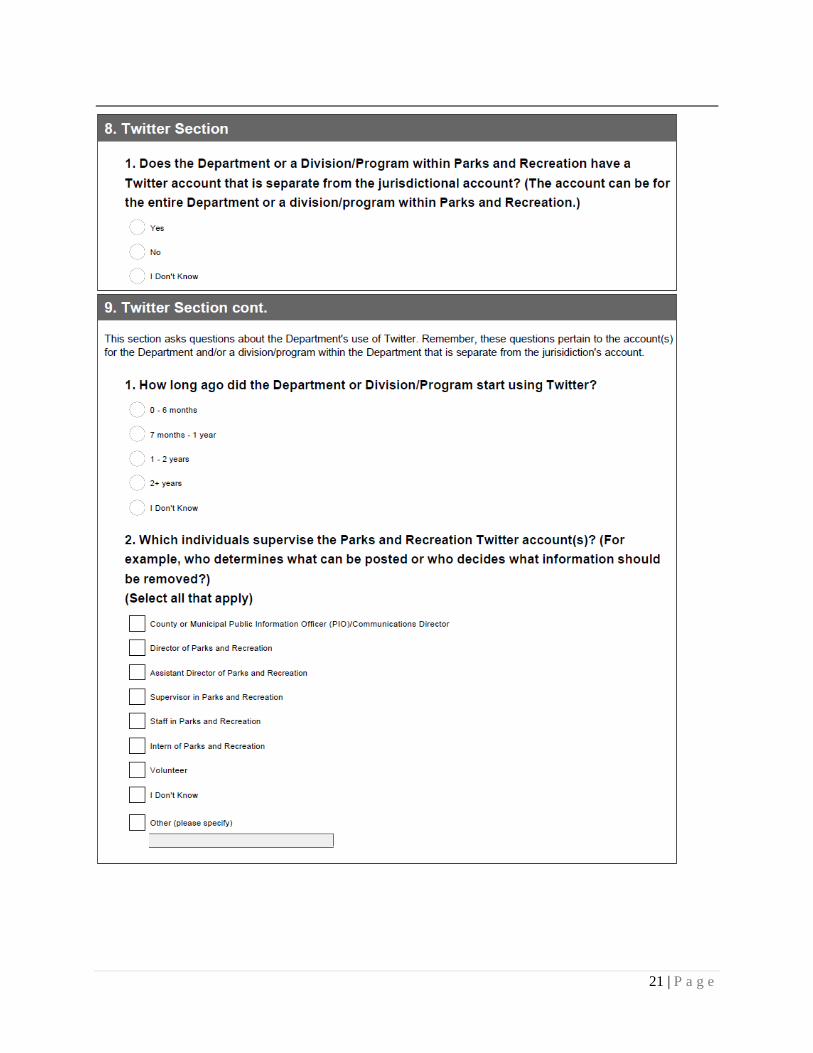
Image 1: Survey Questions

18 | P a g e

19 | P a g e

20 | P a g e
21 | P a g e

22 | P a g e

23 | P a g e

24 | P a g e

25 | P a g e

26 | P a g e
Acknowledgements The author would like to acknowledge her Capstone advisory committee – Maureen Berner, Shannon
Tufts and Lynn Setzer. These faculty members provided valuable insight and feedback. Chairperson,
Maureen Berner, who has extensive experience with survey methodology and research methods,
contributed tremendously to the development of the research proposal and formation of the survey.
Shannon Tufts, with her in depth knowledge of social media, provided valuable advice about the type of
data that should be collected and assisted with the data analysis. And Lynn Setzer, who has worked as a
communication consultant and lecturer, offered critical insight into the development and presentation of
this report. These faculty members were essential to the success of this research.
Additionally, the author would like to recognize each North Carolina Parks and Recreation Department
and Parks and Recreation staff member that participated in this study. Without their involvement and
input, these results would not be as comprehensive, accurate or representative. Thank you very much!

27 | P a g e
Bibliography
Bittinger, S. and Di Maio, A. (2010). Four T‟s Framework Facilitates Employee Social-Media
Engagement With External Stakeholders. Gartner, 1-7.
Chavez, C. (2009). Do Local Governments tweet? Public Management, 91, 13-13.
Cole, R. (2009). SOCIAL MEDIA: What does it Mean for Public Managers? Pubic Management, 91, 8-
12.
Di Maio, A (2008). How Governments Can Use Social Networks. Gartner, 1-7.
Di Maio, A. (2008). Web 2.0 Opportunities Abound in Most Government Domains. Gartner, 1-20.
Di Maio, A. (2009). Comparing Social-Media Policies for Government. Gartner, 1-5.
Di Maio, A. (2009). Government 2.0: Gartner Definition. Gartner, 1-6.
Di Maio, A. (2009). Government Employees on Social Networks: Reversing the Burden of Proof.
Gartner, 1-6.
Di Maio, A. and McClure, D. (2009). Facebook, YouTube or None? Opportunities and Risks With
Government Use of Social Media. Gartner, 1-6.
Di Maio, A., Claps, M. and Vining, J. (2009). Predicts 2010: Information Management Governance and
Security Issues Will Challenge Governments. Gartner, 1-8.
http://hootsuite.com//
Kingsley, C. (2010). Making the Most of Social Media: 7 Lessons from Successful Cities. Retrieved
from: http://www.fels.upenn.edu/news/making-most-social-media, i-30.
Murphy, D. (2010). Twitter: On-Track for 200 Million Users by Year’s End. Retrieved from
http://www.pcmag.com/article2/0,2817,2371826,00.asp
(n.a.). (2010). Facebook Pages Terms. Retrieved from http://www.facebook.com/terms.php#!/
terms_pages.php
(n.a.). (2010, February 17). 23 Types of Social Media Sites [Social Media Description]. Retrieved from
http://onbloggingwell.com/23-types-of-social-media-sites/
Perego, M. (2009). SOCIAL MEDIA IN PUBLIC LIFE. Public Management, 91, 2-3.
Ramers, J. (2010). Using Social Media to Connect with Your Community. Retrieved from
http://www.activecommunities.com/resources/on-demand-webinars.htm
Recreation Resource Service. (2010). NC Directory of Parks and Recreation Agencies. Retrieved from:
cnr.ncsu.edu/rrs
Rozwell, C. (2010). Defining A Social Media Strategy: Identify Audience and Engagement. Gartner, 1-6.

28 | P a g e
Smith, D. (2010). Connecting Government to Improve It. T + D, 64, 24-24.
Waller, S.N. (2010). Social Media for Public Parks and Recreation Organizations: Bridging the
Communication Gap. PA Times, 33, 6-8.
Walls, A. and Di Maio, A. (2009). New U.S. Government Security Guidelines for Social Media Are a
Start, but Only a Start. Gartner, 1-6.
Wolpin, B. (2009). HEAVY TRAFFIC ON THE INFORMATION HIGHWAY. American City &
County, 124, 6-6.
Yost, L. (2010). You‟ve Got … Tweets. Parks and Recreation, 45, 48-53.
Zuckerburg, M. (2010). Facebook Factsheet. Retrieved from http://www.facebook.com/press/info.php?
factsheet


