

©2017 Shelby Systems, Inc.
Other brand and product names are trademarks or registered trademarks of the respective
holders.
v.5 General Ledger:
Customize Special Reports (Course V44)
Presented by: Mark Crain Shelby Staff Trainer
2
Table of Contents Objective ......................................................................................................................................... 3
What is a Special Report? ............................................................................................................... 4
Basic Steps....................................................................................................................................... 5
Create a Special Report ................................................................................................................... 6
Create Report Lines — Build the Report ......................................................................................... 7
Total Budget Income and Expense Summary ................................................................................. 8
Print Total Line .......................................................................................................................... 10
The Completed Report .............................................................................................................. 10
Run Financial Spreadsheets with This Format .......................................................................... 11
Results ........................................................................................................................................... 13
Report Results in Excel .............................................................................................................. 13
Graph Results in Excel ............................................................................................................... 13
Run Income/Expense Summary in Budgeted Financial Statement .............................................. 14
Operating Fund Summary by Department ................................................................................... 15
Special Report Design ............................................................................................................... 16
Budgeted Financial Statement ...................................................................................................... 17
Consolidated Balance Sheet Special Report Design ..................................................................... 18
Consolidated Balance Sheet Final Design ................................................................................. 19
Consolidated Balance Sheet Final Results ................................................................................ 20
Cash Flow Special Report Design .................................................................................................. 21
Design ........................................................................................................................................ 21
Print Report Setup to View Design ........................................................................................... 22
Cash Flow Special Report List ................................................................................................... 22
Cash Flow Statement Design .................................................................................................... 23
Cash Flow Statement Results .................................................................................................... 23

3
Objective This class equips the Shelby v.5 user to create and run very practical and useful General Ledger
special reports. The user learns the basics of setting up special reports and how to apply them
by running regular General Ledger reports.
What this session covers:
Basic Steps – “How To”
Total Budget Income and Expense Summary
Financial Spreadsheet – create graph
Budgeted Financial Spreadsheet – History
Operating Fund Department Summary
Income/Expense Statement
Budgeted Financial Statement – create graph
Cash Flow Statement
Print Special Report List (setup)
Cash Flow/Balance List
Consolidated Balance Sheet
Combine Funds
Summarize Net Assets

4
What is a Special Report? What makes a Special Report “Special”?
A Special Report allows you to create and save a template using accounts from your
regular Chart of Accounts.
A single line in the report design includes a single account, a range of contiguous
accounts, accounts from multiple departments or funds, or even the net total of a whole
department or fund.
A special report allows you to summarize, consolidate, reorder, or save specific accounts
in a template that you can use regularly for reporting.
Why would you use a Special Report?
Many times, it is necessary or helpful to temporarily limit or reorder the accounts used for a
particular report.
You might want to combine several accounts that represent the same activity in
multiple departments into one line.
You might want to order accounts differently to emphasize the totals in another way.
(for example, reordering personnel accounts from grouping accounts by staff member
to grouping accounts by compensation type)
You might want to organize the departments and accounts to easily print a monthly
report for a staff member whose areas of responsibility include budgets in several
widespread accounts and departments.
If you find yourself exporting reports to Excel just so you can manipulate the lines to get
the information you need into a different form, then a Special Report is likely a much
quicker and more accurate way to deliver that information, particularly for a report that
you run more than once.
5
Basic Steps The basic steps to creating a special report are similar to creating a chart of accounts but much
simpler. Line numbers replace account numbers in the setup and are only used to order the
printing of each line.
Once a special report is built, most of the regular financial reports that can be generated from
“Monthly Reports” can be run from the special reports portion of General Ledger reports. The
most common include:
Income and Expense Statement
Budgeted Financial Statement
Financial Spreadsheet
Balance Sheet
Designated Fund Summary

6
Create a Special Report 1. General Ledger Home Base
2. Reports
3. Special Reports
4. Special Reports Design
1. Right‐click and choose New to create a
new Report format.
2. Enter a Title for the report.
3. Right‐click in the grid to begin entering
lines for the report.

7
Create Report Lines — Build the Report
Line #: Determines the order in which each line prints. It is recommended that you use
increments of 10 to allow room for insertion of new lines if needed.
Line Type: Includes Header, Detail, and Totals, the same as the chart of accounts, but
additionally has Balance‐Opening
Description: Title for each line
Reverse Sign when Printing?: Select this checkbox if this is a normal credit account – liability,
net assets, income account.
Fund #, Dept #, Account Low, Account High: This is where you determine which accounts print
on this line. Enter by specific account number, account range, by department, or fund. Enter
multiple lines, by fund or department level, or even leave the department blank to print the
same account number across departments.
8
Total Budget Income and Expense Summary The goal for this special report is to summarize all budgeted income and expenses into one line
each. With this summary you can use the 12‐month spreadsheet to see at a glance the net
income for each month for the last 12 months. This helps give the big picture as to the
organization’s monthly income and receipts.
The budgeted financial statement is also a good report to use with this special report design. It
is very helpful to create a 5‐year history of actual income and expenses that can be used for
future financial planning and lending institutions.
Creating a special report is similar to creating a chart of accounts but much simpler. The goal is
to determine what prints on each line.
Create a new report
Add lines
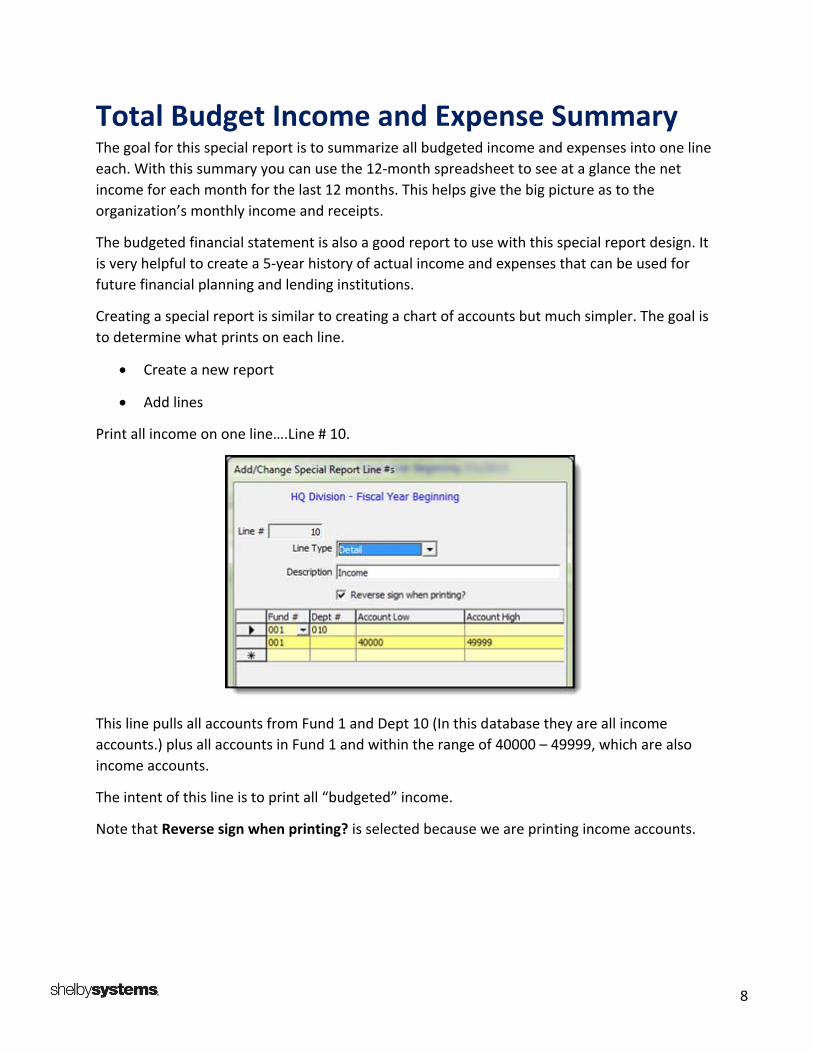
Print all income on one line….Line # 10.
This line pulls all accounts from Fund 1 and Dept 10 (In this database they are all income
accounts.) plus all accounts in Fund 1 and within the range of 40000 – 49999, which are also
income accounts.
The intent of this line is to print all “budgeted” income.
Note that Reverse sign when printing? is selected because we are printing income accounts.

9
Print All Budgeted Expenses on Line # 20.
Notice the Dept # is blank so this line totals all accounts within Fund 1 that are within the range
of 50000 – 99999.
This is an example of the power of using Special Reports.
10
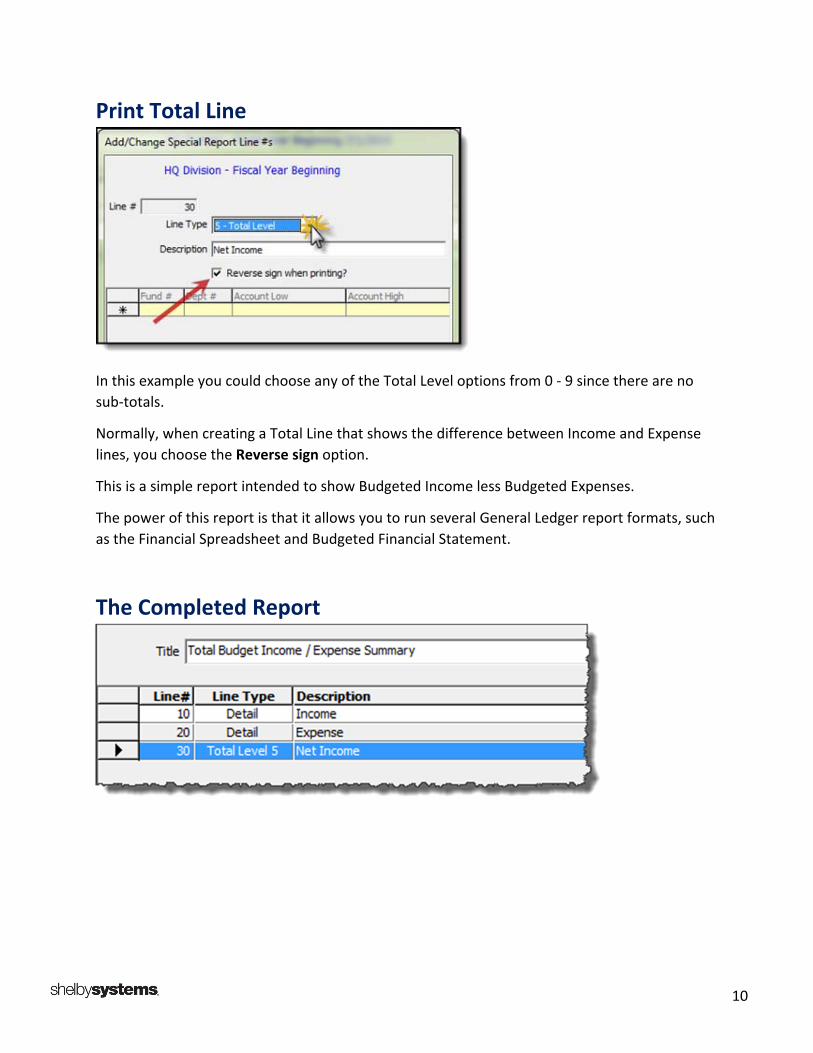
Print Total Line
In this example you could choose any of the Total Level options from 0 ‐ 9 since there are no
sub‐totals.
Normally, when creating a Total Line that shows the difference between Income and Expense
lines, you choose the Reverse sign option.
This is a simple report intended to show Budgeted Income less Budgeted Expenses.
The power of this report is that it allows you to run several General Ledger report formats, such
as the Financial Spreadsheet and Budgeted Financial Statement.
The Completed Report
11
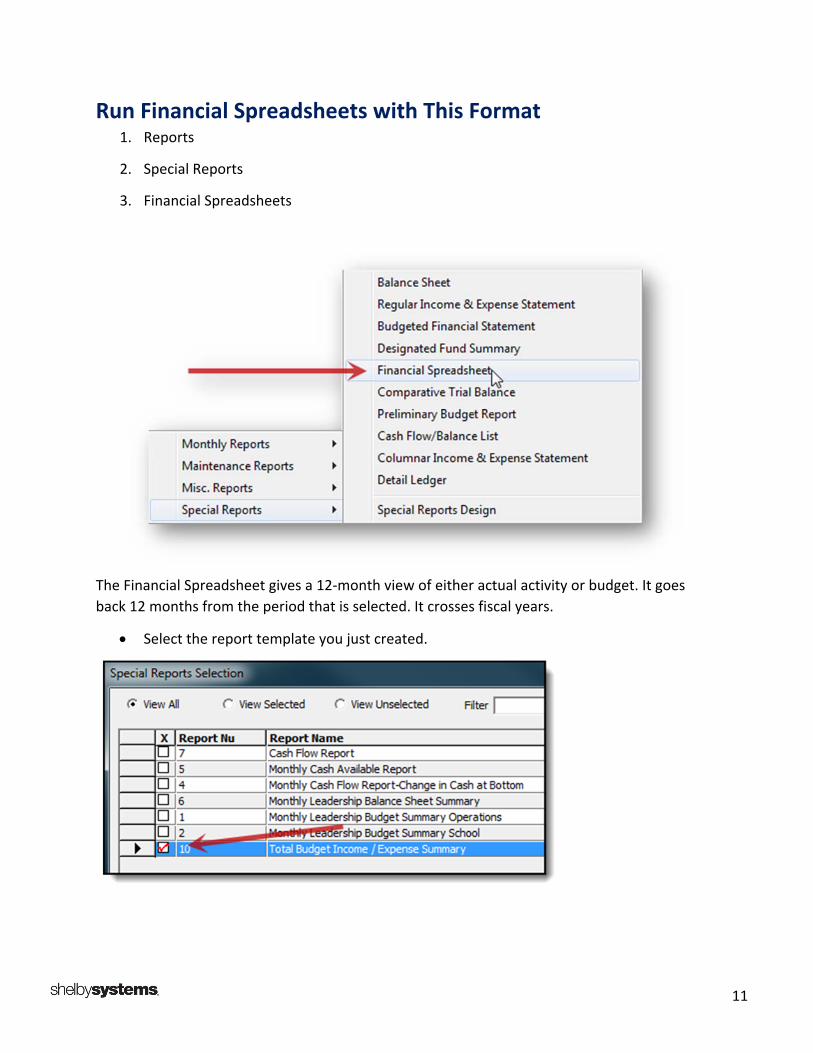
Run Financial Spreadsheets with This Format 1. Reports
2. Special Reports
3. Financial Spreadsheets
The Financial Spreadsheet gives a 12‐month view of either actual activity or budget. It goes
back 12 months from the period that is selected. It crosses fiscal years.
Select the report template you just created.

12
Select the period from which to go back 12 months.
Select the Interface with Excel checkbox.
Click the Include/Exclude button to choose from a list of all existing Special Report
Designs.

13
Results Report Results in Excel If you reverse the sign on the income accounts, then the credits and debits both show as
positive numbers so the report can compare to see which is the greater value between the two
rows by period.
Graph Results in Excel Show the results above as a Line Chart, and then you can see the monthly relationship between
Income and Expense. For the graph you select the header and the income and expense rows. In
this selection you omit the Account # and Total columns and only select the name column
through the last period column. Pressing the F11 key on your keyboard, while these cells are
selected, opens the chart screens so that you can select Line Chart or whatever graph seems
appropriate.

14
Run Income/Expense Summary in Budgeted
Financial Statement
With the ability to create report preferences in the Budgeted Financial Statement, it is very
easy to create a multi‐year report reflecting total income and expenses for the desired time
frame.
Since this report can be interfaced with Excel, it is a simple process to create a graph.
This is a great analytical tool for projecting future income and expenses.
With the ability to create special report designs you can produce a high‐level report, such as in
this example, or drill down to the department or account level.

15
Operating Fund Summary by Department The goal is to create a one‐page budget summary. This special report design has each
Department total on a separate line.
Create one line for
each Budget Dept #.
This is an example for
the Personnel Dept.
Repeat line numbers
until each Department
is listed.

16
Special Report Design
Each of the detail lines is connected to a specific department.
The Total Lines are checked with the reverse sign option.
Total Level 6 is the net for the Organization Budget.
Total Level 7 is the Net for the Fund 1 – Operating Fund.
This report creates a one‐page budget summary by using this design with the Budgeted
Financial Statement.

17
Budgeted Financial Statement
18
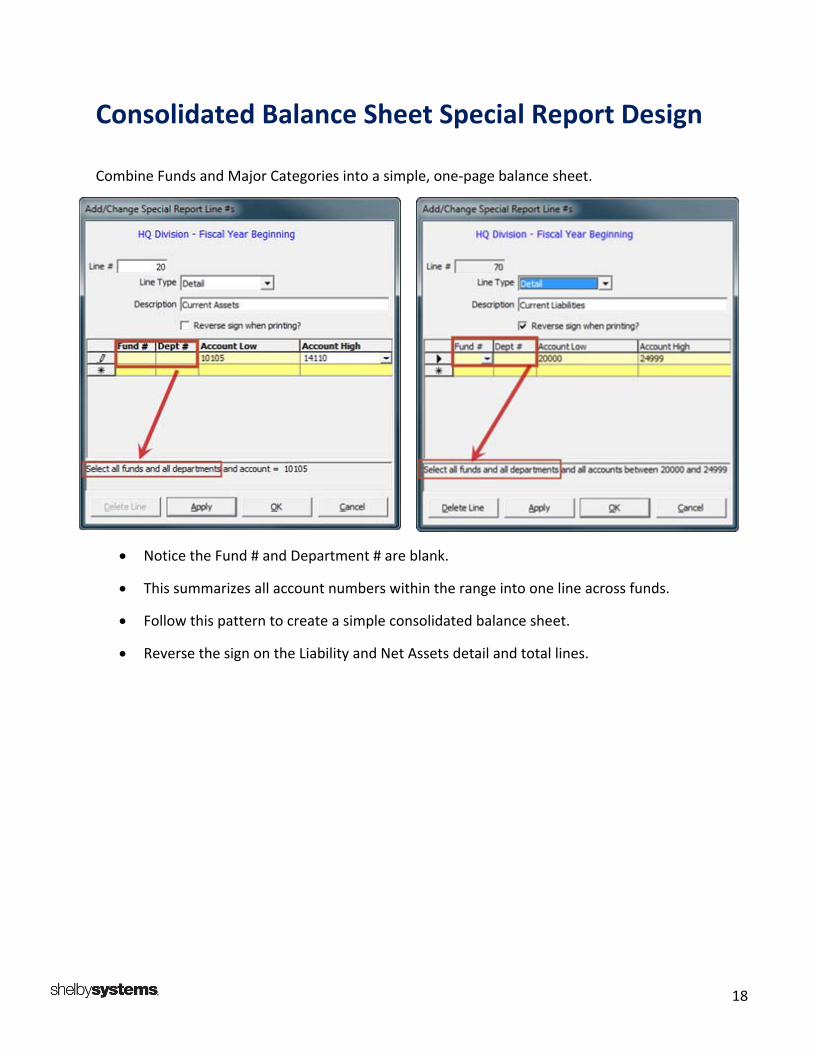
Consolidated Balance Sheet Special Report Design
Combine Funds and Major Categories into a simple, one‐page balance sheet.
Notice the Fund # and Department # are blank.
This summarizes all account numbers within the range into one line across funds.
Follow this pattern to create a simple consolidated balance sheet.
Reverse the sign on the Liability and Net Assets detail and total lines.
19
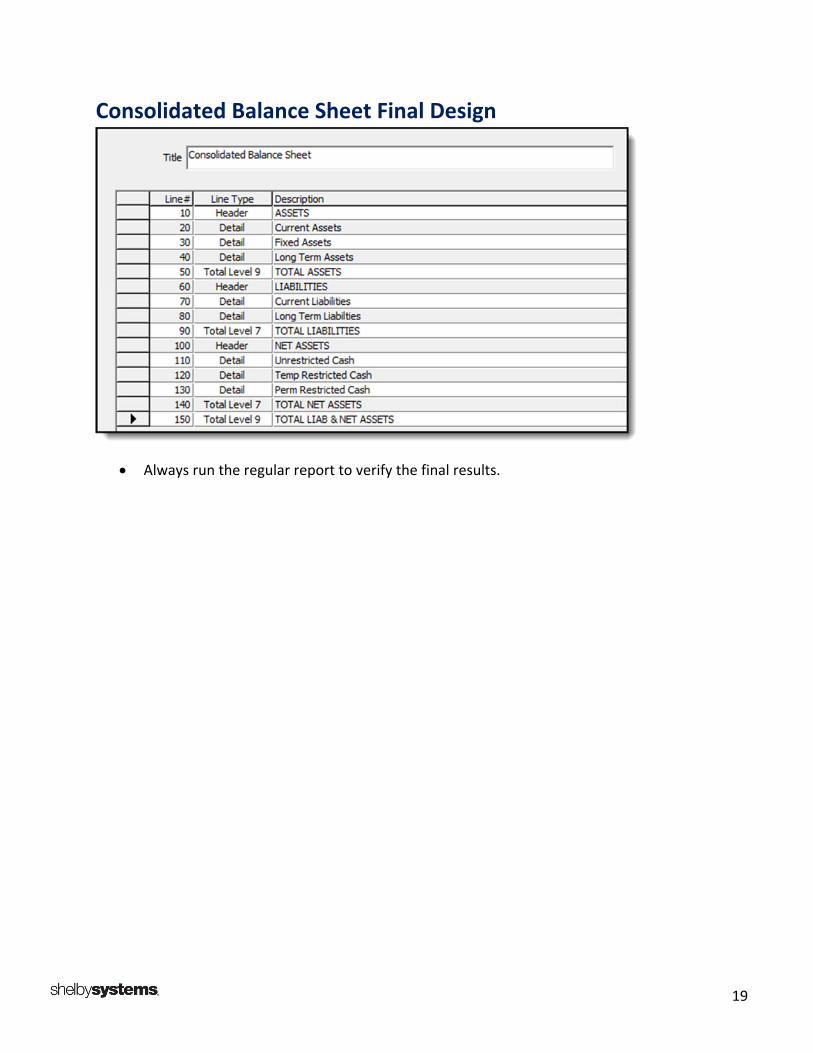
Consolidated Balance Sheet Final Design
Always run the regular report to verify the final results.
20
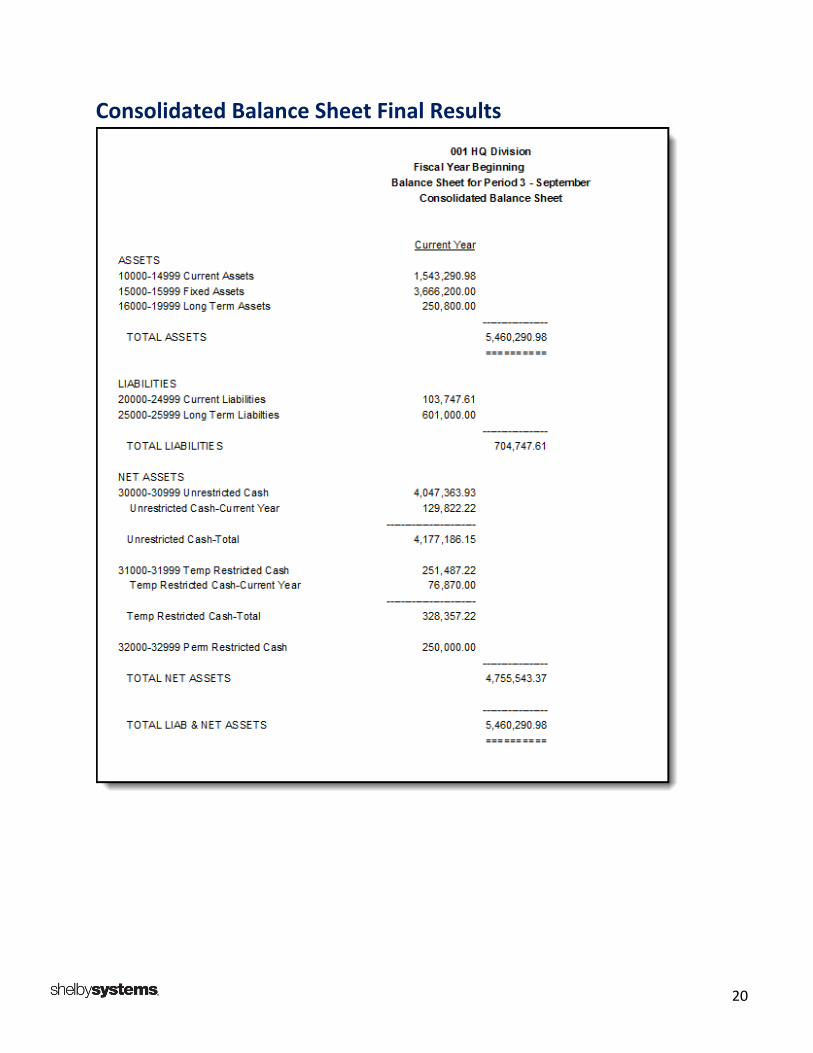
Consolidated Balance Sheet Final Results

21
Cash Flow Special Report Design To create and run a cash flow statement in the General Ledger, a special report is required.
Once the design is created, the cash flow statement is a report option under special reports.
This is a simple example that explains the report setup and execution.
Design
Create a line for all cash
accounts.
Notice in the line type:
Balance‐Opening. This is
required for the cash account
lines.
Choose the account ranges for
your cash.

22
Print Report Setup to View Design 1. General Ledger Home Base
2. Reports
3. Special Reports Design
4. Place cursor on desired report.
5. Tool Bar ‐> Reports
6. Special Reports List
Printing this report is extremely helpful. It shows how each line is constructed with the line type
options and General Ledger links. This report helps explain the setup for the cash flow report.
Cash Flow Special Report List Report with General Ledger Links
23
Cash Flow Statement Design Remember, the line containing cash accounts needs to have the line type set to Opening
Balances.
Notice on the report above the reverse sign options for each account type:
Income – Reverse Yes
Expense – Reverse Yes
Accounts Receivable – Reverse No
Accounts Payable – Reverse No
Complete the process by running the Cash Flow Report under Special Reports.
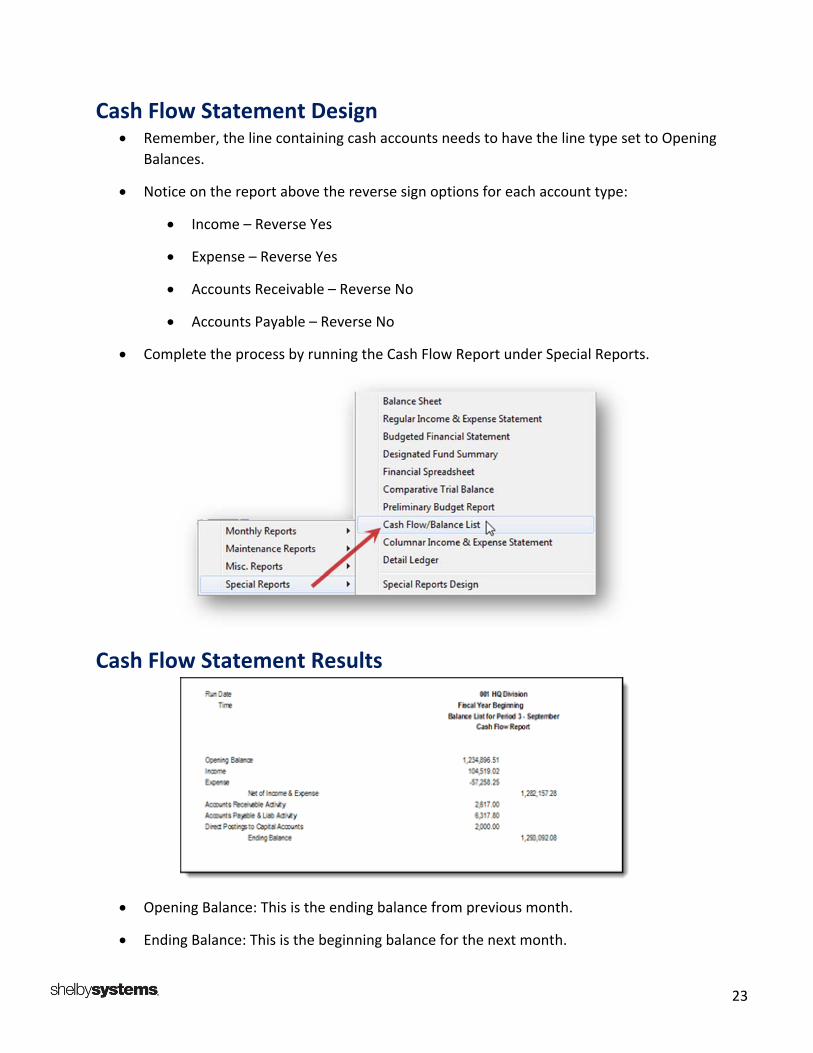
Cash Flow Statement Results
Opening Balance: This is the ending balance from previous month.
Ending Balance: This is the beginning balance for the next month.

24
Mark Crain Shelby Staff Trainer
Prior to joining Shelby as Staff Trainer, Mark served in various roles in the fields of education
and banking while obtaining his MBA in Business Management. Each of his positions revolved
around the training or teaching of students and professionals. Currently, Mark trains on Shelby
v.5 and ShelbyNext.


