vam food security analysis
Minimum Expenditure BasketsGuidance NoteDecember 2020
Minimum expenditure baskets
copy December 2020 World Food Programme (WFP)
Research Assessment and Monitoring Division
All rights are reserved Reproduction is authorized except for
commercial purposes provided that WFP is acknowledged as
the original source
United Nations World Food Programme
Via Cesare Giulio Viola 6870 Parco dersquo Medici
00148 Rome ndash Italy
Arif Husain
Chief Economist and Director
Research Assessment and Monitoring Division
Tel + 39 06 6513 2014 ndash e-mail arifhusainwfporg
Yvonne Forsen
Chief
Research Assessment and Monitoring Division
e-mail yvonneforsenwfporg
Susanna Sandstrom
Regional CBT Advisor
Regional Bureau for East Africa
e-mail susannasandstromwfporg
Lena Hohfeld
Needs Assessment and Targeting Unit (RAMAN)
Research Assessment and Monitoring Division
e-mail lenahohfeldwfporg
Nynne Warring
Economic and Market Analysis Unit (RAMAE)
Research Assessment and Monitoring Division
e-mail nynnewarringwfporg
ii
The essential needs analysis workstream
This guidance note is part of a package of essential needs
analysis guidance WFPrsquos essential needs analysis workstream
is a collaboration between the Research Assessment and
Monitoring (RAM) Divsion and the Cash-Based Transfers (CBT)
Division of WFP
To provide feedback on this guidance note contact any of
the authors or write to the RAM or CBT Divsions in WFP
headquarters
wfpvaminfowfporg and cbtglobalsupportwfporg
Acknowledgements
This guidance has greatly benefitted from inputs from
colleagues in various functions field-based and in
headquarters In particular experts in the WFP Research
Assessment and Monitoring (RAM) Divsion the Cash-Based
Transfers (CBT) and Nutrition Divisions have provided
invaluable feedback on earlier drafts of this document Field-
based practitioners around the world are continuing to build
experiences constructing minimum expendiures baskets for
a variety on contexts and operations We are immensively
thankful to colleagues and partners that have shared their
experiences and best practices with us to inform this guidance
and its applications
iii
Minimum Expenditure Baskets Guidance Note | December 2020
Table of contentsPreface ndash the essential needs approach 1
About this guidance note 5
1 What is a minimum expenditure basket 5
2 Why have a MEB 6
3 How to construct a MEB standard steps 7
4 Before starting the analysis 8
5 Constructing a MEB expenditure-based and rights-based approaches 10
51 The expenditure-based approach 10
52 The rights-based approach 21
53 Summary and data needs for expenditure and rights-based approaches 23
54 Expenditure-based or rights-based approach Pros and cons 25
6 Arriving at a realistic and operationally relevant MEB 26
61 Combining approaches the hybrid MEB 26
62 Reality checks and validation with stakeholders 28
7 Accounting for household composition and economies of scale 30
8 How to construct a SMEB 34
9 Additional considerations when constructing MEBs 37
91 Adjustment for seasonal or regional price differences 37
92 Needs that vary by season or area 37
10 How to find a proxy for a MEB when data or time is insufficient 38
11 Monitoring and updating the MEB 38
111 Monitoring the cost of the MEB 38
112 When to construct a new MEB 39
Abbreviations 40
References 41
Annex 1 ndash Good practice when analysing expenditure data 43
Annex 2 ndash The expenditure-based SMEB ndash an illustration 43
iv
Minimum Expenditure Baskets Guidance Note | December 2020
List of boxesBox 1 The MEB to-do list 7
Box 2 Examples of national poverty lines 9
Box 3 Expenditure data in MEB calculations ndash constructing a light ldquoconsumption aggregaterdquo 11
Box 4 Reference cohort selection 13
Box 5 Selecting and checking the reference cohort Chad Syrian refugees in Lebanon and Coxrsquos Bazar 14
Box 6 Approximating a food basket with group-level food expenditures 16
Box 7 Kinshasa food reference basket using food group expenditures 17
Box 8 Coxrsquos Bazar food reference basket with detailed expenditure and quantity data 18
Box 9 Non-food expenditures ndash expenditures of particular interest 19
Box 10 Expenditure-based non-food reference basket example from Coxrsquos Bazar 20
Box 11 Shelter in the MEB for Syrian refugees 21
Box 12 Example of a rights-based MEB for northeast Nigeria 22
Box 13 MEB approaches ndash construction summary 23
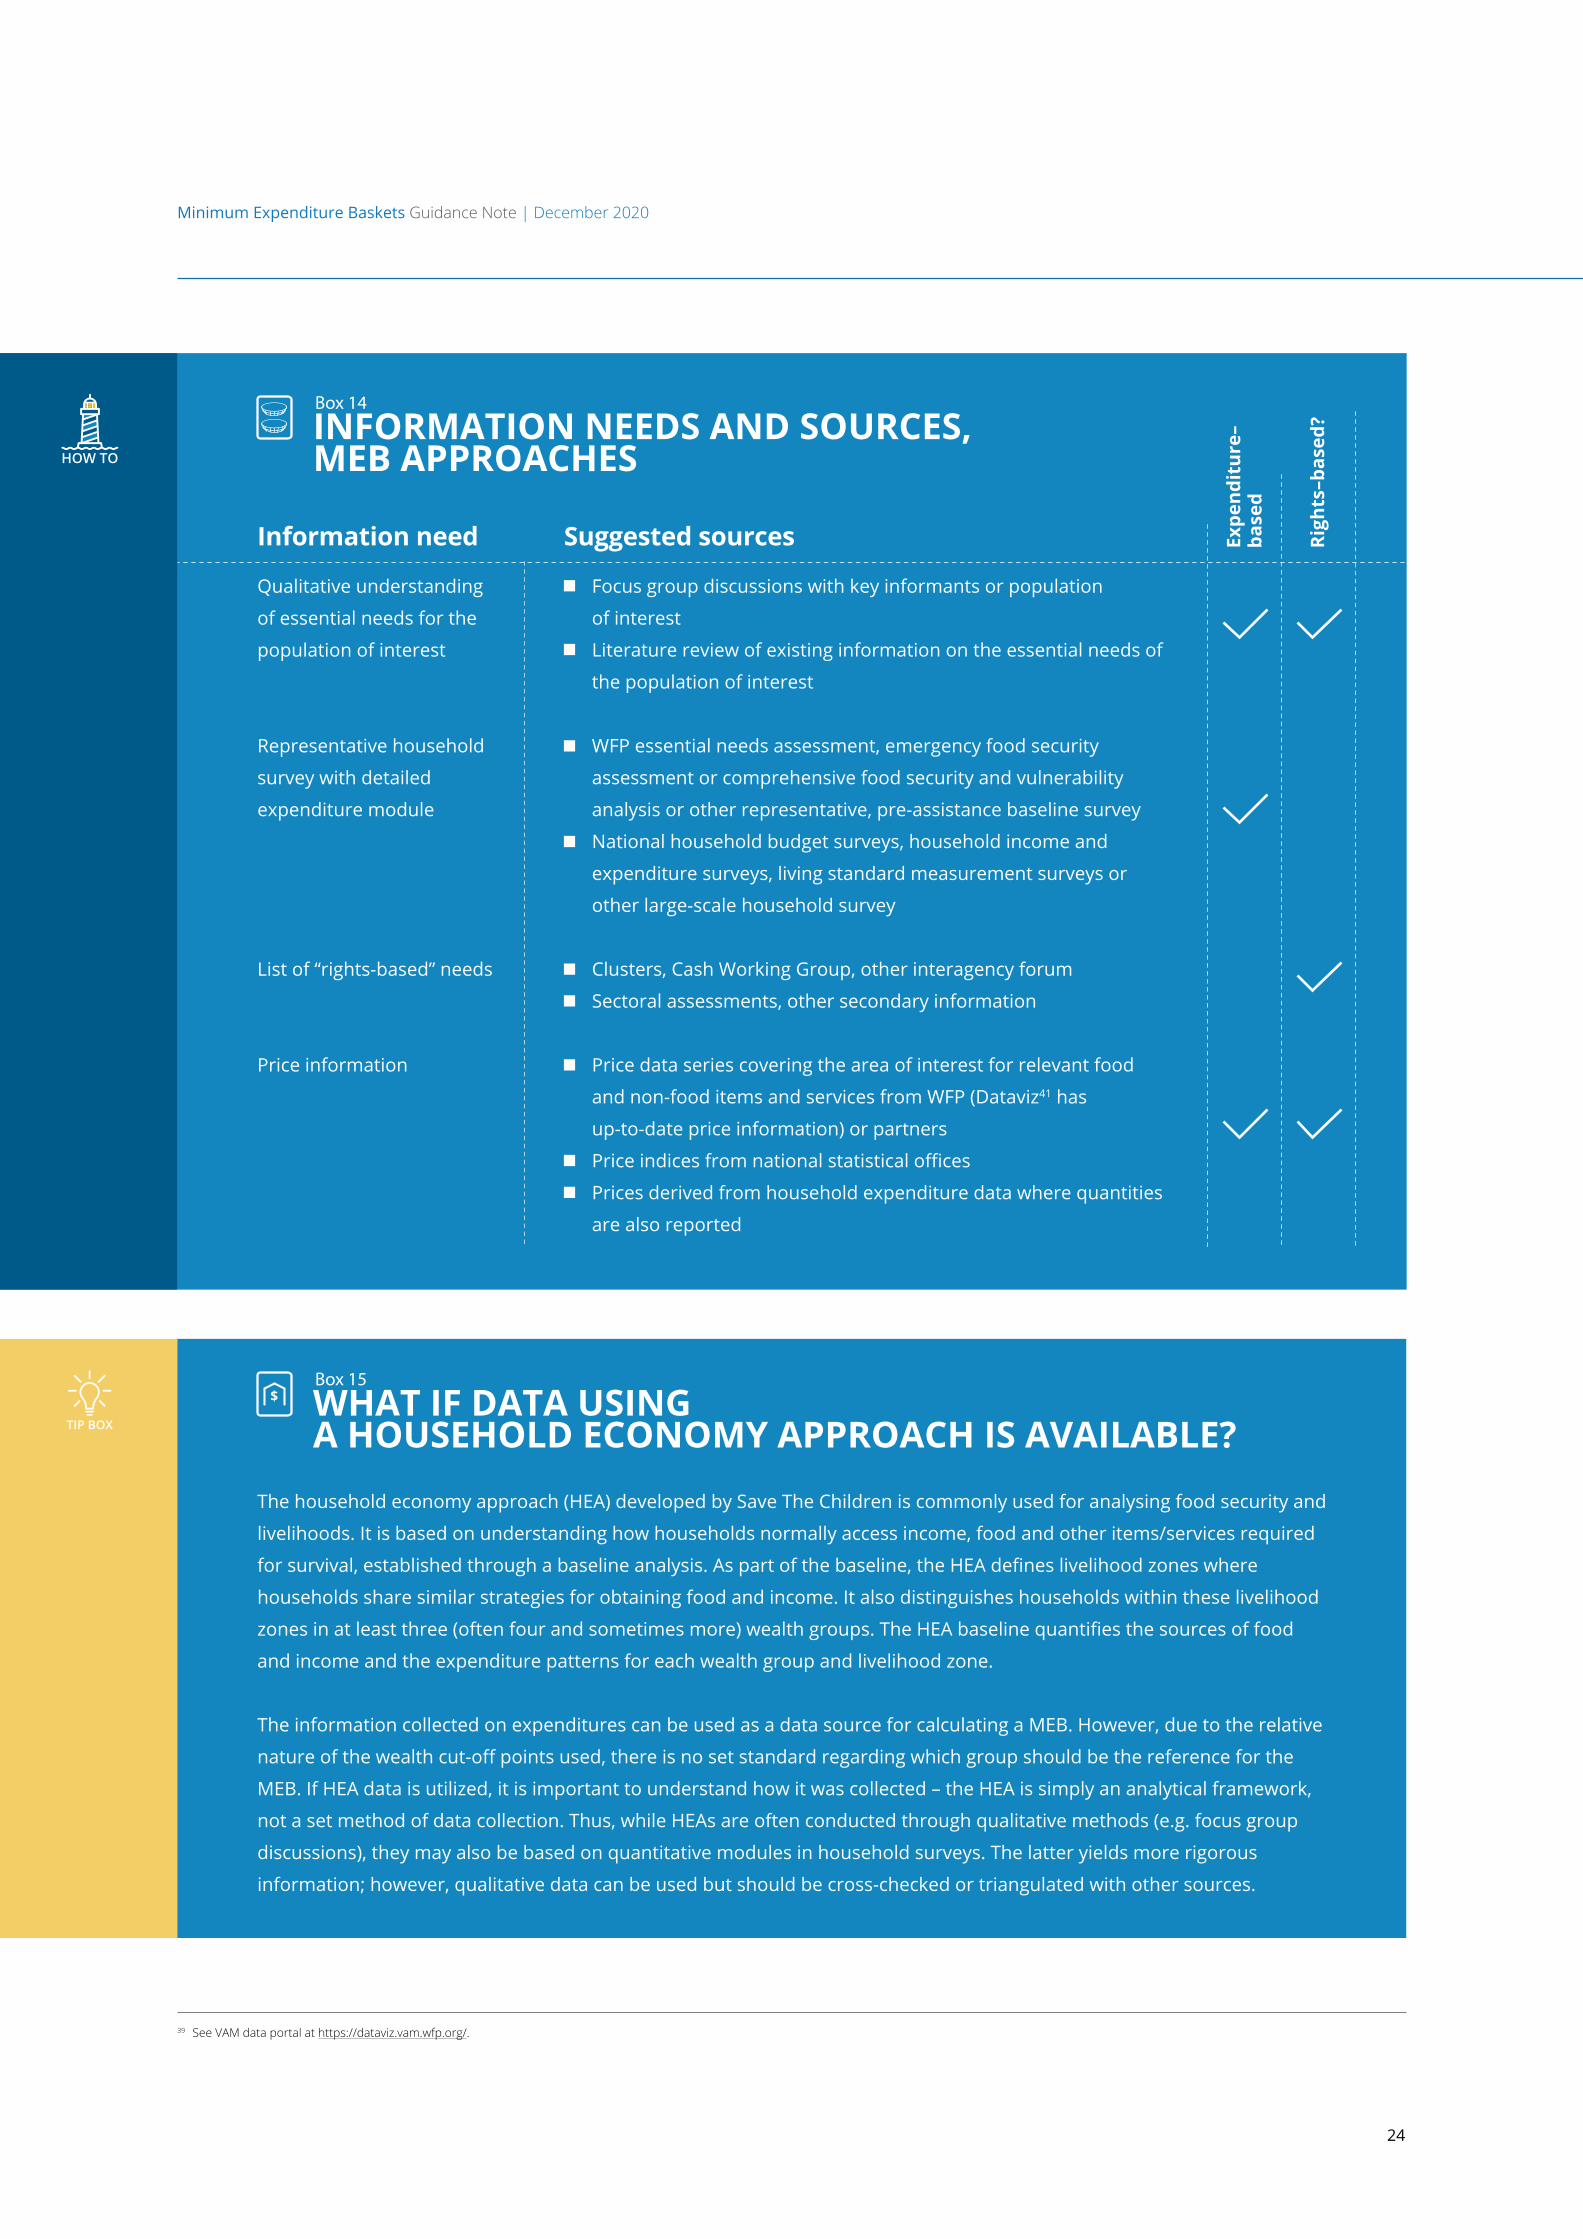
Box 14 Information needs and sources MEB approaches 24
Box 15 What if data using a household economy approach is available 24
Box 16 Advantages and disadvantages of different approaches to establishing MEBs 25
Box 17 Hybrid MEBs in urban settings in Kinshasa the Democratic Republic of the Congo and for Syrian refugees in Turkey 27
Box 18 Turkey non-food basket MEB composition versus actual consumption 29
Box 19 Economies of scale in Lebanon and Coxrsquos Bazar 31
Box 20 Rights-based SMEBs 35
Box 21 Hybrid SMEBs 36
List of figuresFigure 1 Essential needs analysis 4
Figure 2 Selecting the MEB cohort 12
Figure 3 Economies of scale and expenditures per capita ndash illustration of the concept 30
Figure 4 Combining flat and proportional elements in the MEB 33
Figure 5 Possible triggers for MEB composition review 39
v
1
This guidance note on minimum expenditure baskets is
part of a package of guidance on the analysis of essential
needs This preface provides a brief introduction to the
concept of essential needs the rationale behind the package of
guidance for the analysis of essential needs what this analysis
entails and how the different analytical pieces can be used
The concept of essential needs originates in the basic needs
approach proposed by the International Labour Organization
(ILO) The ILO report on the 1976 World Employment
Conference defined basic needs in terms of household private
consumption of goods such as food clothing and housing
and services such as water and sanitation provision education
and public transportation1 Since then basic ndash or essential
ndash needs have been broadly defined in several analytical
frameworks as the essential goods and services required
on a regular or seasonal basis by households to ensure
survival and minimum living standards without resorting
to negative coping mechanisms or compromising their
health dignity and essential livelihood assets2
This amounts to a working definition for a highly contextual
concept The definition is not a universal list of what
constitutes essential needs International humanitarian
and human rights law offer a useful starting point for that
protecting the rights of crisis-affected populations to food
water sanitation clothing shelter and lifesaving healthcare
However what counts as essential will greatly depend on the
context and on what people themselves consider the most
important aspects necessary to ensure their survival and
wellbeing In order to move from the concept to concrete
analysis and action any definition of essential needs
should always be contextualized and verified through
consultations with the population of interest and other
stakeholders
Preface ndash the essential needs approach
The analysis of essential needs how people meet them
and where there are gaps or constraints to meeting them
enriches insight into food insecurity its drivers and how
it is connected with meeting other needs A thorough
understanding of essential needs helps in the design of
effective food security responses
Among essential needs food is central Often food is the
need on which poor households spend the largest share of
their resources But a householdrsquos ability to meet its food
and nutrition needs also depends on its ability to meet other
essential needs When households have limited resources
they will constantly have to prioritize between often equally
urgent needs They may have to decide between spending
money on healthcare or school fees or on buying different
types of food At the same time being in poor health or having
limited access to clean water negatively impacts a householdrsquos
ability to be food and nutrition secure This illustrates the
importance of analysing essential needs together and explains
why adopting the lens of essential needs can be of great
value for understanding food security and designing food and
nutrition security interventions
Recognizing this connection between food security and
the fulfilment of other essential needs is paramount
when working to reach the Sustainable Development
Goals (SDGs) The WFP strategic plan for 2017ndash2021 points
out that in order to achieve SDG 2 ndash End hunger achieve food
security and promote sustainable agriculture ndash WFP needs
to integrate a life-changing strategy along with its lifesaving
focus This means working towards sustainable food security
and nutrition goals while understanding how achieving SDG 2
is linked to progress towards other SDGs
Building strategic partnerships for stronger synergies is key
to improving food security SDG 17 ndash Strengthen the means
of implementation and revitalize the global partnership
for sustainable development ndash recognizes the crucial
role of partnerships in achieving holistic and sustainable
What are essential needs Why is WFP interested inessential needs
What counts as essential will greatly depend on the context and on what people themselves consider the most important aspects necessary to ensure their survival and wellbeing
1 Employment was considered both a means and an end and participation in decision making was also included2 See the Cash Learning Partnershiprsquos Glossary of terminology for cash and voucher assistance (CaLP glossary) and Save the Children UK 2018
2
Minimum Expenditure Baskets Guidance Note | December 2020
outcomes for affected populations Another key international
agreement the Grand Bargain committed its signatories to
working together in a more efficient and harmonious manner
in order to better assist the growing number of vulnerable
people affected by crises around the world
Against this backdrop and based on best practices by WFP and
partners an integrated analytical package has been prepared
to provide guidance on how to analyse essential needs This
package builds on existing guidance and research together
with practical experience and lessons learned It is designed to
provide analytical results that can be used to inform strategic
and operational decision making and programme design
As analysing understanding and assisting people in
meeting their essential needs is by definition not a single-
agency undertaking the package developed by WFP is
intended as an analytical starting point for interagency
collaboration It offers data-driven approaches and
quantitative indicators but also allows for analytical flexibility
emphasizing the importance of collaboration qualitative
inquiry and contextual adaptation
Essential needs analysis is particularly relevant where WFP
and partners seek to support government strategies and
policies such as informing the design of social safety nets
as a toolbox to support the design of multi-stakeholder
joint assessments or joint harmonized or complementary
interventions Essential needs analysis has proven useful in
a variety of contexts from refugee camps to chronic food
insecurity settings It is often highly relevant when assessing
the situation of poor urban populations urban households
depend heavily on markets to meet their food and other
essential needs including housing high living costs and
unstable income sources make them vulnerable to shocks
forcing households to choose between meeting different
essential needs in times of hardship
What is essential needs analysisThe analytical packageThe WFP essential needs analysis package consists of three parts
The essential needs assessment is a household andor
community assessment that helps to understand if and how
people are meeting their essential needs as such it focuses
on the demand side of essential needs The assessment seeks
to identify and analyse essential needs and gaps estimate
the number of people in need and profile them by describing
their main characteristics It aims to answer the following
questions
What are the populationrsquos essential needs and how
do people meet them
Which essential needs are unmet and why
How many people are unable to meet their
essential needs
Who are the people that are unable to meet their
essential needs
Where are the people that are unable to meet their
essential needs
How can households be assisted to meet their
essential needs
The essential needs assessment promotes the use of
qualitative and quantitative analysis It proposes a suite
of essential needs indicators that capture various aspects
of essential needs and a householdrsquos ability to meet them
including measures of household economic capacity to meet
essential needs deprivations of different essential needs how
households cope when they struggle to meet their essential
needs and how they prioritize unmet needs
An integrated analytical package has been prepared to provide guidance on how to analyse essential needs This package builds on existing guidance and research together with practical experience and lessons learned
3
Minimum Expenditure Baskets Guidance Note | December 2020
The foundational understanding of essential needs gained
from the essential needs assessment can feed into the supply
analysis The results can help to focus a complex market
analysis on the most critical needs while household data
can be used to understand how households perceive the
supply and quality of essential services and their access to
them At the same time a thorough analysis of the supply
of essential goods and services enriches the understanding
of household demand and enables the analyst to identify
possible interventions Which needs can be met through
the market Is there effective demand and would supply
or demand-side interventions or a combination of these be
better suited to assisting the population of interest The MEB
connects supply and demand in the sense that it identifies
a monetary threshold for meeting essential needs through
the market It enables the essential needs assessment to
identify households with sufficient economic capacity it also
has strong complementarities with the supply analysis as it
helps reveal market consumption patterns In turn the supply
analysis is a valuable input for a MEB analysis as it highlights
which goods and services are adequately supplied
The analytical approach draws on different schools
of thought from the fields of humanitarian action
development and poverty analysis It combines ideas from
the cost-of-basic-needs approach for monetary poverty
lines which sees poverty as the deprivation of consumption
with more multidimensional poverty perspectives from
human development and capabilities approaches Through
this combination the essential needs analysis provides a
framework that is easy to operationalize while offering the
flexibility and detail necessary to adjust to different contexts
and to produce information relevant for programmatic
decision making
The minimum expenditure basket (MEB) looks at the needs
that are covered partially or fully through the market It sets
a monetary threshold which is defined as what households
require in order to meet their essential needs The starting
point for constructing a MEB is usually household expenditure
data This data is analysed and triangulated with sector-based
needs information to obtain a measure of the minimum
cost of essential needs based on the population of interestrsquos
actual demand pattern and consumption priorities The
expenditure data can be gathered as part of the essential
needs assessment data collection Once constructed the MEB
itself serves as a key input in the essential needs assessment
set of indicators as it is
used to assess which
households have the
economic capacity to
cover their needs through
the market
The supply analysis looks at the supply of essential goods
and services and examines whether the market andor public
provision can sustain the demand related to essential needs
It integrates quantitative methods for examining the basic
functioning of the marketplace with qualitative investigation
of supply and access
The three guidance tools are designed so that they can
be used independently or together A full essential needs
analysis would require undertaking an essential needs
assessment constructing a MEB and carrying out a supply
analysis this combination is recommended for the most
complete analysis as each piece complements the others
A full essential needs analysis would require undertaking an essential needs assessment constructing a minimum expenditure basket and carrying out a supply analysis
Essential needs analysis provides a framework that is easy to operationalize while offering the flexibility and detail necessary to adjust to different contexts
4
Minimum Expenditure Baskets Guidance Note | December 2020
Essential needs analysis package
Esse
ntia
l nee
ds
ESSENTIAL NEEDS ASSESSMENTDemand for essential needs
SUPPLY ANALYSISSupply of essential goods and services
MINIMUM EXPENDITURE BASKETExpenditures on essential needs
Decision making
Operationalization
Monitoring
While the three pieces of analysis should be carried out
together as much as possible there may be situations in
which only one piece is necessary for example when the
analysis is spread out over time or different collaborators
lead on different pieces Each guidance note is designed as a
standalone document enabling analysts to follow it without
reference to the others
A series of operationalization guidance notes and
documented best practices complement the analytical
package The series offers concrete guidance on how the
results of the essential needs analysis can be translated into
programme design and inform decision-making Essential
needs analysis identifies where households face critical
gaps in meeting their needs the cost of meeting those
needs in the market and whether the necessary essential
goods and services are available As such it forms the
basis for programme design for both demand and supply-
side interventions Results can for example be used to
inform the targeting and prioritization of beneficiaries the
selection of transfer modality the setting of transfer values
and other programme design features It is well suited for
monitoring needs over time and evaluating the effectiveness
of programmes This series will be continuously updated to
reflect new learning
While essential needs analysis can inform programme design
it does not have to imply an essential needs response
Essential needs analysis and the analytical package can be a
service offering particularly when supporting governments in
designing policies strategies and programmes at national and
local levels
Figure 1 Essential needs analysis
5
Minimum Expenditure Baskets Guidance Note | December 2020
This guidance note sets out the basic steps for constructing a
minimum expenditure basket (MEB) It is designed to provide
conceptual clarity and best practices built on experience from
the humanitarian and development fields The guidance is
designed to provide a series of options in order to facilitate
a context-specific application of the recommendations it
presents
The guidance note begins by introducing the concept of the
MEB and its different usages (sections 1 and 2) Sections 3 to
6 cover how to construct a MEB including important aspects
to consider before starting the analysis and the different MEB
approaches Section 7 examines how to deal with household
size and composition in MEB analysis while the concept of the
survival minimum expenditure basket (SMEB) is introduced
in section 8 Section 9 sets out additional considerations
such as regional or seasonal price adjustments and section
10 explains how to find MEB proxies when time or data is
insufficient In closing section 11 offers guidance on how to
update and monitor the MEB
A MEB is defined as what a household requires in order to
meet their essential needs on a regular or seasonal basis
and its cost3 Essential (or basic) needs are defined as ldquothe
essential goods and services required on a regular or seasonal
basis by households to ensure survival and minimum living
standards without resorting to negative coping mechanisms
or compromising their health dignity and essential livelihoods
assetsrdquo4 The MEB is a monetary threshold ndash the cost of these
goods utilities services and resources ndash and is conceptually
equivalent to a poverty line5 It typically describes the cost
of meeting one monthrsquos worth of essential needs Since the
MEB sets a monetary threshold for what is needed to cover
essential needs the households whose expenditures fall
below the MEB are defined as being unable to meet their
essential needs
i About this guidance note
3 This builds on the definition in UNHCR et al 2015 4 Definition of basic needs See CaLP glossary 5 Note that conceptually a MEB is equivalent to a poverty line in that it describes a monetary threshold for being able to cover essential needs This does not mean that the MEB is equivalent to the national poverty line6 Haughton and Khandker 2009
In poverty literature and research MEBs have long been
constructed primarily to set national poverty lines and
determine the percentage of households in the population
who are poor ie who cannot meet their essential needs
The ldquocost of basic needsrdquo approach which entails establishing
a MEB is fairly new in humanitarian contexts however it
has long been the most common way to construct national
poverty lines6 As a result there is often national experience to
draw on when setting out to construct a MEB
A MEB does not necessarily contain all the essential needs
of a household It only captures needs that the households
cover entirely or partly through the market It should not
be an attempt to monetize all the needs of a population
For example in contexts where electricity is considered an
essential need but not available for the population of interest
it should not be included in the MEB If shelter is provided free
of charge in a refugee camp or education is publicly provided for
free these needs and their costs are not captured in the MEB
Hence a need can be essential but not included in the MEB
A MEB does not necessarily contain all the essential needs
of a household It only captures needs that the households
cover entirely or partly through the market It should not
be an attempt to monetize all the needs of a population
For example in contexts where electricity is considered
an essential need but is not available for the population of
interest it should not be included in the MEB If shelter is
provided free of charge in a refugee camp or public education
is provided for free these needs and their costs are not
captured in the MEB A need can therefore be essential but
not included in the MEB
A MEB captures the cost of essential needs for average
households It does not typically capture ad-hoc or one-
off costs This can be challenging particularly in emergency
situations when needs are dynamic While this guidance
suggests keeping the MEB composition fixed as far as
possible in such situations it might be justified to create
an interim MEB (see section How to find a proxy for a MEB
when data or time is insufficient) and when the situation has
stabilized a final one A similar challenge is presented with
1 What is a minimum expenditure basket
6
Minimum Expenditure Baskets Guidance Note | December 2020
needs that are inherently irregular large and unpredictable
such as health needs This is also examined in the sections on
MEB construction
There are different approaches to establishing a MEB
As the World Bankrsquos Handbook for Poverty and Inequality
explains7 the typical starting point for establishing a MEB is
to estimate the cost of acquiring enough food to meet energy
requirements usually 2100 calories per person per day as
per the Sphere Standard Yet the cost of 2100 calories varies
with the diet of households which typically depends on their
economic status The cost of other essential non-food needs
is then added There are two approaches to establishing
which food and non-food items should be in the MEB an
expenditure-based approach that focuses on effective
demand and a rights-based approach based on assessed
needs While the expenditure-based approach is usually used
to construct national poverty lines the rights-based approach
is the principal method followed in the operational guidance
for multipurpose cash grants developed for humanitarian
purposes8 A combination of these approaches a hybrid
approach can also be used and is often recommended This
guidance describes each approach
The construction of a MEB is always somewhat arbitrary
However a MEB is constructed choices need to be made along
the way The objective of the MEB can influence how best to
approach its construction The choice of the group of people
whose effective demand will be examined ndash the ldquoaveragerdquo
households ndash is another important influencing factor This
guidance provides direction on how to make these choices but
analysts will always be required to exercise judgement
A MEB is not equivalent to a transfer value A transfer
value is understood as the monetary value transferred from
governments or organizations such as WFP to households
in order to support the latter in meeting their needs The
value of the MEB is not the same as the value that should
be transferred to households but the MEB can be a critical
component when determining transfer values Most
households can rely on their own resources to meet at least
some of their needs so the transfer value will usually be
less than the value of the MEB covering the gap between
householdsrsquo own resources other assistance received and
the MEB The distinction between the MEB and the transfer
value is also important because the MEB remains the same
regardless of assistance and funding constraints while the
transfer value could be impacted by these factors9
When using the MEB to monitor impacts of an
intervention or programme the MEB should not be
changed over time The threshold should only be adjusted
for price changes or when any major changes in context and
households needs occur that would require the construction
of a new MEB
2 Why have a MEBThe MEB has a range of applications In humanitarian
and development programming the MEB can support
household profiling by identifying characteristics of those
who cannot meet their essential needs10 and support
decisions on transfer value amounts for food and non-
food needs For partnerships the MEB can support multi-
sector coordination and programming with government
partner organisations and donors In market and supply
analysis the MEB can help inform which goods and services
to include in a Supply Analysis by showing which essential
needs households cover through the market Finally in
monitoring the MEB can assist monitoring of immediate
and longer-term outcomes through analysis of expenditure
trends against the MEB and help establish a basket against
which to monitor market prices and the cost of living
7 Ibid8 UNHCR et al 20159 For further discussion on considerations when setting a transfer value see WFP 2020c 10 For one possible application see WFP 2020a
A hybrid approach to constructing the MEB combines the expenditure-based approach and the rights-based approach and is often recommended
7
Minimum Expenditure Baskets Guidance Note | December 2020
THE MEB TO-DO LIST DEPENDING ON CONTEXTALSO CONSIDER
Identify key partners and stakeholders and decide on objectives and process
Construct the food basket
Construct the non-food basket
Reality check results and validate with stakeholders
Determine the analytical starting point (eg examine national poverty lines set the population of interest check what data is available) and decide on approach
Accounting for household size and composition
Adapting the MEB to different needs across regions or seasons
Adjusting the MEB for regional or urbanrural price differences if significant
HOW TO
Box 1MEB
3 How to construct a MEB generic steps
11 This is in line with the cost of basic needs approach widely used for poverty lines as described in previous sections
A MEB is constructed by estimating the cost of acquiring
adequate food and adding the cost of other essential non-
food expenditures11 The box below shows the steps that are
always part of constructing a MEB
The two principal methods for constructing MEBs are
the expenditure-based approach and the rights-based
approach Sections 5 and 6 describe these approaches
and how to combine elements of both to apply a hybrid
approach
Regardless of approach it is crucial to arrive at a realistic
relevant and operational MEB that is rooted in
consumption behaviour ndash section 6 also looks at how to
ensure this Before going into the details of construction the
next section outlines the key questions to ask before starting
the MEB analysis
8
Minimum Expenditure Baskets Guidance Note | December 2020
Before embarking on the construction of the MEB
components consider the following questions to decide how
best to approach the analysis
What is the objective and whowill be the partnersStart by setting the objective and consider what the MEB will
be used for once the analysis is finished If the MEB analysis
is a joint exercise identify potential partners possibly in
interagency working groups such as a cash working group find
out what kind of information various organizations can share
and decide on the division of labour In some cases it can be
helpful to write terms of reference for the MEB analysis in
order to clarify the envisioned process and methodology Even
if the MEB analysis will be conducted by just one agency it is
always a good idea to identify partners who will be interested in
the results and who can be consulted along the way12
Who is the MEB being constructed forIt is important to define the population of interest for the
MEB Is it intended to be valid for the entire country Or will it
only be used in a refugee camp for example or a particular
region where needs might differ from those in the rest of
the country It is vital to decide from the start where and for
whom the MEB should apply Since the MEB describes the
cost of essential needs the population for whom the MEB
is constructed should ideally have relatively homogenous
consumption patterns and needs If consumption patterns are
very different consider constructing different MEBs or varying
certain components of the MEB for sections of the population
Have any MEBs already been created for the population of interest If there are one or more MEBs already in use the analytical
exercise might be aimed at updating or even ldquoreality
checkingrdquo the existing baskets to see whether they still match
consumption behaviour and price levels If existing baskets
are found to be valid and relevant it might not be necessary
to start a new MEB analysis
4 Before starting the analysis What information and data is already available and is new data neededConsider what data or analysis is already available from
essential needs assessments or other household surveys
(undertaken by WFP or others) Does the data cover the area
and population of interest Also consider what qualitative
information might be available to shed light on certain
expenditure patterns and whether there is access to market
and price information If the data available is insufficient or
outdated plan to collect fresh data A MEB analysis is greatly
strengthened by being conducted as part of a comprehensive
essential needs assessment The assessment describes the
essential needs of the population of interest which is a
useful starting point for a MEB analysis and complements the
monetary perspective provided by a MEB
Can the national poverty line be usedBefore beginning the construction of a MEB it is useful to find
out if a national poverty line exists and how and when it was
constructed Many countries have their own national poverty
lines so why not use this poverty line (and the corresponding
basket) as the MEB Whenever possible the first choice
should be to align with government practices However this is
often not feasible for three main reasons
Practices vary widely when it comes to constructing
national poverty lines Although the most common
approach is the cost of basic needs using MEBs
sometimes poverty lines are set as a share of the
country mean or median income or expenditures or
as a fixed percentage of the income or expenditure
distribution (although this is mostly not the case in low
income countries) Furthermore even when a MEB has
been constructed to develop the poverty line different
methodologies exist For example sometimes countries
exclude non-food items from their poverty line MEB
Since the MEB describes the cost of essential needs the population for whom the MEB is constructed should ideally have relatively homogenous consumption patterns and needs
12 The Cash Learning Partnershiprsquos MEB Tip Sheet contains useful advice on the interagency processes around constructing a MEB Baizan and Klein 2019
9
Minimum Expenditure Baskets Guidance Note | December 2020
Countries can also have different poverty lines for
different purposes and regions13 These factors can all
limit the use of the national poverty line as the MEB
The population of interest for a MEB could differ from the
overall population of the country and hence the national
poverty line This group of people may have different
essential needs for instance if they live in refugee camps
or do not have access to the same services as the resident
population (eg public education)
The data that WFP typically collects through essential
needs assessments comprehensive food security
and vulnerability analyses emergency food security
assessments baseline assessments and post distribution
monitoring is often much less detailed than that gathered
through the household budget surveys or living standards
measurement surveys used to calculate national poverty
lines It is widely observed that the more detailed the
survey questions about expenditures the higher the
reported expenditures14 If the national poverty line is
constructed using detailed data but the assessment of
household needs or expenditures relative to the poverty
line is based on less detailed data errors in the analysis
are likely to occur Furthermore WFP expenditure
modules do not include asset depreciation which is often
accounted for when calculating national poverty lines
Even if the national poverty line cannot be used in most
cases and especially in humanitarian contexts elements of
the methodology can perhaps be replicated It is therefore
important to find out how the national poverty line is
constructed
How about using the methodology applied for consumer price indices The consumer price index (CPI) is used to measure changes
in price levels based on a weighted average consumer basket
of goods and services In most countries household budget
survey data is used to construct the baskets used to measure
consumer prices A weight that corresponds to average
household expenditure patterns is applied to each component
of the CPI17 This basket is not ideal for MEB calculations
because it corresponds to overall national average
consumption patterns MEBs are based on the consumption
levels and patterns of those households who are just able to
meet their essential needs within the population of interest
(this is further described in the following sections)
13 Jolliff and Prydz 2016 14 Haughton and Khandker 200915 Republic of Zambia Central Statistical Office 2016 16 See Turkish institute of statistics data portal httpsdatatuikgovtrKategoriGetKategorip=Income-Living-Consumption-and-Poverty-10717 The CPI weights are usually available through national statistical offices
COUNTRYEXAMPLE
EXAMPLES OF NATIONAL POVERTY LINESEG Box 2
In Zambia the national poverty line is constructed using the cost of basic needs MEB approach based on a simple food
basket that meets minimum food needs for a family of six15 Imagine this food basket costs USD 100 per month This is
defined as the food poverty line To construct the full poverty line the minimum non-food needs of households are
estimated based on the average share of expenditure that households just above the food poverty line dedicate to needs
other than food Let us say that this corresponds to USD 35 per month The total poverty line is then the sum of the food
and non-food lines which with these hypothetical figures would be USD 100 + USD 35 = USD 135
By contrast Turkey uses the standard European Union approach to measuring poverty which is 50 or 60 percent of
median income16 However eligibility for social assistance is based on the gap between household income and the national
minimum wage
10
Minimum Expenditure Baskets Guidance Note | December 2020
In developing country contexts consumption is generally considered a better metric of wellbeing than income and in turn consumption expenditures as captured in household data generally provide the most reliable measure for consumption
5 Constructing a MEB expenditure-based and rights-based approaches
51 The expenditure-based approachThe expenditure-based approach to constructing a MEB
relies on household-level expenditure data to examine the
consumption behaviour of households who are just able
to meet their essential needs The expenditure level and
consumption patterns for this group of households reveal the
minimum cost of covering essentail food and non-food needs
and therefore form the basis of the expenditure-based MEB
The expenditure-based approach builds on the theory
behind poverty measurement and poverty line construction
To measure poverty the first step is to define a measure
of wellbeing In developing country contexts consumption
is generally considered a better metric of wellbeing than
income and in turn consumption expenditures as captured in
household data generally provide the most reliable measure
for consumption18 Household survey data on expenditures
therefore provides the foundation for measuring wellbeing
and is used to set the MEB threshold
The steps for constructing a MEB using the expenditure-based
approach are explained below
1 Prepare the expenditure data The prerequisite for an expenditure-based MEB is a
good-quality household survey with a detailed expenditure
module with a sufficient sample size representative of the
population for whom the MEB is being constructed (the
ldquopopulation of interestrdquo)
The notion of a ldquodetailedrdquo expenditure module is a
relative one Constructing an expenditure-based MEB
requires more detailed data on different types and
groups of expenditures than is usually gathered by
household surveys conducted in humanitarian settings
However this guidance has been designed to cope
with less detailed expenditure data than that gathered
through extensive national expenditure surveys such
as the very granular expenditure modules typically used
when constructing poverty lines (eg national household
budget surveys household income and expenditure
surveys living standards measurement surveys or other
large-scale household surveys)
What is a sufficient sample size The survey should
always follow good practices for sampling19 Consider
that for MEBs the analysis focuses on the consumption
patterns of a subset of the sample the ldquoreference cohortrdquo
(see next below) The characteristics of the population
and the cohort selection criteria determine the size of
this subsample in relation to the overall sample but
experience shows that the cohort can comprise between
10 and 60 percent of the sample The sample will be
further disaggregated if analysis by household size or
group of household size is desired (see section 7 on
accounting for household sizes)
Using expenditures to understand consumption involves
calculating a ldquoconsumption aggregaterdquo This entails
combining household expenditures on food and non-
food paid in cash or through credit as well as the
imputed monetary values of consumed own production
and received assistance Expenditures are analysed in
per-capita values Box 3 describes this process in more
detail Annex 1 further outlines some best practices when
analysing expenditure data
In addition to the household survey data market price
data is needed in order to estimate the final cost of the
basket The price data should be collected around the
same time as the household survey data
18 Deaton and Zaidi 2002 and Haughton and Khandker 2009 19 For guidance see WFP 2004 Additional resources can be found in the online VAM Resource Centre httpsresourcesvamwfporg
11
Minimum Expenditure Baskets Guidance Note | December 2020
HOW TO
EXPENDITURE DATA IN MEB CALCULATIONS -CONSTRUCTING A LIGHT ldquoCONSUMPTION AGGREGATErdquo
Box 3
Using expenditures to calculate a MEB entails combining different household expenditures to arrive at a measure of house-
hold consumption This is typically referred to as a consumption aggregate although a lighter version is used than those
usually constructed for national poverty lines due to the less granular data typically available for MEB construction20
Expenditures considered in a MEB should reflect household consumption related to essential needs Therefore both
household expenditures made in cash and those on credit must be considered as the latter also reflect current consump-
tion even if payment occurs later If the population can be expected to consume food from their own production the value
of this food should be captured to avoid underestimating food expenditures Lastly if the surveyed households are receiv-
ing and consuming assistance it is advisable to estimate the implied value of this assistance and include it in the expendi-
tures (however care needs to be taken if the population of interest includes a large group of in-kind assistance beneficiar-
ies as this can significantly skew consumption choices see next section on selecting the reference cohort) In summary the
expenditure module should capture any expenditures made in the reference period through cash and credit purchases as
well as the monetary value of consumed own production and assistance Most standard expenditure modules include all
these types of expenditures
Expenditures should be collected for both food and non-food goods and services For food expenditures at the food group
level are required as a minimum If food expenditures are collected at the item level a more granular analysis can be per-
formed The same applies for non-food expenditures they must be available at the group level and item-level data will add
detail However whenever household data is collected a balance needs to be struck between the granularity of the data
and the time and resources available for its collection
The WFP standard expenditure module can be used as a reference for the minimum requirement for expenditure data
collection WFP standard modules can be found in the online VAM Resource Centre httpsresourcesvamwfporg
+ ndash=
2 Select the reference cohort The next step is to identify the households in the survey
data that are just able to meet their essential needs and
examine their expenditures Including households below
this level would generate a basket that does not satisfy
essential needs while including relatively wealthier
households would lead to the inclusion of non-essential
needs and therefore inflate the MEB But what is ldquojust
enoughrdquo
Identifying the cohort of households who are just able
to meet their needs can be challenging How to approach
it depends on the characteristics of the population
and the available data The key is to identify one or
more criteria that can be good proxies for whether
households are just able to meet their essential
needs and that can be observed in the data One
basic indicator would be a food consumption of 2100
kcal per person per day21 However since the available
expenditure data is often too crude to make accurate
calibrations of diet compositions around the 2100
kcal point the use of alternative indicators is highly
recommended These could be indicators such as food
consumption score (FCS) or food consumption score ndash
nutrition (FCS-N)22 which indicate whether households
eat sufficient and balanced diets quality of housing
indicators use of coping strategies (selecting households
who do not engage in severe strategies) or any other
indicator that reflects a householdrsquos ability to meet its
needs Combining several indicators is often useful
20 For thorough guidance on constructing consumption aggregates using data from living standard measurement surveys (LSMS) see Deaton and Zaidi 2002 In most WFP cases household data is less granular than the LSMS-type datasets This section therefore describes how to construct consumption aggregates with less detailed data21 Use of calorie consumption close to the Sphere Standard of 2100 kcalpersonday as the starting point for selecting the reference cohort originates in the cost of basic needs approach used in most national poverty line estimations 22 WFP 2008 and WFP 2015
12
Minimum Expenditure Baskets Guidance Note | December 2020
Figure 2 Selecting the MEB cohort
In simple terms it is useful to think of the green people in the figure as the basis for selecting the reference cohort they are not amongst the worst-off
nor the wealthiest ndash but rather are just able to meet their essential needs
DESTITUTE
WEALTHY
It is also recommended to examine the expenditure
distribution Excluding households in the extreme ends
of the expenditure distribution can help ensure that
the cohort is neither ldquotoo poorrdquo nor ldquotoo wealthyrdquo (eg
by removing households in expenditure quintiles 1 and
5 or similar exclusion criteria based on distribution
characteristics) This is in particular useful if there is a
relatively large spread in wealth across the sampled
population
Figure 2 provides a simplistic depiction of selecting the
reference cohort the aim is to identify households that
are just able to cover their needs and hence do not fall in
either extreme end of the spectrum
13
Minimum Expenditure Baskets Guidance Note | December 2020
Box 4 outlines some typical cases and presents suggestions
for how to select the cohort in a survey sampled on
the population of interest
There is a spread in the
population in terms of well-being
and a proportion is able to cover
their essential needs no
households receive assistance
A relatively large proportion of
households receive food
assistance
The vast majority of the
households are far from being
able to cover their essential
needs (prior to receiving
assistance)
Select households with an acceptable FCS23 or with adequate consumption in FCS-N
who do not use negative coping strategies (or have a high coping strategy index)
Combine or cross-check with other criteria such as dwelling quality or asset index
Exclude extreme expenditure quintiles
Exclude households receiving in-kind food assistance from the reference group (if
sample size allows) This is because any assistance that is not unrestricted cash
might influence the consumption choices of the beneficiary households (in-kind
food means a large portion of food consumption is determined by the assistance
provided not the households) However be aware that if the majority of
households receive some form of restricted assistance excluding them all from the
cohort can lead to sample size issues as well as selection bias
Alternatively to the extent possible avoid using criteria that are highly influenced
by assistance For example in the presence of food assistance the FCS of some
households might be acceptable even if they are not able to meet their essential
needs Furthermore if in-kind food is provided the consumption behaviour of such
households might be skewed as most of their food needs are already covered by
assistance
Consider using dwelling quality an asset index or other similar indicators instead
(or in combination with the FCS)
Consider using a rights-based approach since it will be very difficult to obtain a big
enough sample of households who can meet their essential needs making it
challenging to construct an expenditure-based MEB Carry out a reality check using
the survey data to understand household consumption patterns keeping in mind
that the sample represents a population not able to fulfill their essential needs
HOW TO
REFERENCE COHORT SELECTIONBox 4
Scenario Possible approach to selecting the cohortUse one or several of the below criteria
The use of sensitivity tests is highly recommended in the form
of repetitions of the expenditure analysis for different versions
of the reference cohort this will indicate the extent to which
the choice of cohort selection criteria is influencing the MEB
23 It is usually not advisable to use the FCS as a single criterion If it is used alone the indicator should be capped at a certain level above the acceptable threshold (the FCS builds on a continuous score from 0ndash112 and applies thresholds for poor borderline and acceptable consumption) This is because if all households with acceptable FCS are included this will likely also capture some households who are ldquotoo wealthyrdquo to be considered in the reference cohort
14
Minimum Expenditure Baskets Guidance Note | December 2020
See box 5 for examples of how sensitivity tests can be
conducted as well as how the reference cohort has been
COUNTRYEXAMPLE
SELECTING AND CHECKING THE REFERENCE COHORTCHAD SYRIAN REFUGEES IN LEBANON AND COXrsquoS BAZAR
EG Box 5
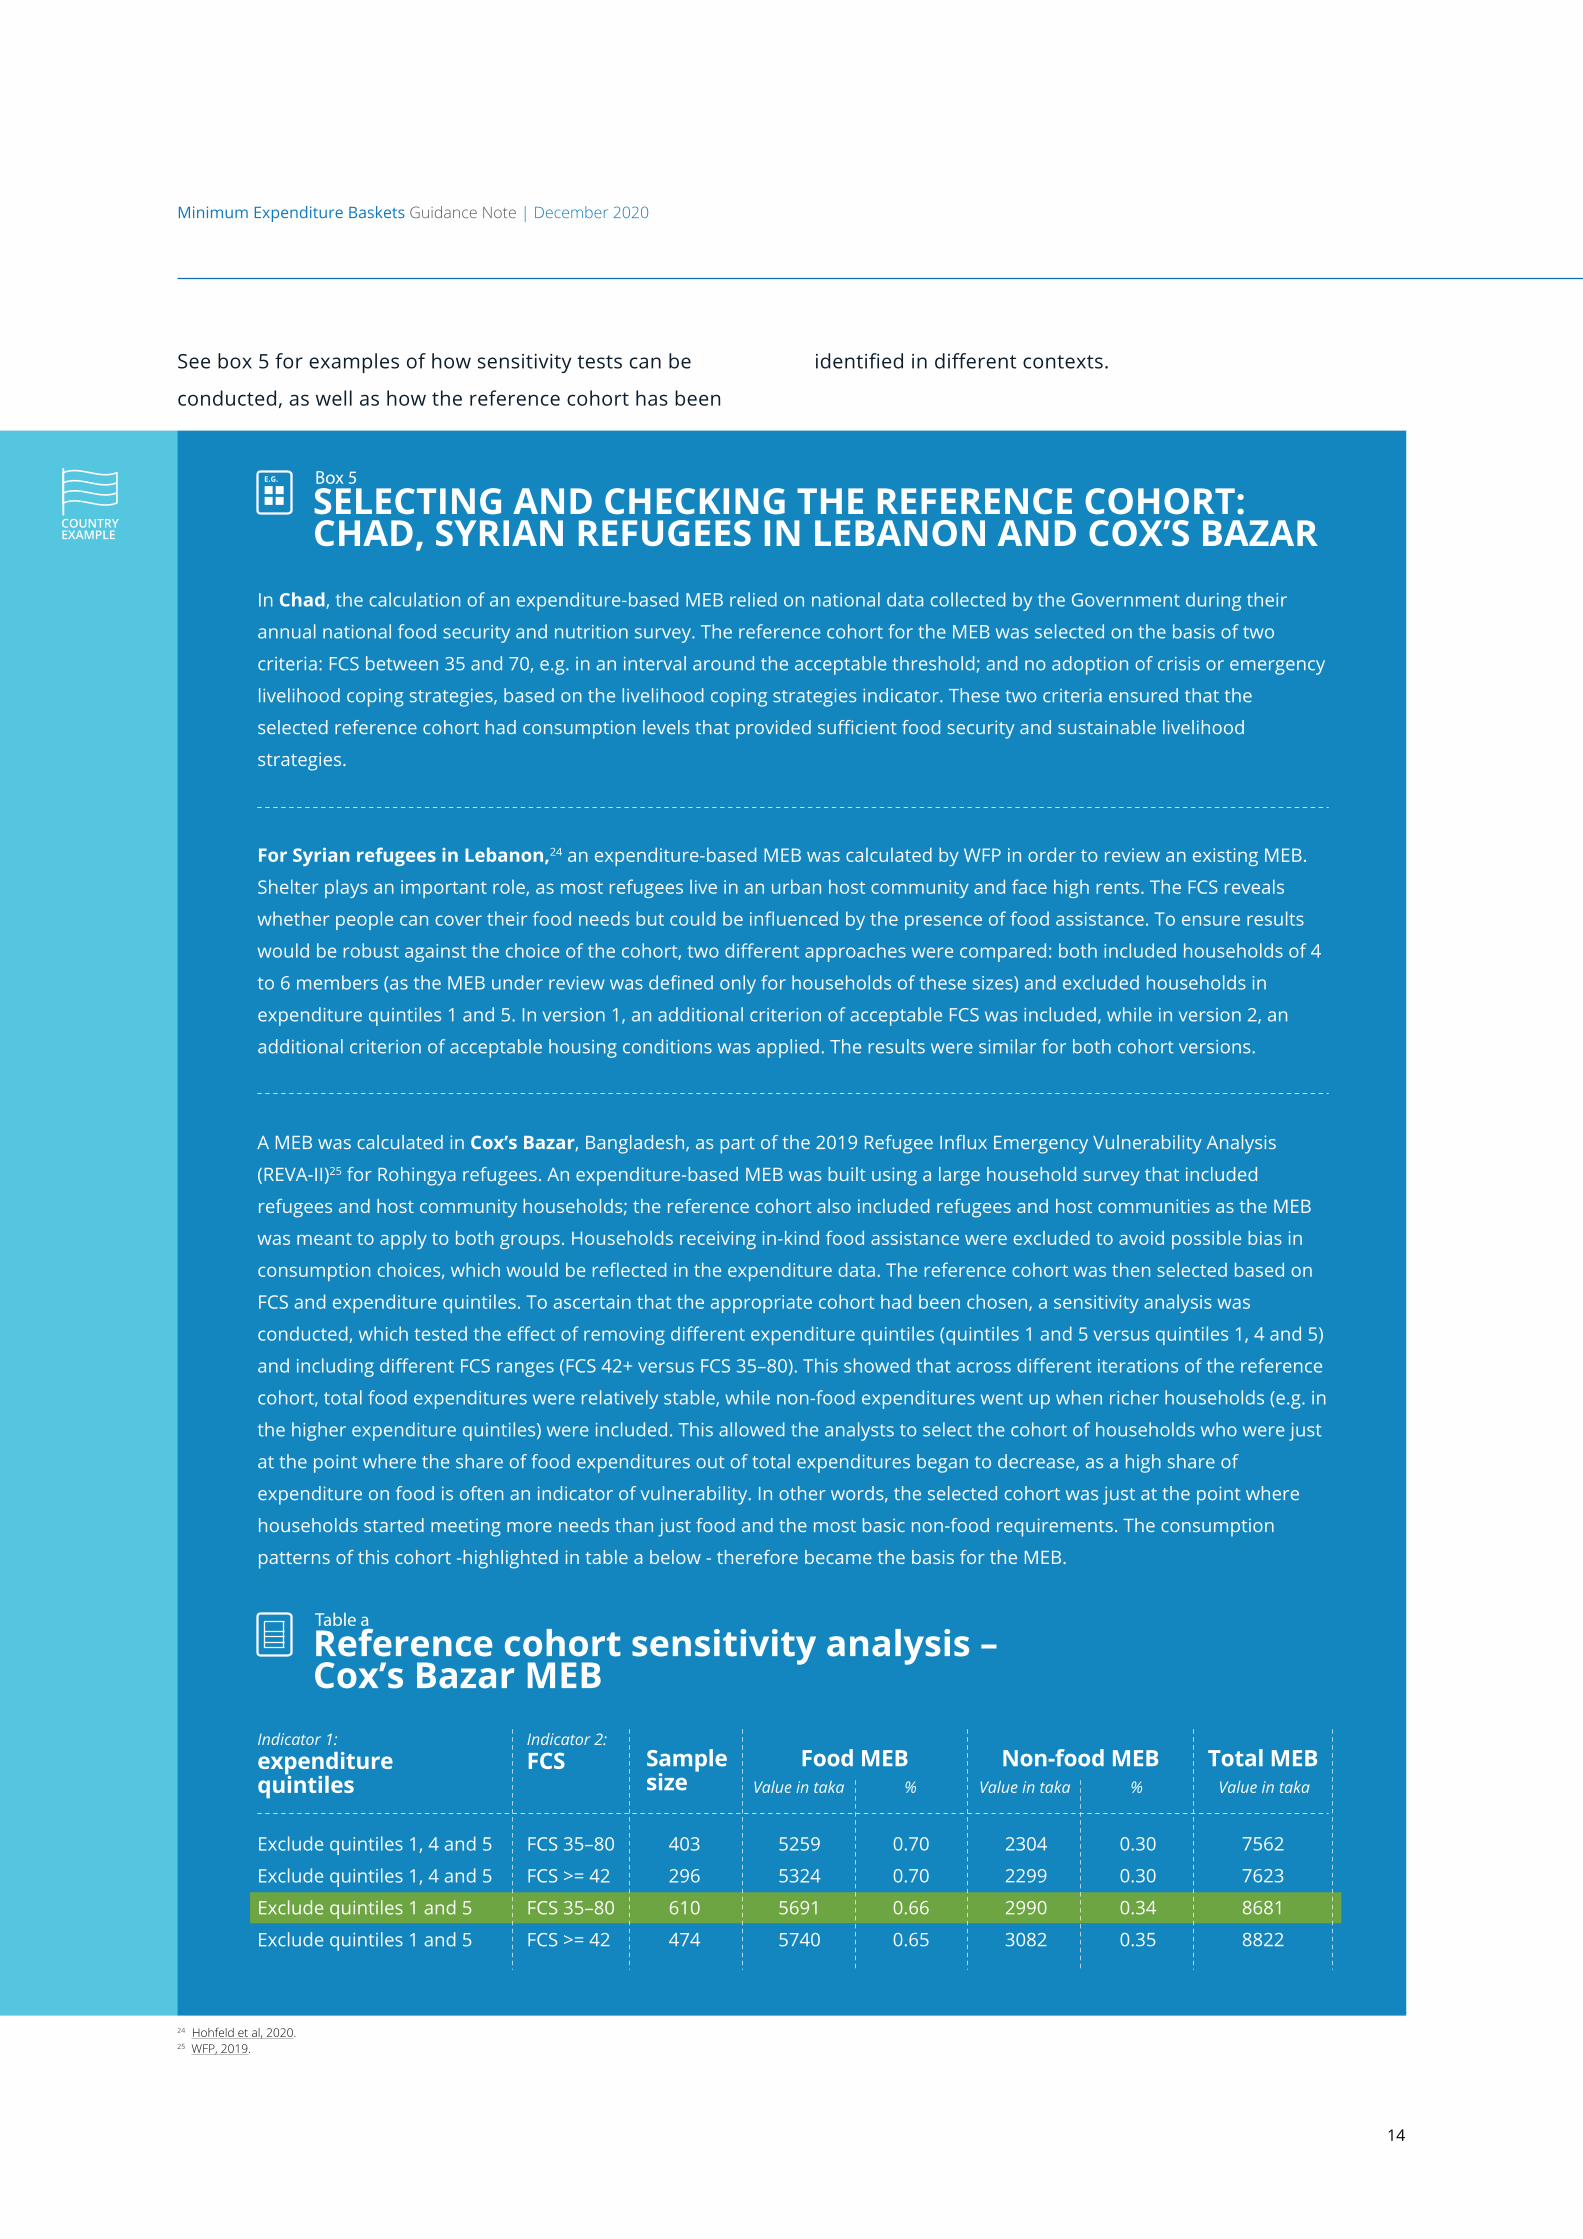
Reference cohort sensitivity analysis ndashCoxrsquos Bazar MEB
Table a
In Chad the calculation of an expenditure-based MEB relied on national data collected by the Government during their
annual national food security and nutrition survey The reference cohort for the MEB was selected on the basis of two
criteria FCS between 35 and 70 eg in an interval around the acceptable threshold and no adoption of crisis or emergency
livelihood coping strategies based on the livelihood coping strategies indicator These two criteria ensured that the
selected reference cohort had consumption levels that provided sufficient food security and sustainable livelihood
strategies
For Syrian refugees in Lebanon24 an expenditure-based MEB was calculated by WFP in order to review an existing MEB
Shelter plays an important role as most refugees live in an urban host community and face high rents The FCS reveals
whether people can cover their food needs but could be influenced by the presence of food assistance To ensure results
would be robust against the choice of the cohort two different approaches were compared both included households of 4
to 6 members (as the MEB under review was defined only for households of these sizes) and excluded households in
expenditure quintiles 1 and 5 In version 1 an additional criterion of acceptable FCS was included while in version 2 an
additional criterion of acceptable housing conditions was applied The results were similar for both cohort versions
A MEB was calculated in Coxrsquos Bazar Bangladesh as part of the 2019 Refugee Influx Emergency Vulnerability Analysis
(REVA-II)25 for Rohingya refugees An expenditure-based MEB was built using a large household survey that included
refugees and host community households the reference cohort also included refugees and host communities as the MEB
was meant to apply to both groups Households receiving in-kind food assistance were excluded to avoid possible bias in
consumption choices which would be reflected in the expenditure data The reference cohort was then selected based on
FCS and expenditure quintiles To ascertain that the appropriate cohort had been chosen a sensitivity analysis was
conducted which tested the effect of removing different expenditure quintiles (quintiles 1 and 5 versus quintiles 1 4 and 5)
and including different FCS ranges (FCS 42+ versus FCS 35ndash80) This showed that across different iterations of the reference
cohort total food expenditures were relatively stable while non-food expenditures went up when richer households (eg in
the higher expenditure quintiles) were included This allowed the analysts to select the cohort of households who were just
at the point where the share of food expenditures out of total expenditures began to decrease as a high share of
expenditure on food is often an indicator of vulnerability In other words the selected cohort was just at the point where
households started meeting more needs than just food and the most basic non-food requirements The consumption
patterns of this cohort -highlighted in table a below - therefore became the basis for the MEB
Indicator 1expenditurequintiles
Indicator 2FCS Sample
size Value in taka
Total MEB
Exclude quintiles 1 4 and 5
Exclude quintiles 1 4 and 5
Exclude quintiles 1 and 5
Exclude quintiles 1 and 5
FCS 35ndash80
FCS gt= 42
FCS 35ndash80
FCS gt= 42
403
296
610
474
5259
5324
5691
5740
2304
2299
2990
3082
070
070
066
065
030
030
034
035
7562
7623
8681
8822
Food MEBValue in taka Value in taka
Non-food MEB
identified in different contexts
24 Hohfeld et al 2020 25 WFP 2019
15
Minimum Expenditure Baskets Guidance Note | December 2020
3 Establish the food basketWith the reference cohort identified the food basket value
should be calculated in correspondence with the food
consumption patterns of the reference cohort
To calculate the food basket start by computing the mean
(or median) food expenditures for the chosen reference
cohort It is good practice to compute the overall food
expenditures and break the analysis down into the different
food groups or food items in order to understand how food
consumption is distributed across different foods
Next consider whether an explicit reference food basket
is needed in the MEB this is a list of the food items in the
basket and their quantities Having a reference basket
brings advantages in terms of monitoring of the cost
of the MEB (as new prices can easily be applied to the
quantities) it shows consumption patterns in quantities
and can hence help check if food consumption is adequate
at the given level of expenditures and it can help when
communicating about the MEB It can therefore be a useful
practice to establish one However in some instances
a simple monetary value for the food MEB is sufficient
This could be the case when the MEB is calculated to
review an existing MEB if reference basket is not needed
for operational purposes when time is limited or
where limited data means a reference basket cannot be
adequately calculated Wherever a food reference basket
is not needed the food MEB will simply be the mean (or
median) food expenditures by food groups or food items
as calculated above If a reference food basket is feasible
and desired the next steps depend on the level of detail in
the data available
With expenditure data and market prices a food
reference basket can be approximated using expenditures
by food group or food item and dividing these
expenditures by the relevant food prices This provides
estimates of consumed quantities Expenditures and prices
must be collected at the same time in order to arrive at
correct quantities If for example prices are collected six
months later than expenditures and prices have changed
significantly dividing expenditures by prices will produce
inaccurate estimates
Note that the level of detail and accuracy with which a
food refence basket can be established using expenditures
and prices also depends on whether expenditures
were collected at the food group or food item level Box 6
illustrates how to approximate a reference basket when
expenditures are collected at the food group level and
box 7 shows an example of a food basket estimation from
an assessment in Kinshasa Democratic Republic of the
Congo
If the expenditure module includes consumed quantities
of food in addition to expenditures a food basket can be
established directly based on the consumed quantities by
food group or food item Having data on quantities will
also enable analysts to estimate prices directly from the
survey data by dividing the household expenditure on a
particular food item by the quantity consumed This can be
advantageous as it provides a direct estimate of the prices
households actually paid (unlike a price survey which uses
typically consumed items and is often only conducted
at specific points of sale) On the other hand this may
introduce issues related to non-standard measurement
units that make prices hard to compute and aggregate26
Box 8 shows an example from Coxrsquos Bazar of how a food
reference basket can be established using item-level
expenditures and quantities from the survey data
Once the quantities consumed have been established using
one of the methods described above it is good practice to
check the calories these quantities provide and the balance in
terms of nutrients The basket should be close to the Sphere
Standard of 2100 kcal per person per day ndash if it is not one
option could be to scale the basket Use information on the
calorie content of the different food items in the basket to
calculate the total calorie content of the basket27 The quantities
in the basket can then be scaled up or down to reach 2100
kcal However bear in mind that if the reference cohort has
been well selected and the data is of sufficient quality and
detail the basket should already be close to 2100 kcal If large
rescaling is required investigate the reasons behind this For
the sake of simplification quantities can be rounded and the
basket can be streamlined by removing items with very low
consumption or nutritional value
26 Deaton and Grosh 2000 27 Calorie information of food items can be drawn from a variety of sources The Nutval tool (httpwwwnutvalnet) provides information on calories and other nutrients for a list of items Consider that the
specifications and quality of a product can influence its caloric value (eg whole fish vs fish fillet) ndash it might be necessary to adjust for this for certain items that vary widely Many food composition tables (available from FAO for different continents httpwwwfaoorginfoodsinfoodstables-and-databasesfaoinfoods-databasesen) contain a wastage factor or edible portion conversion factor to convert from edible portions into full products as they are bought on the market
16
Minimum Expenditure Baskets Guidance Note | December 2020
After establishing the reference basket and possibly rescaling
it the basket is priced This is done by multiplying the basket
quantities by the food prices The basket can be priced using
current food prices from a price survey or by estimating food
prices from the expenditure data as described earlier The
result should be close to the expenditures for the reference
cohort although differences could arise from any rescaling or
simplification of the basket
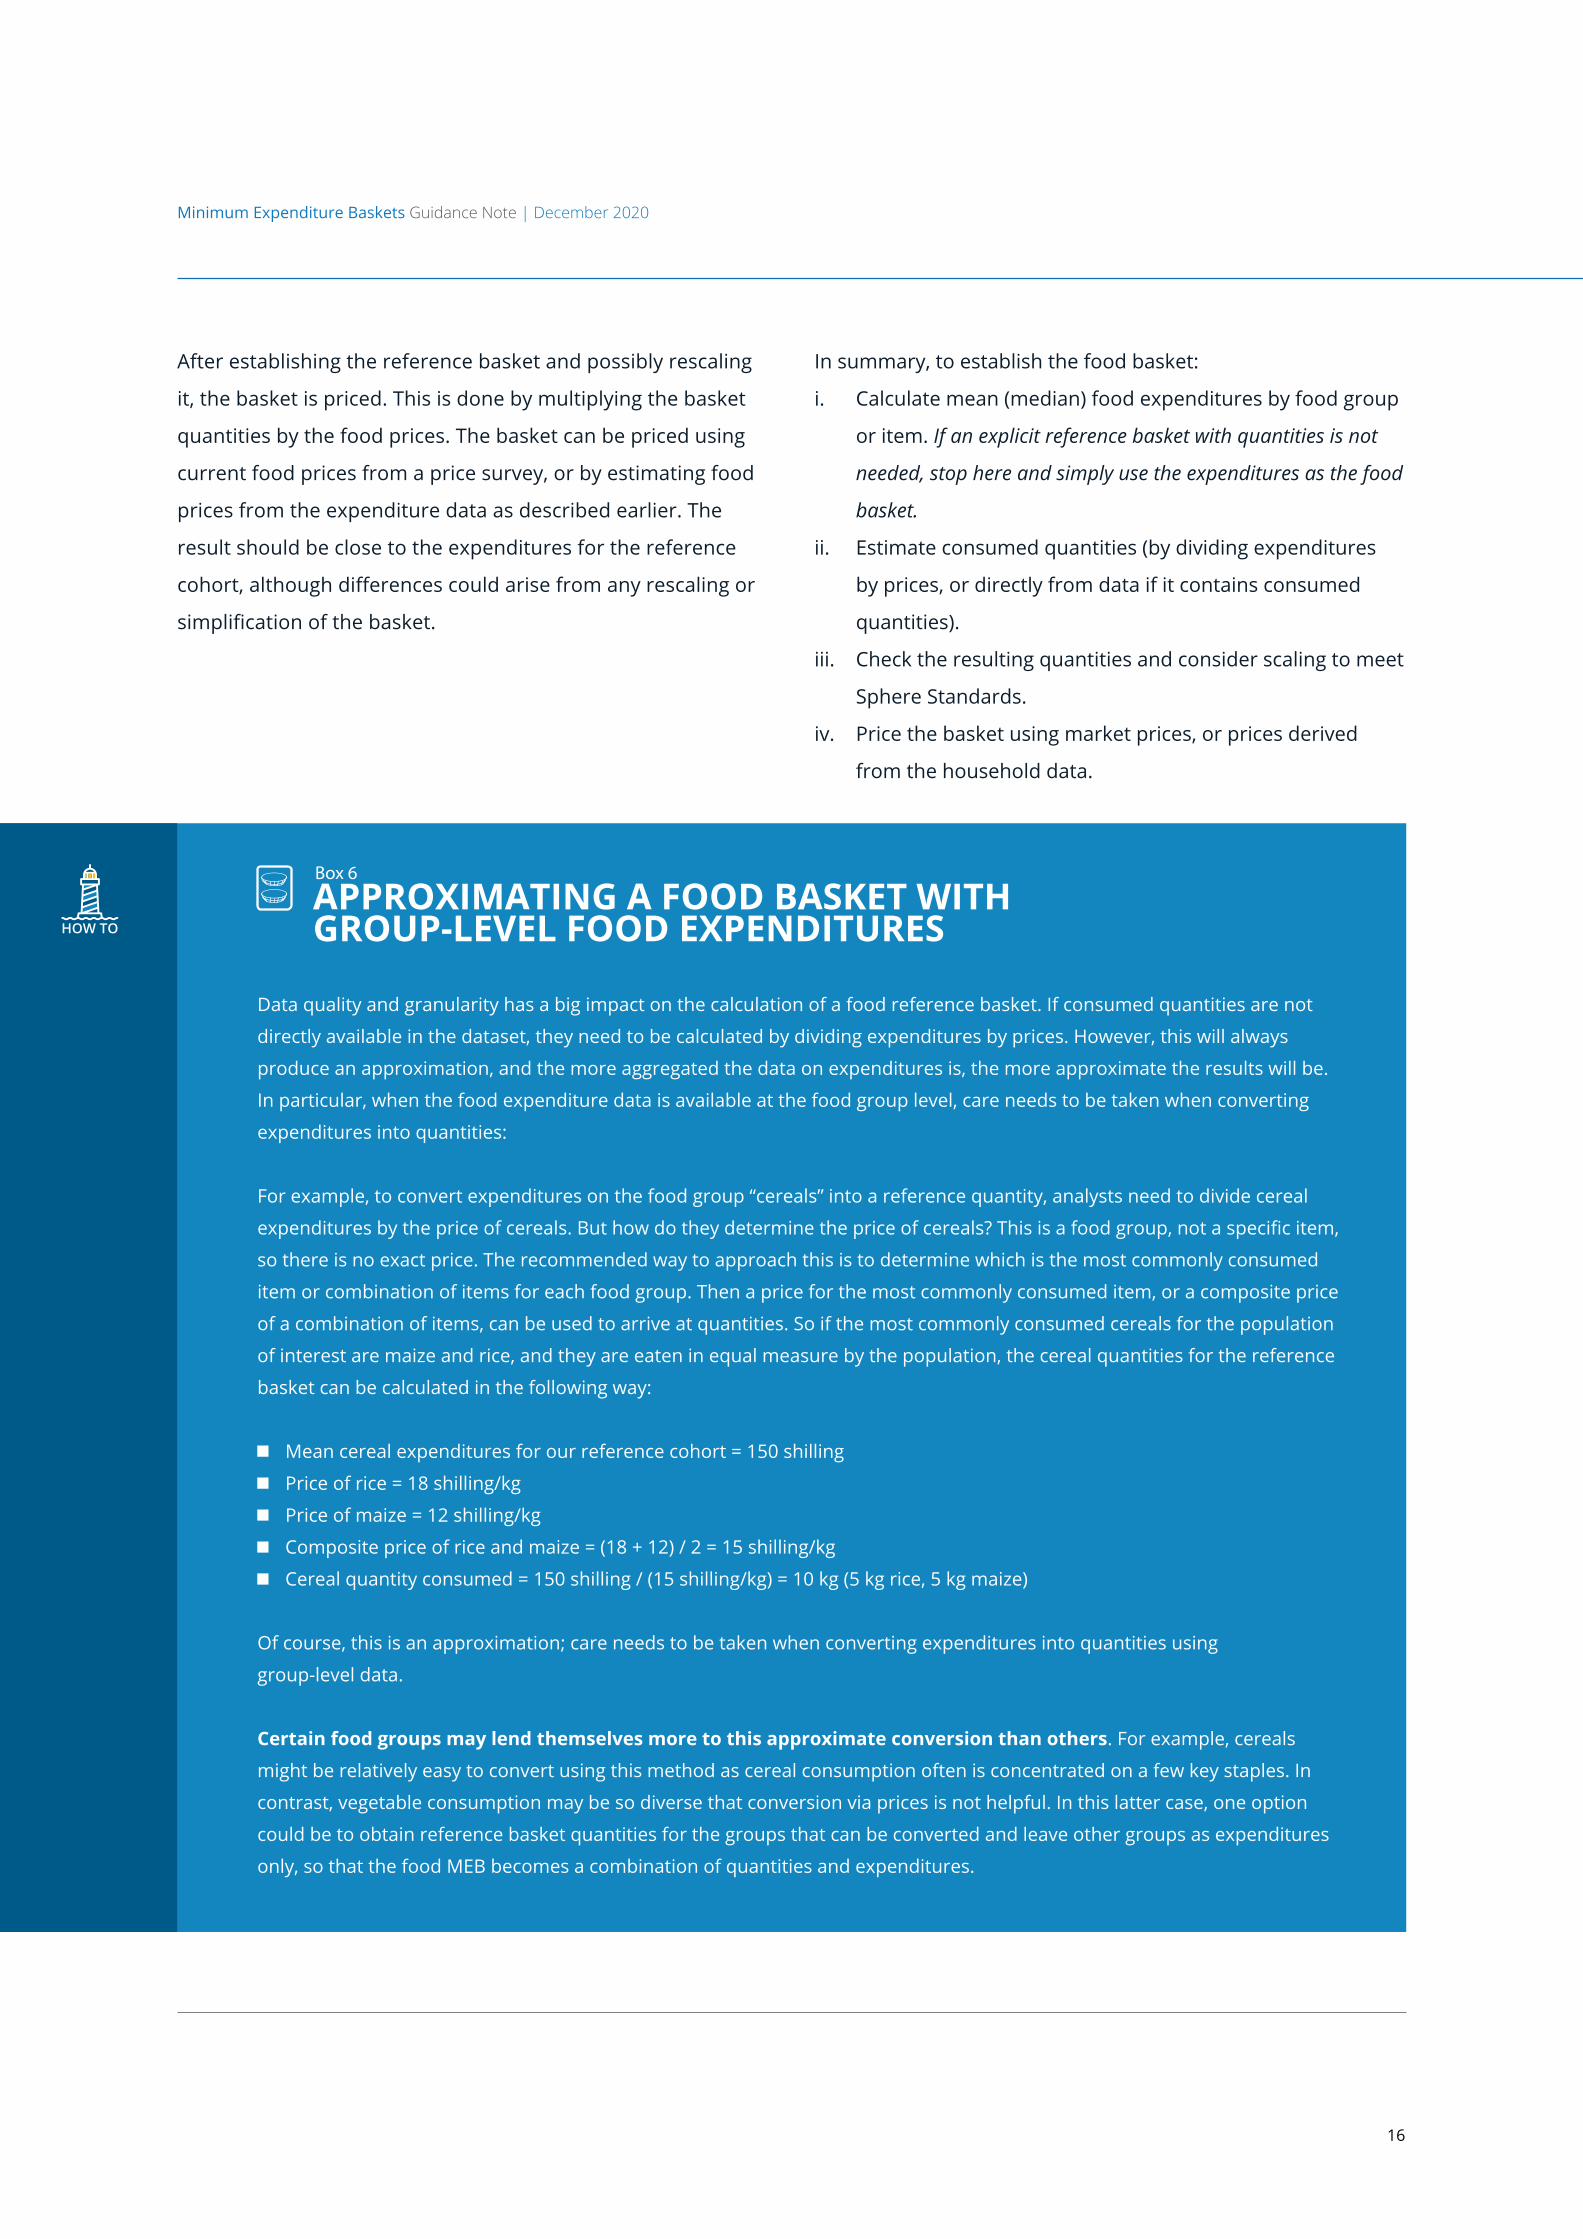
APPROXIMATING A FOOD BASKET WITHGROUP-LEVEL FOOD EXPENDITURES
Box 6
HOW TO
Data quality and granularity has a big impact on the calculation of a food reference basket If consumed quantities are not
directly available in the dataset they need to be calculated by dividing expenditures by prices However this will always
produce an approximation and the more aggregated the data on expenditures is the more approximate the results will be
In particular when the food expenditure data is available at the food group level care needs to be taken when converting
expenditures into quantities
For example to convert expenditures on the food group ldquocerealsrdquo into a reference quantity analysts need to divide cereal
expenditures by the price of cereals But how do they determine the price of cereals This is a food group not a specific item
so there is no exact price The recommended way to approach this is to determine which is the most commonly consumed
item or combination of items for each food group Then a price for the most commonly consumed item or a composite price
of a combination of items can be used to arrive at quantities So if the most commonly consumed cereals for the population
of interest are maize and rice and they are eaten in equal measure by the population the cereal quantities for the reference
basket can be calculated in the following way
Mean cereal expenditures for our reference cohort = 150 shilling
Price of rice = 18 shillingkg
Price of maize = 12 shillingkg
Composite price of rice and maize = (18 + 12) 2 = 15 shillingkg
Cereal quantity consumed = 150 shilling (15 shillingkg) = 10 kg (5 kg rice 5 kg maize)
Of course this is an approximation care needs to be taken when converting expenditures into quantities using
group-level data
Certain food groups may lend themselves more to this approximate conversion than others For example cereals
might be relatively easy to convert using this method as cereal consumption often is concentrated on a few key staples In
contrast vegetable consumption may be so diverse that conversion via prices is not helpful In this latter case one option
could be to obtain reference basket quantities for the groups that can be converted and leave other groups as expenditures
only so that the food MEB becomes a combination of quantities and expenditures
In summary to establish the food basket
i Calculate mean (median) food expenditures by food group
or item If an explicit reference basket with quantities is not
needed stop here and simply use the expenditures as the food
basket
ii Estimate consumed quantities (by dividing expenditures
by prices or directly from data if it contains consumed
quantities)
iii Check the resulting quantities and consider scaling to meet
Sphere Standards
iv Price the basket using market prices or prices derived
from the household data
17
Minimum Expenditure Baskets Guidance Note | December 2020
Table a Food reference basket ndash Kinshasa MEB
COUNTRYEXAMPLE
KINSHASA FOOD REFERENCE BASKET USINGFOOD GROUP EXPENDITURES
Box 7
In the Kinshasa urban essential needs assessment28 the food reference basket for the MEB was established as follows
Expenditure data was available at the food group level only The caloric importance of each food group (column A of the
table below) as a part of the overall food intake was determined For each of the calorie-relevant food groups the most
commonly consumed food item was then identified (eg maize in the case of cereals) (see column B) Using the average per
capita expenditure from the household survey (column C) and the market price for each food item (column D) the
quantities consumed per person per month were approximated (column E) Next the total calorie intake was calculated
(column G) For urban Kinshasa this amounts to 1967 kcal which is close to the Sphere Standard of 2100 kcalpersonday
and suggests that the expenditure data is likely to be reliable However a proportional rescaling to 2100 kcalpersonday
was done to ensure consistency with Sphere (column H) On the basis of the rescaled total calories all values were then
converted back to monthly figures to arrive at a monetary value for each food item (columns I and J) In addition to the
calorie-relevant food items the mean expenditures on other food categories that households regularly consume were
added (vegetables fruit etc) As these food items represent little overall share of peoplersquos calorie consumption (given the
quantities consumed or the type of the foods) they were not included when calories were calculated Furthermore it would
be difficult to select specific food items in each of these categories as they are quite diverse (eg vegetables) However as
most households still consume these food items as part of their usual diet and they provide important micronutrients their
costs need to be reflected in the food MEB The mean expenditure on these food categories was therefore used as a
good-enough approximation for householdsrsquo consumption of these food groups Meals consumed outside the household
were excluded from the MEB as they were not considered essential
Food
grou
p
Food
item
per
capi
ta a
vm
onth
ly e
xp
Pric
e(f
ranc
kg)
kg c
ons
per
mon
th =
CD
food
item
kca
lpe
r 10
0g
kcal
con
s p
er d
ay=(
EF
10)
30
kcal
per
day
res
cale
d=G
(21
001
967)
kg p
er m
onth
res
cale
d=(
H(
F10
))30
roun
ded
MEB
food
-bas
ket
(fra
nc)=
ID
6898
1808
2089
2341
4306
1817
2826
833
799
2509
2144
900
500
1300
2300
2500
2200
77
36
16
10
17
08
920
412
179
302
44
110
1967
360
342
335
890
76
400
TOTAL
982
440
192
322
47
118
2100
82
39
17
11
18
09
7400
1900
2200
2500
4600
1900
2800
800
800
2500
27400
A B C D E F G H I JCereals
Tubers
Pulses
Oilsfats
Meatfish
Sugars
Vegetables
Fruit
Dairy
Condiments
Meals out-
side home
Maize
Cassava
Beans
Veg Oil
Fish
White sugar
Vegetables
Fruit
Dairy
Condiment
Meals out-
side home
29 WFP 2019 Also see box 5
18
Minimum Expenditure Baskets Guidance Note | December 2020
COUNTRYEXAMPLE
COXrsquoS BAZAR FOOD REFERENCE BASKETWITH DETAILED EXPENDITURE AND QUANTITY
Box 8
In the MEB for Coxrsquos Bazar calculated as part of the REVA II assessment expenditures and consumed quantities were
available for 87 food items which formed the basis for the consumption aggregate While the expenditure data was used to
select the appropriate reference cohort the reported quantities were used to determine household calorie intake
Quantities were reported at the food item level and consumed calories were calculated for each item The items were then
categorized by food group (cereals pulses oilsfats vegetables etc) and the total calories from each group were
calculated To create an operationally relevant reference basket without very large numbers of food items the number of
items in each food group were reduced where possible For example 95 percent of the calories that households get from
the food group ldquocerealsrdquo come from rice The cereal food group was therefore simplified to rice only keeping the total
calories sourced from cereals constant and adjusting the quantity of rice in the basket slightly upwards For pulses the four
main consumed items were identified and calories and quantities proportionally adjusted For other food groups such as
vegetables the variety of items consumed within the group was too great to simplify items to a small number for this
group no items were assigned and instead total expenditures on vegetables for the reference cohort were used directly in
the food MEB The total calories of all items were taken into account The resulting basket was close to 2100 kcal so only
minor rescaling was undertaken to arrive at final reference basket of 2100 kcalpersonday
Once the final basket had been determined quantities were priced using median prices derived from the household data
(by dividing expenditures by purchased quantities for the relevant items)
For vegetables fruits meat dairy and condiments expenditures are used directly in the food MEB (converted into monthly per
household values) For all other items quantities per capita per day are multiplied by the item median price (as derived from
the household data) and converted into monthly per household values
The MEB uses household size 5
Note The MEB for Coxrsquos Bazar was calculated for analytical purposes for the REVA II assessment It is not the operational MEB used
for the district
Foodgroup
Fooditem
Consumedquantity(grammescapitaday)
Calories(kcalcapitaday)rescaled
Median prices(takakg)
Value in MEB(taka per HHmonth)
424
14
7
2
1
182
6
81
1
33
6
28
1527
48
27
8
4
78
5
85
1
294
24
0
2100
30
80
60
40
80
-
-
-
-
80
60
-
1909
168
67
14
13
1065
48
1600
15
392
57
345
5691
Cereals
Pulses
Pulses
Pulses
Pulses
Vegetables
Fruit
Meat
Dairy
Fats
Sugar
Condiments
TOTAL FOOD
Rice
Lentil
Chickpea
Anchor daal
Mung
none
none
none
none
Soybean oil
Sugar
none
Table a Food reference basket ndash Coxrsquos Bazar MEB
19
Minimum Expenditure Baskets Guidance Note | December 2020
4 Establish the non-food basketOnce the food component has been established a non-
food component is added There is no wholly satisfactory
way to add a non-food component as it can be difficult to
define an essential minimum Unlike food needs many
non-food needs are often more contextual and are not
easy to anchor in a specific universal threshold (like the
food Sphere Standard of 2100 kcal per person per day)
While Sphere Standards exist they often need to be
contextualized and may not cover all non-food essential
needs
The non-food basket can be established with different
levels of detail depending on the available data and the
level of granularity desired
As for the food expenditures start by calculating the
mean (andor median) non-food expenditures for the
reference cohort If the expenditure data is detailed it can
be used to identify specific non-food needs Expenditures
can be analysed by non-food group (eg shelter hygiene
or transport) to design a non-food basket composed
of group-specific expenditures The precise non-food
components can vary by context but would generally
include the components discussed in the section on
the rights-based MEB below Some non-food items that
expenditure data has been collected for might need to be
excluded for the purpose of constructing the MEB (eg
tobacco which is hard to consider an essential need)
In theory it would be possible to establish a non-food
reference basket with specific quantities using the same
method as for food ie by dividing expenditures by prices
to arrive at quantities However this is usually not feasible
for non-food goods and services simply because non-food
expenditure data is often much harder to break down into
specific items than food expenditure data For instance
even if expenditures on clothing or transportation
are known relating this to exact clothing items or
transportation services and then obtaining accurate
prices for those itemsservices will often prove difficult if
not impossible Therefore as a general recommendation
in the expenditure-based approach when non-food
expenditure data is not available at the item level it is
best to keep the non-food basket to expenditures and not
provide quantities If reliable market price information on
relevant non-food items is available total expenditures
could be checked against prices to obtain an approximate
idea of the adequacy of the non-food expenditures
Particular groups of non-food expenditures may require
special attention due to their nature Box 9 highlights a
few examples
TIP BOXNON-FOOD EXPENDITURES ndashEXPENDITURES OF PARTICULAR INTEREST
$$
$
Box 9
Shelter expenditures can be a tricky component to deal with especially for urban populations If the share of the
population who rent accommodation is significant rent will typically be included in the MEB as it is the cost of shelter an
essential need Indeed it can form quite a significant part of the MEB However if the resulting MEB is compared to actual
expenditures to determine whether households fall below the MEB those who own their dwelling and therefore do not pay
rent might be classified as unable to cover their needs just because they do not have any major shelter expenditures
Therefore large single expenditures such as rent should be included with care and context will determine how shelter
expenditures are handled in the MEB Generally speaking if no or very few households in the population of interest have
major shelter expenditures such as rent this component should be left out of the MEB and no attempt made to impute it
(as is sometimes the case in poverty line estimations) If the majority of households rent their dwellings it is advisable to
include mean rent expenditures in the MEB The trickier case is when the households in the population of interest are split
between a significant number of households living in owned or no-rent housing and a significant number paying rent ndash
here it is difficult to reflect shelter expenditures adequately in the MEB Simply using mean rent estimations in the MEB will
underestimate the need for the renters while overestimating it for those who own their housing or do not pay rent In this
case insofar as data allows one solution could be to impute rent expenditures for the non-renters by estimating the
would-be rental cost for the type of housing they live in Doing this typically requires a housing module in the household
survey that contains information on ownership and types and sizes of housing so rental equivalents can be computed and
imputed for the non-renters
20
Minimum Expenditure Baskets Guidance Note | December 2020
NON-FOOD EXPENDITURES ndashEXPENDITURES OF PARTICULAR INTEREST
$$
$
Box 9
Health expenditures can also be challenging to capture adequately in survey data as such expenditures are often irregular
in nature Bear in mind that health expenditures usually consist of payment for goods such as medicines and for services
such as visits to the doctor When analysing the expenditures and deciding how to include them in the MEB consider which
services may be provided free of charge and what households pay themselves and at what cost30
Care should be taken when it comes to the underreporting of expenditures and treatment of expenditures that are
irregular in nature Remember that the MEB should include all recurrent essential needs but it typically does not include
one-off expenditures ldquolumpy expendituresrdquo such as marriage expenditures or dowries or investments Expenditures
on durables (for instance the purchase of vehicles or large household appliances) are also not included (in national poverty
lines the rental value of the durables owned by households adjusted for depreciation is sometimes included31 however
this is not recommended for MEB calculations)
Household expenditures on savings taxes and debt repayment are not usually included in the MEB as these types of
expenditures do not reflect actual consumption
Tobacco and alcohol are often included in expenditure surveys While households may choose to spend money on these
items they can fairly be assumed to be non-essential and are generally not recommended for inclusion in the MEB
The ldquoquick fixrdquo if data is very limited If the expenditure
data has no or very insufficient data on non-food
expenditures a ldquoquick fixrdquo solution is to use the average
non-food expenditure share of total expenditures This can
often be obtained from external sources such as monitoring
reports or food security assessments This is then added
COUNTRYEXAMPLE
Table a Non-food basket ndash valuesCoxrsquos Bazar
Value in MEB (takaHHmonth)
Non-food group
Toiletries and cleaning
Clothes shoes and towels
Cooking equipment
Education
Fuel and electricity
Medical treatment
Household textiles and small repairs
Communication
Transport
Total non-food
461
521
25
134
775
447
57
274
295
2990
Figure a Non-food basket ndash distribution Coxrsquos Bazar
Note The MEB for Coxrsquos Bazar was calculated for
analytical purposes in the REVA II assessment
It is not the operational MEB for the district
9Communication
10Transport
2Householdtextiles and
small repairs
15Medical
treatment
26Fuel andelectricity
5Education
1Cooking
equipment
17Clothes shoes
and towels
15Toiletries
and cleaning
EXPENDITURE-BASED NON-FOOD REFERENCEBASKET EXAMPLE FROM COXrsquoS BAZAR
Box 10EG
to the cost of the food basket to arrive at the total MEB
However when using an additional data source analysts
should understand how the average share of non-food
expenditures has been calculated and what sample it has
been derived from as it may not reflect the consumption
patterns of the reference cohort
30 The WHO and Global Health Cluster guidance on health expenditures in the MEB has some useful insights into household health expenditures See WHO and Global Health Cluster ndash Cash Task Team 2020 31 Deaton and Zaidi 2002
21
Minimum Expenditure Baskets Guidance Note | December 2020
52 The rights-based approachIn humanitarian contexts ldquoessential needsrdquo have been
understood as referring to access to full rights as set out by
international humanitarian law and the Humanitarian Sphere
Standards The term ldquorights-based MEBrdquo is derived from
this understanding According to the operational guidance
on multipurpose cash grants32 international humanitarian
and human rights law protects the right of crisis-affected
persons to food33 drinking water soap clothing shelter and
lifesaving medical care Humanitarian Sphere Standards
builds on this definition and outlines minimum humanitarian
standards in the areas of food security and nutrition
shelter and settlement health and WASH (water supply
sanitation and hygiene)34 In some contexts residency or legal
documentation is also included Humanitarian standards
for education are outlined in the Education in Emergencies
Minimum Standards Handbook35
The rights-based approach entails defining a detailed list
of the food and non-food items that make up the MEB
reference basket and pricing them using current market
prices MEBs built by the Interagency Cash Working Group or
other interagency coordination forum are often constructed
following the rights-based approach with each sector or
cluster contributing to the needs in their respective sectors
In these cases WFP is usually responsible for defining the
food component of the MEB For both food and non-food
items the reference basket is typically produced or cross-
checked through focus group discussions with the population
of interest partners and key informants It is usually put
together based on the needs of an average-sized household
1 Establish the food basketTo construct the food basket for a rights-based MEB compile
a list of food items and their quantities The Sphere Standards
offer a useful starting point recommending a diet of 2100
kcal per person per day with 10ndash12 percent of daily energy
intake from protein and 17 percent from fats36 The food
basket should be adapted to local diets and preferences
2 Establish the non-food basketOnce the food basket has been established a non-food basket
should be added In the rights-based approach this is typically
done by quantifying needs by producing a list of items by
sector Some examples are found below
Shelter This is the cost of accommodation that meets
basic shelter needs and rights What this means in practice
will depend on the context driven for example by weather
conditions and what is realistically available to the population
Utilities These include the cost of basic utilities such as safe
drinking water and depending on the context electricity
Non-food items These reflect basic household needs
related to cooking clothing and hygiene plus other general
household items Cooking gasfuel or firewood is often
included In line with the definition of the MEB the list should
focus on recurrent needs In practice these non-food items
can look very different depending on the context 38
Services This includes the costs of accessing basic services
such as healthcare education transport and communication
Healthcare costs are often difficult to quantify since they
are inherently irregular large and unpredictable Typically
however only basic minimum needs are covered in the MEB
such as eg two visits per year to the doctor expenses for
critical events deliveries and medicines are sometimes also
included Note that even if a need is not covered by the MEB
it does not mean that these needs do not need to be met for
the population of interest Health can be an example of this
health needs are often better met through service provision
than purchased through the market and therefore may
be only partially reflected in the MEB However guidance
from WHO and the Global Health Cluster notes that people
tend to have some level of health expenditures even when
COUNTRYEXAMPLE
SHELTER IN THE MEBFOR SYRIAN REFUGEES
EG Box 11
For the Syrian refugee operation in Turkey the MEB
includes the costs of shelter that meets certain
standards such as a minimum of 35 m2 per
person access to a toilet and running water
32 UNHCR et al 2015 33 Defined as energy needs not considering full nutrient needs (protein vitamins minerals etc) 34 See the Sphere Standards Handbook 35 INEE 2010 36 Further recommendations on micronutrient requirements can be found in the Sphere Standards Handbook37 Hobbs 201638 For some refugee contexts the Office of the United Nations High Commissioner for Refugees (UNHCR) has lists of specific items which can be considered for the MEB
22
Minimum Expenditure Baskets Guidance Note | December 2020
policies are in place that require the free public provision of
health services39
Education costs usually cover school fees materials
uniforms and transport depending on what households
have to pay themselves and what is publicly available
Transport and communication needs are often defined as
the average transport and communication costs reported by
household surveys and then validated with the communities
COUNTRYEXAMPLE
EXAMPLE OF A RIGHTS-BASED MEBFOR NORTHEAST NIGERIA
Box 12EG
The northeast Nigeria cash working group designed a MEB for a household of seven people40 the resulting reference
basket is shown below
Sectorgroup
Item Quantity(7 pers HH)
Sectorgroup
Item Quantity(7 pers HH)
Cooking fuel
WASH
Cooking fuel
WASH
Transportation
Communication
Health
Education
Firewoodbriquette
charcoal
Water + vendor fee
Bathing soap
Laundry soap
Sanitary pads
Firewoodbriquette
charcoal
Water + vendor fee
Bathing soap
Laundry soap
Sanitary pads
Rides
Airtime 500 NGN
Average expense
Pen
Pencil
Notebook
1 bag
158 jerrycans
13 bars
3 bars
4 packs
1 bag
158 jerrycans
13 bars
3 bars
4 packs
10 rides
1
7 pers
3 pcs
3 pcs
3 pcs
Table a MEB example northeast Nigeria
27 kg
45 kg
135 kg
18 L
27 kg
18 kg
36 L
09 kg
144 kg
2 kg
2 kg
1 kg
05 kg
12pcs
1L
Food Rice
Maize
Beans
Palm oil
Groundnuts
Sugar
Vegetable oil
Salt
Onion
Non-leafy vegetables
Leafy vegetables
Fruits
Meats
Chicken eggs
Vinegar
communication needs can also be specified as the cost of a
SIM card with a certain amount of data or airtime
3 Price the reference basketWith the food and non-food reference baskets established
the list of items and quantities are now priced using updated
prices from markets relevant to the population of interest
The pricing should be done based on actual current market
prices This produces the final rights-based MEB
39 WHO and Global Health Cluster ndash Cash Task Team 2020 40 Cash Working Group Nigeria 2018
23
Minimum Expenditure Baskets Guidance Note | December 2020
MEB APPROACHES ndash CONSTRUCTION SUMMARYBox 13
HOW TO
Rights-based approach
Establish the food basket
Define a list of relevant and locally preferred and
available food items and their quantities The Sphere
Standards can be used as a reference
Establish the non-food basket
Define a list of essential non-food items relevant to the
population of interest and their quantities Services such
as education or transport can also be included The list is
usually put together sector by sector
Price the basket
Use current market prices for the food and non-food
items in the reference baskets to calculate the price of
the basket Use prices from markets relevant to the
population of interest
1
2
3
4
1
2
3
Expenditure-based approach
Prepare the expenditure data
Ensure the data is cleaned Compute expenditures by
combining cash and credit expenditures the value of
consumed own production and consumed assistance
for both food and non-food expenditures Compute
expenditures as per capita figures
Select the reference cohort
Identify households ldquojust able to meet their essential
needsrdquo using indicators such as FCS FCS-N housing or
others excluding households in extreme quantiles of
expenditure distribution or other criteria or
combination of criteria Check the sensitivity of the
results to the selection of reference cohort
Establish the food basket
Calculate mean (median) food expenditures by food
group or item Either stop here or ndash to obtain a refence
basket ndash estimate consumed quantities check the
calorie content of the resulting quantities and consider
scaling them to Sphere Standards Price the basket
using market prices or prices derived from the
household data
Establish the non-food basket
Calculate mean (median) non-food expenditures by
non-food group or item If item-level data and prices
are available it is possible to derive a non-food
reference basket using same methodology as for the
food basket otherwise the non-food basket will
comprise the expenditures at the group level If a
quick-fix solution is needed add the average household
non-food expenditure share to the food MEB
53 Summary and data needs for expenditurendashbased and rights-based approachesBox 13 summarizes the steps to follow in order to construct a
MEB using an expenditure-based or a rights-based approach
24
Minimum Expenditure Baskets Guidance Note | December 2020
Qualitative understanding
of essential needs for the
population of interest
Representative household
survey with detailed
expenditure module
List of ldquorights-basedrdquo needs
Price information
Focus group discussions with key informants or population
of interest
Literature review of existing information on the essential needs of
the population of interest
WFP essential needs assessment emergency food security
assessment or comprehensive food security and vulnerability
analysis or other representative pre-assistance baseline survey
National household budget surveys household income and
expenditure surveys living standard measurement surveys or
other large-scale household survey
Clusters Cash Working Group other interagency forum
Sectoral assessments other secondary information
Price data series covering the area of interest for relevant food
and non-food items and services from WFP (Dataviz41 has
up-to-date price information) or partners
Price indices from national statistical offices
Prices derived from household expenditure data where quantities
are also reported
Suggested sources Expe
ndit
urendash
base
d
Righ
tsndashb
ased
INFORMATION NEEDS AND SOURCESMEB APPROACHES
Box 14
HOW TO
Information need
TIP BOXWHAT IF DATA USINGA HOUSEHOLD ECONOMY APPROACH IS AVAILABLE
$Box 15
The household economy approach (HEA) developed by Save The Children is commonly used for analysing food security and
livelihoods It is based on understanding how households normally access income food and other itemsservices required
for survival established through a baseline analysis As part of the baseline the HEA defines livelihood zones where
households share similar strategies for obtaining food and income It also distinguishes households within these livelihood
zones in at least three (often four and sometimes more) wealth groups The HEA baseline quantifies the sources of food
and income and the expenditure patterns for each wealth group and livelihood zone
The information collected on expenditures can be used as a data source for calculating a MEB However due to the relative
nature of the wealth cut-off points used there is no set standard regarding which group should be the reference for the
MEB If HEA data is utilized it is important to understand how it was collected ndash the HEA is simply an analytical framework
not a set method of data collection Thus while HEAs are often conducted through qualitative methods (eg focus group
discussions) they may also be based on quantitative modules in household surveys The latter yields more rigorous
information however qualitative data can be used but should be cross-checked or triangulated with other sources
39 See VAM data portal at httpsdatavizvamwfporg
25
Minimum Expenditure Baskets Guidance Note | December 2020
54 Expenditure-based or rightsndashbased approach Pros and consThere are advantages and disadvantages to both types of
approach which should be kept in mind when constructing
the MEB
The expenditure-based approach has the advantage that it
directly reflects the actual demand of the population of interest
as it uses survey data to examine peoplersquos consumption
behaviour It is also fairly straightforward to carry out if good
survey data on the population is available One disadvantage is
that it can be difficult to put into practice when the population
of interest is generally poor (such as in a pre-assistance
refugee situation) because the number of households who can
constitute the reference cohort can be too small to analyse
Also care has to be taken when looking at expenditure patterns
only as the reference cohort may not always cover all of their
essential needs to a desired level (from a ldquorightsrdquo perspective)
For example the food patterns for those ldquojust able to meet
their essential needsrdquo may not always be very nutritionally
diverse as they are based purely on consumption behaviour42
In general the expenditure-based approach should not be applied
without good quality household expenditure data
TIP BOX ADVANTAGES AND DISADVANTAGES OFDIFFERENT APPROACHES TO ESTABLISHING MEBS
Box 16
Pros
Cons
Expenditure-based Rights-based
Straightforward to carry out if household data
is of good quality
Builds on actual consumption patterns of the
population of interest
Difficult to identify reference cohort if
everybody is poor
Survey data may not capture all essential needs
fully from a ldquorightsrdquo perspective
Survey data is not needed
Effective demand can be different from identified
needs leading to a MEB that does not reflect
actual demand and making comparison with
monitoring data tricky
Contains incentives to inflate sector-specific needs
The advantage of the rights-based approach is that
it can be used to construct a MEB without survey data
(although survey data is needed to monitor the MEB) One
disadvantage is that the effective demand of households
can look quite different from the basket that results from
this approach Another disadvantage is that particularly
when constructed in an interagency setting a rights-based
MEB can easily become an instrument for different partners
to compete for and secure funding There is a substantial
incentive to include excessively high sectoral needs if sector-
specific interventions are envisaged Finally if the MEB is
very detailed but the expenditure module in the household
surveys used to monitor peoplersquos expenditures against the
MEB is very crude comparison is difficult and therefore the
practical use of the MEB can be limited Many households
may fall below the MEB simply because of the discrepancy in
methods between the MEB and the monitoring data This is
similar to the issue previously discussed regarding the use of
national poverty lines
Box 16 summarizes the advantages and disadvantages of the
two approaches
42 A study conducted in Nepal showed that the food poverty line is well below the so-called ldquonutrient povertyrdquo line (see Geniez et al 2014)
26
Minimum Expenditure Baskets Guidance Note | December 2020
6 Arriving at a realistic and operationally relevant MEBRegardless of which processes and approaches are used to
construct the MEB it is crucial to arrive at a final result that
is a realistic picture of the cost of essential needs for the
population of interest rooted in actual consumption
behaviour This section looks at how approaches can be
combined to generate a hybrid MEB and how the result can be
ldquoreality checkedrdquo and validated
61 Combining approaches the hybrid MEBAs described in section 54 there are disadvantages to the
expenditure-based and the rights-based MEB approaches that
can affect the final MEB One way to overcome this challenge
may be to combine information from each approach in
a ldquohybridrdquo MEB This means making sure that the MEB is
consistent with the actual consumption behaviour of the
population of interest as found in expenditure data while
keeping the rights-based lens There is no one way to go about
this the method is subject to the availability of expenditure
data and other information on essential needs as well as the
objective of the MEB
When good quality expenditure data with a large enough
sample size is available for constructing the MEB it is good
practice to use the expenditure-based approach as a basis
for the analysis as far as possible If the expenditures of
the reference cohort are subsequently found not to reflect the
costs of covering certain essential needs for the population of
interest rights-based information should be used to reinforce
the MEB with a hybrid model If expenditure data is not
available and cannot be collected a rights-based MEB can be
constructed but should be cross-checked against any available
household-level information on consumption patterns
When starting with the construction ofan expenditure-based MEB
Did the household survey capture all essential needs or
are some not included in the data at all
If some needs are wholly overlooked consider using
rights-based information to capture them but ensure these
needs are actually in demand by the population of interest
and only missing because the survey did not capture them
Are the expenditures that are typically trickier to capture
well reflected and are the reference cohortrsquos expenditures
on them adequate from a rights-based perspective
For example if education expenditures are completely
inadequate for the reference cohort (and this is not because
the reference cohort selected is ldquotoo poorrdquo) consider using
rights-based information to capture them eg by using the
cost of school fees or school supplies like books or
uniforms
Be particularly careful with the inclusion of needs where the
supply of goods or services is far from adequate or may be
inexistent The MEB needs to ultimately reflect consumption
behaviour so adding goods or services that are not
available to the population of interest or not in demand
will lead to an unrealistic MEB
When starting with the construction ofrights-based MEB
Are the identified needs in line with the actual
consumption patterns of the population of interest
Check the reference baskets against any available
information on demand and consumption and adjust items
and quantities to reflect actual consumption patterns This
could be done using data on consumption shares by food
group and non-food group for example
Are there needs that people consider essential and choose
to spend resources on but are not captured by any sector
Check the reference baskets against any available
information on demand and consumption and adjust items
and quantities to reflect actual consumption patterns
The key to constructing a hybrid MEB lies in triangulating
information and asking the right questions during the
analysis When constructing a MEB consider the following
27
Minimum Expenditure Baskets Guidance Note | December 2020
Box 17 contains examples of hybrid MEBs constructed in different contexts
COUNTRYEXAMPLE
HYBRID MEBS IN URBAN SETTINGS IN KINSHASATHE DEMOCRATIC REPUBLIC OF THE CONGOAND FOR SYRIAN REFUGEES IN TURKEY
Box 17
For the MEB calculated as part of an urban assessment in Kinshasa43 a hybrid approach was chosen to deal with
hard-to-capture but essential expenditures such as health and education Health costs are often difficult to estimate as they
are not regular and when they do occur they often make up a large share of monthly expenditures The analysts decided to
estimate health costs through a rights-based approach instead of using expenditures from the survey Qualitative
information from key informants was used to define the cost of one doctorrsquos visit per year for each household member In
each commune the median cost was between CDF5000 and CDF6000 per visit this was represented in the MEB as
CDF500 per household member per month Over-the-counter medication was also included as part of health-related
expenditure through the addition of a per-capita expenditure of CDF1500 every two months sufficient for a course of
antimalarial drugs or antibiotics and simple medication such as painkillers or anti-inflammatory drugs
In Turkey expenditure and price data from different sources was used to assess update and adjust an existing
rights-based MEB44 for Syrian refugees living in the country A hybrid food basket was calculated using detailed information
on the consumption behaviour of Syrian refugees in Lebanon collected through itemized receipts from food assistance
e-cards The resulting food basket was triangulated with the less detailed information available from a household survey on
Syrian refugees in Turkey The results showed strong consistency between consumption behaviour of both groups
The resulting food reference basket for the MEB was then priced with official price statistics data and inserted into the
rights-based MEB Quantities of non-food items were kept as before but updated with current price data To ensure that
the MEB reflected consumption behaviour expenditure shares were triangulated with household data See table a
To value and update the MEB price data was required The official price statistics included higher quality items and brands
consumed more by the average Turkish population than by the poorer refugees To correct for this the difference between
the price of the MEB and the food expenditures of a non-poor cohort were assessed and a correction factor applied to
compensate for the overestimation of the updated MEB
Commodity
Table a Food reference basket ndash MEB for Syrian refugees in Turkey
Daily ration perperson in gram
Dailykilocalorie
Old referential food basketDaily ration perperson in gram
Dailykilocalorie
Revised Turkey food basket
150
200
50
20
30
40
20
8
30
30
5
0
0
0
0
540
684
186
29
65
137
0
28
116
265
0
0
0
0
0
100
50
0
70
0
50
30
50
50
25
5
250
50
30
5
Rice white medium grain
Bulghur wheat
Pasta
Egg whole chicken fresh
Poultry
Beans dried
Cucumber
Cheese canned
Sugar
Oil sunflower fortified
Salt iodised
Bread made from wheat
Yoghurt whole milk (leban)
Tomatoes red ripe
Tea black nutrients per 100ml of brewed tea
360
171
0
100
0
170
0
178
194
221
0
675
31
5
0
Total Kcal 2050 Total Kcal 2104
43 WFP et al 201844 WFP 2018
28
Minimum Expenditure Baskets Guidance Note | December 2020
62 Reality checks and validation with stakeholdersIn addition to asking the right questions of the data as
described in the previous section it is crucial to reality check
results when constructing the MEB This means understanding
whether the MEB provides a picture of the cost of living that
matches the reality on the ground
First of all it is important to check the MEB result with the
real circumstances of the population of interest Focus group
discussions andor key informant interviews can be held when
starting work on the MEB and after a result is obtained in
order to ensure that the MEB is a true reflection of needs and
priorities
The MEB figures can be compared with the national poverty
line ndash even if it is not advisable to use the poverty line directly
as the MEB it is good practice to check the MEB results against
it They can also be checked against any social assistance
transfer values provided in government programmes the
minimum wage or the casual labour rate or any other
information available about needs and cost of living For
instance if the MEB is much higher than what the wages
from one month of work for a typical household can buy
that could indicate that it needs adjustment and that some
of the analytical steps need to be revisited ndash as long as the
wage rate itself is reasonable The same goes for the poverty
line ndash if the two are very far apart it could be a sign that the
MEB analysis should be crosschecked Perhaps the reference
cohort was not adequately selected some sectoral needs were
overestimated or there is a large proportion of consumption of
own production has not been properly taken into account
Something that is often of particular interest is the nutritional
composition of the food part of the MEB As seen above MEB
construction typically starts from the Sphere requirement of
2100 kcalpersonday However since the MEB follows the
actual consumption behaviour of the population of interest
(especially when following an expenditure-based approach)
the resulting food basket reflects what households actually
eat which is not necessarily a nutrient adequate diet If the
basket is found to be very low in essential nutrients it could
be that the reference cohort was not well selected and a
wealthier cohort with a more balanced diet at the 2100 kcal
personday threshold might need to be identified45 However
selecting better-off households will not necessarily lead to a
more nutritionally balanced basket as food preferences are
influenced by a range of factors in addition to budget
Analytical tools to determine the cost of nutritious diets
include Cost of the Diet (CotD) developed by Save the Children
UK and used by WFP in the Fill the Nutrient Gap Analysis
CotD uses linear programming to establish the lowest cost
diet that can meet requirements for energy protein fat and
13 micronutrients for individuals in a population considering
age gender body weight physical activity level and whether
a woman is pregnant or breastfeeding CotD can be thought
of as the lowest cost of an optimal diet considering individual
requirements It is therefore useful in illustrating the needs
of vulnerable populations and their nutrient intake barriers
However it is important to keep in mind that a MEB food
basket may not deliver adequate nutrient intake when used
to set a transfer value for households even if aligned with
an optimal diet As noted above because of household
consumption choices and food allocation within households
having more money to spend may not necessarily lead
households to buy more nutritious food
MEBs should be first and foremost built on consumption
patterns that reflect actual behaviour A large difference in
cost between the MEB food basket and CoTD may hence
be driven by factors such as low availabilityhigh cost of
nutritious foods or household preferences The WFP technical
note on Fill the Nutrient Gap and minimum expenditure
baskets offers further insights into the complementarities
of the two analyses and how to use them on conjunction for
programming purposes46 When a MEB is operationalised
additional nutritional considerations could be necessary
It is important to check the MEB result with the real circumstances of the population of interest Focus group discussions andor key informant interviews can be held when starting work on the MEB and after a result is obtained in order to ensure that the MEB is a true reflection of needs and priorities
45 Note that the 2100 kcal Sphere Standard for daily diet is an estimate based on a population average Nutrient needs vary across the lifecycle It is also recommended that a food basket based on the 2100 kcal threshold should include a minimum of between four and five different food groups
46 Also see WFP 2020b
29
Minimum Expenditure Baskets Guidance Note | December 2020
COUNTRYEXAMPLE
TURKEY NON-FOODBASKET MEBCOMPOSITION VERSUSACTUAL CONSUMPTION
Box 18
In the original rights-based MEB constructed for the
Syrian refugee operation in Turkey 17 percent was
devoted to education expenditure The average
education expenditure share in the pre-assistance
expenditure data was under 2 percent with little
variation by household vulnerability status50 The
large expenditure share in the MEB reflects the
costs for transportation to schools in rural areas
where no buses are available and where the only
way for households to send children to school is to
hire private transport In order to provide for
childrenrsquos right to education the transport costs are
counted for in the MEB
Since the MEB was constructed to assure full access
to all rights the high education expenditure was
justified However a comparison of the theoretical
costs for basic needs as estimated by humanitarian
partners and the actual consumption choices of
households can reveal divergence Even if
households are assisted there is nothing to say that
they will actually start hiring private transport to get
their children to school ie the principal ldquoneedrdquo
identified by humanitarian actors will not necessary
translate into effective demand if the MEB is used as
a basis for transfer value calculations While an
important access problem has been identified other
complementary interventions will likely be needed
to address it
depending on the objective of a particular intervention and
the choices targeted households are likely to make regarding
food and nutrition once they receive a transfer Targeted
nutrition interventions may be needed such as providing
certain nutritious foods for specific groups (through in-kind
assistance or commodity vouchers) and social behavioural
change communication to nudge people towards making
better choices for health and nutrition47 Expenditure data can
be helpful to understand the consumption patterns of people
at different points of the wealth distribution Fill the Nutrient
Gap analysis also examines packages of blanket and targeted
household interventions to estimate the most cost-effective
way to address the nutrient requirements of different target
groups For further considerations including complementary
programming please consult the WFP interim guidance on
transfer values48
MEBs are often constructed in an interagency context such
as the Cash Working Group which helps facilitate dialogue
and validation from the beginning of the process However
sometimes not all clusters or key partners are engaged in such
forums which can limit the buy-in and understanding of the
MEB unless there is adequate consultation It is also essential
to consult government stakeholders and development
partners Endorsement by government counterparts could be
needed if there are existing government safety nets or policies
regarding minimum wages For example if the population of
interest for the MEB are refugees or IDPs and a transfer value
based on the MEB is higher than the social assistance provided
by the Government to the resident population this could be a
point of contention Development partners might also wonder
why a MEB is needed in addition to the national poverty line
Dialogue and validation of the final MEB with partners is
therefore vital49
47 The Fill the Nutrient Gap (FNG) analysis of which CotD is often part can help understand what programming might be needed and how interventions can be combined to improve dietary intake and reach food and nutrition objectives
48 WFP 2020c49 The Cash Learning Partnershiprsquos MEB Tip Sheet contains useful advice on the interagency processes around constructing a MEB Baizan and Klein 201950 Hobbs 2016 and WFP 2018
30
Minimum Expenditure Baskets Guidance Note | December 2020
Naturally the needs of a household increase with the size of
the household How can the different magnitude of needs
for households of different sizes be taken into account when
constructing the MEB
One simple approach is to calculate the per capita MEB
and simply scale it up for households of different sizes For
example if the MEB is constructed for a household of six and
equals USD 120 the per capita MEB would be USD 20 USD and
the MEB for a household of three people would be USD 60
However this proportional scaling ignores one important
factor while the needs of a household grow with each
additional member the increase may not be proportional
This is because some goods consumed within a household
such as food are ldquoprivateldquo in character ndash once a person has
consumed it no one else can consume the same ndash while other
goods such as housing are ldquocommonrdquo or ldquopublicrdquo meaning they
can be shared among household members Hence the needs
for housing space or electricity are not necessarily three times
higher for a household with three members than for a single-
person household This is called economies of scale Changes
in household composition can also influence how needs
grow with household size consider large households with
many children who do not have the same needs as adults
Economies of scale are particularly relevant in contexts where
shared goods constitute a major part of household essential
needs for example where rent payment is a large expense A
one-bedroom apartment may be necessary for a one-person
household but could also possibly house a family of three
who would then share the expenditure When in a context of
large economies of scale the MEB is adjusted to household
size by scaling up average per capita needs proportionally
to household size the resulting MEB will underestimate
the needs for small households and overestimate the
needs for large households by construction This is because
the per capita needs for small households are larger than
this simple scaling reflects This can have implications if the
per capita MEB is used to inform targeting or transfer value
calculations For instance if the needs of smaller households
are underestimated they are more likely to be miscategorized
as being able to meet their essential needs and might therefore
not receive the assistance they require
7 Accounting for household composition and economies of scale
Expenditures
Household sizeno economies of scale expenditures proportional to household sizeeconomies of scale expenditures non-proportional to household size
1 2 3 4 5 6 7 8 9 10
EXPENDITURES PER CAPITA
Figure 3 Economies of scale and expenditures per capita ndash illustration of the concept
31
Minimum Expenditure Baskets Guidance Note | December 2020
In other contexts economies of scale might be smaller
because of the higher relative importance of ldquoprivaterdquo goods
such as food and certain non-food items (for example soap)
or if shared costs such as shelter are not prominent How
household size is catered for in the MEB ultimately depends
on context and how needs are related to household size
Some suggested steps to account for economies of scale and
household composition are listed below
When examining how to account for different household
sizes in the MEB start by ascertaining whether economies
of scale exist and to which extent51 Figure 3 provides a
hypothetical illustration of two extreme cases no economies
of scale at all and strong economies of scale If there are no or
little economies of scale the per capita expenditures will be
very similar across household sizes while they will decrease
by household size if economies of scale are present52
Plotting per capita expenditures against household size
helps enable for this type of examinations It can be useful
to further disaggregate the analysis into different categories
(for instance food non-food or shelter expenditures per
capita) to understand which expenditures might be driving the
economies of scale if present
Box 19 illustrates two different country examples
expenditures by household size for Syrian refugees in
Lebanon and for vulnerable populations in Coxrsquos Bazar
Bangladesh In Lebanon where shelter plays an important
role household expenditures double only at a household size
of 5 and they triple at a household size of 11
COUNTRYEXAMPLE
ECONOMIES OF SCALE INLEBANON AND COXrsquoS BAZAR
Box 19
Figure a shows expenditures by household size compared to one-person households For Syrian refugees in Lebanon
average expenditure doubles only when the household size reaches five and it takes 11 members to triple the expenditures
of a one-person household The economies of scale are therefore large primarily due to the importance of shelter costs for
the refugees
In Coxrsquos Bazar in contrast total expenditures grow almost proportionally with household size (double at a two-person
household triple at a three-person household) Slight economies of scale can be seen for food For non-food expenditures
larger households even spent more per person From this data the economies of scale seem to be small
Figure a Increase in household expenditure by household size comparedto one-person households
Multiplicationfactor
Household sizeHousehold size
100
90
80
70
60
50
40
30
20
10
Coxrsquos Bazar (Bangladesh)Lebanon
1 2 3 4 5 6 7 8 9 10 11
Total Food Non-food
1 2 3 4 5 6 7 8 9 10 11
Note Figure based on authorsrsquo calculations Data from the Vulnerability Assessment of Syrian Refugees in Lebanon (VaSyr) 2017
and the Refugee influx Emergency Vulnerability Assessment (REVA II) 2019
51 Expenditure data is required to perform this analysis If no information on expenditure exists information on how needs change with household size can be collected through qualitative means such as focus group discussions or key informant interviews
52 Theoretically it is possible to also analyse expenditures by household composition but sample sizes rarely allow for such detailed disaggregation
32
Minimum Expenditure Baskets Guidance Note | December 2020
If the analysis reveals small economies of scale or none at all it is reasonable to use a per capita approach to scale up the MEB proportional to household size
Even for food strong economies of scale can be detected
which could be a result of large households being able to
buy food in bulk at a lower price However in Coxrsquos Bazar
where shelter and other shareable non-food goods are of less
importance household expenditures are close to proportional
to household size
If the analysis reveals small economies of scale or none at all
it is reasonable to use a per capita approach to scale up the
MEB proportional to household size If significant economies
of scale are present it is important to think about how to
take this into account when constructing the MEB Here are
some suggestions
One possible solution (in the expenditure-based
approach) is to disaggregate (or re-select see below)
the reference cohort for each household size sub-
sample and using the expenditures for each of these
cohorts construct specific MEBs for each household
size53 This approach takes into account economies of
scale by looking directly at the specific needs of different
size households but only reflects average differences
in household composition within each household size
The approach will most likely suffer from very small
sample sizes once analysis needs to be performed by
household size If this is the case household sizes could
be grouped into categories so that the analysis uses sub-
samples eg for household sizes 1ndash2 3ndash5 and 6ndash8 etc
or other groupings meaningful for the context When
following this approach bear in mind that if the reference
cohort is selected based on expenditure distribution
characteristics such as the removal of extreme deciles or
quintiles this procedure of removal of quintiles or deciles
needs to be repeated within each household size (or
household size group) Otherwise if there are economies
of scale for consumption there is a risk of skewing the
sample against the smallest and largest households
because their per-capita expenditures will be at the
extreme ends of the expenditure distribution
Another solution is to divide the MEB content into
ldquoprivaterdquo (non-shared) and ldquopublicrdquo (shared) consumption
For example food could be non-shared and rent and
fuel shared Examine the MEB expenditures for the
non-shared and shared goods for an average sized
household (or for household sizes around the average
for instance 4ndash6 members in order to leverage a larger
share of the sample) The non-shared value can then be
scaled proportionally to household size while the shared
value is held constant across household sizes This way
the resulting MEB consists of a lsquoflatrsquo and a proportional
element54 This is a relatively crude but intuitive way to
approximate economies of scale Figure 4 provides a
simple illustration of this approach
In the literature on poverty the most common solution
used to adjust for economies of scale and difference
in household composition is to use adult equivalents
instead of per capita numbers These equivalence scales
assign an ldquoadult equivalent numberrdquo to each household
depending on its size and composition taking into
account economies of scale as well as the different needs
of children and adults ie household composition For
example the first adult in the household is counted
as 1 and each additional adult as for example 07 A
child under 15 is counted as a fraction of an adult (eg
05) The effective adult equivalent household size is
then the sum of these adult-equivalent fractions55 Next
total household expenditures are divided by the adult
equivalent household size The MEB is then calculated
using these adjusted per-adult-equivalent expenditures
While this is not necessarily a complicated approach
from an analytical point of view equivalence scales can
53 See Lanjouw (1998) on the construction of poverty lines specific to household size (and composition)53 Alternatively the flat element can also be lsquosemi-flatrsquo and set according to household size groups ndashby examining shared costs and applying the same flat value within eg household size groups 1-2 3-5 6-8 or other
groupings as dictated by the context 53 One common equivalence scale is the OECD scale it assigns the weight 1 to the household head 07 to all additional adults and 05 to all children A household with five people say two adults and three children
consists of 32 adult equivalents (1+07+05+05+05) This is a common scale used in many developing and developed countries Another common scale is to give weight 1 to each adult and different weights to children depending on their age For the official poverty line in Zambia the following weights are given to children 0ndash3 years 036 4ndash6 years 062 7ndash9 years 076 and 10ndash12 years 078
33
Minimum Expenditure Baskets Guidance Note | December 2020
MEB - COMBINING FLAT ANDPROPORTIONAL ELEMENTS -ILLUSTRATION
MEB value
Household size
1 2 3 4 5 6 7 8 9
140
120
100
80
60
40
20
0
Proportional element - non-shared part of MEB
Flat element - shared part of MEB
MEB value per capita
Figure 4 Combining flat and proportional elements in the MEB
prove challenging when operationalising the MEB If
equivalence scales are used in constructing the MEB they
will also need to be applied when measuring household
expenditures compared with the MEB for gap analysis
against the MEB and in monitoring Translating the
concept of equivalence scaling into operational decision
making may therefore prove tricky Additionally results
can be quite sensitive to the choice of equivalence scales
so selecting appropriate scales is important yet often not
straightforward and a range of different scales exist56 In
some countries country-specific equivalence scales may
have been devised for the purpose of the calculation of
the national poverty line
No matter the approach the recommendation is always
to leverage data analysis as much as possible in order
to understand how needs evolve with household size
(and possibly composition) while keeping in mind that
the final MEB needs to be operationally relevant
Particularly in the (common) cases where MEBs are
used to calculate household transfer values it is worth
considering what level of analytical granularity can
feasibly be turned into programmatic action In some
cases it may not be operationally possible to handle
different per-capita size transfers for differently sized
households and the extra effort of achieving accurate
MEB figures by household size may not be worth it
The same general recommendation as for all aspects
of MEB construction also applies here the final result
should be realistic a fair depiction of needs and an
operationally relevant product
56 See for instance httpwwwoecdorgeconomygrowthOECD-Note-EquivalenceScalespdf
34
Minimum Expenditure Baskets Guidance Note | December 2020
A SMEB can be expenditure-based or rights-based or a hybrid of the two approaches depending on data availability and programmatic requirements
The SMEB is the absolute minimum amount required to maintain existence and cover lifesaving needs which could involve the deprivation of certain human rights
A survival minimum expenditure basket (SMEB) is often
constructed alongside a MEB While the MEB is defined as
what a household requires in order to meet their essential
needs on a regular or seasonal basis and its average cost the
SMEB is the absolute minimum amount required to maintain
existence and cover lifesaving needs which could involve the
deprivation of certain human rights However the concepts
of SMEB and MEB have not always been used consistently
by the humanitarian community and are sometimes used
interchangeably It is therefore important to be clear from the
outset of the analysis whether a MEB or a SMEB is the goal
A SMEB can serve at least two purposes First together with
the MEB it can be used to classify households into different
categories of economic capacity to meet their needs whereby
households whose expenditures fall below the SMEB have
highly insufficient economic capacity households between the
SMEB and the MEB have insufficient economic capacity and
households above the MEB have sufficient economic capacity
This information can then be used for profiling people in need
prioritizing beneficiaries or monitoring Second the SMEB
can inform programmatic decisions such as transfer values in
situations where immediate lifesaving assistance is required
The approaches presented here follow the MEB methods
adjusted to suit the different purpose of the SMEB
Accordingly a SMEB can be expenditure-based or rights-
based or a hybrid of the two approaches depending on data
availability and programmatic requirements
8 How to construct a SMEBExpenditure-based approach toconstructing a SMEBThe calculation of an expenditure-based SMEB is closely aligned
with the literature on how to estimate national poverty lines
While the MEB corresponds to an ldquoupperrdquo poverty line a ldquolowerrdquo
extreme or austere poverty line is often defined by taking the
food part of a MEB and adding this to the non-food needs
regarded as the essential minimum for household survival57
But how are survival non-food needs defined based on
expenditure data When people receive assistance it is
sometimes observed that households sell part of their food
rations to cover some non-food items These households forgo
some of the required food intake in order to cover what they
regard as survival non-food needs Using expenditure data to
construct a SMEB a similar idea is explored to calculate the
SMEB analysts identify those households whose total food AND
non-food expenditures are approximately equal to the MEB food
basket amount only In order to access non-food items these
households will compromise their food intake to some extent
because their total expenditures would only be enough to cover
their essential food requirements ie the food MEB anything
spent on non-food items means that they are not meeting their
essential food requirements It is therefore fair to assume that
the amount they choose to spend on non-food items must
be regarded by the households as absolutely necessary The
non-food expenditures of these households can therefore be
considered as the survival non-food needs The SMEB is then
calculated by adding these survival non-food expenditures
to the food MEB This SMEB allows households to meet their
essential food needs and their survival non-food consumption
Note that this approach requires a food MEB figure (either
already available or calculated as part of the SMEB analysis)
57 See Lanjouw 1998 and Haughton and Khandker 2009
35
Minimum Expenditure Baskets Guidance Note | December 2020
The steps for constructing an expenditure-based SMEB are
similar to those taken to construct a MEB with the following
additional considerations
1 Prepare expenditure data the expenditure data source can
be the same as that used for the MEB
2 Select the reference cohort this step is different The cohort
is selected by computing total household expenditures
and comparing them to the food MEB Households with
total expenditures equal to (or in an interval around) the
food MEB are selected as the SMEB reference cohort
3 Establish food basket and 4) Establish non-food basket
Using the SMEB reference cohort start by examining
how much these households spend on non-food items
Add this value to the MEB food value to arrive at the total
value of the SMEB To establish a food and non-food
basket there are two options i) use the MEB food basket
as the SMEB food basket and the non-food expenditures
of the SMEB reference cohort as the non-food basket
or ii) look at a third cohort of households namely those
whose total expenditures are around the just established
total SMEB level examine their food and non-food
expenditures and unpack those into food and non-food
baskets While both options will provide the same overall
value of the SMEB they will differ in composition and the
share of foodnon-food expenditures
Annex 2 provides an illustration of this method of constructing
a SMEB
Rights-based approach to constructing a SMEBThe rights-based approach to constructing a SMEB closely
follows the rights-based approach to constructing a MEB The
main difference is that needs and the items and quantities
included should be restricted to what is regarded as absolutely
necessary for survival ndash which can be challenging to define
This applies to both the food basket and the non-food
basket The MEB can be a starting point if there is one or
the Sphere Standards Sometimes rights-based SMEBs have
been constructed based on a MEB but with lower quantities
for certain items or by keeping some needs while removing
others
Hybrid SMEBs and reality checking resultsAs with MEBs it can be advantageous to combine the
expenditure-based and rights-based approaches to create
a hybrid SMEB The guiding principles are the same as for
the MEB with the difference that the resulting SMEB should
continue to contain nothing but the minimum required for
survival
The same logic applies to the ldquoreality checkrdquo of the SMEB
results as for the MEB it is crucial to ensure that the end
result is realistic and operationally relevant bearing in mind
the conceptual difference between the MEB and the SMEB It
is important to consult the population of interest as much as
possible to understand their views on what constitutes the
bare minimum needed by households to maintain existence
and cover lifesaving needs
COUNTRYEXAMPLE
RIGHTS-BASED SMEBS Box 20
In Lebanon health and education are excluded
from the rights-based SMEB while other needs are
covered with smaller amounts than in the MEB For
example the SMEB has a less diverse food basket
than the MEB58
In Syria the SMEB developed for the northern part
of the country includes food kerosene hygiene
products water and a small amount to cover other
survival goods Rent and utilities are not covered59
58 El Koury and Hajal 201659 Cash Based Responses Technical Working Group Syria 2014
36
Minimum Expenditure Baskets Guidance Note | December 2020
COUNTRYEXAMPLE
HYBRID SMEBs Box 21
For the MEB review in Lebanon for Syrian refugees60 a hybrid SMEB approach was chosen First an expenditure-based
SMEB was used calculating the non-food expenditures of households whose total expenditures equalled the food MEB
and adding this to the food MEB This resulted in very low expenditures on shelter (SMEB A) Due to the importance of
shelter in urban settings a second hybrid version was established calculating the non-food expenditures of households
whose total expenditures equalled the sum of the food MEB plus a rights-based value of a tent as survival shelter the cost
of which came from a rights-based SMEB (SMEB B)
Cohort HH size 4ndash6quint 2ndash4 acceptable FCS
n=923
Cohort total expenditure= food MEB
n=923210
Cohort total expenditure= food MEB + tent value
n=923210
SMEB Afood + survivalnon-food
Hybrid SMEB
437
83
40
93
20
16
29
19
314
1033
437
43
18
37
06
04
17
60
621
437
47
24
42
11
06
20
162
750
Food
Utilities (water gas fuel electricity)
Non-food items (hygiene clothing)
Health
Education
Transport
Communication
Other expenditures
Shelter
Total (USD)
Table a Hybrid SMEB for Syrian refugees
SMEB Bfood + survivalnon-food amp tent
In the Kinshasa urban assessment61 a SMEB was established in addition to the MEB comprising a basket of the most
essential items based on expenditure data used for the MEB For the food SMEB a less diverse diet was established by
excluding certain food items from the food MEB and rescaling the resulting basket to 2100 kcal For the non-food
component the only items included were those that were seen as critical to attaining the most basic standards for safety
food preparation water sanitation and hygiene These consisted of water cooking fuel hygiene products and lighting The
value for these items in the SMEB was derived from the median expenditures of the non-poor cohort
Expenditure-basedMEB
Expenditure-basedSMEB
60 Hohfeld et al 2020 61 WFP et al 2018
37
Minimum Expenditure Baskets Guidance Note | December 2020
91 Adjustment for seasonal or regional price differencesIf the MEB will only be used in one area where prices are
relatively homogenous it is often not necessary to adjust for
regional price differences However if the MEB is intended
for use across different urbanperi-urban andor rural
areas throughout the country it could be vital to adjust for
differences This means that the MEB can be priced differently
for different regions or rural or urbanperi-urban areas (or any
other division of areas that makes sense in relation to price
behaviour) There are a few approaches for this
Price the MEB based on available price data for different
regions or urbanrural areas For the food reference
basket this is most often possible using WFP food prices
or other similar price time series For non-food items
including housing utilities and services this can be more
challenging and may rely on price data collection by
different partners or require new data collection
For some countries price data provided by the national
statistical office is useful In the case of Turkey regional
purchasing power parity indices were used to provide
price estimates for components of the MEB for which
direct price information was not available
Use approximations from expenditure data If the
household survey has sufficient regional coverage the
expenditure levels in different regions can be explored
using the cohort of households just above the poverty
line Care should be taken in using this method
particularly if the sample size by region is very small
9 Additional considerations when constructing MEBs
92 Needs that vary by season or areaIn many countries where WFP works household needs change
with the seasons For instance in Turkey where winters are
cold households have additional needs for heating and warm
clothes to survive In other contexts there are significant
differences in needs between lean and rainy seasons These
changing needs could be a reason to construct different MEB
reference baskets to use at different times during the year or
to design seasonal top-ups In the case of items needed for cold
winters this is often referred to as ldquowinterizationrdquo
While this does not influence the approach used to construct
the MEB it does mean that analysts need to consider when
the data used in its construction was collected and whether
this influences the resulting MEB These considerations also
matter when using the MEB for monitoring if a monitoring
expenditure survey is used to analyse whether peoplersquos
expenditures are above or below the MEB threshold but
the survey is undertaken when prices are high or when
winters are cold if the MEB is not adjusted the results will
probably show a decrease in the percentage of people whose
expenditures are below the MEB as households have higher
needs andor are confronted with higher prices and thus
have higher expenditures without in reality being better off
In Turkey it was estimated that household needs during the
winter would result in a 48 percent increase in minimum
expenditures
In other cases different baskets might be necessary
for different areas of the country eg rural and urban
areas While the MEB should be constructed for a relatively
homogenous population it may sometimes be desirable to
construct a MEB covering all or most of a country where
consumption patterns vary substantially In this case it is
worth considering whether (some elements of) the MEB should
be different between areas Again the selected approach to
construct the MEB should not change but analysts need to
check where the data used in its construction was collected
and whether consumption patterns are very different between
different regionsareas For example in the case of Somalia
the main cereal consumed varies significantly between the
north and the south of the country so the MEB uses different
main cereals in the food reference basket according to region
While the MEB should be constructed for a relatively homogenous population it may sometimes be desirable to construct a MEB covering all or most of a country where consumption patterns vary substantially
38
Minimum Expenditure Baskets Guidance Note | December 2020
Constructing a MEB can be challenging in a sudden onset
emergency or if data is scarce or unavailable Below are some
ideas on how this can be resolved However from a ldquodo no
harmrdquo perspective it is important to emphasize that proxies
should only be used in the interim when no other solutions are
available
Use the national MEB or MEB reference basket If survey
data is not directly available and if the population of
interest is part of and similar to the overall population of
the country the national MEB or MEB reference basket
used for the national poverty line can be used if available
Bear in mind however that this basket should be used on
the condition that it corresponds to data that WFP collects
or has access to through partners or the Government to
ensure that monitoring can be conducted against the MEB
In its most basic form a MEB essentially only requires an
approximate value for the food basket and an estimate
of the average expenditure share that households use
on food Even if no relevant survey data is available this
information should be available to a country office or can
rapidly be collected or approximated
Consider using the minimum wage as a proxy Bear in
mind that while the MEB captures household-level needs
the minimum wage is individual-level income so an
assessment of how many minimum wages are needed per
household depending on the household size is required
It is also advisable to find out how the minimum wage has
been constructed
Ultimately a MEB is a good preparedness measure and should
be constructed before an emergency While both prices and
availability will be affected by an emergency it is still likely to
provide a useful starting point
11 Monitoring and updating the MEB111 Monitoring the cost of the MEBTo be operationally useful the MEB must be tracked and
updated over time to account for price changes If inflation is
high this might have to be done every month if it is low as
little as once a year could be sufficient This should be planned
for when the MEB is constructed to ensure that the costs of the
MEB components can be updated
There are different ways to update the MEB with price changes
If a reference basket is adequately defined (for food
and for non-food items) and prices are collected for the
individual items in the basket by WFP or its partners the
MEB can be priced anew using the updated prices for
each item and multiplying them by the quantities in the
reference basket
A simple solution is to adjust the MEB using the
nationalsub-national CPI or its components This
simply involves updating the cost of the MEB with
the increase (or decrease) in the CPI for the period
in question However in some contexts CPIs are not
updated or relevant for the target population Urban
areas are often over-represented in the national CPI on
the other hand prices and costs faced by for example
displaced populations can be very different from national
price levels In contexts of poverty where food constitutes
a large part of household expenditures the evolution of
food and fuel prices is central when it comes to capturing
price changes
If a CPI does not exist or is not considered applicable
a price index for key consumption items can be
constructed using price data collection for food items
and basic non-food items conducted by WFP andor
other agencies this can then be used to update the cost
of the MEB In contexts where shelter is a major part of
household expenditures changes in shelter costs should
also be captured
10 How to find a proxy for a MEB when data or time is insufficient
39
Minimum Expenditure Baskets Guidance Note | December 2020
112 When to construct a new MEBThe composition of MEB reflects consumption patterns
It is recommended as much as possible keeping the MEB
composition constant and only monitor how cost changes
over time However when there is reason to believe that
consumption patterns of the population for whom the MEB
is constructed has significantly changed it is time to review
its composition and possibly reconstruct the MEB to reflect
these changes
What could suggest such consumption changes have
occurred The figure to the right summarises some typical
events that could result in a significant change in household
consumption Shocks eg a natural disaster might create
additional needs if livelihoods are disrupted or living
conditions are altered Significant changes to the prices of
key consumption items can also alter consumption pattens
insofar it pushes households to substitute certain items
for other items (be aware however that reconstructing
the MEB would only be advisable if the substitution is not
just temporary) Population changes such as an influx of
displaced people or other events that changes the population Figure 5 Possible triggers for MEB composition review
Has a shock occured creating
different or additional needs
Have costs changed significantly
between key consumption items so
that households have substituted
consumption patterns
Has there been a change in
population - eg a displacement
Has the supply side or service
provision changed leading to a
change in household consumption
Shock
Substitution
Population
Supply
composition in the area that the MEB is constructed for
could also lead to a review Finally if supply of essential
goods and services changes this may also shift household
consumption eg if health services are made free of charge
and no longer require households to pay for them
40
Minimum Expenditure Baskets Guidance Note | December 2020
CaLP The Cash Learning Partnership
CBT cash-based transfers
CotD Cost of the Diet [approach]
CPI consumer price index
FCN-N food consumption score ndash nutrition
FCS food consumption score
FNG Fill the Nutrient Gap
HEA household economy approach
LSMS Living standard measurement survey
MEB minimum expenditure basket
OCHA United Nations Office for the Coordination of Humanitarian Affairs
REVA II 2019 Refugee Influx Emergency Vulnerability Analysis
SDG Sustainable Development Goal
SMEB survival minimum expenditure basket
UNHCR Office of the United Nations High Commissioner for Refugees
VAM Vulnerability Analysis and Mapping
WFP World Food Programme
WHO World Health Organization
Abbreviations
41
Minimum Expenditure Baskets Guidance Note | December 2020
Deaton and Grosh 2000 ldquoConsumptionrdquo in Designing Household Survey Questionnaires for Developing Countries Lessons from Ten
Year of LSMS Experience httpsscholarprincetonedudeatonpublicationsconsumption
Deaton and Zaidi 2002 Guidelines for Constructing Consumption Aggregates for Welfare Analysis LSMS Working Paper no 135
httpsopenknowledgeworldbankorghandle1098614101
The Cash Learning Partnership (CaLP) Glossary of terminology for cash and voucher assistance
httpswwwcalpnetworkorglearning-toolsglossary-of-terms
Cash Based Responses Technical Working Group Syria 2014 Northern Syria Survival Minimum Expenditure Basket Guidance
Document httpswwwhumanitarianresponseinfositeswwwhumanitarianresponseinfofilesdocumentsfilesnorthern_
syria_smeb_guidance_document_dec_2014pdf
Cash Working Group Nigeria 2018 Minimum Expenditure Basket for North East Nigeria ndash Justification and recommendations Draft
report httpswwwhumanitarianresponseinfositeswwwhumanitarianresponseinfofilesdocumentsfilesmeb_justification_
guidelinespdf
Baizan and Klein 2019 Minimum Expenditure Basket (MEB) Decision Making Tools The Cash Learning Partnership httpswww
calpnetworkorgpublicationminimum-expenditure-basket-meb-decision-making-tools-2
El Koury and Hajal 2016 MEB and SMEB revision Community Consultation Lebanon Cash Consortium httpsreliefwebintsites
reliefwebintfilesresourcessmeb-fgd-report-final-1pdf
Geniez Mathiassen de Pee Grede and Rose 2014 ldquoIntegrating food poverty and minimum cost diet methods into a single
framework A case study using a Nepalese household expenditure surveyrdquo in Food and Nutrition Bulletin vol 35 no 2 https
journalssagepubcomdoi101177156482651403500201
Haughton and Khandker 2009 Handbook on Inequality and Poverty The World Bank httpsopenknowledgeworldbankorg
handle1098611985
Hobbs 2016 MEBSMEB calculation for Syrians living in Turkey Report commissioned by the Cash-Based Interventions Technical
Working Group in Turkey httpsdata2unhcrorgendocumentsdownload57031
Hohfeld Papavero Sandstrom Dalbai and Renk 2020 Minimum Expenditure Basket for Syrian Refugees in Lebanon ndash Rights-based
versus Expenditure Based Approaches WFP httpsreliefwebintsitesreliefwebintfilesresources76229pdf
Inter-Agency Network for Education in Emergencies (INEE) Minimum Standards for Education Handbook Preparedness Response
Recovery httpsineeorgstandards
Jolliff and Prydz 2016 Estimating International Poverty Lines from Comparable National Thresholds World Bank Policy Research
Paper 7606 httpsopenknowledgeworldbankorgbitstreamhandle1098624148Estimating0int00national0thresholdspdf
Lanjouw 1998 Demystifying Poverty Lines World Bank
Ravallion 1994 ldquoPoverty Comparisonsrdquo in Fundamentals of Pure and Applied Economics 56
Republic of Zambia Central Statistical Office 2016 2015 Living Conditions Monitoring Survey (LCMS) Report httpswwwzamstats
govzmphocadownloadLiving_Conditions201520Living20Conditions20Monitoring20Survey20Reportpdf
Save the Children UK 2018 Basic Needs Assessment Guidance and Toolbox Part I Background and Concepts httpsreliefwebint
reportworldbasic-needs-assessment-guidance-and-toolbox
Sphere Standards Handbook Humanitarian Charter and Minimum Standards in Humanitarian Response 2018 edition httpswww
spherestandardsorghandbook
UNHCR CaLP Danish Refugee Council OCHA Oxfam Save the Children and WFP 2015 Operational Guidance and Toolkit for
Multipurpose Cash Grants httpswwwcalpnetworkorgwp-contentuploads202001operational-guidance-and-toolkit-for-
multipurpose-cash-grants-webpdf
References
42
Minimum Expenditure Baskets Guidance Note | December 2020
WFP 2004 Sampling Guidelines for Vulnerability Analysis Thematic guidance httpsdocumentswfporgstellentgroupspublic
documentsmanual_guide_procedwfp197270pdf
WFP 2008 Food Consumption Analysis Calculation and use of the Food Consumption Score in food security analysis https
documentswfporgstellentgroupspublicdocumentsmanual_guide_procedwfp197216pdf
WFP 2015 Food Consumption Score Nutritional Analysis (FCS-N) Guidelines httpswwwwfporgpublicationsfood-consumption-
score-nutritional-quality-analysis-fcs-n-technical-guidance-note
WFP 2018 Revising the Food Basket and Minimum Expenditure Basket Analysis to calculate a realistic cost of living for refugees in
Turkey httpsreliefwebintreportturkeyrevising-food-basket-minimum-expenditure-basket-analysis-calculate-realistic-cost
WFP 2019 Refugee influx Emergency Vulnerability Assessment ndash Coxrsquos Bazar Bangladesh httpsreliefwebintsitesreliefwebintfiles
resourcesWFP-0000106095pdf
WFP 2020a Essential Needs Assessment Guidance note httpswwwwfporgpublicationsessential-needs-guidelines-july-2018
WFP 2020b Technical Note Fill the Nutrient Gap and Minimum Expenditure Basket An explanation of approaches and identification of
synergies httpsdocswfporgapidocumentsWFP-0000116644download
WFP 2020c Setting the transfer value for CBT interventions Transfer Value Interim Guidance httpsdocswfporgapi
documentsWFP-0000117963download
WFP global Food Security Cluster and Food Security Cluster for the Democratic Republic of the Congo 2018 Adapting to an Urban
World Urban Essential Needs Assessment in the five communes of Kimbanseke Kinsenso Makala Nrsquosele and Selambao (Kinshasa)
httpswwwwfporgpublicationsdemocratic-republic-congo-urban-essential-needs-assessment-five-communes-kimbanseke-
kinsenso
World Health Organisation and Global Health Cluster ndash Cash Task Team 2020 Technical Note on the Inclusion of Health
Expenditures in the Minimum Expenditure Basket and Subsequent Multi-purpose Cash Transfer httpswwwcalpnetworkorg
publicationinclusion-of-health-expenditures-in-the-meb
43
Minimum Expenditure Baskets Guidance Note | December 2020
Survivalnon-foodexpenditure
TOTALEXPENDITURE
FOODEXPENDITURE
MEBnon-foodexpenditure
EXPE
ND
ITU
RE
CONSUMPTION
SMEBAusterepoverty line
Essential foodneeds (MEB)
Acceptable food consumption(based on FCS)
Food expenditure for HHwith tot exp at essential
food needs (MEB)
Analysts should always ensure that the expenditure data is properly cleaned and outliers removed and that it is converted into
the same recall period (food and non-food items usually have different recall periods)
Expenditures should be calculated into per capita figures (eg by dividing total household expenditures by household size) in
order to make them immediately comparable across households (or per adult equivalent see section 7 on how to account for
economies of scale and household composition)
Before starting the MEB analysis it is highly recommended to carry out some simple descriptive analysis of the expenditure
data in order to understand it Analyse the mean and median expenditures for the sample This will help understand the
distribution of the expenditures and detect possible issues While the median is more robust to outliers if a large part of the
sample has 0 expenditures on a particular item the median could be 0 and may therefore not be the best estimate of the need
In this case the mean may be preferable A frequency analysis of non-zero expenditures by groupitem can also be helpful in
understanding whether certain expenditures are infrequent or lumpy
Annex 1 - Good practice when analysing expenditure data
Figure based on Lanjouw 1998 Demystifying poverty lines and World Bank and Ravallion 1994 ldquoPoverty comparisonsrdquo in
Fundamentals of Pure and Applied Economics 56
Annex 2 - The expenditure-based SMEB ndash an illustration
Minimum expenditure baskets
copy December 2020 World Food Programme (WFP)
Research Assessment and Monitoring Division
All rights are reserved Reproduction is authorized except for
commercial purposes provided that WFP is acknowledged as
the original source
United Nations World Food Programme
Via Cesare Giulio Viola 6870 Parco dersquo Medici
00148 Rome ndash Italy
Arif Husain
Chief Economist and Director
Research Assessment and Monitoring Division
Tel + 39 06 6513 2014 ndash e-mail arifhusainwfporg
Yvonne Forsen
Chief
Research Assessment and Monitoring Division
e-mail yvonneforsenwfporg
Susanna Sandstrom
Regional CBT Advisor
Regional Bureau for East Africa
e-mail susannasandstromwfporg
Lena Hohfeld
Needs Assessment and Targeting Unit (RAMAN)
Research Assessment and Monitoring Division
e-mail lenahohfeldwfporg
Nynne Warring
Economic and Market Analysis Unit (RAMAE)
Research Assessment and Monitoring Division
e-mail nynnewarringwfporg
ii
The essential needs analysis workstream
This guidance note is part of a package of essential needs
analysis guidance WFPrsquos essential needs analysis workstream
is a collaboration between the Research Assessment and
Monitoring (RAM) Divsion and the Cash-Based Transfers (CBT)
Division of WFP
To provide feedback on this guidance note contact any of
the authors or write to the RAM or CBT Divsions in WFP
headquarters
wfpvaminfowfporg and cbtglobalsupportwfporg
Acknowledgements
This guidance has greatly benefitted from inputs from
colleagues in various functions field-based and in
headquarters In particular experts in the WFP Research
Assessment and Monitoring (RAM) Divsion the Cash-Based
Transfers (CBT) and Nutrition Divisions have provided
invaluable feedback on earlier drafts of this document Field-
based practitioners around the world are continuing to build
experiences constructing minimum expendiures baskets for
a variety on contexts and operations We are immensively
thankful to colleagues and partners that have shared their
experiences and best practices with us to inform this guidance
and its applications
iii
Minimum Expenditure Baskets Guidance Note | December 2020
Table of contentsPreface ndash the essential needs approach 1
About this guidance note 5
1 What is a minimum expenditure basket 5
2 Why have a MEB 6
3 How to construct a MEB standard steps 7
4 Before starting the analysis 8
5 Constructing a MEB expenditure-based and rights-based approaches 10
51 The expenditure-based approach 10
52 The rights-based approach 21
53 Summary and data needs for expenditure and rights-based approaches 23
54 Expenditure-based or rights-based approach Pros and cons 25
6 Arriving at a realistic and operationally relevant MEB 26
61 Combining approaches the hybrid MEB 26
62 Reality checks and validation with stakeholders 28
7 Accounting for household composition and economies of scale 30
8 How to construct a SMEB 34
9 Additional considerations when constructing MEBs 37
91 Adjustment for seasonal or regional price differences 37
92 Needs that vary by season or area 37
10 How to find a proxy for a MEB when data or time is insufficient 38
11 Monitoring and updating the MEB 38
111 Monitoring the cost of the MEB 38
112 When to construct a new MEB 39
Abbreviations 40
References 41
Annex 1 ndash Good practice when analysing expenditure data 43
Annex 2 ndash The expenditure-based SMEB ndash an illustration 43
iv
Minimum Expenditure Baskets Guidance Note | December 2020
List of boxesBox 1 The MEB to-do list 7
Box 2 Examples of national poverty lines 9
Box 3 Expenditure data in MEB calculations ndash constructing a light ldquoconsumption aggregaterdquo 11
Box 4 Reference cohort selection 13
Box 5 Selecting and checking the reference cohort Chad Syrian refugees in Lebanon and Coxrsquos Bazar 14
Box 6 Approximating a food basket with group-level food expenditures 16
Box 7 Kinshasa food reference basket using food group expenditures 17
Box 8 Coxrsquos Bazar food reference basket with detailed expenditure and quantity data 18
Box 9 Non-food expenditures ndash expenditures of particular interest 19
Box 10 Expenditure-based non-food reference basket example from Coxrsquos Bazar 20
Box 11 Shelter in the MEB for Syrian refugees 21
Box 12 Example of a rights-based MEB for northeast Nigeria 22
Box 13 MEB approaches ndash construction summary 23
Box 14 Information needs and sources MEB approaches 24
Box 15 What if data using a household economy approach is available 24
Box 16 Advantages and disadvantages of different approaches to establishing MEBs 25
Box 17 Hybrid MEBs in urban settings in Kinshasa the Democratic Republic of the Congo and for Syrian refugees in Turkey 27
Box 18 Turkey non-food basket MEB composition versus actual consumption 29
Box 19 Economies of scale in Lebanon and Coxrsquos Bazar 31
Box 20 Rights-based SMEBs 35
Box 21 Hybrid SMEBs 36
List of figuresFigure 1 Essential needs analysis 4
Figure 2 Selecting the MEB cohort 12
Figure 3 Economies of scale and expenditures per capita ndash illustration of the concept 30
Figure 4 Combining flat and proportional elements in the MEB 33
Figure 5 Possible triggers for MEB composition review 39
v
1
This guidance note on minimum expenditure baskets is
part of a package of guidance on the analysis of essential
needs This preface provides a brief introduction to the
concept of essential needs the rationale behind the package of
guidance for the analysis of essential needs what this analysis
entails and how the different analytical pieces can be used
The concept of essential needs originates in the basic needs
approach proposed by the International Labour Organization
(ILO) The ILO report on the 1976 World Employment
Conference defined basic needs in terms of household private
consumption of goods such as food clothing and housing
and services such as water and sanitation provision education
and public transportation1 Since then basic ndash or essential
ndash needs have been broadly defined in several analytical
frameworks as the essential goods and services required
on a regular or seasonal basis by households to ensure
survival and minimum living standards without resorting
to negative coping mechanisms or compromising their
health dignity and essential livelihood assets2
This amounts to a working definition for a highly contextual
concept The definition is not a universal list of what
constitutes essential needs International humanitarian
and human rights law offer a useful starting point for that
protecting the rights of crisis-affected populations to food
water sanitation clothing shelter and lifesaving healthcare
However what counts as essential will greatly depend on the
context and on what people themselves consider the most
important aspects necessary to ensure their survival and
wellbeing In order to move from the concept to concrete
analysis and action any definition of essential needs
should always be contextualized and verified through
consultations with the population of interest and other
stakeholders
Preface ndash the essential needs approach
The analysis of essential needs how people meet them
and where there are gaps or constraints to meeting them
enriches insight into food insecurity its drivers and how
it is connected with meeting other needs A thorough
understanding of essential needs helps in the design of
effective food security responses
Among essential needs food is central Often food is the
need on which poor households spend the largest share of
their resources But a householdrsquos ability to meet its food
and nutrition needs also depends on its ability to meet other
essential needs When households have limited resources
they will constantly have to prioritize between often equally
urgent needs They may have to decide between spending
money on healthcare or school fees or on buying different
types of food At the same time being in poor health or having
limited access to clean water negatively impacts a householdrsquos
ability to be food and nutrition secure This illustrates the
importance of analysing essential needs together and explains
why adopting the lens of essential needs can be of great
value for understanding food security and designing food and
nutrition security interventions
Recognizing this connection between food security and
the fulfilment of other essential needs is paramount
when working to reach the Sustainable Development
Goals (SDGs) The WFP strategic plan for 2017ndash2021 points
out that in order to achieve SDG 2 ndash End hunger achieve food
security and promote sustainable agriculture ndash WFP needs
to integrate a life-changing strategy along with its lifesaving
focus This means working towards sustainable food security
and nutrition goals while understanding how achieving SDG 2
is linked to progress towards other SDGs
Building strategic partnerships for stronger synergies is key
to improving food security SDG 17 ndash Strengthen the means
of implementation and revitalize the global partnership
for sustainable development ndash recognizes the crucial
role of partnerships in achieving holistic and sustainable
What are essential needs Why is WFP interested inessential needs
What counts as essential will greatly depend on the context and on what people themselves consider the most important aspects necessary to ensure their survival and wellbeing
1 Employment was considered both a means and an end and participation in decision making was also included2 See the Cash Learning Partnershiprsquos Glossary of terminology for cash and voucher assistance (CaLP glossary) and Save the Children UK 2018
2
Minimum Expenditure Baskets Guidance Note | December 2020
outcomes for affected populations Another key international
agreement the Grand Bargain committed its signatories to
working together in a more efficient and harmonious manner
in order to better assist the growing number of vulnerable
people affected by crises around the world
Against this backdrop and based on best practices by WFP and
partners an integrated analytical package has been prepared
to provide guidance on how to analyse essential needs This
package builds on existing guidance and research together
with practical experience and lessons learned It is designed to
provide analytical results that can be used to inform strategic
and operational decision making and programme design
As analysing understanding and assisting people in
meeting their essential needs is by definition not a single-
agency undertaking the package developed by WFP is
intended as an analytical starting point for interagency
collaboration It offers data-driven approaches and
quantitative indicators but also allows for analytical flexibility
emphasizing the importance of collaboration qualitative
inquiry and contextual adaptation
Essential needs analysis is particularly relevant where WFP
and partners seek to support government strategies and
policies such as informing the design of social safety nets
as a toolbox to support the design of multi-stakeholder
joint assessments or joint harmonized or complementary
interventions Essential needs analysis has proven useful in
a variety of contexts from refugee camps to chronic food
insecurity settings It is often highly relevant when assessing
the situation of poor urban populations urban households
depend heavily on markets to meet their food and other
essential needs including housing high living costs and
unstable income sources make them vulnerable to shocks
forcing households to choose between meeting different
essential needs in times of hardship
What is essential needs analysisThe analytical packageThe WFP essential needs analysis package consists of three parts
The essential needs assessment is a household andor
community assessment that helps to understand if and how
people are meeting their essential needs as such it focuses
on the demand side of essential needs The assessment seeks
to identify and analyse essential needs and gaps estimate
the number of people in need and profile them by describing
their main characteristics It aims to answer the following
questions
What are the populationrsquos essential needs and how
do people meet them
Which essential needs are unmet and why
How many people are unable to meet their
essential needs
Who are the people that are unable to meet their
essential needs
Where are the people that are unable to meet their
essential needs
How can households be assisted to meet their
essential needs
The essential needs assessment promotes the use of
qualitative and quantitative analysis It proposes a suite
of essential needs indicators that capture various aspects
of essential needs and a householdrsquos ability to meet them
including measures of household economic capacity to meet
essential needs deprivations of different essential needs how
households cope when they struggle to meet their essential
needs and how they prioritize unmet needs
An integrated analytical package has been prepared to provide guidance on how to analyse essential needs This package builds on existing guidance and research together with practical experience and lessons learned
3
Minimum Expenditure Baskets Guidance Note | December 2020
The foundational understanding of essential needs gained
from the essential needs assessment can feed into the supply
analysis The results can help to focus a complex market
analysis on the most critical needs while household data
can be used to understand how households perceive the
supply and quality of essential services and their access to
them At the same time a thorough analysis of the supply
of essential goods and services enriches the understanding
of household demand and enables the analyst to identify
possible interventions Which needs can be met through
the market Is there effective demand and would supply
or demand-side interventions or a combination of these be
better suited to assisting the population of interest The MEB
connects supply and demand in the sense that it identifies
a monetary threshold for meeting essential needs through
the market It enables the essential needs assessment to
identify households with sufficient economic capacity it also
has strong complementarities with the supply analysis as it
helps reveal market consumption patterns In turn the supply
analysis is a valuable input for a MEB analysis as it highlights
which goods and services are adequately supplied
The analytical approach draws on different schools
of thought from the fields of humanitarian action
development and poverty analysis It combines ideas from
the cost-of-basic-needs approach for monetary poverty
lines which sees poverty as the deprivation of consumption
with more multidimensional poverty perspectives from
human development and capabilities approaches Through
this combination the essential needs analysis provides a
framework that is easy to operationalize while offering the
flexibility and detail necessary to adjust to different contexts
and to produce information relevant for programmatic
decision making
The minimum expenditure basket (MEB) looks at the needs
that are covered partially or fully through the market It sets
a monetary threshold which is defined as what households
require in order to meet their essential needs The starting
point for constructing a MEB is usually household expenditure
data This data is analysed and triangulated with sector-based
needs information to obtain a measure of the minimum
cost of essential needs based on the population of interestrsquos
actual demand pattern and consumption priorities The
expenditure data can be gathered as part of the essential
needs assessment data collection Once constructed the MEB
itself serves as a key input in the essential needs assessment
set of indicators as it is
used to assess which
households have the
economic capacity to
cover their needs through
the market
The supply analysis looks at the supply of essential goods
and services and examines whether the market andor public
provision can sustain the demand related to essential needs
It integrates quantitative methods for examining the basic
functioning of the marketplace with qualitative investigation
of supply and access
The three guidance tools are designed so that they can
be used independently or together A full essential needs
analysis would require undertaking an essential needs
assessment constructing a MEB and carrying out a supply
analysis this combination is recommended for the most
complete analysis as each piece complements the others
A full essential needs analysis would require undertaking an essential needs assessment constructing a minimum expenditure basket and carrying out a supply analysis
Essential needs analysis provides a framework that is easy to operationalize while offering the flexibility and detail necessary to adjust to different contexts
4
Minimum Expenditure Baskets Guidance Note | December 2020
Essential needs analysis package
Esse
ntia
l nee
ds
ESSENTIAL NEEDS ASSESSMENTDemand for essential needs
SUPPLY ANALYSISSupply of essential goods and services
MINIMUM EXPENDITURE BASKETExpenditures on essential needs
Decision making
Operationalization
Monitoring
While the three pieces of analysis should be carried out
together as much as possible there may be situations in
which only one piece is necessary for example when the
analysis is spread out over time or different collaborators
lead on different pieces Each guidance note is designed as a
standalone document enabling analysts to follow it without
reference to the others
A series of operationalization guidance notes and
documented best practices complement the analytical
package The series offers concrete guidance on how the
results of the essential needs analysis can be translated into
programme design and inform decision-making Essential
needs analysis identifies where households face critical
gaps in meeting their needs the cost of meeting those
needs in the market and whether the necessary essential
goods and services are available As such it forms the
basis for programme design for both demand and supply-
side interventions Results can for example be used to
inform the targeting and prioritization of beneficiaries the
selection of transfer modality the setting of transfer values
and other programme design features It is well suited for
monitoring needs over time and evaluating the effectiveness
of programmes This series will be continuously updated to
reflect new learning
While essential needs analysis can inform programme design
it does not have to imply an essential needs response
Essential needs analysis and the analytical package can be a
service offering particularly when supporting governments in
designing policies strategies and programmes at national and
local levels
Figure 1 Essential needs analysis
5
Minimum Expenditure Baskets Guidance Note | December 2020
This guidance note sets out the basic steps for constructing a
minimum expenditure basket (MEB) It is designed to provide
conceptual clarity and best practices built on experience from
the humanitarian and development fields The guidance is
designed to provide a series of options in order to facilitate
a context-specific application of the recommendations it
presents
The guidance note begins by introducing the concept of the
MEB and its different usages (sections 1 and 2) Sections 3 to
6 cover how to construct a MEB including important aspects
to consider before starting the analysis and the different MEB
approaches Section 7 examines how to deal with household
size and composition in MEB analysis while the concept of the
survival minimum expenditure basket (SMEB) is introduced
in section 8 Section 9 sets out additional considerations
such as regional or seasonal price adjustments and section
10 explains how to find MEB proxies when time or data is
insufficient In closing section 11 offers guidance on how to
update and monitor the MEB
A MEB is defined as what a household requires in order to
meet their essential needs on a regular or seasonal basis
and its cost3 Essential (or basic) needs are defined as ldquothe
essential goods and services required on a regular or seasonal
basis by households to ensure survival and minimum living
standards without resorting to negative coping mechanisms
or compromising their health dignity and essential livelihoods
assetsrdquo4 The MEB is a monetary threshold ndash the cost of these
goods utilities services and resources ndash and is conceptually
equivalent to a poverty line5 It typically describes the cost
of meeting one monthrsquos worth of essential needs Since the
MEB sets a monetary threshold for what is needed to cover
essential needs the households whose expenditures fall
below the MEB are defined as being unable to meet their
essential needs
i About this guidance note
3 This builds on the definition in UNHCR et al 2015 4 Definition of basic needs See CaLP glossary 5 Note that conceptually a MEB is equivalent to a poverty line in that it describes a monetary threshold for being able to cover essential needs This does not mean that the MEB is equivalent to the national poverty line6 Haughton and Khandker 2009
In poverty literature and research MEBs have long been
constructed primarily to set national poverty lines and
determine the percentage of households in the population
who are poor ie who cannot meet their essential needs
The ldquocost of basic needsrdquo approach which entails establishing
a MEB is fairly new in humanitarian contexts however it
has long been the most common way to construct national
poverty lines6 As a result there is often national experience to
draw on when setting out to construct a MEB
A MEB does not necessarily contain all the essential needs
of a household It only captures needs that the households
cover entirely or partly through the market It should not
be an attempt to monetize all the needs of a population
For example in contexts where electricity is considered an
essential need but not available for the population of interest
it should not be included in the MEB If shelter is provided free
of charge in a refugee camp or education is publicly provided for
free these needs and their costs are not captured in the MEB
Hence a need can be essential but not included in the MEB
A MEB does not necessarily contain all the essential needs
of a household It only captures needs that the households
cover entirely or partly through the market It should not
be an attempt to monetize all the needs of a population
For example in contexts where electricity is considered
an essential need but is not available for the population of
interest it should not be included in the MEB If shelter is
provided free of charge in a refugee camp or public education
is provided for free these needs and their costs are not
captured in the MEB A need can therefore be essential but
not included in the MEB
A MEB captures the cost of essential needs for average
households It does not typically capture ad-hoc or one-
off costs This can be challenging particularly in emergency
situations when needs are dynamic While this guidance
suggests keeping the MEB composition fixed as far as
possible in such situations it might be justified to create
an interim MEB (see section How to find a proxy for a MEB
when data or time is insufficient) and when the situation has
stabilized a final one A similar challenge is presented with
1 What is a minimum expenditure basket
6
Minimum Expenditure Baskets Guidance Note | December 2020
needs that are inherently irregular large and unpredictable
such as health needs This is also examined in the sections on
MEB construction
There are different approaches to establishing a MEB
As the World Bankrsquos Handbook for Poverty and Inequality
explains7 the typical starting point for establishing a MEB is
to estimate the cost of acquiring enough food to meet energy
requirements usually 2100 calories per person per day as
per the Sphere Standard Yet the cost of 2100 calories varies
with the diet of households which typically depends on their
economic status The cost of other essential non-food needs
is then added There are two approaches to establishing
which food and non-food items should be in the MEB an
expenditure-based approach that focuses on effective
demand and a rights-based approach based on assessed
needs While the expenditure-based approach is usually used
to construct national poverty lines the rights-based approach
is the principal method followed in the operational guidance
for multipurpose cash grants developed for humanitarian
purposes8 A combination of these approaches a hybrid
approach can also be used and is often recommended This
guidance describes each approach
The construction of a MEB is always somewhat arbitrary
However a MEB is constructed choices need to be made along
the way The objective of the MEB can influence how best to
approach its construction The choice of the group of people
whose effective demand will be examined ndash the ldquoaveragerdquo
households ndash is another important influencing factor This
guidance provides direction on how to make these choices but
analysts will always be required to exercise judgement
A MEB is not equivalent to a transfer value A transfer
value is understood as the monetary value transferred from
governments or organizations such as WFP to households
in order to support the latter in meeting their needs The
value of the MEB is not the same as the value that should
be transferred to households but the MEB can be a critical
component when determining transfer values Most
households can rely on their own resources to meet at least
some of their needs so the transfer value will usually be
less than the value of the MEB covering the gap between
householdsrsquo own resources other assistance received and
the MEB The distinction between the MEB and the transfer
value is also important because the MEB remains the same
regardless of assistance and funding constraints while the
transfer value could be impacted by these factors9
When using the MEB to monitor impacts of an
intervention or programme the MEB should not be
changed over time The threshold should only be adjusted
for price changes or when any major changes in context and
households needs occur that would require the construction
of a new MEB
2 Why have a MEBThe MEB has a range of applications In humanitarian
and development programming the MEB can support
household profiling by identifying characteristics of those
who cannot meet their essential needs10 and support
decisions on transfer value amounts for food and non-
food needs For partnerships the MEB can support multi-
sector coordination and programming with government
partner organisations and donors In market and supply
analysis the MEB can help inform which goods and services
to include in a Supply Analysis by showing which essential
needs households cover through the market Finally in
monitoring the MEB can assist monitoring of immediate
and longer-term outcomes through analysis of expenditure
trends against the MEB and help establish a basket against
which to monitor market prices and the cost of living
7 Ibid8 UNHCR et al 20159 For further discussion on considerations when setting a transfer value see WFP 2020c 10 For one possible application see WFP 2020a
A hybrid approach to constructing the MEB combines the expenditure-based approach and the rights-based approach and is often recommended
7
Minimum Expenditure Baskets Guidance Note | December 2020
THE MEB TO-DO LIST DEPENDING ON CONTEXTALSO CONSIDER
Identify key partners and stakeholders and decide on objectives and process
Construct the food basket
Construct the non-food basket
Reality check results and validate with stakeholders
Determine the analytical starting point (eg examine national poverty lines set the population of interest check what data is available) and decide on approach
Accounting for household size and composition
Adapting the MEB to different needs across regions or seasons
Adjusting the MEB for regional or urbanrural price differences if significant
HOW TO
Box 1MEB
3 How to construct a MEB generic steps
11 This is in line with the cost of basic needs approach widely used for poverty lines as described in previous sections
A MEB is constructed by estimating the cost of acquiring
adequate food and adding the cost of other essential non-
food expenditures11 The box below shows the steps that are
always part of constructing a MEB
The two principal methods for constructing MEBs are
the expenditure-based approach and the rights-based
approach Sections 5 and 6 describe these approaches
and how to combine elements of both to apply a hybrid
approach
Regardless of approach it is crucial to arrive at a realistic
relevant and operational MEB that is rooted in
consumption behaviour ndash section 6 also looks at how to
ensure this Before going into the details of construction the
next section outlines the key questions to ask before starting
the MEB analysis
8
Minimum Expenditure Baskets Guidance Note | December 2020
Before embarking on the construction of the MEB
components consider the following questions to decide how
best to approach the analysis
What is the objective and whowill be the partnersStart by setting the objective and consider what the MEB will
be used for once the analysis is finished If the MEB analysis
is a joint exercise identify potential partners possibly in
interagency working groups such as a cash working group find
out what kind of information various organizations can share
and decide on the division of labour In some cases it can be
helpful to write terms of reference for the MEB analysis in
order to clarify the envisioned process and methodology Even
if the MEB analysis will be conducted by just one agency it is
always a good idea to identify partners who will be interested in
the results and who can be consulted along the way12
Who is the MEB being constructed forIt is important to define the population of interest for the
MEB Is it intended to be valid for the entire country Or will it
only be used in a refugee camp for example or a particular
region where needs might differ from those in the rest of
the country It is vital to decide from the start where and for
whom the MEB should apply Since the MEB describes the
cost of essential needs the population for whom the MEB
is constructed should ideally have relatively homogenous
consumption patterns and needs If consumption patterns are
very different consider constructing different MEBs or varying
certain components of the MEB for sections of the population
Have any MEBs already been created for the population of interest If there are one or more MEBs already in use the analytical
exercise might be aimed at updating or even ldquoreality
checkingrdquo the existing baskets to see whether they still match
consumption behaviour and price levels If existing baskets
are found to be valid and relevant it might not be necessary
to start a new MEB analysis
4 Before starting the analysis What information and data is already available and is new data neededConsider what data or analysis is already available from
essential needs assessments or other household surveys
(undertaken by WFP or others) Does the data cover the area
and population of interest Also consider what qualitative
information might be available to shed light on certain
expenditure patterns and whether there is access to market
and price information If the data available is insufficient or
outdated plan to collect fresh data A MEB analysis is greatly
strengthened by being conducted as part of a comprehensive
essential needs assessment The assessment describes the
essential needs of the population of interest which is a
useful starting point for a MEB analysis and complements the
monetary perspective provided by a MEB
Can the national poverty line be usedBefore beginning the construction of a MEB it is useful to find
out if a national poverty line exists and how and when it was
constructed Many countries have their own national poverty
lines so why not use this poverty line (and the corresponding
basket) as the MEB Whenever possible the first choice
should be to align with government practices However this is
often not feasible for three main reasons
Practices vary widely when it comes to constructing
national poverty lines Although the most common
approach is the cost of basic needs using MEBs
sometimes poverty lines are set as a share of the
country mean or median income or expenditures or
as a fixed percentage of the income or expenditure
distribution (although this is mostly not the case in low
income countries) Furthermore even when a MEB has
been constructed to develop the poverty line different
methodologies exist For example sometimes countries
exclude non-food items from their poverty line MEB
Since the MEB describes the cost of essential needs the population for whom the MEB is constructed should ideally have relatively homogenous consumption patterns and needs
12 The Cash Learning Partnershiprsquos MEB Tip Sheet contains useful advice on the interagency processes around constructing a MEB Baizan and Klein 2019
9
Minimum Expenditure Baskets Guidance Note | December 2020
Countries can also have different poverty lines for
different purposes and regions13 These factors can all
limit the use of the national poverty line as the MEB
The population of interest for a MEB could differ from the
overall population of the country and hence the national
poverty line This group of people may have different
essential needs for instance if they live in refugee camps
or do not have access to the same services as the resident
population (eg public education)
The data that WFP typically collects through essential
needs assessments comprehensive food security
and vulnerability analyses emergency food security
assessments baseline assessments and post distribution
monitoring is often much less detailed than that gathered
through the household budget surveys or living standards
measurement surveys used to calculate national poverty
lines It is widely observed that the more detailed the
survey questions about expenditures the higher the
reported expenditures14 If the national poverty line is
constructed using detailed data but the assessment of
household needs or expenditures relative to the poverty
line is based on less detailed data errors in the analysis
are likely to occur Furthermore WFP expenditure
modules do not include asset depreciation which is often
accounted for when calculating national poverty lines
Even if the national poverty line cannot be used in most
cases and especially in humanitarian contexts elements of
the methodology can perhaps be replicated It is therefore
important to find out how the national poverty line is
constructed
How about using the methodology applied for consumer price indices The consumer price index (CPI) is used to measure changes
in price levels based on a weighted average consumer basket
of goods and services In most countries household budget
survey data is used to construct the baskets used to measure
consumer prices A weight that corresponds to average
household expenditure patterns is applied to each component
of the CPI17 This basket is not ideal for MEB calculations
because it corresponds to overall national average
consumption patterns MEBs are based on the consumption
levels and patterns of those households who are just able to
meet their essential needs within the population of interest
(this is further described in the following sections)
13 Jolliff and Prydz 2016 14 Haughton and Khandker 200915 Republic of Zambia Central Statistical Office 2016 16 See Turkish institute of statistics data portal httpsdatatuikgovtrKategoriGetKategorip=Income-Living-Consumption-and-Poverty-10717 The CPI weights are usually available through national statistical offices
COUNTRYEXAMPLE
EXAMPLES OF NATIONAL POVERTY LINESEG Box 2
In Zambia the national poverty line is constructed using the cost of basic needs MEB approach based on a simple food
basket that meets minimum food needs for a family of six15 Imagine this food basket costs USD 100 per month This is
defined as the food poverty line To construct the full poverty line the minimum non-food needs of households are
estimated based on the average share of expenditure that households just above the food poverty line dedicate to needs
other than food Let us say that this corresponds to USD 35 per month The total poverty line is then the sum of the food
and non-food lines which with these hypothetical figures would be USD 100 + USD 35 = USD 135
By contrast Turkey uses the standard European Union approach to measuring poverty which is 50 or 60 percent of
median income16 However eligibility for social assistance is based on the gap between household income and the national
minimum wage
10
Minimum Expenditure Baskets Guidance Note | December 2020
In developing country contexts consumption is generally considered a better metric of wellbeing than income and in turn consumption expenditures as captured in household data generally provide the most reliable measure for consumption
5 Constructing a MEB expenditure-based and rights-based approaches
51 The expenditure-based approachThe expenditure-based approach to constructing a MEB
relies on household-level expenditure data to examine the
consumption behaviour of households who are just able
to meet their essential needs The expenditure level and
consumption patterns for this group of households reveal the
minimum cost of covering essentail food and non-food needs
and therefore form the basis of the expenditure-based MEB
The expenditure-based approach builds on the theory
behind poverty measurement and poverty line construction
To measure poverty the first step is to define a measure
of wellbeing In developing country contexts consumption
is generally considered a better metric of wellbeing than
income and in turn consumption expenditures as captured in
household data generally provide the most reliable measure
for consumption18 Household survey data on expenditures
therefore provides the foundation for measuring wellbeing
and is used to set the MEB threshold
The steps for constructing a MEB using the expenditure-based
approach are explained below
1 Prepare the expenditure data The prerequisite for an expenditure-based MEB is a
good-quality household survey with a detailed expenditure
module with a sufficient sample size representative of the
population for whom the MEB is being constructed (the
ldquopopulation of interestrdquo)
The notion of a ldquodetailedrdquo expenditure module is a
relative one Constructing an expenditure-based MEB
requires more detailed data on different types and
groups of expenditures than is usually gathered by
household surveys conducted in humanitarian settings
However this guidance has been designed to cope
with less detailed expenditure data than that gathered
through extensive national expenditure surveys such
as the very granular expenditure modules typically used
when constructing poverty lines (eg national household
budget surveys household income and expenditure
surveys living standards measurement surveys or other
large-scale household surveys)
What is a sufficient sample size The survey should
always follow good practices for sampling19 Consider
that for MEBs the analysis focuses on the consumption
patterns of a subset of the sample the ldquoreference cohortrdquo
(see next below) The characteristics of the population
and the cohort selection criteria determine the size of
this subsample in relation to the overall sample but
experience shows that the cohort can comprise between
10 and 60 percent of the sample The sample will be
further disaggregated if analysis by household size or
group of household size is desired (see section 7 on
accounting for household sizes)
Using expenditures to understand consumption involves
calculating a ldquoconsumption aggregaterdquo This entails
combining household expenditures on food and non-
food paid in cash or through credit as well as the
imputed monetary values of consumed own production
and received assistance Expenditures are analysed in
per-capita values Box 3 describes this process in more
detail Annex 1 further outlines some best practices when
analysing expenditure data
In addition to the household survey data market price
data is needed in order to estimate the final cost of the
basket The price data should be collected around the
same time as the household survey data
18 Deaton and Zaidi 2002 and Haughton and Khandker 2009 19 For guidance see WFP 2004 Additional resources can be found in the online VAM Resource Centre httpsresourcesvamwfporg
11
Minimum Expenditure Baskets Guidance Note | December 2020
HOW TO
EXPENDITURE DATA IN MEB CALCULATIONS -CONSTRUCTING A LIGHT ldquoCONSUMPTION AGGREGATErdquo
Box 3
Using expenditures to calculate a MEB entails combining different household expenditures to arrive at a measure of house-
hold consumption This is typically referred to as a consumption aggregate although a lighter version is used than those
usually constructed for national poverty lines due to the less granular data typically available for MEB construction20
Expenditures considered in a MEB should reflect household consumption related to essential needs Therefore both
household expenditures made in cash and those on credit must be considered as the latter also reflect current consump-
tion even if payment occurs later If the population can be expected to consume food from their own production the value
of this food should be captured to avoid underestimating food expenditures Lastly if the surveyed households are receiv-
ing and consuming assistance it is advisable to estimate the implied value of this assistance and include it in the expendi-
tures (however care needs to be taken if the population of interest includes a large group of in-kind assistance beneficiar-
ies as this can significantly skew consumption choices see next section on selecting the reference cohort) In summary the
expenditure module should capture any expenditures made in the reference period through cash and credit purchases as
well as the monetary value of consumed own production and assistance Most standard expenditure modules include all
these types of expenditures
Expenditures should be collected for both food and non-food goods and services For food expenditures at the food group
level are required as a minimum If food expenditures are collected at the item level a more granular analysis can be per-
formed The same applies for non-food expenditures they must be available at the group level and item-level data will add
detail However whenever household data is collected a balance needs to be struck between the granularity of the data
and the time and resources available for its collection
The WFP standard expenditure module can be used as a reference for the minimum requirement for expenditure data
collection WFP standard modules can be found in the online VAM Resource Centre httpsresourcesvamwfporg
+ ndash=
2 Select the reference cohort The next step is to identify the households in the survey
data that are just able to meet their essential needs and
examine their expenditures Including households below
this level would generate a basket that does not satisfy
essential needs while including relatively wealthier
households would lead to the inclusion of non-essential
needs and therefore inflate the MEB But what is ldquojust
enoughrdquo
Identifying the cohort of households who are just able
to meet their needs can be challenging How to approach
it depends on the characteristics of the population
and the available data The key is to identify one or
more criteria that can be good proxies for whether
households are just able to meet their essential
needs and that can be observed in the data One
basic indicator would be a food consumption of 2100
kcal per person per day21 However since the available
expenditure data is often too crude to make accurate
calibrations of diet compositions around the 2100
kcal point the use of alternative indicators is highly
recommended These could be indicators such as food
consumption score (FCS) or food consumption score ndash
nutrition (FCS-N)22 which indicate whether households
eat sufficient and balanced diets quality of housing
indicators use of coping strategies (selecting households
who do not engage in severe strategies) or any other
indicator that reflects a householdrsquos ability to meet its
needs Combining several indicators is often useful
20 For thorough guidance on constructing consumption aggregates using data from living standard measurement surveys (LSMS) see Deaton and Zaidi 2002 In most WFP cases household data is less granular than the LSMS-type datasets This section therefore describes how to construct consumption aggregates with less detailed data21 Use of calorie consumption close to the Sphere Standard of 2100 kcalpersonday as the starting point for selecting the reference cohort originates in the cost of basic needs approach used in most national poverty line estimations 22 WFP 2008 and WFP 2015
12
Minimum Expenditure Baskets Guidance Note | December 2020
Figure 2 Selecting the MEB cohort
In simple terms it is useful to think of the green people in the figure as the basis for selecting the reference cohort they are not amongst the worst-off
nor the wealthiest ndash but rather are just able to meet their essential needs
DESTITUTE
WEALTHY
It is also recommended to examine the expenditure
distribution Excluding households in the extreme ends
of the expenditure distribution can help ensure that
the cohort is neither ldquotoo poorrdquo nor ldquotoo wealthyrdquo (eg
by removing households in expenditure quintiles 1 and
5 or similar exclusion criteria based on distribution
characteristics) This is in particular useful if there is a
relatively large spread in wealth across the sampled
population
Figure 2 provides a simplistic depiction of selecting the
reference cohort the aim is to identify households that
are just able to cover their needs and hence do not fall in
either extreme end of the spectrum
13
Minimum Expenditure Baskets Guidance Note | December 2020
Box 4 outlines some typical cases and presents suggestions
for how to select the cohort in a survey sampled on
the population of interest
There is a spread in the
population in terms of well-being
and a proportion is able to cover
their essential needs no
households receive assistance
A relatively large proportion of
households receive food
assistance
The vast majority of the
households are far from being
able to cover their essential
needs (prior to receiving
assistance)
Select households with an acceptable FCS23 or with adequate consumption in FCS-N
who do not use negative coping strategies (or have a high coping strategy index)
Combine or cross-check with other criteria such as dwelling quality or asset index
Exclude extreme expenditure quintiles
Exclude households receiving in-kind food assistance from the reference group (if
sample size allows) This is because any assistance that is not unrestricted cash
might influence the consumption choices of the beneficiary households (in-kind
food means a large portion of food consumption is determined by the assistance
provided not the households) However be aware that if the majority of
households receive some form of restricted assistance excluding them all from the
cohort can lead to sample size issues as well as selection bias
Alternatively to the extent possible avoid using criteria that are highly influenced
by assistance For example in the presence of food assistance the FCS of some
households might be acceptable even if they are not able to meet their essential
needs Furthermore if in-kind food is provided the consumption behaviour of such
households might be skewed as most of their food needs are already covered by
assistance
Consider using dwelling quality an asset index or other similar indicators instead
(or in combination with the FCS)
Consider using a rights-based approach since it will be very difficult to obtain a big
enough sample of households who can meet their essential needs making it
challenging to construct an expenditure-based MEB Carry out a reality check using
the survey data to understand household consumption patterns keeping in mind
that the sample represents a population not able to fulfill their essential needs
HOW TO
REFERENCE COHORT SELECTIONBox 4
Scenario Possible approach to selecting the cohortUse one or several of the below criteria
The use of sensitivity tests is highly recommended in the form
of repetitions of the expenditure analysis for different versions
of the reference cohort this will indicate the extent to which
the choice of cohort selection criteria is influencing the MEB
23 It is usually not advisable to use the FCS as a single criterion If it is used alone the indicator should be capped at a certain level above the acceptable threshold (the FCS builds on a continuous score from 0ndash112 and applies thresholds for poor borderline and acceptable consumption) This is because if all households with acceptable FCS are included this will likely also capture some households who are ldquotoo wealthyrdquo to be considered in the reference cohort
14
Minimum Expenditure Baskets Guidance Note | December 2020
See box 5 for examples of how sensitivity tests can be
conducted as well as how the reference cohort has been
COUNTRYEXAMPLE
SELECTING AND CHECKING THE REFERENCE COHORTCHAD SYRIAN REFUGEES IN LEBANON AND COXrsquoS BAZAR
EG Box 5
Reference cohort sensitivity analysis ndashCoxrsquos Bazar MEB
Table a
In Chad the calculation of an expenditure-based MEB relied on national data collected by the Government during their
annual national food security and nutrition survey The reference cohort for the MEB was selected on the basis of two
criteria FCS between 35 and 70 eg in an interval around the acceptable threshold and no adoption of crisis or emergency
livelihood coping strategies based on the livelihood coping strategies indicator These two criteria ensured that the
selected reference cohort had consumption levels that provided sufficient food security and sustainable livelihood
strategies
For Syrian refugees in Lebanon24 an expenditure-based MEB was calculated by WFP in order to review an existing MEB
Shelter plays an important role as most refugees live in an urban host community and face high rents The FCS reveals
whether people can cover their food needs but could be influenced by the presence of food assistance To ensure results
would be robust against the choice of the cohort two different approaches were compared both included households of 4
to 6 members (as the MEB under review was defined only for households of these sizes) and excluded households in
expenditure quintiles 1 and 5 In version 1 an additional criterion of acceptable FCS was included while in version 2 an
additional criterion of acceptable housing conditions was applied The results were similar for both cohort versions
A MEB was calculated in Coxrsquos Bazar Bangladesh as part of the 2019 Refugee Influx Emergency Vulnerability Analysis
(REVA-II)25 for Rohingya refugees An expenditure-based MEB was built using a large household survey that included
refugees and host community households the reference cohort also included refugees and host communities as the MEB
was meant to apply to both groups Households receiving in-kind food assistance were excluded to avoid possible bias in
consumption choices which would be reflected in the expenditure data The reference cohort was then selected based on
FCS and expenditure quintiles To ascertain that the appropriate cohort had been chosen a sensitivity analysis was
conducted which tested the effect of removing different expenditure quintiles (quintiles 1 and 5 versus quintiles 1 4 and 5)
and including different FCS ranges (FCS 42+ versus FCS 35ndash80) This showed that across different iterations of the reference
cohort total food expenditures were relatively stable while non-food expenditures went up when richer households (eg in
the higher expenditure quintiles) were included This allowed the analysts to select the cohort of households who were just
at the point where the share of food expenditures out of total expenditures began to decrease as a high share of
expenditure on food is often an indicator of vulnerability In other words the selected cohort was just at the point where
households started meeting more needs than just food and the most basic non-food requirements The consumption
patterns of this cohort -highlighted in table a below - therefore became the basis for the MEB
Indicator 1expenditurequintiles
Indicator 2FCS Sample
size Value in taka
Total MEB
Exclude quintiles 1 4 and 5
Exclude quintiles 1 4 and 5
Exclude quintiles 1 and 5
Exclude quintiles 1 and 5
FCS 35ndash80
FCS gt= 42
FCS 35ndash80
FCS gt= 42
403
296
610
474
5259
5324
5691
5740
2304
2299
2990
3082
070
070
066
065
030
030
034
035
7562
7623
8681
8822
Food MEBValue in taka Value in taka
Non-food MEB
identified in different contexts
24 Hohfeld et al 2020 25 WFP 2019
15
Minimum Expenditure Baskets Guidance Note | December 2020
3 Establish the food basketWith the reference cohort identified the food basket value
should be calculated in correspondence with the food
consumption patterns of the reference cohort
To calculate the food basket start by computing the mean
(or median) food expenditures for the chosen reference
cohort It is good practice to compute the overall food
expenditures and break the analysis down into the different
food groups or food items in order to understand how food
consumption is distributed across different foods
Next consider whether an explicit reference food basket
is needed in the MEB this is a list of the food items in the
basket and their quantities Having a reference basket
brings advantages in terms of monitoring of the cost
of the MEB (as new prices can easily be applied to the
quantities) it shows consumption patterns in quantities
and can hence help check if food consumption is adequate
at the given level of expenditures and it can help when
communicating about the MEB It can therefore be a useful
practice to establish one However in some instances
a simple monetary value for the food MEB is sufficient
This could be the case when the MEB is calculated to
review an existing MEB if reference basket is not needed
for operational purposes when time is limited or
where limited data means a reference basket cannot be
adequately calculated Wherever a food reference basket
is not needed the food MEB will simply be the mean (or
median) food expenditures by food groups or food items
as calculated above If a reference food basket is feasible
and desired the next steps depend on the level of detail in
the data available
With expenditure data and market prices a food
reference basket can be approximated using expenditures
by food group or food item and dividing these
expenditures by the relevant food prices This provides
estimates of consumed quantities Expenditures and prices
must be collected at the same time in order to arrive at
correct quantities If for example prices are collected six
months later than expenditures and prices have changed
significantly dividing expenditures by prices will produce
inaccurate estimates
Note that the level of detail and accuracy with which a
food refence basket can be established using expenditures
and prices also depends on whether expenditures
were collected at the food group or food item level Box 6
illustrates how to approximate a reference basket when
expenditures are collected at the food group level and
box 7 shows an example of a food basket estimation from
an assessment in Kinshasa Democratic Republic of the
Congo
If the expenditure module includes consumed quantities
of food in addition to expenditures a food basket can be
established directly based on the consumed quantities by
food group or food item Having data on quantities will
also enable analysts to estimate prices directly from the
survey data by dividing the household expenditure on a
particular food item by the quantity consumed This can be
advantageous as it provides a direct estimate of the prices
households actually paid (unlike a price survey which uses
typically consumed items and is often only conducted
at specific points of sale) On the other hand this may
introduce issues related to non-standard measurement
units that make prices hard to compute and aggregate26
Box 8 shows an example from Coxrsquos Bazar of how a food
reference basket can be established using item-level
expenditures and quantities from the survey data
Once the quantities consumed have been established using
one of the methods described above it is good practice to
check the calories these quantities provide and the balance in
terms of nutrients The basket should be close to the Sphere
Standard of 2100 kcal per person per day ndash if it is not one
option could be to scale the basket Use information on the
calorie content of the different food items in the basket to
calculate the total calorie content of the basket27 The quantities
in the basket can then be scaled up or down to reach 2100
kcal However bear in mind that if the reference cohort has
been well selected and the data is of sufficient quality and
detail the basket should already be close to 2100 kcal If large
rescaling is required investigate the reasons behind this For
the sake of simplification quantities can be rounded and the
basket can be streamlined by removing items with very low
consumption or nutritional value
26 Deaton and Grosh 2000 27 Calorie information of food items can be drawn from a variety of sources The Nutval tool (httpwwwnutvalnet) provides information on calories and other nutrients for a list of items Consider that the
specifications and quality of a product can influence its caloric value (eg whole fish vs fish fillet) ndash it might be necessary to adjust for this for certain items that vary widely Many food composition tables (available from FAO for different continents httpwwwfaoorginfoodsinfoodstables-and-databasesfaoinfoods-databasesen) contain a wastage factor or edible portion conversion factor to convert from edible portions into full products as they are bought on the market
16
Minimum Expenditure Baskets Guidance Note | December 2020
After establishing the reference basket and possibly rescaling
it the basket is priced This is done by multiplying the basket
quantities by the food prices The basket can be priced using
current food prices from a price survey or by estimating food
prices from the expenditure data as described earlier The
result should be close to the expenditures for the reference
cohort although differences could arise from any rescaling or
simplification of the basket
APPROXIMATING A FOOD BASKET WITHGROUP-LEVEL FOOD EXPENDITURES
Box 6
HOW TO
Data quality and granularity has a big impact on the calculation of a food reference basket If consumed quantities are not
directly available in the dataset they need to be calculated by dividing expenditures by prices However this will always
produce an approximation and the more aggregated the data on expenditures is the more approximate the results will be
In particular when the food expenditure data is available at the food group level care needs to be taken when converting
expenditures into quantities
For example to convert expenditures on the food group ldquocerealsrdquo into a reference quantity analysts need to divide cereal
expenditures by the price of cereals But how do they determine the price of cereals This is a food group not a specific item
so there is no exact price The recommended way to approach this is to determine which is the most commonly consumed
item or combination of items for each food group Then a price for the most commonly consumed item or a composite price
of a combination of items can be used to arrive at quantities So if the most commonly consumed cereals for the population
of interest are maize and rice and they are eaten in equal measure by the population the cereal quantities for the reference
basket can be calculated in the following way
Mean cereal expenditures for our reference cohort = 150 shilling
Price of rice = 18 shillingkg
Price of maize = 12 shillingkg
Composite price of rice and maize = (18 + 12) 2 = 15 shillingkg
Cereal quantity consumed = 150 shilling (15 shillingkg) = 10 kg (5 kg rice 5 kg maize)
Of course this is an approximation care needs to be taken when converting expenditures into quantities using
group-level data
Certain food groups may lend themselves more to this approximate conversion than others For example cereals
might be relatively easy to convert using this method as cereal consumption often is concentrated on a few key staples In
contrast vegetable consumption may be so diverse that conversion via prices is not helpful In this latter case one option
could be to obtain reference basket quantities for the groups that can be converted and leave other groups as expenditures
only so that the food MEB becomes a combination of quantities and expenditures
In summary to establish the food basket
i Calculate mean (median) food expenditures by food group
or item If an explicit reference basket with quantities is not
needed stop here and simply use the expenditures as the food
basket
ii Estimate consumed quantities (by dividing expenditures
by prices or directly from data if it contains consumed
quantities)
iii Check the resulting quantities and consider scaling to meet
Sphere Standards
iv Price the basket using market prices or prices derived
from the household data
17
Minimum Expenditure Baskets Guidance Note | December 2020
Table a Food reference basket ndash Kinshasa MEB
COUNTRYEXAMPLE
KINSHASA FOOD REFERENCE BASKET USINGFOOD GROUP EXPENDITURES
Box 7
In the Kinshasa urban essential needs assessment28 the food reference basket for the MEB was established as follows
Expenditure data was available at the food group level only The caloric importance of each food group (column A of the
table below) as a part of the overall food intake was determined For each of the calorie-relevant food groups the most
commonly consumed food item was then identified (eg maize in the case of cereals) (see column B) Using the average per
capita expenditure from the household survey (column C) and the market price for each food item (column D) the
quantities consumed per person per month were approximated (column E) Next the total calorie intake was calculated
(column G) For urban Kinshasa this amounts to 1967 kcal which is close to the Sphere Standard of 2100 kcalpersonday
and suggests that the expenditure data is likely to be reliable However a proportional rescaling to 2100 kcalpersonday
was done to ensure consistency with Sphere (column H) On the basis of the rescaled total calories all values were then
converted back to monthly figures to arrive at a monetary value for each food item (columns I and J) In addition to the
calorie-relevant food items the mean expenditures on other food categories that households regularly consume were
added (vegetables fruit etc) As these food items represent little overall share of peoplersquos calorie consumption (given the
quantities consumed or the type of the foods) they were not included when calories were calculated Furthermore it would
be difficult to select specific food items in each of these categories as they are quite diverse (eg vegetables) However as
most households still consume these food items as part of their usual diet and they provide important micronutrients their
costs need to be reflected in the food MEB The mean expenditure on these food categories was therefore used as a
good-enough approximation for householdsrsquo consumption of these food groups Meals consumed outside the household
were excluded from the MEB as they were not considered essential
Food
grou
p
Food
item
per
capi
ta a
vm
onth
ly e
xp
Pric
e(f
ranc
kg)
kg c
ons
per
mon
th =
CD
food
item
kca
lpe
r 10
0g
kcal
con
s p
er d
ay=(
EF
10)
30
kcal
per
day
res
cale
d=G
(21
001
967)
kg p
er m
onth
res
cale
d=(
H(
F10
))30
roun
ded
MEB
food
-bas
ket
(fra
nc)=
ID
6898
1808
2089
2341
4306
1817
2826
833
799
2509
2144
900
500
1300
2300
2500
2200
77
36
16
10
17
08
920
412
179
302
44
110
1967
360
342
335
890
76
400
TOTAL
982
440
192
322
47
118
2100
82
39
17
11
18
09
7400
1900
2200
2500
4600
1900
2800
800
800
2500
27400
A B C D E F G H I JCereals
Tubers
Pulses
Oilsfats
Meatfish
Sugars
Vegetables
Fruit
Dairy
Condiments
Meals out-
side home
Maize
Cassava
Beans
Veg Oil
Fish
White sugar
Vegetables
Fruit
Dairy
Condiment
Meals out-
side home
29 WFP 2019 Also see box 5
18
Minimum Expenditure Baskets Guidance Note | December 2020
COUNTRYEXAMPLE
COXrsquoS BAZAR FOOD REFERENCE BASKETWITH DETAILED EXPENDITURE AND QUANTITY
Box 8
In the MEB for Coxrsquos Bazar calculated as part of the REVA II assessment expenditures and consumed quantities were
available for 87 food items which formed the basis for the consumption aggregate While the expenditure data was used to
select the appropriate reference cohort the reported quantities were used to determine household calorie intake
Quantities were reported at the food item level and consumed calories were calculated for each item The items were then
categorized by food group (cereals pulses oilsfats vegetables etc) and the total calories from each group were
calculated To create an operationally relevant reference basket without very large numbers of food items the number of
items in each food group were reduced where possible For example 95 percent of the calories that households get from
the food group ldquocerealsrdquo come from rice The cereal food group was therefore simplified to rice only keeping the total
calories sourced from cereals constant and adjusting the quantity of rice in the basket slightly upwards For pulses the four
main consumed items were identified and calories and quantities proportionally adjusted For other food groups such as
vegetables the variety of items consumed within the group was too great to simplify items to a small number for this
group no items were assigned and instead total expenditures on vegetables for the reference cohort were used directly in
the food MEB The total calories of all items were taken into account The resulting basket was close to 2100 kcal so only
minor rescaling was undertaken to arrive at final reference basket of 2100 kcalpersonday
Once the final basket had been determined quantities were priced using median prices derived from the household data
(by dividing expenditures by purchased quantities for the relevant items)
For vegetables fruits meat dairy and condiments expenditures are used directly in the food MEB (converted into monthly per
household values) For all other items quantities per capita per day are multiplied by the item median price (as derived from
the household data) and converted into monthly per household values
The MEB uses household size 5
Note The MEB for Coxrsquos Bazar was calculated for analytical purposes for the REVA II assessment It is not the operational MEB used
for the district
Foodgroup
Fooditem
Consumedquantity(grammescapitaday)
Calories(kcalcapitaday)rescaled
Median prices(takakg)
Value in MEB(taka per HHmonth)
424
14
7
2
1
182
6
81
1
33
6
28
1527
48
27
8
4
78
5
85
1
294
24
0
2100
30
80
60
40
80
-
-
-
-
80
60
-
1909
168
67
14
13
1065
48
1600
15
392
57
345
5691
Cereals
Pulses
Pulses
Pulses
Pulses
Vegetables
Fruit
Meat
Dairy
Fats
Sugar
Condiments
TOTAL FOOD
Rice
Lentil
Chickpea
Anchor daal
Mung
none
none
none
none
Soybean oil
Sugar
none
Table a Food reference basket ndash Coxrsquos Bazar MEB
19
Minimum Expenditure Baskets Guidance Note | December 2020
4 Establish the non-food basketOnce the food component has been established a non-
food component is added There is no wholly satisfactory
way to add a non-food component as it can be difficult to
define an essential minimum Unlike food needs many
non-food needs are often more contextual and are not
easy to anchor in a specific universal threshold (like the
food Sphere Standard of 2100 kcal per person per day)
While Sphere Standards exist they often need to be
contextualized and may not cover all non-food essential
needs
The non-food basket can be established with different
levels of detail depending on the available data and the
level of granularity desired
As for the food expenditures start by calculating the
mean (andor median) non-food expenditures for the
reference cohort If the expenditure data is detailed it can
be used to identify specific non-food needs Expenditures
can be analysed by non-food group (eg shelter hygiene
or transport) to design a non-food basket composed
of group-specific expenditures The precise non-food
components can vary by context but would generally
include the components discussed in the section on
the rights-based MEB below Some non-food items that
expenditure data has been collected for might need to be
excluded for the purpose of constructing the MEB (eg
tobacco which is hard to consider an essential need)
In theory it would be possible to establish a non-food
reference basket with specific quantities using the same
method as for food ie by dividing expenditures by prices
to arrive at quantities However this is usually not feasible
for non-food goods and services simply because non-food
expenditure data is often much harder to break down into
specific items than food expenditure data For instance
even if expenditures on clothing or transportation
are known relating this to exact clothing items or
transportation services and then obtaining accurate
prices for those itemsservices will often prove difficult if
not impossible Therefore as a general recommendation
in the expenditure-based approach when non-food
expenditure data is not available at the item level it is
best to keep the non-food basket to expenditures and not
provide quantities If reliable market price information on
relevant non-food items is available total expenditures
could be checked against prices to obtain an approximate
idea of the adequacy of the non-food expenditures
Particular groups of non-food expenditures may require
special attention due to their nature Box 9 highlights a
few examples
TIP BOXNON-FOOD EXPENDITURES ndashEXPENDITURES OF PARTICULAR INTEREST
$$
$
Box 9
Shelter expenditures can be a tricky component to deal with especially for urban populations If the share of the
population who rent accommodation is significant rent will typically be included in the MEB as it is the cost of shelter an
essential need Indeed it can form quite a significant part of the MEB However if the resulting MEB is compared to actual
expenditures to determine whether households fall below the MEB those who own their dwelling and therefore do not pay
rent might be classified as unable to cover their needs just because they do not have any major shelter expenditures
Therefore large single expenditures such as rent should be included with care and context will determine how shelter
expenditures are handled in the MEB Generally speaking if no or very few households in the population of interest have
major shelter expenditures such as rent this component should be left out of the MEB and no attempt made to impute it
(as is sometimes the case in poverty line estimations) If the majority of households rent their dwellings it is advisable to
include mean rent expenditures in the MEB The trickier case is when the households in the population of interest are split
between a significant number of households living in owned or no-rent housing and a significant number paying rent ndash
here it is difficult to reflect shelter expenditures adequately in the MEB Simply using mean rent estimations in the MEB will
underestimate the need for the renters while overestimating it for those who own their housing or do not pay rent In this
case insofar as data allows one solution could be to impute rent expenditures for the non-renters by estimating the
would-be rental cost for the type of housing they live in Doing this typically requires a housing module in the household
survey that contains information on ownership and types and sizes of housing so rental equivalents can be computed and
imputed for the non-renters
20
Minimum Expenditure Baskets Guidance Note | December 2020
NON-FOOD EXPENDITURES ndashEXPENDITURES OF PARTICULAR INTEREST
$$
$
Box 9
Health expenditures can also be challenging to capture adequately in survey data as such expenditures are often irregular
in nature Bear in mind that health expenditures usually consist of payment for goods such as medicines and for services
such as visits to the doctor When analysing the expenditures and deciding how to include them in the MEB consider which
services may be provided free of charge and what households pay themselves and at what cost30
Care should be taken when it comes to the underreporting of expenditures and treatment of expenditures that are
irregular in nature Remember that the MEB should include all recurrent essential needs but it typically does not include
one-off expenditures ldquolumpy expendituresrdquo such as marriage expenditures or dowries or investments Expenditures
on durables (for instance the purchase of vehicles or large household appliances) are also not included (in national poverty
lines the rental value of the durables owned by households adjusted for depreciation is sometimes included31 however
this is not recommended for MEB calculations)
Household expenditures on savings taxes and debt repayment are not usually included in the MEB as these types of
expenditures do not reflect actual consumption
Tobacco and alcohol are often included in expenditure surveys While households may choose to spend money on these
items they can fairly be assumed to be non-essential and are generally not recommended for inclusion in the MEB
The ldquoquick fixrdquo if data is very limited If the expenditure
data has no or very insufficient data on non-food
expenditures a ldquoquick fixrdquo solution is to use the average
non-food expenditure share of total expenditures This can
often be obtained from external sources such as monitoring
reports or food security assessments This is then added
COUNTRYEXAMPLE
Table a Non-food basket ndash valuesCoxrsquos Bazar
Value in MEB (takaHHmonth)
Non-food group
Toiletries and cleaning
Clothes shoes and towels
Cooking equipment
Education
Fuel and electricity
Medical treatment
Household textiles and small repairs
Communication
Transport
Total non-food
461
521
25
134
775
447
57
274
295
2990
Figure a Non-food basket ndash distribution Coxrsquos Bazar
Note The MEB for Coxrsquos Bazar was calculated for
analytical purposes in the REVA II assessment
It is not the operational MEB for the district
9Communication
10Transport
2Householdtextiles and
small repairs
15Medical
treatment
26Fuel andelectricity
5Education
1Cooking
equipment
17Clothes shoes
and towels
15Toiletries
and cleaning
EXPENDITURE-BASED NON-FOOD REFERENCEBASKET EXAMPLE FROM COXrsquoS BAZAR
Box 10EG
to the cost of the food basket to arrive at the total MEB
However when using an additional data source analysts
should understand how the average share of non-food
expenditures has been calculated and what sample it has
been derived from as it may not reflect the consumption
patterns of the reference cohort
30 The WHO and Global Health Cluster guidance on health expenditures in the MEB has some useful insights into household health expenditures See WHO and Global Health Cluster ndash Cash Task Team 2020 31 Deaton and Zaidi 2002
21
Minimum Expenditure Baskets Guidance Note | December 2020
52 The rights-based approachIn humanitarian contexts ldquoessential needsrdquo have been
understood as referring to access to full rights as set out by
international humanitarian law and the Humanitarian Sphere
Standards The term ldquorights-based MEBrdquo is derived from
this understanding According to the operational guidance
on multipurpose cash grants32 international humanitarian
and human rights law protects the right of crisis-affected
persons to food33 drinking water soap clothing shelter and
lifesaving medical care Humanitarian Sphere Standards
builds on this definition and outlines minimum humanitarian
standards in the areas of food security and nutrition
shelter and settlement health and WASH (water supply
sanitation and hygiene)34 In some contexts residency or legal
documentation is also included Humanitarian standards
for education are outlined in the Education in Emergencies
Minimum Standards Handbook35
The rights-based approach entails defining a detailed list
of the food and non-food items that make up the MEB
reference basket and pricing them using current market
prices MEBs built by the Interagency Cash Working Group or
other interagency coordination forum are often constructed
following the rights-based approach with each sector or
cluster contributing to the needs in their respective sectors
In these cases WFP is usually responsible for defining the
food component of the MEB For both food and non-food
items the reference basket is typically produced or cross-
checked through focus group discussions with the population
of interest partners and key informants It is usually put
together based on the needs of an average-sized household
1 Establish the food basketTo construct the food basket for a rights-based MEB compile
a list of food items and their quantities The Sphere Standards
offer a useful starting point recommending a diet of 2100
kcal per person per day with 10ndash12 percent of daily energy
intake from protein and 17 percent from fats36 The food
basket should be adapted to local diets and preferences
2 Establish the non-food basketOnce the food basket has been established a non-food basket
should be added In the rights-based approach this is typically
done by quantifying needs by producing a list of items by
sector Some examples are found below
Shelter This is the cost of accommodation that meets
basic shelter needs and rights What this means in practice
will depend on the context driven for example by weather
conditions and what is realistically available to the population
Utilities These include the cost of basic utilities such as safe
drinking water and depending on the context electricity
Non-food items These reflect basic household needs
related to cooking clothing and hygiene plus other general
household items Cooking gasfuel or firewood is often
included In line with the definition of the MEB the list should
focus on recurrent needs In practice these non-food items
can look very different depending on the context 38
Services This includes the costs of accessing basic services
such as healthcare education transport and communication
Healthcare costs are often difficult to quantify since they
are inherently irregular large and unpredictable Typically
however only basic minimum needs are covered in the MEB
such as eg two visits per year to the doctor expenses for
critical events deliveries and medicines are sometimes also
included Note that even if a need is not covered by the MEB
it does not mean that these needs do not need to be met for
the population of interest Health can be an example of this
health needs are often better met through service provision
than purchased through the market and therefore may
be only partially reflected in the MEB However guidance
from WHO and the Global Health Cluster notes that people
tend to have some level of health expenditures even when
COUNTRYEXAMPLE
SHELTER IN THE MEBFOR SYRIAN REFUGEES
EG Box 11
For the Syrian refugee operation in Turkey the MEB
includes the costs of shelter that meets certain
standards such as a minimum of 35 m2 per
person access to a toilet and running water
32 UNHCR et al 2015 33 Defined as energy needs not considering full nutrient needs (protein vitamins minerals etc) 34 See the Sphere Standards Handbook 35 INEE 2010 36 Further recommendations on micronutrient requirements can be found in the Sphere Standards Handbook37 Hobbs 201638 For some refugee contexts the Office of the United Nations High Commissioner for Refugees (UNHCR) has lists of specific items which can be considered for the MEB
22
Minimum Expenditure Baskets Guidance Note | December 2020
policies are in place that require the free public provision of
health services39
Education costs usually cover school fees materials
uniforms and transport depending on what households
have to pay themselves and what is publicly available
Transport and communication needs are often defined as
the average transport and communication costs reported by
household surveys and then validated with the communities
COUNTRYEXAMPLE
EXAMPLE OF A RIGHTS-BASED MEBFOR NORTHEAST NIGERIA
Box 12EG
The northeast Nigeria cash working group designed a MEB for a household of seven people40 the resulting reference
basket is shown below
Sectorgroup
Item Quantity(7 pers HH)
Sectorgroup
Item Quantity(7 pers HH)
Cooking fuel
WASH
Cooking fuel
WASH
Transportation
Communication
Health
Education
Firewoodbriquette
charcoal
Water + vendor fee
Bathing soap
Laundry soap
Sanitary pads
Firewoodbriquette
charcoal
Water + vendor fee
Bathing soap
Laundry soap
Sanitary pads
Rides
Airtime 500 NGN
Average expense
Pen
Pencil
Notebook
1 bag
158 jerrycans
13 bars
3 bars
4 packs
1 bag
158 jerrycans
13 bars
3 bars
4 packs
10 rides
1
7 pers
3 pcs
3 pcs
3 pcs
Table a MEB example northeast Nigeria
27 kg
45 kg
135 kg
18 L
27 kg
18 kg
36 L
09 kg
144 kg
2 kg
2 kg
1 kg
05 kg
12pcs
1L
Food Rice
Maize
Beans
Palm oil
Groundnuts
Sugar
Vegetable oil
Salt
Onion
Non-leafy vegetables
Leafy vegetables
Fruits
Meats
Chicken eggs
Vinegar
communication needs can also be specified as the cost of a
SIM card with a certain amount of data or airtime
3 Price the reference basketWith the food and non-food reference baskets established
the list of items and quantities are now priced using updated
prices from markets relevant to the population of interest
The pricing should be done based on actual current market
prices This produces the final rights-based MEB
39 WHO and Global Health Cluster ndash Cash Task Team 2020 40 Cash Working Group Nigeria 2018
23
Minimum Expenditure Baskets Guidance Note | December 2020
MEB APPROACHES ndash CONSTRUCTION SUMMARYBox 13
HOW TO
Rights-based approach
Establish the food basket
Define a list of relevant and locally preferred and
available food items and their quantities The Sphere
Standards can be used as a reference
Establish the non-food basket
Define a list of essential non-food items relevant to the
population of interest and their quantities Services such
as education or transport can also be included The list is
usually put together sector by sector
Price the basket
Use current market prices for the food and non-food
items in the reference baskets to calculate the price of
the basket Use prices from markets relevant to the
population of interest
1
2
3
4
1
2
3
Expenditure-based approach
Prepare the expenditure data
Ensure the data is cleaned Compute expenditures by
combining cash and credit expenditures the value of
consumed own production and consumed assistance
for both food and non-food expenditures Compute
expenditures as per capita figures
Select the reference cohort
Identify households ldquojust able to meet their essential
needsrdquo using indicators such as FCS FCS-N housing or
others excluding households in extreme quantiles of
expenditure distribution or other criteria or
combination of criteria Check the sensitivity of the
results to the selection of reference cohort
Establish the food basket
Calculate mean (median) food expenditures by food
group or item Either stop here or ndash to obtain a refence
basket ndash estimate consumed quantities check the
calorie content of the resulting quantities and consider
scaling them to Sphere Standards Price the basket
using market prices or prices derived from the
household data
Establish the non-food basket
Calculate mean (median) non-food expenditures by
non-food group or item If item-level data and prices
are available it is possible to derive a non-food
reference basket using same methodology as for the
food basket otherwise the non-food basket will
comprise the expenditures at the group level If a
quick-fix solution is needed add the average household
non-food expenditure share to the food MEB
53 Summary and data needs for expenditurendashbased and rights-based approachesBox 13 summarizes the steps to follow in order to construct a
MEB using an expenditure-based or a rights-based approach
24
Minimum Expenditure Baskets Guidance Note | December 2020
Qualitative understanding
of essential needs for the
population of interest
Representative household
survey with detailed
expenditure module
List of ldquorights-basedrdquo needs
Price information
Focus group discussions with key informants or population
of interest
Literature review of existing information on the essential needs of
the population of interest
WFP essential needs assessment emergency food security
assessment or comprehensive food security and vulnerability
analysis or other representative pre-assistance baseline survey
National household budget surveys household income and
expenditure surveys living standard measurement surveys or
other large-scale household survey
Clusters Cash Working Group other interagency forum
Sectoral assessments other secondary information
Price data series covering the area of interest for relevant food
and non-food items and services from WFP (Dataviz41 has
up-to-date price information) or partners
Price indices from national statistical offices
Prices derived from household expenditure data where quantities
are also reported
Suggested sources Expe
ndit
urendash
base
d
Righ
tsndashb
ased
INFORMATION NEEDS AND SOURCESMEB APPROACHES
Box 14
HOW TO
Information need
TIP BOXWHAT IF DATA USINGA HOUSEHOLD ECONOMY APPROACH IS AVAILABLE
$Box 15
The household economy approach (HEA) developed by Save The Children is commonly used for analysing food security and
livelihoods It is based on understanding how households normally access income food and other itemsservices required
for survival established through a baseline analysis As part of the baseline the HEA defines livelihood zones where
households share similar strategies for obtaining food and income It also distinguishes households within these livelihood
zones in at least three (often four and sometimes more) wealth groups The HEA baseline quantifies the sources of food
and income and the expenditure patterns for each wealth group and livelihood zone
The information collected on expenditures can be used as a data source for calculating a MEB However due to the relative
nature of the wealth cut-off points used there is no set standard regarding which group should be the reference for the
MEB If HEA data is utilized it is important to understand how it was collected ndash the HEA is simply an analytical framework
not a set method of data collection Thus while HEAs are often conducted through qualitative methods (eg focus group
discussions) they may also be based on quantitative modules in household surveys The latter yields more rigorous
information however qualitative data can be used but should be cross-checked or triangulated with other sources
39 See VAM data portal at httpsdatavizvamwfporg
25
Minimum Expenditure Baskets Guidance Note | December 2020
54 Expenditure-based or rightsndashbased approach Pros and consThere are advantages and disadvantages to both types of
approach which should be kept in mind when constructing
the MEB
The expenditure-based approach has the advantage that it
directly reflects the actual demand of the population of interest
as it uses survey data to examine peoplersquos consumption
behaviour It is also fairly straightforward to carry out if good
survey data on the population is available One disadvantage is
that it can be difficult to put into practice when the population
of interest is generally poor (such as in a pre-assistance
refugee situation) because the number of households who can
constitute the reference cohort can be too small to analyse
Also care has to be taken when looking at expenditure patterns
only as the reference cohort may not always cover all of their
essential needs to a desired level (from a ldquorightsrdquo perspective)
For example the food patterns for those ldquojust able to meet
their essential needsrdquo may not always be very nutritionally
diverse as they are based purely on consumption behaviour42
In general the expenditure-based approach should not be applied
without good quality household expenditure data
TIP BOX ADVANTAGES AND DISADVANTAGES OFDIFFERENT APPROACHES TO ESTABLISHING MEBS
Box 16
Pros
Cons
Expenditure-based Rights-based
Straightforward to carry out if household data
is of good quality
Builds on actual consumption patterns of the
population of interest
Difficult to identify reference cohort if
everybody is poor
Survey data may not capture all essential needs
fully from a ldquorightsrdquo perspective
Survey data is not needed
Effective demand can be different from identified
needs leading to a MEB that does not reflect
actual demand and making comparison with
monitoring data tricky
Contains incentives to inflate sector-specific needs
The advantage of the rights-based approach is that
it can be used to construct a MEB without survey data
(although survey data is needed to monitor the MEB) One
disadvantage is that the effective demand of households
can look quite different from the basket that results from
this approach Another disadvantage is that particularly
when constructed in an interagency setting a rights-based
MEB can easily become an instrument for different partners
to compete for and secure funding There is a substantial
incentive to include excessively high sectoral needs if sector-
specific interventions are envisaged Finally if the MEB is
very detailed but the expenditure module in the household
surveys used to monitor peoplersquos expenditures against the
MEB is very crude comparison is difficult and therefore the
practical use of the MEB can be limited Many households
may fall below the MEB simply because of the discrepancy in
methods between the MEB and the monitoring data This is
similar to the issue previously discussed regarding the use of
national poverty lines
Box 16 summarizes the advantages and disadvantages of the
two approaches
42 A study conducted in Nepal showed that the food poverty line is well below the so-called ldquonutrient povertyrdquo line (see Geniez et al 2014)
26
Minimum Expenditure Baskets Guidance Note | December 2020
6 Arriving at a realistic and operationally relevant MEBRegardless of which processes and approaches are used to
construct the MEB it is crucial to arrive at a final result that
is a realistic picture of the cost of essential needs for the
population of interest rooted in actual consumption
behaviour This section looks at how approaches can be
combined to generate a hybrid MEB and how the result can be
ldquoreality checkedrdquo and validated
61 Combining approaches the hybrid MEBAs described in section 54 there are disadvantages to the
expenditure-based and the rights-based MEB approaches that
can affect the final MEB One way to overcome this challenge
may be to combine information from each approach in
a ldquohybridrdquo MEB This means making sure that the MEB is
consistent with the actual consumption behaviour of the
population of interest as found in expenditure data while
keeping the rights-based lens There is no one way to go about
this the method is subject to the availability of expenditure
data and other information on essential needs as well as the
objective of the MEB
When good quality expenditure data with a large enough
sample size is available for constructing the MEB it is good
practice to use the expenditure-based approach as a basis
for the analysis as far as possible If the expenditures of
the reference cohort are subsequently found not to reflect the
costs of covering certain essential needs for the population of
interest rights-based information should be used to reinforce
the MEB with a hybrid model If expenditure data is not
available and cannot be collected a rights-based MEB can be
constructed but should be cross-checked against any available
household-level information on consumption patterns
When starting with the construction ofan expenditure-based MEB
Did the household survey capture all essential needs or
are some not included in the data at all
If some needs are wholly overlooked consider using
rights-based information to capture them but ensure these
needs are actually in demand by the population of interest
and only missing because the survey did not capture them
Are the expenditures that are typically trickier to capture
well reflected and are the reference cohortrsquos expenditures
on them adequate from a rights-based perspective
For example if education expenditures are completely
inadequate for the reference cohort (and this is not because
the reference cohort selected is ldquotoo poorrdquo) consider using
rights-based information to capture them eg by using the
cost of school fees or school supplies like books or
uniforms
Be particularly careful with the inclusion of needs where the
supply of goods or services is far from adequate or may be
inexistent The MEB needs to ultimately reflect consumption
behaviour so adding goods or services that are not
available to the population of interest or not in demand
will lead to an unrealistic MEB
When starting with the construction ofrights-based MEB
Are the identified needs in line with the actual
consumption patterns of the population of interest
Check the reference baskets against any available
information on demand and consumption and adjust items
and quantities to reflect actual consumption patterns This
could be done using data on consumption shares by food
group and non-food group for example
Are there needs that people consider essential and choose
to spend resources on but are not captured by any sector
Check the reference baskets against any available
information on demand and consumption and adjust items
and quantities to reflect actual consumption patterns
The key to constructing a hybrid MEB lies in triangulating
information and asking the right questions during the
analysis When constructing a MEB consider the following
27
Minimum Expenditure Baskets Guidance Note | December 2020
Box 17 contains examples of hybrid MEBs constructed in different contexts
COUNTRYEXAMPLE
HYBRID MEBS IN URBAN SETTINGS IN KINSHASATHE DEMOCRATIC REPUBLIC OF THE CONGOAND FOR SYRIAN REFUGEES IN TURKEY
Box 17
For the MEB calculated as part of an urban assessment in Kinshasa43 a hybrid approach was chosen to deal with
hard-to-capture but essential expenditures such as health and education Health costs are often difficult to estimate as they
are not regular and when they do occur they often make up a large share of monthly expenditures The analysts decided to
estimate health costs through a rights-based approach instead of using expenditures from the survey Qualitative
information from key informants was used to define the cost of one doctorrsquos visit per year for each household member In
each commune the median cost was between CDF5000 and CDF6000 per visit this was represented in the MEB as
CDF500 per household member per month Over-the-counter medication was also included as part of health-related
expenditure through the addition of a per-capita expenditure of CDF1500 every two months sufficient for a course of
antimalarial drugs or antibiotics and simple medication such as painkillers or anti-inflammatory drugs
In Turkey expenditure and price data from different sources was used to assess update and adjust an existing
rights-based MEB44 for Syrian refugees living in the country A hybrid food basket was calculated using detailed information
on the consumption behaviour of Syrian refugees in Lebanon collected through itemized receipts from food assistance
e-cards The resulting food basket was triangulated with the less detailed information available from a household survey on
Syrian refugees in Turkey The results showed strong consistency between consumption behaviour of both groups
The resulting food reference basket for the MEB was then priced with official price statistics data and inserted into the
rights-based MEB Quantities of non-food items were kept as before but updated with current price data To ensure that
the MEB reflected consumption behaviour expenditure shares were triangulated with household data See table a
To value and update the MEB price data was required The official price statistics included higher quality items and brands
consumed more by the average Turkish population than by the poorer refugees To correct for this the difference between
the price of the MEB and the food expenditures of a non-poor cohort were assessed and a correction factor applied to
compensate for the overestimation of the updated MEB
Commodity
Table a Food reference basket ndash MEB for Syrian refugees in Turkey
Daily ration perperson in gram
Dailykilocalorie
Old referential food basketDaily ration perperson in gram
Dailykilocalorie
Revised Turkey food basket
150
200
50
20
30
40
20
8
30
30
5
0
0
0
0
540
684
186
29
65
137
0
28
116
265
0
0
0
0
0
100
50
0
70
0
50
30
50
50
25
5
250
50
30
5
Rice white medium grain
Bulghur wheat
Pasta
Egg whole chicken fresh
Poultry
Beans dried
Cucumber
Cheese canned
Sugar
Oil sunflower fortified
Salt iodised
Bread made from wheat
Yoghurt whole milk (leban)
Tomatoes red ripe
Tea black nutrients per 100ml of brewed tea
360
171
0
100
0
170
0
178
194
221
0
675
31
5
0
Total Kcal 2050 Total Kcal 2104
43 WFP et al 201844 WFP 2018
28
Minimum Expenditure Baskets Guidance Note | December 2020
62 Reality checks and validation with stakeholdersIn addition to asking the right questions of the data as
described in the previous section it is crucial to reality check
results when constructing the MEB This means understanding
whether the MEB provides a picture of the cost of living that
matches the reality on the ground
First of all it is important to check the MEB result with the
real circumstances of the population of interest Focus group
discussions andor key informant interviews can be held when
starting work on the MEB and after a result is obtained in
order to ensure that the MEB is a true reflection of needs and
priorities
The MEB figures can be compared with the national poverty
line ndash even if it is not advisable to use the poverty line directly
as the MEB it is good practice to check the MEB results against
it They can also be checked against any social assistance
transfer values provided in government programmes the
minimum wage or the casual labour rate or any other
information available about needs and cost of living For
instance if the MEB is much higher than what the wages
from one month of work for a typical household can buy
that could indicate that it needs adjustment and that some
of the analytical steps need to be revisited ndash as long as the
wage rate itself is reasonable The same goes for the poverty
line ndash if the two are very far apart it could be a sign that the
MEB analysis should be crosschecked Perhaps the reference
cohort was not adequately selected some sectoral needs were
overestimated or there is a large proportion of consumption of
own production has not been properly taken into account
Something that is often of particular interest is the nutritional
composition of the food part of the MEB As seen above MEB
construction typically starts from the Sphere requirement of
2100 kcalpersonday However since the MEB follows the
actual consumption behaviour of the population of interest
(especially when following an expenditure-based approach)
the resulting food basket reflects what households actually
eat which is not necessarily a nutrient adequate diet If the
basket is found to be very low in essential nutrients it could
be that the reference cohort was not well selected and a
wealthier cohort with a more balanced diet at the 2100 kcal
personday threshold might need to be identified45 However
selecting better-off households will not necessarily lead to a
more nutritionally balanced basket as food preferences are
influenced by a range of factors in addition to budget
Analytical tools to determine the cost of nutritious diets
include Cost of the Diet (CotD) developed by Save the Children
UK and used by WFP in the Fill the Nutrient Gap Analysis
CotD uses linear programming to establish the lowest cost
diet that can meet requirements for energy protein fat and
13 micronutrients for individuals in a population considering
age gender body weight physical activity level and whether
a woman is pregnant or breastfeeding CotD can be thought
of as the lowest cost of an optimal diet considering individual
requirements It is therefore useful in illustrating the needs
of vulnerable populations and their nutrient intake barriers
However it is important to keep in mind that a MEB food
basket may not deliver adequate nutrient intake when used
to set a transfer value for households even if aligned with
an optimal diet As noted above because of household
consumption choices and food allocation within households
having more money to spend may not necessarily lead
households to buy more nutritious food
MEBs should be first and foremost built on consumption
patterns that reflect actual behaviour A large difference in
cost between the MEB food basket and CoTD may hence
be driven by factors such as low availabilityhigh cost of
nutritious foods or household preferences The WFP technical
note on Fill the Nutrient Gap and minimum expenditure
baskets offers further insights into the complementarities
of the two analyses and how to use them on conjunction for
programming purposes46 When a MEB is operationalised
additional nutritional considerations could be necessary
It is important to check the MEB result with the real circumstances of the population of interest Focus group discussions andor key informant interviews can be held when starting work on the MEB and after a result is obtained in order to ensure that the MEB is a true reflection of needs and priorities
45 Note that the 2100 kcal Sphere Standard for daily diet is an estimate based on a population average Nutrient needs vary across the lifecycle It is also recommended that a food basket based on the 2100 kcal threshold should include a minimum of between four and five different food groups
46 Also see WFP 2020b
29
Minimum Expenditure Baskets Guidance Note | December 2020
COUNTRYEXAMPLE
TURKEY NON-FOODBASKET MEBCOMPOSITION VERSUSACTUAL CONSUMPTION
Box 18
In the original rights-based MEB constructed for the
Syrian refugee operation in Turkey 17 percent was
devoted to education expenditure The average
education expenditure share in the pre-assistance
expenditure data was under 2 percent with little
variation by household vulnerability status50 The
large expenditure share in the MEB reflects the
costs for transportation to schools in rural areas
where no buses are available and where the only
way for households to send children to school is to
hire private transport In order to provide for
childrenrsquos right to education the transport costs are
counted for in the MEB
Since the MEB was constructed to assure full access
to all rights the high education expenditure was
justified However a comparison of the theoretical
costs for basic needs as estimated by humanitarian
partners and the actual consumption choices of
households can reveal divergence Even if
households are assisted there is nothing to say that
they will actually start hiring private transport to get
their children to school ie the principal ldquoneedrdquo
identified by humanitarian actors will not necessary
translate into effective demand if the MEB is used as
a basis for transfer value calculations While an
important access problem has been identified other
complementary interventions will likely be needed
to address it
depending on the objective of a particular intervention and
the choices targeted households are likely to make regarding
food and nutrition once they receive a transfer Targeted
nutrition interventions may be needed such as providing
certain nutritious foods for specific groups (through in-kind
assistance or commodity vouchers) and social behavioural
change communication to nudge people towards making
better choices for health and nutrition47 Expenditure data can
be helpful to understand the consumption patterns of people
at different points of the wealth distribution Fill the Nutrient
Gap analysis also examines packages of blanket and targeted
household interventions to estimate the most cost-effective
way to address the nutrient requirements of different target
groups For further considerations including complementary
programming please consult the WFP interim guidance on
transfer values48
MEBs are often constructed in an interagency context such
as the Cash Working Group which helps facilitate dialogue
and validation from the beginning of the process However
sometimes not all clusters or key partners are engaged in such
forums which can limit the buy-in and understanding of the
MEB unless there is adequate consultation It is also essential
to consult government stakeholders and development
partners Endorsement by government counterparts could be
needed if there are existing government safety nets or policies
regarding minimum wages For example if the population of
interest for the MEB are refugees or IDPs and a transfer value
based on the MEB is higher than the social assistance provided
by the Government to the resident population this could be a
point of contention Development partners might also wonder
why a MEB is needed in addition to the national poverty line
Dialogue and validation of the final MEB with partners is
therefore vital49
47 The Fill the Nutrient Gap (FNG) analysis of which CotD is often part can help understand what programming might be needed and how interventions can be combined to improve dietary intake and reach food and nutrition objectives
48 WFP 2020c49 The Cash Learning Partnershiprsquos MEB Tip Sheet contains useful advice on the interagency processes around constructing a MEB Baizan and Klein 201950 Hobbs 2016 and WFP 2018
30
Minimum Expenditure Baskets Guidance Note | December 2020
Naturally the needs of a household increase with the size of
the household How can the different magnitude of needs
for households of different sizes be taken into account when
constructing the MEB
One simple approach is to calculate the per capita MEB
and simply scale it up for households of different sizes For
example if the MEB is constructed for a household of six and
equals USD 120 the per capita MEB would be USD 20 USD and
the MEB for a household of three people would be USD 60
However this proportional scaling ignores one important
factor while the needs of a household grow with each
additional member the increase may not be proportional
This is because some goods consumed within a household
such as food are ldquoprivateldquo in character ndash once a person has
consumed it no one else can consume the same ndash while other
goods such as housing are ldquocommonrdquo or ldquopublicrdquo meaning they
can be shared among household members Hence the needs
for housing space or electricity are not necessarily three times
higher for a household with three members than for a single-
person household This is called economies of scale Changes
in household composition can also influence how needs
grow with household size consider large households with
many children who do not have the same needs as adults
Economies of scale are particularly relevant in contexts where
shared goods constitute a major part of household essential
needs for example where rent payment is a large expense A
one-bedroom apartment may be necessary for a one-person
household but could also possibly house a family of three
who would then share the expenditure When in a context of
large economies of scale the MEB is adjusted to household
size by scaling up average per capita needs proportionally
to household size the resulting MEB will underestimate
the needs for small households and overestimate the
needs for large households by construction This is because
the per capita needs for small households are larger than
this simple scaling reflects This can have implications if the
per capita MEB is used to inform targeting or transfer value
calculations For instance if the needs of smaller households
are underestimated they are more likely to be miscategorized
as being able to meet their essential needs and might therefore
not receive the assistance they require
7 Accounting for household composition and economies of scale
Expenditures
Household sizeno economies of scale expenditures proportional to household sizeeconomies of scale expenditures non-proportional to household size
1 2 3 4 5 6 7 8 9 10
EXPENDITURES PER CAPITA
Figure 3 Economies of scale and expenditures per capita ndash illustration of the concept
31
Minimum Expenditure Baskets Guidance Note | December 2020
In other contexts economies of scale might be smaller
because of the higher relative importance of ldquoprivaterdquo goods
such as food and certain non-food items (for example soap)
or if shared costs such as shelter are not prominent How
household size is catered for in the MEB ultimately depends
on context and how needs are related to household size
Some suggested steps to account for economies of scale and
household composition are listed below
When examining how to account for different household
sizes in the MEB start by ascertaining whether economies
of scale exist and to which extent51 Figure 3 provides a
hypothetical illustration of two extreme cases no economies
of scale at all and strong economies of scale If there are no or
little economies of scale the per capita expenditures will be
very similar across household sizes while they will decrease
by household size if economies of scale are present52
Plotting per capita expenditures against household size
helps enable for this type of examinations It can be useful
to further disaggregate the analysis into different categories
(for instance food non-food or shelter expenditures per
capita) to understand which expenditures might be driving the
economies of scale if present
Box 19 illustrates two different country examples
expenditures by household size for Syrian refugees in
Lebanon and for vulnerable populations in Coxrsquos Bazar
Bangladesh In Lebanon where shelter plays an important
role household expenditures double only at a household size
of 5 and they triple at a household size of 11
COUNTRYEXAMPLE
ECONOMIES OF SCALE INLEBANON AND COXrsquoS BAZAR
Box 19
Figure a shows expenditures by household size compared to one-person households For Syrian refugees in Lebanon
average expenditure doubles only when the household size reaches five and it takes 11 members to triple the expenditures
of a one-person household The economies of scale are therefore large primarily due to the importance of shelter costs for
the refugees
In Coxrsquos Bazar in contrast total expenditures grow almost proportionally with household size (double at a two-person
household triple at a three-person household) Slight economies of scale can be seen for food For non-food expenditures
larger households even spent more per person From this data the economies of scale seem to be small
Figure a Increase in household expenditure by household size comparedto one-person households
Multiplicationfactor
Household sizeHousehold size
100
90
80
70
60
50
40
30
20
10
Coxrsquos Bazar (Bangladesh)Lebanon
1 2 3 4 5 6 7 8 9 10 11
Total Food Non-food
1 2 3 4 5 6 7 8 9 10 11
Note Figure based on authorsrsquo calculations Data from the Vulnerability Assessment of Syrian Refugees in Lebanon (VaSyr) 2017
and the Refugee influx Emergency Vulnerability Assessment (REVA II) 2019
51 Expenditure data is required to perform this analysis If no information on expenditure exists information on how needs change with household size can be collected through qualitative means such as focus group discussions or key informant interviews
52 Theoretically it is possible to also analyse expenditures by household composition but sample sizes rarely allow for such detailed disaggregation
32
Minimum Expenditure Baskets Guidance Note | December 2020
If the analysis reveals small economies of scale or none at all it is reasonable to use a per capita approach to scale up the MEB proportional to household size
Even for food strong economies of scale can be detected
which could be a result of large households being able to
buy food in bulk at a lower price However in Coxrsquos Bazar
where shelter and other shareable non-food goods are of less
importance household expenditures are close to proportional
to household size
If the analysis reveals small economies of scale or none at all
it is reasonable to use a per capita approach to scale up the
MEB proportional to household size If significant economies
of scale are present it is important to think about how to
take this into account when constructing the MEB Here are
some suggestions
One possible solution (in the expenditure-based
approach) is to disaggregate (or re-select see below)
the reference cohort for each household size sub-
sample and using the expenditures for each of these
cohorts construct specific MEBs for each household
size53 This approach takes into account economies of
scale by looking directly at the specific needs of different
size households but only reflects average differences
in household composition within each household size
The approach will most likely suffer from very small
sample sizes once analysis needs to be performed by
household size If this is the case household sizes could
be grouped into categories so that the analysis uses sub-
samples eg for household sizes 1ndash2 3ndash5 and 6ndash8 etc
or other groupings meaningful for the context When
following this approach bear in mind that if the reference
cohort is selected based on expenditure distribution
characteristics such as the removal of extreme deciles or
quintiles this procedure of removal of quintiles or deciles
needs to be repeated within each household size (or
household size group) Otherwise if there are economies
of scale for consumption there is a risk of skewing the
sample against the smallest and largest households
because their per-capita expenditures will be at the
extreme ends of the expenditure distribution
Another solution is to divide the MEB content into
ldquoprivaterdquo (non-shared) and ldquopublicrdquo (shared) consumption
For example food could be non-shared and rent and
fuel shared Examine the MEB expenditures for the
non-shared and shared goods for an average sized
household (or for household sizes around the average
for instance 4ndash6 members in order to leverage a larger
share of the sample) The non-shared value can then be
scaled proportionally to household size while the shared
value is held constant across household sizes This way
the resulting MEB consists of a lsquoflatrsquo and a proportional
element54 This is a relatively crude but intuitive way to
approximate economies of scale Figure 4 provides a
simple illustration of this approach
In the literature on poverty the most common solution
used to adjust for economies of scale and difference
in household composition is to use adult equivalents
instead of per capita numbers These equivalence scales
assign an ldquoadult equivalent numberrdquo to each household
depending on its size and composition taking into
account economies of scale as well as the different needs
of children and adults ie household composition For
example the first adult in the household is counted
as 1 and each additional adult as for example 07 A
child under 15 is counted as a fraction of an adult (eg
05) The effective adult equivalent household size is
then the sum of these adult-equivalent fractions55 Next
total household expenditures are divided by the adult
equivalent household size The MEB is then calculated
using these adjusted per-adult-equivalent expenditures
While this is not necessarily a complicated approach
from an analytical point of view equivalence scales can
53 See Lanjouw (1998) on the construction of poverty lines specific to household size (and composition)53 Alternatively the flat element can also be lsquosemi-flatrsquo and set according to household size groups ndashby examining shared costs and applying the same flat value within eg household size groups 1-2 3-5 6-8 or other
groupings as dictated by the context 53 One common equivalence scale is the OECD scale it assigns the weight 1 to the household head 07 to all additional adults and 05 to all children A household with five people say two adults and three children
consists of 32 adult equivalents (1+07+05+05+05) This is a common scale used in many developing and developed countries Another common scale is to give weight 1 to each adult and different weights to children depending on their age For the official poverty line in Zambia the following weights are given to children 0ndash3 years 036 4ndash6 years 062 7ndash9 years 076 and 10ndash12 years 078
33
Minimum Expenditure Baskets Guidance Note | December 2020
MEB - COMBINING FLAT ANDPROPORTIONAL ELEMENTS -ILLUSTRATION
MEB value
Household size
1 2 3 4 5 6 7 8 9
140
120
100
80
60
40
20
0
Proportional element - non-shared part of MEB
Flat element - shared part of MEB
MEB value per capita
Figure 4 Combining flat and proportional elements in the MEB
prove challenging when operationalising the MEB If
equivalence scales are used in constructing the MEB they
will also need to be applied when measuring household
expenditures compared with the MEB for gap analysis
against the MEB and in monitoring Translating the
concept of equivalence scaling into operational decision
making may therefore prove tricky Additionally results
can be quite sensitive to the choice of equivalence scales
so selecting appropriate scales is important yet often not
straightforward and a range of different scales exist56 In
some countries country-specific equivalence scales may
have been devised for the purpose of the calculation of
the national poverty line
No matter the approach the recommendation is always
to leverage data analysis as much as possible in order
to understand how needs evolve with household size
(and possibly composition) while keeping in mind that
the final MEB needs to be operationally relevant
Particularly in the (common) cases where MEBs are
used to calculate household transfer values it is worth
considering what level of analytical granularity can
feasibly be turned into programmatic action In some
cases it may not be operationally possible to handle
different per-capita size transfers for differently sized
households and the extra effort of achieving accurate
MEB figures by household size may not be worth it
The same general recommendation as for all aspects
of MEB construction also applies here the final result
should be realistic a fair depiction of needs and an
operationally relevant product
56 See for instance httpwwwoecdorgeconomygrowthOECD-Note-EquivalenceScalespdf
34
Minimum Expenditure Baskets Guidance Note | December 2020
A SMEB can be expenditure-based or rights-based or a hybrid of the two approaches depending on data availability and programmatic requirements
The SMEB is the absolute minimum amount required to maintain existence and cover lifesaving needs which could involve the deprivation of certain human rights
A survival minimum expenditure basket (SMEB) is often
constructed alongside a MEB While the MEB is defined as
what a household requires in order to meet their essential
needs on a regular or seasonal basis and its average cost the
SMEB is the absolute minimum amount required to maintain
existence and cover lifesaving needs which could involve the
deprivation of certain human rights However the concepts
of SMEB and MEB have not always been used consistently
by the humanitarian community and are sometimes used
interchangeably It is therefore important to be clear from the
outset of the analysis whether a MEB or a SMEB is the goal
A SMEB can serve at least two purposes First together with
the MEB it can be used to classify households into different
categories of economic capacity to meet their needs whereby
households whose expenditures fall below the SMEB have
highly insufficient economic capacity households between the
SMEB and the MEB have insufficient economic capacity and
households above the MEB have sufficient economic capacity
This information can then be used for profiling people in need
prioritizing beneficiaries or monitoring Second the SMEB
can inform programmatic decisions such as transfer values in
situations where immediate lifesaving assistance is required
The approaches presented here follow the MEB methods
adjusted to suit the different purpose of the SMEB
Accordingly a SMEB can be expenditure-based or rights-
based or a hybrid of the two approaches depending on data
availability and programmatic requirements
8 How to construct a SMEBExpenditure-based approach toconstructing a SMEBThe calculation of an expenditure-based SMEB is closely aligned
with the literature on how to estimate national poverty lines
While the MEB corresponds to an ldquoupperrdquo poverty line a ldquolowerrdquo
extreme or austere poverty line is often defined by taking the
food part of a MEB and adding this to the non-food needs
regarded as the essential minimum for household survival57
But how are survival non-food needs defined based on
expenditure data When people receive assistance it is
sometimes observed that households sell part of their food
rations to cover some non-food items These households forgo
some of the required food intake in order to cover what they
regard as survival non-food needs Using expenditure data to
construct a SMEB a similar idea is explored to calculate the
SMEB analysts identify those households whose total food AND
non-food expenditures are approximately equal to the MEB food
basket amount only In order to access non-food items these
households will compromise their food intake to some extent
because their total expenditures would only be enough to cover
their essential food requirements ie the food MEB anything
spent on non-food items means that they are not meeting their
essential food requirements It is therefore fair to assume that
the amount they choose to spend on non-food items must
be regarded by the households as absolutely necessary The
non-food expenditures of these households can therefore be
considered as the survival non-food needs The SMEB is then
calculated by adding these survival non-food expenditures
to the food MEB This SMEB allows households to meet their
essential food needs and their survival non-food consumption
Note that this approach requires a food MEB figure (either
already available or calculated as part of the SMEB analysis)
57 See Lanjouw 1998 and Haughton and Khandker 2009
35
Minimum Expenditure Baskets Guidance Note | December 2020
The steps for constructing an expenditure-based SMEB are
similar to those taken to construct a MEB with the following
additional considerations
1 Prepare expenditure data the expenditure data source can
be the same as that used for the MEB
2 Select the reference cohort this step is different The cohort
is selected by computing total household expenditures
and comparing them to the food MEB Households with
total expenditures equal to (or in an interval around) the
food MEB are selected as the SMEB reference cohort
3 Establish food basket and 4) Establish non-food basket
Using the SMEB reference cohort start by examining
how much these households spend on non-food items
Add this value to the MEB food value to arrive at the total
value of the SMEB To establish a food and non-food
basket there are two options i) use the MEB food basket
as the SMEB food basket and the non-food expenditures
of the SMEB reference cohort as the non-food basket
or ii) look at a third cohort of households namely those
whose total expenditures are around the just established
total SMEB level examine their food and non-food
expenditures and unpack those into food and non-food
baskets While both options will provide the same overall
value of the SMEB they will differ in composition and the
share of foodnon-food expenditures
Annex 2 provides an illustration of this method of constructing
a SMEB
Rights-based approach to constructing a SMEBThe rights-based approach to constructing a SMEB closely
follows the rights-based approach to constructing a MEB The
main difference is that needs and the items and quantities
included should be restricted to what is regarded as absolutely
necessary for survival ndash which can be challenging to define
This applies to both the food basket and the non-food
basket The MEB can be a starting point if there is one or
the Sphere Standards Sometimes rights-based SMEBs have
been constructed based on a MEB but with lower quantities
for certain items or by keeping some needs while removing
others
Hybrid SMEBs and reality checking resultsAs with MEBs it can be advantageous to combine the
expenditure-based and rights-based approaches to create
a hybrid SMEB The guiding principles are the same as for
the MEB with the difference that the resulting SMEB should
continue to contain nothing but the minimum required for
survival
The same logic applies to the ldquoreality checkrdquo of the SMEB
results as for the MEB it is crucial to ensure that the end
result is realistic and operationally relevant bearing in mind
the conceptual difference between the MEB and the SMEB It
is important to consult the population of interest as much as
possible to understand their views on what constitutes the
bare minimum needed by households to maintain existence
and cover lifesaving needs
COUNTRYEXAMPLE
RIGHTS-BASED SMEBS Box 20
In Lebanon health and education are excluded
from the rights-based SMEB while other needs are
covered with smaller amounts than in the MEB For
example the SMEB has a less diverse food basket
than the MEB58
In Syria the SMEB developed for the northern part
of the country includes food kerosene hygiene
products water and a small amount to cover other
survival goods Rent and utilities are not covered59
58 El Koury and Hajal 201659 Cash Based Responses Technical Working Group Syria 2014
36
Minimum Expenditure Baskets Guidance Note | December 2020
COUNTRYEXAMPLE
HYBRID SMEBs Box 21
For the MEB review in Lebanon for Syrian refugees60 a hybrid SMEB approach was chosen First an expenditure-based
SMEB was used calculating the non-food expenditures of households whose total expenditures equalled the food MEB
and adding this to the food MEB This resulted in very low expenditures on shelter (SMEB A) Due to the importance of
shelter in urban settings a second hybrid version was established calculating the non-food expenditures of households
whose total expenditures equalled the sum of the food MEB plus a rights-based value of a tent as survival shelter the cost
of which came from a rights-based SMEB (SMEB B)
Cohort HH size 4ndash6quint 2ndash4 acceptable FCS
n=923
Cohort total expenditure= food MEB
n=923210
Cohort total expenditure= food MEB + tent value
n=923210
SMEB Afood + survivalnon-food
Hybrid SMEB
437
83
40
93
20
16
29
19
314
1033
437
43
18
37
06
04
17
60
621
437
47
24
42
11
06
20
162
750
Food
Utilities (water gas fuel electricity)
Non-food items (hygiene clothing)
Health
Education
Transport
Communication
Other expenditures
Shelter
Total (USD)
Table a Hybrid SMEB for Syrian refugees
SMEB Bfood + survivalnon-food amp tent
In the Kinshasa urban assessment61 a SMEB was established in addition to the MEB comprising a basket of the most
essential items based on expenditure data used for the MEB For the food SMEB a less diverse diet was established by
excluding certain food items from the food MEB and rescaling the resulting basket to 2100 kcal For the non-food
component the only items included were those that were seen as critical to attaining the most basic standards for safety
food preparation water sanitation and hygiene These consisted of water cooking fuel hygiene products and lighting The
value for these items in the SMEB was derived from the median expenditures of the non-poor cohort
Expenditure-basedMEB
Expenditure-basedSMEB
60 Hohfeld et al 2020 61 WFP et al 2018
37
Minimum Expenditure Baskets Guidance Note | December 2020
91 Adjustment for seasonal or regional price differencesIf the MEB will only be used in one area where prices are
relatively homogenous it is often not necessary to adjust for
regional price differences However if the MEB is intended
for use across different urbanperi-urban andor rural
areas throughout the country it could be vital to adjust for
differences This means that the MEB can be priced differently
for different regions or rural or urbanperi-urban areas (or any
other division of areas that makes sense in relation to price
behaviour) There are a few approaches for this
Price the MEB based on available price data for different
regions or urbanrural areas For the food reference
basket this is most often possible using WFP food prices
or other similar price time series For non-food items
including housing utilities and services this can be more
challenging and may rely on price data collection by
different partners or require new data collection
For some countries price data provided by the national
statistical office is useful In the case of Turkey regional
purchasing power parity indices were used to provide
price estimates for components of the MEB for which
direct price information was not available
Use approximations from expenditure data If the
household survey has sufficient regional coverage the
expenditure levels in different regions can be explored
using the cohort of households just above the poverty
line Care should be taken in using this method
particularly if the sample size by region is very small
9 Additional considerations when constructing MEBs
92 Needs that vary by season or areaIn many countries where WFP works household needs change
with the seasons For instance in Turkey where winters are
cold households have additional needs for heating and warm
clothes to survive In other contexts there are significant
differences in needs between lean and rainy seasons These
changing needs could be a reason to construct different MEB
reference baskets to use at different times during the year or
to design seasonal top-ups In the case of items needed for cold
winters this is often referred to as ldquowinterizationrdquo
While this does not influence the approach used to construct
the MEB it does mean that analysts need to consider when
the data used in its construction was collected and whether
this influences the resulting MEB These considerations also
matter when using the MEB for monitoring if a monitoring
expenditure survey is used to analyse whether peoplersquos
expenditures are above or below the MEB threshold but
the survey is undertaken when prices are high or when
winters are cold if the MEB is not adjusted the results will
probably show a decrease in the percentage of people whose
expenditures are below the MEB as households have higher
needs andor are confronted with higher prices and thus
have higher expenditures without in reality being better off
In Turkey it was estimated that household needs during the
winter would result in a 48 percent increase in minimum
expenditures
In other cases different baskets might be necessary
for different areas of the country eg rural and urban
areas While the MEB should be constructed for a relatively
homogenous population it may sometimes be desirable to
construct a MEB covering all or most of a country where
consumption patterns vary substantially In this case it is
worth considering whether (some elements of) the MEB should
be different between areas Again the selected approach to
construct the MEB should not change but analysts need to
check where the data used in its construction was collected
and whether consumption patterns are very different between
different regionsareas For example in the case of Somalia
the main cereal consumed varies significantly between the
north and the south of the country so the MEB uses different
main cereals in the food reference basket according to region
While the MEB should be constructed for a relatively homogenous population it may sometimes be desirable to construct a MEB covering all or most of a country where consumption patterns vary substantially
38
Minimum Expenditure Baskets Guidance Note | December 2020
Constructing a MEB can be challenging in a sudden onset
emergency or if data is scarce or unavailable Below are some
ideas on how this can be resolved However from a ldquodo no
harmrdquo perspective it is important to emphasize that proxies
should only be used in the interim when no other solutions are
available
Use the national MEB or MEB reference basket If survey
data is not directly available and if the population of
interest is part of and similar to the overall population of
the country the national MEB or MEB reference basket
used for the national poverty line can be used if available
Bear in mind however that this basket should be used on
the condition that it corresponds to data that WFP collects
or has access to through partners or the Government to
ensure that monitoring can be conducted against the MEB
In its most basic form a MEB essentially only requires an
approximate value for the food basket and an estimate
of the average expenditure share that households use
on food Even if no relevant survey data is available this
information should be available to a country office or can
rapidly be collected or approximated
Consider using the minimum wage as a proxy Bear in
mind that while the MEB captures household-level needs
the minimum wage is individual-level income so an
assessment of how many minimum wages are needed per
household depending on the household size is required
It is also advisable to find out how the minimum wage has
been constructed
Ultimately a MEB is a good preparedness measure and should
be constructed before an emergency While both prices and
availability will be affected by an emergency it is still likely to
provide a useful starting point
11 Monitoring and updating the MEB111 Monitoring the cost of the MEBTo be operationally useful the MEB must be tracked and
updated over time to account for price changes If inflation is
high this might have to be done every month if it is low as
little as once a year could be sufficient This should be planned
for when the MEB is constructed to ensure that the costs of the
MEB components can be updated
There are different ways to update the MEB with price changes
If a reference basket is adequately defined (for food
and for non-food items) and prices are collected for the
individual items in the basket by WFP or its partners the
MEB can be priced anew using the updated prices for
each item and multiplying them by the quantities in the
reference basket
A simple solution is to adjust the MEB using the
nationalsub-national CPI or its components This
simply involves updating the cost of the MEB with
the increase (or decrease) in the CPI for the period
in question However in some contexts CPIs are not
updated or relevant for the target population Urban
areas are often over-represented in the national CPI on
the other hand prices and costs faced by for example
displaced populations can be very different from national
price levels In contexts of poverty where food constitutes
a large part of household expenditures the evolution of
food and fuel prices is central when it comes to capturing
price changes
If a CPI does not exist or is not considered applicable
a price index for key consumption items can be
constructed using price data collection for food items
and basic non-food items conducted by WFP andor
other agencies this can then be used to update the cost
of the MEB In contexts where shelter is a major part of
household expenditures changes in shelter costs should
also be captured
10 How to find a proxy for a MEB when data or time is insufficient
39
Minimum Expenditure Baskets Guidance Note | December 2020
112 When to construct a new MEBThe composition of MEB reflects consumption patterns
It is recommended as much as possible keeping the MEB
composition constant and only monitor how cost changes
over time However when there is reason to believe that
consumption patterns of the population for whom the MEB
is constructed has significantly changed it is time to review
its composition and possibly reconstruct the MEB to reflect
these changes
What could suggest such consumption changes have
occurred The figure to the right summarises some typical
events that could result in a significant change in household
consumption Shocks eg a natural disaster might create
additional needs if livelihoods are disrupted or living
conditions are altered Significant changes to the prices of
key consumption items can also alter consumption pattens
insofar it pushes households to substitute certain items
for other items (be aware however that reconstructing
the MEB would only be advisable if the substitution is not
just temporary) Population changes such as an influx of
displaced people or other events that changes the population Figure 5 Possible triggers for MEB composition review
Has a shock occured creating
different or additional needs
Have costs changed significantly
between key consumption items so
that households have substituted
consumption patterns
Has there been a change in
population - eg a displacement
Has the supply side or service
provision changed leading to a
change in household consumption
Shock
Substitution
Population
Supply
composition in the area that the MEB is constructed for
could also lead to a review Finally if supply of essential
goods and services changes this may also shift household
consumption eg if health services are made free of charge
and no longer require households to pay for them
40
Minimum Expenditure Baskets Guidance Note | December 2020
CaLP The Cash Learning Partnership
CBT cash-based transfers
CotD Cost of the Diet [approach]
CPI consumer price index
FCN-N food consumption score ndash nutrition
FCS food consumption score
FNG Fill the Nutrient Gap
HEA household economy approach
LSMS Living standard measurement survey
MEB minimum expenditure basket
OCHA United Nations Office for the Coordination of Humanitarian Affairs
REVA II 2019 Refugee Influx Emergency Vulnerability Analysis
SDG Sustainable Development Goal
SMEB survival minimum expenditure basket
UNHCR Office of the United Nations High Commissioner for Refugees
VAM Vulnerability Analysis and Mapping
WFP World Food Programme
WHO World Health Organization
Abbreviations
41
Minimum Expenditure Baskets Guidance Note | December 2020
Deaton and Grosh 2000 ldquoConsumptionrdquo in Designing Household Survey Questionnaires for Developing Countries Lessons from Ten
Year of LSMS Experience httpsscholarprincetonedudeatonpublicationsconsumption
Deaton and Zaidi 2002 Guidelines for Constructing Consumption Aggregates for Welfare Analysis LSMS Working Paper no 135
httpsopenknowledgeworldbankorghandle1098614101
The Cash Learning Partnership (CaLP) Glossary of terminology for cash and voucher assistance
httpswwwcalpnetworkorglearning-toolsglossary-of-terms
Cash Based Responses Technical Working Group Syria 2014 Northern Syria Survival Minimum Expenditure Basket Guidance
Document httpswwwhumanitarianresponseinfositeswwwhumanitarianresponseinfofilesdocumentsfilesnorthern_
syria_smeb_guidance_document_dec_2014pdf
Cash Working Group Nigeria 2018 Minimum Expenditure Basket for North East Nigeria ndash Justification and recommendations Draft
report httpswwwhumanitarianresponseinfositeswwwhumanitarianresponseinfofilesdocumentsfilesmeb_justification_
guidelinespdf
Baizan and Klein 2019 Minimum Expenditure Basket (MEB) Decision Making Tools The Cash Learning Partnership httpswww
calpnetworkorgpublicationminimum-expenditure-basket-meb-decision-making-tools-2
El Koury and Hajal 2016 MEB and SMEB revision Community Consultation Lebanon Cash Consortium httpsreliefwebintsites
reliefwebintfilesresourcessmeb-fgd-report-final-1pdf
Geniez Mathiassen de Pee Grede and Rose 2014 ldquoIntegrating food poverty and minimum cost diet methods into a single
framework A case study using a Nepalese household expenditure surveyrdquo in Food and Nutrition Bulletin vol 35 no 2 https
journalssagepubcomdoi101177156482651403500201
Haughton and Khandker 2009 Handbook on Inequality and Poverty The World Bank httpsopenknowledgeworldbankorg
handle1098611985
Hobbs 2016 MEBSMEB calculation for Syrians living in Turkey Report commissioned by the Cash-Based Interventions Technical
Working Group in Turkey httpsdata2unhcrorgendocumentsdownload57031
Hohfeld Papavero Sandstrom Dalbai and Renk 2020 Minimum Expenditure Basket for Syrian Refugees in Lebanon ndash Rights-based
versus Expenditure Based Approaches WFP httpsreliefwebintsitesreliefwebintfilesresources76229pdf
Inter-Agency Network for Education in Emergencies (INEE) Minimum Standards for Education Handbook Preparedness Response
Recovery httpsineeorgstandards
Jolliff and Prydz 2016 Estimating International Poverty Lines from Comparable National Thresholds World Bank Policy Research
Paper 7606 httpsopenknowledgeworldbankorgbitstreamhandle1098624148Estimating0int00national0thresholdspdf
Lanjouw 1998 Demystifying Poverty Lines World Bank
Ravallion 1994 ldquoPoverty Comparisonsrdquo in Fundamentals of Pure and Applied Economics 56
Republic of Zambia Central Statistical Office 2016 2015 Living Conditions Monitoring Survey (LCMS) Report httpswwwzamstats
govzmphocadownloadLiving_Conditions201520Living20Conditions20Monitoring20Survey20Reportpdf
Save the Children UK 2018 Basic Needs Assessment Guidance and Toolbox Part I Background and Concepts httpsreliefwebint
reportworldbasic-needs-assessment-guidance-and-toolbox
Sphere Standards Handbook Humanitarian Charter and Minimum Standards in Humanitarian Response 2018 edition httpswww
spherestandardsorghandbook
UNHCR CaLP Danish Refugee Council OCHA Oxfam Save the Children and WFP 2015 Operational Guidance and Toolkit for
Multipurpose Cash Grants httpswwwcalpnetworkorgwp-contentuploads202001operational-guidance-and-toolkit-for-
multipurpose-cash-grants-webpdf
References
42
Minimum Expenditure Baskets Guidance Note | December 2020
WFP 2004 Sampling Guidelines for Vulnerability Analysis Thematic guidance httpsdocumentswfporgstellentgroupspublic
documentsmanual_guide_procedwfp197270pdf
WFP 2008 Food Consumption Analysis Calculation and use of the Food Consumption Score in food security analysis https
documentswfporgstellentgroupspublicdocumentsmanual_guide_procedwfp197216pdf
WFP 2015 Food Consumption Score Nutritional Analysis (FCS-N) Guidelines httpswwwwfporgpublicationsfood-consumption-
score-nutritional-quality-analysis-fcs-n-technical-guidance-note
WFP 2018 Revising the Food Basket and Minimum Expenditure Basket Analysis to calculate a realistic cost of living for refugees in
Turkey httpsreliefwebintreportturkeyrevising-food-basket-minimum-expenditure-basket-analysis-calculate-realistic-cost
WFP 2019 Refugee influx Emergency Vulnerability Assessment ndash Coxrsquos Bazar Bangladesh httpsreliefwebintsitesreliefwebintfiles
resourcesWFP-0000106095pdf
WFP 2020a Essential Needs Assessment Guidance note httpswwwwfporgpublicationsessential-needs-guidelines-july-2018
WFP 2020b Technical Note Fill the Nutrient Gap and Minimum Expenditure Basket An explanation of approaches and identification of
synergies httpsdocswfporgapidocumentsWFP-0000116644download
WFP 2020c Setting the transfer value for CBT interventions Transfer Value Interim Guidance httpsdocswfporgapi
documentsWFP-0000117963download
WFP global Food Security Cluster and Food Security Cluster for the Democratic Republic of the Congo 2018 Adapting to an Urban
World Urban Essential Needs Assessment in the five communes of Kimbanseke Kinsenso Makala Nrsquosele and Selambao (Kinshasa)
httpswwwwfporgpublicationsdemocratic-republic-congo-urban-essential-needs-assessment-five-communes-kimbanseke-
kinsenso
World Health Organisation and Global Health Cluster ndash Cash Task Team 2020 Technical Note on the Inclusion of Health
Expenditures in the Minimum Expenditure Basket and Subsequent Multi-purpose Cash Transfer httpswwwcalpnetworkorg
publicationinclusion-of-health-expenditures-in-the-meb
43
Minimum Expenditure Baskets Guidance Note | December 2020
Survivalnon-foodexpenditure
TOTALEXPENDITURE
FOODEXPENDITURE
MEBnon-foodexpenditure
EXPE
ND
ITU
RE
CONSUMPTION
SMEBAusterepoverty line
Essential foodneeds (MEB)
Acceptable food consumption(based on FCS)
Food expenditure for HHwith tot exp at essential
food needs (MEB)
Analysts should always ensure that the expenditure data is properly cleaned and outliers removed and that it is converted into
the same recall period (food and non-food items usually have different recall periods)
Expenditures should be calculated into per capita figures (eg by dividing total household expenditures by household size) in
order to make them immediately comparable across households (or per adult equivalent see section 7 on how to account for
economies of scale and household composition)
Before starting the MEB analysis it is highly recommended to carry out some simple descriptive analysis of the expenditure
data in order to understand it Analyse the mean and median expenditures for the sample This will help understand the
distribution of the expenditures and detect possible issues While the median is more robust to outliers if a large part of the
sample has 0 expenditures on a particular item the median could be 0 and may therefore not be the best estimate of the need
In this case the mean may be preferable A frequency analysis of non-zero expenditures by groupitem can also be helpful in
understanding whether certain expenditures are infrequent or lumpy
Annex 1 - Good practice when analysing expenditure data
Figure based on Lanjouw 1998 Demystifying poverty lines and World Bank and Ravallion 1994 ldquoPoverty comparisonsrdquo in
Fundamentals of Pure and Applied Economics 56
Annex 2 - The expenditure-based SMEB ndash an illustration

Minimum Expenditure Baskets Guidance Note | December 2020
List of boxesBox 1 The MEB to-do list 7
Box 2 Examples of national poverty lines 9
Box 3 Expenditure data in MEB calculations ndash constructing a light ldquoconsumption aggregaterdquo 11
Box 4 Reference cohort selection 13
Box 5 Selecting and checking the reference cohort Chad Syrian refugees in Lebanon and Coxrsquos Bazar 14
Box 6 Approximating a food basket with group-level food expenditures 16
Box 7 Kinshasa food reference basket using food group expenditures 17
Box 8 Coxrsquos Bazar food reference basket with detailed expenditure and quantity data 18
Box 9 Non-food expenditures ndash expenditures of particular interest 19
Box 10 Expenditure-based non-food reference basket example from Coxrsquos Bazar 20
Box 11 Shelter in the MEB for Syrian refugees 21
Box 12 Example of a rights-based MEB for northeast Nigeria 22
Box 13 MEB approaches ndash construction summary 23
Box 14 Information needs and sources MEB approaches 24
Box 15 What if data using a household economy approach is available 24
Box 16 Advantages and disadvantages of different approaches to establishing MEBs 25
Box 17 Hybrid MEBs in urban settings in Kinshasa the Democratic Republic of the Congo and for Syrian refugees in Turkey 27
Box 18 Turkey non-food basket MEB composition versus actual consumption 29
Box 19 Economies of scale in Lebanon and Coxrsquos Bazar 31
Box 20 Rights-based SMEBs 35
Box 21 Hybrid SMEBs 36
List of figuresFigure 1 Essential needs analysis 4
Figure 2 Selecting the MEB cohort 12
Figure 3 Economies of scale and expenditures per capita ndash illustration of the concept 30
Figure 4 Combining flat and proportional elements in the MEB 33
Figure 5 Possible triggers for MEB composition review 39
v
1
This guidance note on minimum expenditure baskets is
part of a package of guidance on the analysis of essential
needs This preface provides a brief introduction to the
concept of essential needs the rationale behind the package of
guidance for the analysis of essential needs what this analysis
entails and how the different analytical pieces can be used
The concept of essential needs originates in the basic needs
approach proposed by the International Labour Organization
(ILO) The ILO report on the 1976 World Employment
Conference defined basic needs in terms of household private
consumption of goods such as food clothing and housing
and services such as water and sanitation provision education
and public transportation1 Since then basic ndash or essential
ndash needs have been broadly defined in several analytical
frameworks as the essential goods and services required
on a regular or seasonal basis by households to ensure
survival and minimum living standards without resorting
to negative coping mechanisms or compromising their
health dignity and essential livelihood assets2
This amounts to a working definition for a highly contextual
concept The definition is not a universal list of what
constitutes essential needs International humanitarian
and human rights law offer a useful starting point for that
protecting the rights of crisis-affected populations to food
water sanitation clothing shelter and lifesaving healthcare
However what counts as essential will greatly depend on the
context and on what people themselves consider the most
important aspects necessary to ensure their survival and
wellbeing In order to move from the concept to concrete
analysis and action any definition of essential needs
should always be contextualized and verified through
consultations with the population of interest and other
stakeholders
Preface ndash the essential needs approach
The analysis of essential needs how people meet them
and where there are gaps or constraints to meeting them
enriches insight into food insecurity its drivers and how
it is connected with meeting other needs A thorough
understanding of essential needs helps in the design of
effective food security responses
Among essential needs food is central Often food is the
need on which poor households spend the largest share of
their resources But a householdrsquos ability to meet its food
and nutrition needs also depends on its ability to meet other
essential needs When households have limited resources
they will constantly have to prioritize between often equally
urgent needs They may have to decide between spending
money on healthcare or school fees or on buying different
types of food At the same time being in poor health or having
limited access to clean water negatively impacts a householdrsquos
ability to be food and nutrition secure This illustrates the
importance of analysing essential needs together and explains
why adopting the lens of essential needs can be of great
value for understanding food security and designing food and
nutrition security interventions
Recognizing this connection between food security and
the fulfilment of other essential needs is paramount
when working to reach the Sustainable Development
Goals (SDGs) The WFP strategic plan for 2017ndash2021 points
out that in order to achieve SDG 2 ndash End hunger achieve food
security and promote sustainable agriculture ndash WFP needs
to integrate a life-changing strategy along with its lifesaving
focus This means working towards sustainable food security
and nutrition goals while understanding how achieving SDG 2
is linked to progress towards other SDGs
Building strategic partnerships for stronger synergies is key
to improving food security SDG 17 ndash Strengthen the means
of implementation and revitalize the global partnership
for sustainable development ndash recognizes the crucial
role of partnerships in achieving holistic and sustainable
What are essential needs Why is WFP interested inessential needs
What counts as essential will greatly depend on the context and on what people themselves consider the most important aspects necessary to ensure their survival and wellbeing
1 Employment was considered both a means and an end and participation in decision making was also included2 See the Cash Learning Partnershiprsquos Glossary of terminology for cash and voucher assistance (CaLP glossary) and Save the Children UK 2018
2
Minimum Expenditure Baskets Guidance Note | December 2020
outcomes for affected populations Another key international
agreement the Grand Bargain committed its signatories to
working together in a more efficient and harmonious manner
in order to better assist the growing number of vulnerable
people affected by crises around the world
Against this backdrop and based on best practices by WFP and
partners an integrated analytical package has been prepared
to provide guidance on how to analyse essential needs This
package builds on existing guidance and research together
with practical experience and lessons learned It is designed to
provide analytical results that can be used to inform strategic
and operational decision making and programme design
As analysing understanding and assisting people in
meeting their essential needs is by definition not a single-
agency undertaking the package developed by WFP is
intended as an analytical starting point for interagency
collaboration It offers data-driven approaches and
quantitative indicators but also allows for analytical flexibility
emphasizing the importance of collaboration qualitative
inquiry and contextual adaptation
Essential needs analysis is particularly relevant where WFP
and partners seek to support government strategies and
policies such as informing the design of social safety nets
as a toolbox to support the design of multi-stakeholder
joint assessments or joint harmonized or complementary
interventions Essential needs analysis has proven useful in
a variety of contexts from refugee camps to chronic food
insecurity settings It is often highly relevant when assessing
the situation of poor urban populations urban households
depend heavily on markets to meet their food and other
essential needs including housing high living costs and
unstable income sources make them vulnerable to shocks
forcing households to choose between meeting different
essential needs in times of hardship
What is essential needs analysisThe analytical packageThe WFP essential needs analysis package consists of three parts
The essential needs assessment is a household andor
community assessment that helps to understand if and how
people are meeting their essential needs as such it focuses
on the demand side of essential needs The assessment seeks
to identify and analyse essential needs and gaps estimate
the number of people in need and profile them by describing
their main characteristics It aims to answer the following
questions
What are the populationrsquos essential needs and how
do people meet them
Which essential needs are unmet and why
How many people are unable to meet their
essential needs
Who are the people that are unable to meet their
essential needs
Where are the people that are unable to meet their
essential needs
How can households be assisted to meet their
essential needs
The essential needs assessment promotes the use of
qualitative and quantitative analysis It proposes a suite
of essential needs indicators that capture various aspects
of essential needs and a householdrsquos ability to meet them
including measures of household economic capacity to meet
essential needs deprivations of different essential needs how
households cope when they struggle to meet their essential
needs and how they prioritize unmet needs
An integrated analytical package has been prepared to provide guidance on how to analyse essential needs This package builds on existing guidance and research together with practical experience and lessons learned
3
Minimum Expenditure Baskets Guidance Note | December 2020
The foundational understanding of essential needs gained
from the essential needs assessment can feed into the supply
analysis The results can help to focus a complex market
analysis on the most critical needs while household data
can be used to understand how households perceive the
supply and quality of essential services and their access to
them At the same time a thorough analysis of the supply
of essential goods and services enriches the understanding
of household demand and enables the analyst to identify
possible interventions Which needs can be met through
the market Is there effective demand and would supply
or demand-side interventions or a combination of these be
better suited to assisting the population of interest The MEB
connects supply and demand in the sense that it identifies
a monetary threshold for meeting essential needs through
the market It enables the essential needs assessment to
identify households with sufficient economic capacity it also
has strong complementarities with the supply analysis as it
helps reveal market consumption patterns In turn the supply
analysis is a valuable input for a MEB analysis as it highlights
which goods and services are adequately supplied
The analytical approach draws on different schools
of thought from the fields of humanitarian action
development and poverty analysis It combines ideas from
the cost-of-basic-needs approach for monetary poverty
lines which sees poverty as the deprivation of consumption
with more multidimensional poverty perspectives from
human development and capabilities approaches Through
this combination the essential needs analysis provides a
framework that is easy to operationalize while offering the
flexibility and detail necessary to adjust to different contexts
and to produce information relevant for programmatic
decision making
The minimum expenditure basket (MEB) looks at the needs
that are covered partially or fully through the market It sets
a monetary threshold which is defined as what households
require in order to meet their essential needs The starting
point for constructing a MEB is usually household expenditure
data This data is analysed and triangulated with sector-based
needs information to obtain a measure of the minimum
cost of essential needs based on the population of interestrsquos
actual demand pattern and consumption priorities The
expenditure data can be gathered as part of the essential
needs assessment data collection Once constructed the MEB
itself serves as a key input in the essential needs assessment
set of indicators as it is
used to assess which
households have the
economic capacity to
cover their needs through
the market
The supply analysis looks at the supply of essential goods
and services and examines whether the market andor public
provision can sustain the demand related to essential needs
It integrates quantitative methods for examining the basic
functioning of the marketplace with qualitative investigation
of supply and access
The three guidance tools are designed so that they can
be used independently or together A full essential needs
analysis would require undertaking an essential needs
assessment constructing a MEB and carrying out a supply
analysis this combination is recommended for the most
complete analysis as each piece complements the others
A full essential needs analysis would require undertaking an essential needs assessment constructing a minimum expenditure basket and carrying out a supply analysis
Essential needs analysis provides a framework that is easy to operationalize while offering the flexibility and detail necessary to adjust to different contexts
4
Minimum Expenditure Baskets Guidance Note | December 2020
Essential needs analysis package
Esse
ntia
l nee
ds
ESSENTIAL NEEDS ASSESSMENTDemand for essential needs
SUPPLY ANALYSISSupply of essential goods and services
MINIMUM EXPENDITURE BASKETExpenditures on essential needs
Decision making
Operationalization
Monitoring
While the three pieces of analysis should be carried out
together as much as possible there may be situations in
which only one piece is necessary for example when the
analysis is spread out over time or different collaborators
lead on different pieces Each guidance note is designed as a
standalone document enabling analysts to follow it without
reference to the others
A series of operationalization guidance notes and
documented best practices complement the analytical
package The series offers concrete guidance on how the
results of the essential needs analysis can be translated into
programme design and inform decision-making Essential
needs analysis identifies where households face critical
gaps in meeting their needs the cost of meeting those
needs in the market and whether the necessary essential
goods and services are available As such it forms the
basis for programme design for both demand and supply-
side interventions Results can for example be used to
inform the targeting and prioritization of beneficiaries the
selection of transfer modality the setting of transfer values
and other programme design features It is well suited for
monitoring needs over time and evaluating the effectiveness
of programmes This series will be continuously updated to
reflect new learning
While essential needs analysis can inform programme design
it does not have to imply an essential needs response
Essential needs analysis and the analytical package can be a
service offering particularly when supporting governments in
designing policies strategies and programmes at national and
local levels
Figure 1 Essential needs analysis
5
Minimum Expenditure Baskets Guidance Note | December 2020
This guidance note sets out the basic steps for constructing a
minimum expenditure basket (MEB) It is designed to provide
conceptual clarity and best practices built on experience from
the humanitarian and development fields The guidance is
designed to provide a series of options in order to facilitate
a context-specific application of the recommendations it
presents
The guidance note begins by introducing the concept of the
MEB and its different usages (sections 1 and 2) Sections 3 to
6 cover how to construct a MEB including important aspects
to consider before starting the analysis and the different MEB
approaches Section 7 examines how to deal with household
size and composition in MEB analysis while the concept of the
survival minimum expenditure basket (SMEB) is introduced
in section 8 Section 9 sets out additional considerations
such as regional or seasonal price adjustments and section
10 explains how to find MEB proxies when time or data is
insufficient In closing section 11 offers guidance on how to
update and monitor the MEB
A MEB is defined as what a household requires in order to
meet their essential needs on a regular or seasonal basis
and its cost3 Essential (or basic) needs are defined as ldquothe
essential goods and services required on a regular or seasonal
basis by households to ensure survival and minimum living
standards without resorting to negative coping mechanisms
or compromising their health dignity and essential livelihoods
assetsrdquo4 The MEB is a monetary threshold ndash the cost of these
goods utilities services and resources ndash and is conceptually
equivalent to a poverty line5 It typically describes the cost
of meeting one monthrsquos worth of essential needs Since the
MEB sets a monetary threshold for what is needed to cover
essential needs the households whose expenditures fall
below the MEB are defined as being unable to meet their
essential needs
i About this guidance note
3 This builds on the definition in UNHCR et al 2015 4 Definition of basic needs See CaLP glossary 5 Note that conceptually a MEB is equivalent to a poverty line in that it describes a monetary threshold for being able to cover essential needs This does not mean that the MEB is equivalent to the national poverty line6 Haughton and Khandker 2009
In poverty literature and research MEBs have long been
constructed primarily to set national poverty lines and
determine the percentage of households in the population
who are poor ie who cannot meet their essential needs
The ldquocost of basic needsrdquo approach which entails establishing
a MEB is fairly new in humanitarian contexts however it
has long been the most common way to construct national
poverty lines6 As a result there is often national experience to
draw on when setting out to construct a MEB
A MEB does not necessarily contain all the essential needs
of a household It only captures needs that the households
cover entirely or partly through the market It should not
be an attempt to monetize all the needs of a population
For example in contexts where electricity is considered an
essential need but not available for the population of interest
it should not be included in the MEB If shelter is provided free
of charge in a refugee camp or education is publicly provided for
free these needs and their costs are not captured in the MEB
Hence a need can be essential but not included in the MEB
A MEB does not necessarily contain all the essential needs
of a household It only captures needs that the households
cover entirely or partly through the market It should not
be an attempt to monetize all the needs of a population
For example in contexts where electricity is considered
an essential need but is not available for the population of
interest it should not be included in the MEB If shelter is
provided free of charge in a refugee camp or public education
is provided for free these needs and their costs are not
captured in the MEB A need can therefore be essential but
not included in the MEB
A MEB captures the cost of essential needs for average
households It does not typically capture ad-hoc or one-
off costs This can be challenging particularly in emergency
situations when needs are dynamic While this guidance
suggests keeping the MEB composition fixed as far as
possible in such situations it might be justified to create
an interim MEB (see section How to find a proxy for a MEB
when data or time is insufficient) and when the situation has
stabilized a final one A similar challenge is presented with
1 What is a minimum expenditure basket
6
Minimum Expenditure Baskets Guidance Note | December 2020
needs that are inherently irregular large and unpredictable
such as health needs This is also examined in the sections on
MEB construction
There are different approaches to establishing a MEB
As the World Bankrsquos Handbook for Poverty and Inequality
explains7 the typical starting point for establishing a MEB is
to estimate the cost of acquiring enough food to meet energy
requirements usually 2100 calories per person per day as
per the Sphere Standard Yet the cost of 2100 calories varies
with the diet of households which typically depends on their
economic status The cost of other essential non-food needs
is then added There are two approaches to establishing
which food and non-food items should be in the MEB an
expenditure-based approach that focuses on effective
demand and a rights-based approach based on assessed
needs While the expenditure-based approach is usually used
to construct national poverty lines the rights-based approach
is the principal method followed in the operational guidance
for multipurpose cash grants developed for humanitarian
purposes8 A combination of these approaches a hybrid
approach can also be used and is often recommended This
guidance describes each approach
The construction of a MEB is always somewhat arbitrary
However a MEB is constructed choices need to be made along
the way The objective of the MEB can influence how best to
approach its construction The choice of the group of people
whose effective demand will be examined ndash the ldquoaveragerdquo
households ndash is another important influencing factor This
guidance provides direction on how to make these choices but
analysts will always be required to exercise judgement
A MEB is not equivalent to a transfer value A transfer
value is understood as the monetary value transferred from
governments or organizations such as WFP to households
in order to support the latter in meeting their needs The
value of the MEB is not the same as the value that should
be transferred to households but the MEB can be a critical
component when determining transfer values Most
households can rely on their own resources to meet at least
some of their needs so the transfer value will usually be
less than the value of the MEB covering the gap between
householdsrsquo own resources other assistance received and
the MEB The distinction between the MEB and the transfer
value is also important because the MEB remains the same
regardless of assistance and funding constraints while the
transfer value could be impacted by these factors9
When using the MEB to monitor impacts of an
intervention or programme the MEB should not be
changed over time The threshold should only be adjusted
for price changes or when any major changes in context and
households needs occur that would require the construction
of a new MEB
2 Why have a MEBThe MEB has a range of applications In humanitarian
and development programming the MEB can support
household profiling by identifying characteristics of those
who cannot meet their essential needs10 and support
decisions on transfer value amounts for food and non-
food needs For partnerships the MEB can support multi-
sector coordination and programming with government
partner organisations and donors In market and supply
analysis the MEB can help inform which goods and services
to include in a Supply Analysis by showing which essential
needs households cover through the market Finally in
monitoring the MEB can assist monitoring of immediate
and longer-term outcomes through analysis of expenditure
trends against the MEB and help establish a basket against
which to monitor market prices and the cost of living
7 Ibid8 UNHCR et al 20159 For further discussion on considerations when setting a transfer value see WFP 2020c 10 For one possible application see WFP 2020a
A hybrid approach to constructing the MEB combines the expenditure-based approach and the rights-based approach and is often recommended
7
Minimum Expenditure Baskets Guidance Note | December 2020
THE MEB TO-DO LIST DEPENDING ON CONTEXTALSO CONSIDER
Identify key partners and stakeholders and decide on objectives and process
Construct the food basket
Construct the non-food basket
Reality check results and validate with stakeholders
Determine the analytical starting point (eg examine national poverty lines set the population of interest check what data is available) and decide on approach
Accounting for household size and composition
Adapting the MEB to different needs across regions or seasons
Adjusting the MEB for regional or urbanrural price differences if significant
HOW TO
Box 1MEB
3 How to construct a MEB generic steps
11 This is in line with the cost of basic needs approach widely used for poverty lines as described in previous sections
A MEB is constructed by estimating the cost of acquiring
adequate food and adding the cost of other essential non-
food expenditures11 The box below shows the steps that are
always part of constructing a MEB
The two principal methods for constructing MEBs are
the expenditure-based approach and the rights-based
approach Sections 5 and 6 describe these approaches
and how to combine elements of both to apply a hybrid
approach
Regardless of approach it is crucial to arrive at a realistic
relevant and operational MEB that is rooted in
consumption behaviour ndash section 6 also looks at how to
ensure this Before going into the details of construction the
next section outlines the key questions to ask before starting
the MEB analysis
8
Minimum Expenditure Baskets Guidance Note | December 2020
Before embarking on the construction of the MEB
components consider the following questions to decide how
best to approach the analysis
What is the objective and whowill be the partnersStart by setting the objective and consider what the MEB will
be used for once the analysis is finished If the MEB analysis
is a joint exercise identify potential partners possibly in
interagency working groups such as a cash working group find
out what kind of information various organizations can share
and decide on the division of labour In some cases it can be
helpful to write terms of reference for the MEB analysis in
order to clarify the envisioned process and methodology Even
if the MEB analysis will be conducted by just one agency it is
always a good idea to identify partners who will be interested in
the results and who can be consulted along the way12
Who is the MEB being constructed forIt is important to define the population of interest for the
MEB Is it intended to be valid for the entire country Or will it
only be used in a refugee camp for example or a particular
region where needs might differ from those in the rest of
the country It is vital to decide from the start where and for
whom the MEB should apply Since the MEB describes the
cost of essential needs the population for whom the MEB
is constructed should ideally have relatively homogenous
consumption patterns and needs If consumption patterns are
very different consider constructing different MEBs or varying
certain components of the MEB for sections of the population
Have any MEBs already been created for the population of interest If there are one or more MEBs already in use the analytical
exercise might be aimed at updating or even ldquoreality
checkingrdquo the existing baskets to see whether they still match
consumption behaviour and price levels If existing baskets
are found to be valid and relevant it might not be necessary
to start a new MEB analysis
4 Before starting the analysis What information and data is already available and is new data neededConsider what data or analysis is already available from
essential needs assessments or other household surveys
(undertaken by WFP or others) Does the data cover the area
and population of interest Also consider what qualitative
information might be available to shed light on certain
expenditure patterns and whether there is access to market
and price information If the data available is insufficient or
outdated plan to collect fresh data A MEB analysis is greatly
strengthened by being conducted as part of a comprehensive
essential needs assessment The assessment describes the
essential needs of the population of interest which is a
useful starting point for a MEB analysis and complements the
monetary perspective provided by a MEB
Can the national poverty line be usedBefore beginning the construction of a MEB it is useful to find
out if a national poverty line exists and how and when it was
constructed Many countries have their own national poverty
lines so why not use this poverty line (and the corresponding
basket) as the MEB Whenever possible the first choice
should be to align with government practices However this is
often not feasible for three main reasons
Practices vary widely when it comes to constructing
national poverty lines Although the most common
approach is the cost of basic needs using MEBs
sometimes poverty lines are set as a share of the
country mean or median income or expenditures or
as a fixed percentage of the income or expenditure
distribution (although this is mostly not the case in low
income countries) Furthermore even when a MEB has
been constructed to develop the poverty line different
methodologies exist For example sometimes countries
exclude non-food items from their poverty line MEB
Since the MEB describes the cost of essential needs the population for whom the MEB is constructed should ideally have relatively homogenous consumption patterns and needs
12 The Cash Learning Partnershiprsquos MEB Tip Sheet contains useful advice on the interagency processes around constructing a MEB Baizan and Klein 2019
9
Minimum Expenditure Baskets Guidance Note | December 2020
Countries can also have different poverty lines for
different purposes and regions13 These factors can all
limit the use of the national poverty line as the MEB
The population of interest for a MEB could differ from the
overall population of the country and hence the national
poverty line This group of people may have different
essential needs for instance if they live in refugee camps
or do not have access to the same services as the resident
population (eg public education)
The data that WFP typically collects through essential
needs assessments comprehensive food security
and vulnerability analyses emergency food security
assessments baseline assessments and post distribution
monitoring is often much less detailed than that gathered
through the household budget surveys or living standards
measurement surveys used to calculate national poverty
lines It is widely observed that the more detailed the
survey questions about expenditures the higher the
reported expenditures14 If the national poverty line is
constructed using detailed data but the assessment of
household needs or expenditures relative to the poverty
line is based on less detailed data errors in the analysis
are likely to occur Furthermore WFP expenditure
modules do not include asset depreciation which is often
accounted for when calculating national poverty lines
Even if the national poverty line cannot be used in most
cases and especially in humanitarian contexts elements of
the methodology can perhaps be replicated It is therefore
important to find out how the national poverty line is
constructed
How about using the methodology applied for consumer price indices The consumer price index (CPI) is used to measure changes
in price levels based on a weighted average consumer basket
of goods and services In most countries household budget
survey data is used to construct the baskets used to measure
consumer prices A weight that corresponds to average
household expenditure patterns is applied to each component
of the CPI17 This basket is not ideal for MEB calculations
because it corresponds to overall national average
consumption patterns MEBs are based on the consumption
levels and patterns of those households who are just able to
meet their essential needs within the population of interest
(this is further described in the following sections)
13 Jolliff and Prydz 2016 14 Haughton and Khandker 200915 Republic of Zambia Central Statistical Office 2016 16 See Turkish institute of statistics data portal httpsdatatuikgovtrKategoriGetKategorip=Income-Living-Consumption-and-Poverty-10717 The CPI weights are usually available through national statistical offices
COUNTRYEXAMPLE
EXAMPLES OF NATIONAL POVERTY LINESEG Box 2
In Zambia the national poverty line is constructed using the cost of basic needs MEB approach based on a simple food
basket that meets minimum food needs for a family of six15 Imagine this food basket costs USD 100 per month This is
defined as the food poverty line To construct the full poverty line the minimum non-food needs of households are
estimated based on the average share of expenditure that households just above the food poverty line dedicate to needs
other than food Let us say that this corresponds to USD 35 per month The total poverty line is then the sum of the food
and non-food lines which with these hypothetical figures would be USD 100 + USD 35 = USD 135
By contrast Turkey uses the standard European Union approach to measuring poverty which is 50 or 60 percent of
median income16 However eligibility for social assistance is based on the gap between household income and the national
minimum wage
10
Minimum Expenditure Baskets Guidance Note | December 2020
In developing country contexts consumption is generally considered a better metric of wellbeing than income and in turn consumption expenditures as captured in household data generally provide the most reliable measure for consumption
5 Constructing a MEB expenditure-based and rights-based approaches
51 The expenditure-based approachThe expenditure-based approach to constructing a MEB
relies on household-level expenditure data to examine the
consumption behaviour of households who are just able
to meet their essential needs The expenditure level and
consumption patterns for this group of households reveal the
minimum cost of covering essentail food and non-food needs
and therefore form the basis of the expenditure-based MEB
The expenditure-based approach builds on the theory
behind poverty measurement and poverty line construction
To measure poverty the first step is to define a measure
of wellbeing In developing country contexts consumption
is generally considered a better metric of wellbeing than
income and in turn consumption expenditures as captured in
household data generally provide the most reliable measure
for consumption18 Household survey data on expenditures
therefore provides the foundation for measuring wellbeing
and is used to set the MEB threshold
The steps for constructing a MEB using the expenditure-based
approach are explained below
1 Prepare the expenditure data The prerequisite for an expenditure-based MEB is a
good-quality household survey with a detailed expenditure
module with a sufficient sample size representative of the
population for whom the MEB is being constructed (the
ldquopopulation of interestrdquo)
The notion of a ldquodetailedrdquo expenditure module is a
relative one Constructing an expenditure-based MEB
requires more detailed data on different types and
groups of expenditures than is usually gathered by
household surveys conducted in humanitarian settings
However this guidance has been designed to cope
with less detailed expenditure data than that gathered
through extensive national expenditure surveys such
as the very granular expenditure modules typically used
when constructing poverty lines (eg national household
budget surveys household income and expenditure
surveys living standards measurement surveys or other
large-scale household surveys)
What is a sufficient sample size The survey should
always follow good practices for sampling19 Consider
that for MEBs the analysis focuses on the consumption
patterns of a subset of the sample the ldquoreference cohortrdquo
(see next below) The characteristics of the population
and the cohort selection criteria determine the size of
this subsample in relation to the overall sample but
experience shows that the cohort can comprise between
10 and 60 percent of the sample The sample will be
further disaggregated if analysis by household size or
group of household size is desired (see section 7 on
accounting for household sizes)
Using expenditures to understand consumption involves
calculating a ldquoconsumption aggregaterdquo This entails
combining household expenditures on food and non-
food paid in cash or through credit as well as the
imputed monetary values of consumed own production
and received assistance Expenditures are analysed in
per-capita values Box 3 describes this process in more
detail Annex 1 further outlines some best practices when
analysing expenditure data
In addition to the household survey data market price
data is needed in order to estimate the final cost of the
basket The price data should be collected around the
same time as the household survey data
18 Deaton and Zaidi 2002 and Haughton and Khandker 2009 19 For guidance see WFP 2004 Additional resources can be found in the online VAM Resource Centre httpsresourcesvamwfporg
11
Minimum Expenditure Baskets Guidance Note | December 2020
HOW TO
EXPENDITURE DATA IN MEB CALCULATIONS -CONSTRUCTING A LIGHT ldquoCONSUMPTION AGGREGATErdquo
Box 3
Using expenditures to calculate a MEB entails combining different household expenditures to arrive at a measure of house-
hold consumption This is typically referred to as a consumption aggregate although a lighter version is used than those
usually constructed for national poverty lines due to the less granular data typically available for MEB construction20
Expenditures considered in a MEB should reflect household consumption related to essential needs Therefore both
household expenditures made in cash and those on credit must be considered as the latter also reflect current consump-
tion even if payment occurs later If the population can be expected to consume food from their own production the value
of this food should be captured to avoid underestimating food expenditures Lastly if the surveyed households are receiv-
ing and consuming assistance it is advisable to estimate the implied value of this assistance and include it in the expendi-
tures (however care needs to be taken if the population of interest includes a large group of in-kind assistance beneficiar-
ies as this can significantly skew consumption choices see next section on selecting the reference cohort) In summary the
expenditure module should capture any expenditures made in the reference period through cash and credit purchases as
well as the monetary value of consumed own production and assistance Most standard expenditure modules include all
these types of expenditures
Expenditures should be collected for both food and non-food goods and services For food expenditures at the food group
level are required as a minimum If food expenditures are collected at the item level a more granular analysis can be per-
formed The same applies for non-food expenditures they must be available at the group level and item-level data will add
detail However whenever household data is collected a balance needs to be struck between the granularity of the data
and the time and resources available for its collection
The WFP standard expenditure module can be used as a reference for the minimum requirement for expenditure data
collection WFP standard modules can be found in the online VAM Resource Centre httpsresourcesvamwfporg
+ ndash=
2 Select the reference cohort The next step is to identify the households in the survey
data that are just able to meet their essential needs and
examine their expenditures Including households below
this level would generate a basket that does not satisfy
essential needs while including relatively wealthier
households would lead to the inclusion of non-essential
needs and therefore inflate the MEB But what is ldquojust
enoughrdquo
Identifying the cohort of households who are just able
to meet their needs can be challenging How to approach
it depends on the characteristics of the population
and the available data The key is to identify one or
more criteria that can be good proxies for whether
households are just able to meet their essential
needs and that can be observed in the data One
basic indicator would be a food consumption of 2100
kcal per person per day21 However since the available
expenditure data is often too crude to make accurate
calibrations of diet compositions around the 2100
kcal point the use of alternative indicators is highly
recommended These could be indicators such as food
consumption score (FCS) or food consumption score ndash
nutrition (FCS-N)22 which indicate whether households
eat sufficient and balanced diets quality of housing
indicators use of coping strategies (selecting households
who do not engage in severe strategies) or any other
indicator that reflects a householdrsquos ability to meet its
needs Combining several indicators is often useful
20 For thorough guidance on constructing consumption aggregates using data from living standard measurement surveys (LSMS) see Deaton and Zaidi 2002 In most WFP cases household data is less granular than the LSMS-type datasets This section therefore describes how to construct consumption aggregates with less detailed data21 Use of calorie consumption close to the Sphere Standard of 2100 kcalpersonday as the starting point for selecting the reference cohort originates in the cost of basic needs approach used in most national poverty line estimations 22 WFP 2008 and WFP 2015
12
Minimum Expenditure Baskets Guidance Note | December 2020
Figure 2 Selecting the MEB cohort
In simple terms it is useful to think of the green people in the figure as the basis for selecting the reference cohort they are not amongst the worst-off
nor the wealthiest ndash but rather are just able to meet their essential needs
DESTITUTE
WEALTHY
It is also recommended to examine the expenditure
distribution Excluding households in the extreme ends
of the expenditure distribution can help ensure that
the cohort is neither ldquotoo poorrdquo nor ldquotoo wealthyrdquo (eg
by removing households in expenditure quintiles 1 and
5 or similar exclusion criteria based on distribution
characteristics) This is in particular useful if there is a
relatively large spread in wealth across the sampled
population
Figure 2 provides a simplistic depiction of selecting the
reference cohort the aim is to identify households that
are just able to cover their needs and hence do not fall in
either extreme end of the spectrum
13
Minimum Expenditure Baskets Guidance Note | December 2020
Box 4 outlines some typical cases and presents suggestions
for how to select the cohort in a survey sampled on
the population of interest
There is a spread in the
population in terms of well-being
and a proportion is able to cover
their essential needs no
households receive assistance
A relatively large proportion of
households receive food
assistance
The vast majority of the
households are far from being
able to cover their essential
needs (prior to receiving
assistance)
Select households with an acceptable FCS23 or with adequate consumption in FCS-N
who do not use negative coping strategies (or have a high coping strategy index)
Combine or cross-check with other criteria such as dwelling quality or asset index
Exclude extreme expenditure quintiles
Exclude households receiving in-kind food assistance from the reference group (if
sample size allows) This is because any assistance that is not unrestricted cash
might influence the consumption choices of the beneficiary households (in-kind
food means a large portion of food consumption is determined by the assistance
provided not the households) However be aware that if the majority of
households receive some form of restricted assistance excluding them all from the
cohort can lead to sample size issues as well as selection bias
Alternatively to the extent possible avoid using criteria that are highly influenced
by assistance For example in the presence of food assistance the FCS of some
households might be acceptable even if they are not able to meet their essential
needs Furthermore if in-kind food is provided the consumption behaviour of such
households might be skewed as most of their food needs are already covered by
assistance
Consider using dwelling quality an asset index or other similar indicators instead
(or in combination with the FCS)
Consider using a rights-based approach since it will be very difficult to obtain a big
enough sample of households who can meet their essential needs making it
challenging to construct an expenditure-based MEB Carry out a reality check using
the survey data to understand household consumption patterns keeping in mind
that the sample represents a population not able to fulfill their essential needs
HOW TO
REFERENCE COHORT SELECTIONBox 4
Scenario Possible approach to selecting the cohortUse one or several of the below criteria
The use of sensitivity tests is highly recommended in the form
of repetitions of the expenditure analysis for different versions
of the reference cohort this will indicate the extent to which
the choice of cohort selection criteria is influencing the MEB
23 It is usually not advisable to use the FCS as a single criterion If it is used alone the indicator should be capped at a certain level above the acceptable threshold (the FCS builds on a continuous score from 0ndash112 and applies thresholds for poor borderline and acceptable consumption) This is because if all households with acceptable FCS are included this will likely also capture some households who are ldquotoo wealthyrdquo to be considered in the reference cohort
14
Minimum Expenditure Baskets Guidance Note | December 2020
See box 5 for examples of how sensitivity tests can be
conducted as well as how the reference cohort has been
COUNTRYEXAMPLE
SELECTING AND CHECKING THE REFERENCE COHORTCHAD SYRIAN REFUGEES IN LEBANON AND COXrsquoS BAZAR
EG Box 5
Reference cohort sensitivity analysis ndashCoxrsquos Bazar MEB
Table a
In Chad the calculation of an expenditure-based MEB relied on national data collected by the Government during their
annual national food security and nutrition survey The reference cohort for the MEB was selected on the basis of two
criteria FCS between 35 and 70 eg in an interval around the acceptable threshold and no adoption of crisis or emergency
livelihood coping strategies based on the livelihood coping strategies indicator These two criteria ensured that the
selected reference cohort had consumption levels that provided sufficient food security and sustainable livelihood
strategies
For Syrian refugees in Lebanon24 an expenditure-based MEB was calculated by WFP in order to review an existing MEB
Shelter plays an important role as most refugees live in an urban host community and face high rents The FCS reveals
whether people can cover their food needs but could be influenced by the presence of food assistance To ensure results
would be robust against the choice of the cohort two different approaches were compared both included households of 4
to 6 members (as the MEB under review was defined only for households of these sizes) and excluded households in
expenditure quintiles 1 and 5 In version 1 an additional criterion of acceptable FCS was included while in version 2 an
additional criterion of acceptable housing conditions was applied The results were similar for both cohort versions
A MEB was calculated in Coxrsquos Bazar Bangladesh as part of the 2019 Refugee Influx Emergency Vulnerability Analysis
(REVA-II)25 for Rohingya refugees An expenditure-based MEB was built using a large household survey that included
refugees and host community households the reference cohort also included refugees and host communities as the MEB
was meant to apply to both groups Households receiving in-kind food assistance were excluded to avoid possible bias in
consumption choices which would be reflected in the expenditure data The reference cohort was then selected based on
FCS and expenditure quintiles To ascertain that the appropriate cohort had been chosen a sensitivity analysis was
conducted which tested the effect of removing different expenditure quintiles (quintiles 1 and 5 versus quintiles 1 4 and 5)
and including different FCS ranges (FCS 42+ versus FCS 35ndash80) This showed that across different iterations of the reference
cohort total food expenditures were relatively stable while non-food expenditures went up when richer households (eg in
the higher expenditure quintiles) were included This allowed the analysts to select the cohort of households who were just
at the point where the share of food expenditures out of total expenditures began to decrease as a high share of
expenditure on food is often an indicator of vulnerability In other words the selected cohort was just at the point where
households started meeting more needs than just food and the most basic non-food requirements The consumption
patterns of this cohort -highlighted in table a below - therefore became the basis for the MEB
Indicator 1expenditurequintiles
Indicator 2FCS Sample
size Value in taka
Total MEB
Exclude quintiles 1 4 and 5
Exclude quintiles 1 4 and 5
Exclude quintiles 1 and 5
Exclude quintiles 1 and 5
FCS 35ndash80
FCS gt= 42
FCS 35ndash80
FCS gt= 42
403
296
610
474
5259
5324
5691
5740
2304
2299
2990
3082
070
070
066
065
030
030
034
035
7562
7623
8681
8822
Food MEBValue in taka Value in taka
Non-food MEB
identified in different contexts
24 Hohfeld et al 2020 25 WFP 2019
15
Minimum Expenditure Baskets Guidance Note | December 2020
3 Establish the food basketWith the reference cohort identified the food basket value
should be calculated in correspondence with the food
consumption patterns of the reference cohort
To calculate the food basket start by computing the mean
(or median) food expenditures for the chosen reference
cohort It is good practice to compute the overall food
expenditures and break the analysis down into the different
food groups or food items in order to understand how food
consumption is distributed across different foods
Next consider whether an explicit reference food basket
is needed in the MEB this is a list of the food items in the
basket and their quantities Having a reference basket
brings advantages in terms of monitoring of the cost
of the MEB (as new prices can easily be applied to the
quantities) it shows consumption patterns in quantities
and can hence help check if food consumption is adequate
at the given level of expenditures and it can help when
communicating about the MEB It can therefore be a useful
practice to establish one However in some instances
a simple monetary value for the food MEB is sufficient
This could be the case when the MEB is calculated to
review an existing MEB if reference basket is not needed
for operational purposes when time is limited or
where limited data means a reference basket cannot be
adequately calculated Wherever a food reference basket
is not needed the food MEB will simply be the mean (or
median) food expenditures by food groups or food items
as calculated above If a reference food basket is feasible
and desired the next steps depend on the level of detail in
the data available
With expenditure data and market prices a food
reference basket can be approximated using expenditures
by food group or food item and dividing these
expenditures by the relevant food prices This provides
estimates of consumed quantities Expenditures and prices
must be collected at the same time in order to arrive at
correct quantities If for example prices are collected six
months later than expenditures and prices have changed
significantly dividing expenditures by prices will produce
inaccurate estimates
Note that the level of detail and accuracy with which a
food refence basket can be established using expenditures
and prices also depends on whether expenditures
were collected at the food group or food item level Box 6
illustrates how to approximate a reference basket when
expenditures are collected at the food group level and
box 7 shows an example of a food basket estimation from
an assessment in Kinshasa Democratic Republic of the
Congo
If the expenditure module includes consumed quantities
of food in addition to expenditures a food basket can be
established directly based on the consumed quantities by
food group or food item Having data on quantities will
also enable analysts to estimate prices directly from the
survey data by dividing the household expenditure on a
particular food item by the quantity consumed This can be
advantageous as it provides a direct estimate of the prices
households actually paid (unlike a price survey which uses
typically consumed items and is often only conducted
at specific points of sale) On the other hand this may
introduce issues related to non-standard measurement
units that make prices hard to compute and aggregate26
Box 8 shows an example from Coxrsquos Bazar of how a food
reference basket can be established using item-level
expenditures and quantities from the survey data
Once the quantities consumed have been established using
one of the methods described above it is good practice to
check the calories these quantities provide and the balance in
terms of nutrients The basket should be close to the Sphere
Standard of 2100 kcal per person per day ndash if it is not one
option could be to scale the basket Use information on the
calorie content of the different food items in the basket to
calculate the total calorie content of the basket27 The quantities
in the basket can then be scaled up or down to reach 2100
kcal However bear in mind that if the reference cohort has
been well selected and the data is of sufficient quality and
detail the basket should already be close to 2100 kcal If large
rescaling is required investigate the reasons behind this For
the sake of simplification quantities can be rounded and the
basket can be streamlined by removing items with very low
consumption or nutritional value
26 Deaton and Grosh 2000 27 Calorie information of food items can be drawn from a variety of sources The Nutval tool (httpwwwnutvalnet) provides information on calories and other nutrients for a list of items Consider that the
specifications and quality of a product can influence its caloric value (eg whole fish vs fish fillet) ndash it might be necessary to adjust for this for certain items that vary widely Many food composition tables (available from FAO for different continents httpwwwfaoorginfoodsinfoodstables-and-databasesfaoinfoods-databasesen) contain a wastage factor or edible portion conversion factor to convert from edible portions into full products as they are bought on the market
16
Minimum Expenditure Baskets Guidance Note | December 2020
After establishing the reference basket and possibly rescaling
it the basket is priced This is done by multiplying the basket
quantities by the food prices The basket can be priced using
current food prices from a price survey or by estimating food
prices from the expenditure data as described earlier The
result should be close to the expenditures for the reference
cohort although differences could arise from any rescaling or
simplification of the basket
APPROXIMATING A FOOD BASKET WITHGROUP-LEVEL FOOD EXPENDITURES
Box 6
HOW TO
Data quality and granularity has a big impact on the calculation of a food reference basket If consumed quantities are not
directly available in the dataset they need to be calculated by dividing expenditures by prices However this will always
produce an approximation and the more aggregated the data on expenditures is the more approximate the results will be
In particular when the food expenditure data is available at the food group level care needs to be taken when converting
expenditures into quantities
For example to convert expenditures on the food group ldquocerealsrdquo into a reference quantity analysts need to divide cereal
expenditures by the price of cereals But how do they determine the price of cereals This is a food group not a specific item
so there is no exact price The recommended way to approach this is to determine which is the most commonly consumed
item or combination of items for each food group Then a price for the most commonly consumed item or a composite price
of a combination of items can be used to arrive at quantities So if the most commonly consumed cereals for the population
of interest are maize and rice and they are eaten in equal measure by the population the cereal quantities for the reference
basket can be calculated in the following way
Mean cereal expenditures for our reference cohort = 150 shilling
Price of rice = 18 shillingkg
Price of maize = 12 shillingkg
Composite price of rice and maize = (18 + 12) 2 = 15 shillingkg
Cereal quantity consumed = 150 shilling (15 shillingkg) = 10 kg (5 kg rice 5 kg maize)
Of course this is an approximation care needs to be taken when converting expenditures into quantities using
group-level data
Certain food groups may lend themselves more to this approximate conversion than others For example cereals
might be relatively easy to convert using this method as cereal consumption often is concentrated on a few key staples In
contrast vegetable consumption may be so diverse that conversion via prices is not helpful In this latter case one option
could be to obtain reference basket quantities for the groups that can be converted and leave other groups as expenditures
only so that the food MEB becomes a combination of quantities and expenditures
In summary to establish the food basket
i Calculate mean (median) food expenditures by food group
or item If an explicit reference basket with quantities is not
needed stop here and simply use the expenditures as the food
basket
ii Estimate consumed quantities (by dividing expenditures
by prices or directly from data if it contains consumed
quantities)
iii Check the resulting quantities and consider scaling to meet
Sphere Standards
iv Price the basket using market prices or prices derived
from the household data
17
Minimum Expenditure Baskets Guidance Note | December 2020
Table a Food reference basket ndash Kinshasa MEB
COUNTRYEXAMPLE
KINSHASA FOOD REFERENCE BASKET USINGFOOD GROUP EXPENDITURES
Box 7
In the Kinshasa urban essential needs assessment28 the food reference basket for the MEB was established as follows
Expenditure data was available at the food group level only The caloric importance of each food group (column A of the
table below) as a part of the overall food intake was determined For each of the calorie-relevant food groups the most
commonly consumed food item was then identified (eg maize in the case of cereals) (see column B) Using the average per
capita expenditure from the household survey (column C) and the market price for each food item (column D) the
quantities consumed per person per month were approximated (column E) Next the total calorie intake was calculated
(column G) For urban Kinshasa this amounts to 1967 kcal which is close to the Sphere Standard of 2100 kcalpersonday
and suggests that the expenditure data is likely to be reliable However a proportional rescaling to 2100 kcalpersonday
was done to ensure consistency with Sphere (column H) On the basis of the rescaled total calories all values were then
converted back to monthly figures to arrive at a monetary value for each food item (columns I and J) In addition to the
calorie-relevant food items the mean expenditures on other food categories that households regularly consume were
added (vegetables fruit etc) As these food items represent little overall share of peoplersquos calorie consumption (given the
quantities consumed or the type of the foods) they were not included when calories were calculated Furthermore it would
be difficult to select specific food items in each of these categories as they are quite diverse (eg vegetables) However as
most households still consume these food items as part of their usual diet and they provide important micronutrients their
costs need to be reflected in the food MEB The mean expenditure on these food categories was therefore used as a
good-enough approximation for householdsrsquo consumption of these food groups Meals consumed outside the household
were excluded from the MEB as they were not considered essential
Food
grou
p
Food
item
per
capi
ta a
vm
onth
ly e
xp
Pric
e(f
ranc
kg)
kg c
ons
per
mon
th =
CD
food
item
kca
lpe
r 10
0g
kcal
con
s p
er d
ay=(
EF
10)
30
kcal
per
day
res
cale
d=G
(21
001
967)
kg p
er m
onth
res
cale
d=(
H(
F10
))30
roun
ded
MEB
food
-bas
ket
(fra
nc)=
ID
6898
1808
2089
2341
4306
1817
2826
833
799
2509
2144
900
500
1300
2300
2500
2200
77
36
16
10
17
08
920
412
179
302
44
110
1967
360
342
335
890
76
400
TOTAL
982
440
192
322
47
118
2100
82
39
17
11
18
09
7400
1900
2200
2500
4600
1900
2800
800
800
2500
27400
A B C D E F G H I JCereals
Tubers
Pulses
Oilsfats
Meatfish
Sugars
Vegetables
Fruit
Dairy
Condiments
Meals out-
side home
Maize
Cassava
Beans
Veg Oil
Fish
White sugar
Vegetables
Fruit
Dairy
Condiment
Meals out-
side home
29 WFP 2019 Also see box 5
18
Minimum Expenditure Baskets Guidance Note | December 2020
COUNTRYEXAMPLE
COXrsquoS BAZAR FOOD REFERENCE BASKETWITH DETAILED EXPENDITURE AND QUANTITY
Box 8
In the MEB for Coxrsquos Bazar calculated as part of the REVA II assessment expenditures and consumed quantities were
available for 87 food items which formed the basis for the consumption aggregate While the expenditure data was used to
select the appropriate reference cohort the reported quantities were used to determine household calorie intake
Quantities were reported at the food item level and consumed calories were calculated for each item The items were then
categorized by food group (cereals pulses oilsfats vegetables etc) and the total calories from each group were
calculated To create an operationally relevant reference basket without very large numbers of food items the number of
items in each food group were reduced where possible For example 95 percent of the calories that households get from
the food group ldquocerealsrdquo come from rice The cereal food group was therefore simplified to rice only keeping the total
calories sourced from cereals constant and adjusting the quantity of rice in the basket slightly upwards For pulses the four
main consumed items were identified and calories and quantities proportionally adjusted For other food groups such as
vegetables the variety of items consumed within the group was too great to simplify items to a small number for this
group no items were assigned and instead total expenditures on vegetables for the reference cohort were used directly in
the food MEB The total calories of all items were taken into account The resulting basket was close to 2100 kcal so only
minor rescaling was undertaken to arrive at final reference basket of 2100 kcalpersonday
Once the final basket had been determined quantities were priced using median prices derived from the household data
(by dividing expenditures by purchased quantities for the relevant items)
For vegetables fruits meat dairy and condiments expenditures are used directly in the food MEB (converted into monthly per
household values) For all other items quantities per capita per day are multiplied by the item median price (as derived from
the household data) and converted into monthly per household values
The MEB uses household size 5
Note The MEB for Coxrsquos Bazar was calculated for analytical purposes for the REVA II assessment It is not the operational MEB used
for the district
Foodgroup
Fooditem
Consumedquantity(grammescapitaday)
Calories(kcalcapitaday)rescaled
Median prices(takakg)
Value in MEB(taka per HHmonth)
424
14
7
2
1
182
6
81
1
33
6
28
1527
48
27
8
4
78
5
85
1
294
24
0
2100
30
80
60
40
80
-
-
-
-
80
60
-
1909
168
67
14
13
1065
48
1600
15
392
57
345
5691
Cereals
Pulses
Pulses
Pulses
Pulses
Vegetables
Fruit
Meat
Dairy
Fats
Sugar
Condiments
TOTAL FOOD
Rice
Lentil
Chickpea
Anchor daal
Mung
none
none
none
none
Soybean oil
Sugar
none
Table a Food reference basket ndash Coxrsquos Bazar MEB
19
Minimum Expenditure Baskets Guidance Note | December 2020
4 Establish the non-food basketOnce the food component has been established a non-
food component is added There is no wholly satisfactory
way to add a non-food component as it can be difficult to
define an essential minimum Unlike food needs many
non-food needs are often more contextual and are not
easy to anchor in a specific universal threshold (like the
food Sphere Standard of 2100 kcal per person per day)
While Sphere Standards exist they often need to be
contextualized and may not cover all non-food essential
needs
The non-food basket can be established with different
levels of detail depending on the available data and the
level of granularity desired
As for the food expenditures start by calculating the
mean (andor median) non-food expenditures for the
reference cohort If the expenditure data is detailed it can
be used to identify specific non-food needs Expenditures
can be analysed by non-food group (eg shelter hygiene
or transport) to design a non-food basket composed
of group-specific expenditures The precise non-food
components can vary by context but would generally
include the components discussed in the section on
the rights-based MEB below Some non-food items that
expenditure data has been collected for might need to be
excluded for the purpose of constructing the MEB (eg
tobacco which is hard to consider an essential need)
In theory it would be possible to establish a non-food
reference basket with specific quantities using the same
method as for food ie by dividing expenditures by prices
to arrive at quantities However this is usually not feasible
for non-food goods and services simply because non-food
expenditure data is often much harder to break down into
specific items than food expenditure data For instance
even if expenditures on clothing or transportation
are known relating this to exact clothing items or
transportation services and then obtaining accurate
prices for those itemsservices will often prove difficult if
not impossible Therefore as a general recommendation
in the expenditure-based approach when non-food
expenditure data is not available at the item level it is
best to keep the non-food basket to expenditures and not
provide quantities If reliable market price information on
relevant non-food items is available total expenditures
could be checked against prices to obtain an approximate
idea of the adequacy of the non-food expenditures
Particular groups of non-food expenditures may require
special attention due to their nature Box 9 highlights a
few examples
TIP BOXNON-FOOD EXPENDITURES ndashEXPENDITURES OF PARTICULAR INTEREST
$$
$
Box 9
Shelter expenditures can be a tricky component to deal with especially for urban populations If the share of the
population who rent accommodation is significant rent will typically be included in the MEB as it is the cost of shelter an
essential need Indeed it can form quite a significant part of the MEB However if the resulting MEB is compared to actual
expenditures to determine whether households fall below the MEB those who own their dwelling and therefore do not pay
rent might be classified as unable to cover their needs just because they do not have any major shelter expenditures
Therefore large single expenditures such as rent should be included with care and context will determine how shelter
expenditures are handled in the MEB Generally speaking if no or very few households in the population of interest have
major shelter expenditures such as rent this component should be left out of the MEB and no attempt made to impute it
(as is sometimes the case in poverty line estimations) If the majority of households rent their dwellings it is advisable to
include mean rent expenditures in the MEB The trickier case is when the households in the population of interest are split
between a significant number of households living in owned or no-rent housing and a significant number paying rent ndash
here it is difficult to reflect shelter expenditures adequately in the MEB Simply using mean rent estimations in the MEB will
underestimate the need for the renters while overestimating it for those who own their housing or do not pay rent In this
case insofar as data allows one solution could be to impute rent expenditures for the non-renters by estimating the
would-be rental cost for the type of housing they live in Doing this typically requires a housing module in the household
survey that contains information on ownership and types and sizes of housing so rental equivalents can be computed and
imputed for the non-renters
20
Minimum Expenditure Baskets Guidance Note | December 2020
NON-FOOD EXPENDITURES ndashEXPENDITURES OF PARTICULAR INTEREST
$$
$
Box 9
Health expenditures can also be challenging to capture adequately in survey data as such expenditures are often irregular
in nature Bear in mind that health expenditures usually consist of payment for goods such as medicines and for services
such as visits to the doctor When analysing the expenditures and deciding how to include them in the MEB consider which
services may be provided free of charge and what households pay themselves and at what cost30
Care should be taken when it comes to the underreporting of expenditures and treatment of expenditures that are
irregular in nature Remember that the MEB should include all recurrent essential needs but it typically does not include
one-off expenditures ldquolumpy expendituresrdquo such as marriage expenditures or dowries or investments Expenditures
on durables (for instance the purchase of vehicles or large household appliances) are also not included (in national poverty
lines the rental value of the durables owned by households adjusted for depreciation is sometimes included31 however
this is not recommended for MEB calculations)
Household expenditures on savings taxes and debt repayment are not usually included in the MEB as these types of
expenditures do not reflect actual consumption
Tobacco and alcohol are often included in expenditure surveys While households may choose to spend money on these
items they can fairly be assumed to be non-essential and are generally not recommended for inclusion in the MEB
The ldquoquick fixrdquo if data is very limited If the expenditure
data has no or very insufficient data on non-food
expenditures a ldquoquick fixrdquo solution is to use the average
non-food expenditure share of total expenditures This can
often be obtained from external sources such as monitoring
reports or food security assessments This is then added
COUNTRYEXAMPLE
Table a Non-food basket ndash valuesCoxrsquos Bazar
Value in MEB (takaHHmonth)
Non-food group
Toiletries and cleaning
Clothes shoes and towels
Cooking equipment
Education
Fuel and electricity
Medical treatment
Household textiles and small repairs
Communication
Transport
Total non-food
461
521
25
134
775
447
57
274
295
2990
Figure a Non-food basket ndash distribution Coxrsquos Bazar
Note The MEB for Coxrsquos Bazar was calculated for
analytical purposes in the REVA II assessment
It is not the operational MEB for the district
9Communication
10Transport
2Householdtextiles and
small repairs
15Medical
treatment
26Fuel andelectricity
5Education
1Cooking
equipment
17Clothes shoes
and towels
15Toiletries
and cleaning
EXPENDITURE-BASED NON-FOOD REFERENCEBASKET EXAMPLE FROM COXrsquoS BAZAR
Box 10EG
to the cost of the food basket to arrive at the total MEB
However when using an additional data source analysts
should understand how the average share of non-food
expenditures has been calculated and what sample it has
been derived from as it may not reflect the consumption
patterns of the reference cohort
30 The WHO and Global Health Cluster guidance on health expenditures in the MEB has some useful insights into household health expenditures See WHO and Global Health Cluster ndash Cash Task Team 2020 31 Deaton and Zaidi 2002
21
Minimum Expenditure Baskets Guidance Note | December 2020
52 The rights-based approachIn humanitarian contexts ldquoessential needsrdquo have been
understood as referring to access to full rights as set out by
international humanitarian law and the Humanitarian Sphere
Standards The term ldquorights-based MEBrdquo is derived from
this understanding According to the operational guidance
on multipurpose cash grants32 international humanitarian
and human rights law protects the right of crisis-affected
persons to food33 drinking water soap clothing shelter and
lifesaving medical care Humanitarian Sphere Standards
builds on this definition and outlines minimum humanitarian
standards in the areas of food security and nutrition
shelter and settlement health and WASH (water supply
sanitation and hygiene)34 In some contexts residency or legal
documentation is also included Humanitarian standards
for education are outlined in the Education in Emergencies
Minimum Standards Handbook35
The rights-based approach entails defining a detailed list
of the food and non-food items that make up the MEB
reference basket and pricing them using current market
prices MEBs built by the Interagency Cash Working Group or
other interagency coordination forum are often constructed
following the rights-based approach with each sector or
cluster contributing to the needs in their respective sectors
In these cases WFP is usually responsible for defining the
food component of the MEB For both food and non-food
items the reference basket is typically produced or cross-
checked through focus group discussions with the population
of interest partners and key informants It is usually put
together based on the needs of an average-sized household
1 Establish the food basketTo construct the food basket for a rights-based MEB compile
a list of food items and their quantities The Sphere Standards
offer a useful starting point recommending a diet of 2100
kcal per person per day with 10ndash12 percent of daily energy
intake from protein and 17 percent from fats36 The food
basket should be adapted to local diets and preferences
2 Establish the non-food basketOnce the food basket has been established a non-food basket
should be added In the rights-based approach this is typically
done by quantifying needs by producing a list of items by
sector Some examples are found below
Shelter This is the cost of accommodation that meets
basic shelter needs and rights What this means in practice
will depend on the context driven for example by weather
conditions and what is realistically available to the population
Utilities These include the cost of basic utilities such as safe
drinking water and depending on the context electricity
Non-food items These reflect basic household needs
related to cooking clothing and hygiene plus other general
household items Cooking gasfuel or firewood is often
included In line with the definition of the MEB the list should
focus on recurrent needs In practice these non-food items
can look very different depending on the context 38
Services This includes the costs of accessing basic services
such as healthcare education transport and communication
Healthcare costs are often difficult to quantify since they
are inherently irregular large and unpredictable Typically
however only basic minimum needs are covered in the MEB
such as eg two visits per year to the doctor expenses for
critical events deliveries and medicines are sometimes also
included Note that even if a need is not covered by the MEB
it does not mean that these needs do not need to be met for
the population of interest Health can be an example of this
health needs are often better met through service provision
than purchased through the market and therefore may
be only partially reflected in the MEB However guidance
from WHO and the Global Health Cluster notes that people
tend to have some level of health expenditures even when
COUNTRYEXAMPLE
SHELTER IN THE MEBFOR SYRIAN REFUGEES
EG Box 11
For the Syrian refugee operation in Turkey the MEB
includes the costs of shelter that meets certain
standards such as a minimum of 35 m2 per
person access to a toilet and running water
32 UNHCR et al 2015 33 Defined as energy needs not considering full nutrient needs (protein vitamins minerals etc) 34 See the Sphere Standards Handbook 35 INEE 2010 36 Further recommendations on micronutrient requirements can be found in the Sphere Standards Handbook37 Hobbs 201638 For some refugee contexts the Office of the United Nations High Commissioner for Refugees (UNHCR) has lists of specific items which can be considered for the MEB
22
Minimum Expenditure Baskets Guidance Note | December 2020
policies are in place that require the free public provision of
health services39
Education costs usually cover school fees materials
uniforms and transport depending on what households
have to pay themselves and what is publicly available
Transport and communication needs are often defined as
the average transport and communication costs reported by
household surveys and then validated with the communities
COUNTRYEXAMPLE
EXAMPLE OF A RIGHTS-BASED MEBFOR NORTHEAST NIGERIA
Box 12EG
The northeast Nigeria cash working group designed a MEB for a household of seven people40 the resulting reference
basket is shown below
Sectorgroup
Item Quantity(7 pers HH)
Sectorgroup
Item Quantity(7 pers HH)
Cooking fuel
WASH
Cooking fuel
WASH
Transportation
Communication
Health
Education
Firewoodbriquette
charcoal
Water + vendor fee
Bathing soap
Laundry soap
Sanitary pads
Firewoodbriquette
charcoal
Water + vendor fee
Bathing soap
Laundry soap
Sanitary pads
Rides
Airtime 500 NGN
Average expense
Pen
Pencil
Notebook
1 bag
158 jerrycans
13 bars
3 bars
4 packs
1 bag
158 jerrycans
13 bars
3 bars
4 packs
10 rides
1
7 pers
3 pcs
3 pcs
3 pcs
Table a MEB example northeast Nigeria
27 kg
45 kg
135 kg
18 L
27 kg
18 kg
36 L
09 kg
144 kg
2 kg
2 kg
1 kg
05 kg
12pcs
1L
Food Rice
Maize
Beans
Palm oil
Groundnuts
Sugar
Vegetable oil
Salt
Onion
Non-leafy vegetables
Leafy vegetables
Fruits
Meats
Chicken eggs
Vinegar
communication needs can also be specified as the cost of a
SIM card with a certain amount of data or airtime
3 Price the reference basketWith the food and non-food reference baskets established
the list of items and quantities are now priced using updated
prices from markets relevant to the population of interest
The pricing should be done based on actual current market
prices This produces the final rights-based MEB
39 WHO and Global Health Cluster ndash Cash Task Team 2020 40 Cash Working Group Nigeria 2018
23
Minimum Expenditure Baskets Guidance Note | December 2020
MEB APPROACHES ndash CONSTRUCTION SUMMARYBox 13
HOW TO
Rights-based approach
Establish the food basket
Define a list of relevant and locally preferred and
available food items and their quantities The Sphere
Standards can be used as a reference
Establish the non-food basket
Define a list of essential non-food items relevant to the
population of interest and their quantities Services such
as education or transport can also be included The list is
usually put together sector by sector
Price the basket
Use current market prices for the food and non-food
items in the reference baskets to calculate the price of
the basket Use prices from markets relevant to the
population of interest
1
2
3
4
1
2
3
Expenditure-based approach
Prepare the expenditure data
Ensure the data is cleaned Compute expenditures by
combining cash and credit expenditures the value of
consumed own production and consumed assistance
for both food and non-food expenditures Compute
expenditures as per capita figures
Select the reference cohort
Identify households ldquojust able to meet their essential
needsrdquo using indicators such as FCS FCS-N housing or
others excluding households in extreme quantiles of
expenditure distribution or other criteria or
combination of criteria Check the sensitivity of the
results to the selection of reference cohort
Establish the food basket
Calculate mean (median) food expenditures by food
group or item Either stop here or ndash to obtain a refence
basket ndash estimate consumed quantities check the
calorie content of the resulting quantities and consider
scaling them to Sphere Standards Price the basket
using market prices or prices derived from the
household data
Establish the non-food basket
Calculate mean (median) non-food expenditures by
non-food group or item If item-level data and prices
are available it is possible to derive a non-food
reference basket using same methodology as for the
food basket otherwise the non-food basket will
comprise the expenditures at the group level If a
quick-fix solution is needed add the average household
non-food expenditure share to the food MEB
53 Summary and data needs for expenditurendashbased and rights-based approachesBox 13 summarizes the steps to follow in order to construct a
MEB using an expenditure-based or a rights-based approach
24
Minimum Expenditure Baskets Guidance Note | December 2020
Qualitative understanding
of essential needs for the
population of interest
Representative household
survey with detailed
expenditure module
List of ldquorights-basedrdquo needs
Price information
Focus group discussions with key informants or population
of interest
Literature review of existing information on the essential needs of
the population of interest
WFP essential needs assessment emergency food security
assessment or comprehensive food security and vulnerability
analysis or other representative pre-assistance baseline survey
National household budget surveys household income and
expenditure surveys living standard measurement surveys or
other large-scale household survey
Clusters Cash Working Group other interagency forum
Sectoral assessments other secondary information
Price data series covering the area of interest for relevant food
and non-food items and services from WFP (Dataviz41 has
up-to-date price information) or partners
Price indices from national statistical offices
Prices derived from household expenditure data where quantities
are also reported
Suggested sources Expe
ndit
urendash
base
d
Righ
tsndashb
ased
INFORMATION NEEDS AND SOURCESMEB APPROACHES
Box 14
HOW TO
Information need
TIP BOXWHAT IF DATA USINGA HOUSEHOLD ECONOMY APPROACH IS AVAILABLE
$Box 15
The household economy approach (HEA) developed by Save The Children is commonly used for analysing food security and
livelihoods It is based on understanding how households normally access income food and other itemsservices required
for survival established through a baseline analysis As part of the baseline the HEA defines livelihood zones where
households share similar strategies for obtaining food and income It also distinguishes households within these livelihood
zones in at least three (often four and sometimes more) wealth groups The HEA baseline quantifies the sources of food
and income and the expenditure patterns for each wealth group and livelihood zone
The information collected on expenditures can be used as a data source for calculating a MEB However due to the relative
nature of the wealth cut-off points used there is no set standard regarding which group should be the reference for the
MEB If HEA data is utilized it is important to understand how it was collected ndash the HEA is simply an analytical framework
not a set method of data collection Thus while HEAs are often conducted through qualitative methods (eg focus group
discussions) they may also be based on quantitative modules in household surveys The latter yields more rigorous
information however qualitative data can be used but should be cross-checked or triangulated with other sources
39 See VAM data portal at httpsdatavizvamwfporg
25
Minimum Expenditure Baskets Guidance Note | December 2020
54 Expenditure-based or rightsndashbased approach Pros and consThere are advantages and disadvantages to both types of
approach which should be kept in mind when constructing
the MEB
The expenditure-based approach has the advantage that it
directly reflects the actual demand of the population of interest
as it uses survey data to examine peoplersquos consumption
behaviour It is also fairly straightforward to carry out if good
survey data on the population is available One disadvantage is
that it can be difficult to put into practice when the population
of interest is generally poor (such as in a pre-assistance
refugee situation) because the number of households who can
constitute the reference cohort can be too small to analyse
Also care has to be taken when looking at expenditure patterns
only as the reference cohort may not always cover all of their
essential needs to a desired level (from a ldquorightsrdquo perspective)
For example the food patterns for those ldquojust able to meet
their essential needsrdquo may not always be very nutritionally
diverse as they are based purely on consumption behaviour42
In general the expenditure-based approach should not be applied
without good quality household expenditure data
TIP BOX ADVANTAGES AND DISADVANTAGES OFDIFFERENT APPROACHES TO ESTABLISHING MEBS
Box 16
Pros
Cons
Expenditure-based Rights-based
Straightforward to carry out if household data
is of good quality
Builds on actual consumption patterns of the
population of interest
Difficult to identify reference cohort if
everybody is poor
Survey data may not capture all essential needs
fully from a ldquorightsrdquo perspective
Survey data is not needed
Effective demand can be different from identified
needs leading to a MEB that does not reflect
actual demand and making comparison with
monitoring data tricky
Contains incentives to inflate sector-specific needs
The advantage of the rights-based approach is that
it can be used to construct a MEB without survey data
(although survey data is needed to monitor the MEB) One
disadvantage is that the effective demand of households
can look quite different from the basket that results from
this approach Another disadvantage is that particularly
when constructed in an interagency setting a rights-based
MEB can easily become an instrument for different partners
to compete for and secure funding There is a substantial
incentive to include excessively high sectoral needs if sector-
specific interventions are envisaged Finally if the MEB is
very detailed but the expenditure module in the household
surveys used to monitor peoplersquos expenditures against the
MEB is very crude comparison is difficult and therefore the
practical use of the MEB can be limited Many households
may fall below the MEB simply because of the discrepancy in
methods between the MEB and the monitoring data This is
similar to the issue previously discussed regarding the use of
national poverty lines
Box 16 summarizes the advantages and disadvantages of the
two approaches
42 A study conducted in Nepal showed that the food poverty line is well below the so-called ldquonutrient povertyrdquo line (see Geniez et al 2014)
26
Minimum Expenditure Baskets Guidance Note | December 2020
6 Arriving at a realistic and operationally relevant MEBRegardless of which processes and approaches are used to
construct the MEB it is crucial to arrive at a final result that
is a realistic picture of the cost of essential needs for the
population of interest rooted in actual consumption
behaviour This section looks at how approaches can be
combined to generate a hybrid MEB and how the result can be
ldquoreality checkedrdquo and validated
61 Combining approaches the hybrid MEBAs described in section 54 there are disadvantages to the
expenditure-based and the rights-based MEB approaches that
can affect the final MEB One way to overcome this challenge
may be to combine information from each approach in
a ldquohybridrdquo MEB This means making sure that the MEB is
consistent with the actual consumption behaviour of the
population of interest as found in expenditure data while
keeping the rights-based lens There is no one way to go about
this the method is subject to the availability of expenditure
data and other information on essential needs as well as the
objective of the MEB
When good quality expenditure data with a large enough
sample size is available for constructing the MEB it is good
practice to use the expenditure-based approach as a basis
for the analysis as far as possible If the expenditures of
the reference cohort are subsequently found not to reflect the
costs of covering certain essential needs for the population of
interest rights-based information should be used to reinforce
the MEB with a hybrid model If expenditure data is not
available and cannot be collected a rights-based MEB can be
constructed but should be cross-checked against any available
household-level information on consumption patterns
When starting with the construction ofan expenditure-based MEB
Did the household survey capture all essential needs or
are some not included in the data at all
If some needs are wholly overlooked consider using
rights-based information to capture them but ensure these
needs are actually in demand by the population of interest
and only missing because the survey did not capture them
Are the expenditures that are typically trickier to capture
well reflected and are the reference cohortrsquos expenditures
on them adequate from a rights-based perspective
For example if education expenditures are completely
inadequate for the reference cohort (and this is not because
the reference cohort selected is ldquotoo poorrdquo) consider using
rights-based information to capture them eg by using the
cost of school fees or school supplies like books or
uniforms
Be particularly careful with the inclusion of needs where the
supply of goods or services is far from adequate or may be
inexistent The MEB needs to ultimately reflect consumption
behaviour so adding goods or services that are not
available to the population of interest or not in demand
will lead to an unrealistic MEB
When starting with the construction ofrights-based MEB
Are the identified needs in line with the actual
consumption patterns of the population of interest
Check the reference baskets against any available
information on demand and consumption and adjust items
and quantities to reflect actual consumption patterns This
could be done using data on consumption shares by food
group and non-food group for example
Are there needs that people consider essential and choose
to spend resources on but are not captured by any sector
Check the reference baskets against any available
information on demand and consumption and adjust items
and quantities to reflect actual consumption patterns
The key to constructing a hybrid MEB lies in triangulating
information and asking the right questions during the
analysis When constructing a MEB consider the following
27
Minimum Expenditure Baskets Guidance Note | December 2020
Box 17 contains examples of hybrid MEBs constructed in different contexts
COUNTRYEXAMPLE
HYBRID MEBS IN URBAN SETTINGS IN KINSHASATHE DEMOCRATIC REPUBLIC OF THE CONGOAND FOR SYRIAN REFUGEES IN TURKEY
Box 17
For the MEB calculated as part of an urban assessment in Kinshasa43 a hybrid approach was chosen to deal with
hard-to-capture but essential expenditures such as health and education Health costs are often difficult to estimate as they
are not regular and when they do occur they often make up a large share of monthly expenditures The analysts decided to
estimate health costs through a rights-based approach instead of using expenditures from the survey Qualitative
information from key informants was used to define the cost of one doctorrsquos visit per year for each household member In
each commune the median cost was between CDF5000 and CDF6000 per visit this was represented in the MEB as
CDF500 per household member per month Over-the-counter medication was also included as part of health-related
expenditure through the addition of a per-capita expenditure of CDF1500 every two months sufficient for a course of
antimalarial drugs or antibiotics and simple medication such as painkillers or anti-inflammatory drugs
In Turkey expenditure and price data from different sources was used to assess update and adjust an existing
rights-based MEB44 for Syrian refugees living in the country A hybrid food basket was calculated using detailed information
on the consumption behaviour of Syrian refugees in Lebanon collected through itemized receipts from food assistance
e-cards The resulting food basket was triangulated with the less detailed information available from a household survey on
Syrian refugees in Turkey The results showed strong consistency between consumption behaviour of both groups
The resulting food reference basket for the MEB was then priced with official price statistics data and inserted into the
rights-based MEB Quantities of non-food items were kept as before but updated with current price data To ensure that
the MEB reflected consumption behaviour expenditure shares were triangulated with household data See table a
To value and update the MEB price data was required The official price statistics included higher quality items and brands
consumed more by the average Turkish population than by the poorer refugees To correct for this the difference between
the price of the MEB and the food expenditures of a non-poor cohort were assessed and a correction factor applied to
compensate for the overestimation of the updated MEB
Commodity
Table a Food reference basket ndash MEB for Syrian refugees in Turkey
Daily ration perperson in gram
Dailykilocalorie
Old referential food basketDaily ration perperson in gram
Dailykilocalorie
Revised Turkey food basket
150
200
50
20
30
40
20
8
30
30
5
0
0
0
0
540
684
186
29
65
137
0
28
116
265
0
0
0
0
0
100
50
0
70
0
50
30
50
50
25
5
250
50
30
5
Rice white medium grain
Bulghur wheat
Pasta
Egg whole chicken fresh
Poultry
Beans dried
Cucumber
Cheese canned
Sugar
Oil sunflower fortified
Salt iodised
Bread made from wheat
Yoghurt whole milk (leban)
Tomatoes red ripe
Tea black nutrients per 100ml of brewed tea
360
171
0
100
0
170
0
178
194
221
0
675
31
5
0
Total Kcal 2050 Total Kcal 2104
43 WFP et al 201844 WFP 2018
28
Minimum Expenditure Baskets Guidance Note | December 2020
62 Reality checks and validation with stakeholdersIn addition to asking the right questions of the data as
described in the previous section it is crucial to reality check
results when constructing the MEB This means understanding
whether the MEB provides a picture of the cost of living that
matches the reality on the ground
First of all it is important to check the MEB result with the
real circumstances of the population of interest Focus group
discussions andor key informant interviews can be held when
starting work on the MEB and after a result is obtained in
order to ensure that the MEB is a true reflection of needs and
priorities
The MEB figures can be compared with the national poverty
line ndash even if it is not advisable to use the poverty line directly
as the MEB it is good practice to check the MEB results against
it They can also be checked against any social assistance
transfer values provided in government programmes the
minimum wage or the casual labour rate or any other
information available about needs and cost of living For
instance if the MEB is much higher than what the wages
from one month of work for a typical household can buy
that could indicate that it needs adjustment and that some
of the analytical steps need to be revisited ndash as long as the
wage rate itself is reasonable The same goes for the poverty
line ndash if the two are very far apart it could be a sign that the
MEB analysis should be crosschecked Perhaps the reference
cohort was not adequately selected some sectoral needs were
overestimated or there is a large proportion of consumption of
own production has not been properly taken into account
Something that is often of particular interest is the nutritional
composition of the food part of the MEB As seen above MEB
construction typically starts from the Sphere requirement of
2100 kcalpersonday However since the MEB follows the
actual consumption behaviour of the population of interest
(especially when following an expenditure-based approach)
the resulting food basket reflects what households actually
eat which is not necessarily a nutrient adequate diet If the
basket is found to be very low in essential nutrients it could
be that the reference cohort was not well selected and a
wealthier cohort with a more balanced diet at the 2100 kcal
personday threshold might need to be identified45 However
selecting better-off households will not necessarily lead to a
more nutritionally balanced basket as food preferences are
influenced by a range of factors in addition to budget
Analytical tools to determine the cost of nutritious diets
include Cost of the Diet (CotD) developed by Save the Children
UK and used by WFP in the Fill the Nutrient Gap Analysis
CotD uses linear programming to establish the lowest cost
diet that can meet requirements for energy protein fat and
13 micronutrients for individuals in a population considering
age gender body weight physical activity level and whether
a woman is pregnant or breastfeeding CotD can be thought
of as the lowest cost of an optimal diet considering individual
requirements It is therefore useful in illustrating the needs
of vulnerable populations and their nutrient intake barriers
However it is important to keep in mind that a MEB food
basket may not deliver adequate nutrient intake when used
to set a transfer value for households even if aligned with
an optimal diet As noted above because of household
consumption choices and food allocation within households
having more money to spend may not necessarily lead
households to buy more nutritious food
MEBs should be first and foremost built on consumption
patterns that reflect actual behaviour A large difference in
cost between the MEB food basket and CoTD may hence
be driven by factors such as low availabilityhigh cost of
nutritious foods or household preferences The WFP technical
note on Fill the Nutrient Gap and minimum expenditure
baskets offers further insights into the complementarities
of the two analyses and how to use them on conjunction for
programming purposes46 When a MEB is operationalised
additional nutritional considerations could be necessary
It is important to check the MEB result with the real circumstances of the population of interest Focus group discussions andor key informant interviews can be held when starting work on the MEB and after a result is obtained in order to ensure that the MEB is a true reflection of needs and priorities
45 Note that the 2100 kcal Sphere Standard for daily diet is an estimate based on a population average Nutrient needs vary across the lifecycle It is also recommended that a food basket based on the 2100 kcal threshold should include a minimum of between four and five different food groups
46 Also see WFP 2020b
29
Minimum Expenditure Baskets Guidance Note | December 2020
COUNTRYEXAMPLE
TURKEY NON-FOODBASKET MEBCOMPOSITION VERSUSACTUAL CONSUMPTION
Box 18
In the original rights-based MEB constructed for the
Syrian refugee operation in Turkey 17 percent was
devoted to education expenditure The average
education expenditure share in the pre-assistance
expenditure data was under 2 percent with little
variation by household vulnerability status50 The
large expenditure share in the MEB reflects the
costs for transportation to schools in rural areas
where no buses are available and where the only
way for households to send children to school is to
hire private transport In order to provide for
childrenrsquos right to education the transport costs are
counted for in the MEB
Since the MEB was constructed to assure full access
to all rights the high education expenditure was
justified However a comparison of the theoretical
costs for basic needs as estimated by humanitarian
partners and the actual consumption choices of
households can reveal divergence Even if
households are assisted there is nothing to say that
they will actually start hiring private transport to get
their children to school ie the principal ldquoneedrdquo
identified by humanitarian actors will not necessary
translate into effective demand if the MEB is used as
a basis for transfer value calculations While an
important access problem has been identified other
complementary interventions will likely be needed
to address it
depending on the objective of a particular intervention and
the choices targeted households are likely to make regarding
food and nutrition once they receive a transfer Targeted
nutrition interventions may be needed such as providing
certain nutritious foods for specific groups (through in-kind
assistance or commodity vouchers) and social behavioural
change communication to nudge people towards making
better choices for health and nutrition47 Expenditure data can
be helpful to understand the consumption patterns of people
at different points of the wealth distribution Fill the Nutrient
Gap analysis also examines packages of blanket and targeted
household interventions to estimate the most cost-effective
way to address the nutrient requirements of different target
groups For further considerations including complementary
programming please consult the WFP interim guidance on
transfer values48
MEBs are often constructed in an interagency context such
as the Cash Working Group which helps facilitate dialogue
and validation from the beginning of the process However
sometimes not all clusters or key partners are engaged in such
forums which can limit the buy-in and understanding of the
MEB unless there is adequate consultation It is also essential
to consult government stakeholders and development
partners Endorsement by government counterparts could be
needed if there are existing government safety nets or policies
regarding minimum wages For example if the population of
interest for the MEB are refugees or IDPs and a transfer value
based on the MEB is higher than the social assistance provided
by the Government to the resident population this could be a
point of contention Development partners might also wonder
why a MEB is needed in addition to the national poverty line
Dialogue and validation of the final MEB with partners is
therefore vital49
47 The Fill the Nutrient Gap (FNG) analysis of which CotD is often part can help understand what programming might be needed and how interventions can be combined to improve dietary intake and reach food and nutrition objectives
48 WFP 2020c49 The Cash Learning Partnershiprsquos MEB Tip Sheet contains useful advice on the interagency processes around constructing a MEB Baizan and Klein 201950 Hobbs 2016 and WFP 2018
30
Minimum Expenditure Baskets Guidance Note | December 2020
Naturally the needs of a household increase with the size of
the household How can the different magnitude of needs
for households of different sizes be taken into account when
constructing the MEB
One simple approach is to calculate the per capita MEB
and simply scale it up for households of different sizes For
example if the MEB is constructed for a household of six and
equals USD 120 the per capita MEB would be USD 20 USD and
the MEB for a household of three people would be USD 60
However this proportional scaling ignores one important
factor while the needs of a household grow with each
additional member the increase may not be proportional
This is because some goods consumed within a household
such as food are ldquoprivateldquo in character ndash once a person has
consumed it no one else can consume the same ndash while other
goods such as housing are ldquocommonrdquo or ldquopublicrdquo meaning they
can be shared among household members Hence the needs
for housing space or electricity are not necessarily three times
higher for a household with three members than for a single-
person household This is called economies of scale Changes
in household composition can also influence how needs
grow with household size consider large households with
many children who do not have the same needs as adults
Economies of scale are particularly relevant in contexts where
shared goods constitute a major part of household essential
needs for example where rent payment is a large expense A
one-bedroom apartment may be necessary for a one-person
household but could also possibly house a family of three
who would then share the expenditure When in a context of
large economies of scale the MEB is adjusted to household
size by scaling up average per capita needs proportionally
to household size the resulting MEB will underestimate
the needs for small households and overestimate the
needs for large households by construction This is because
the per capita needs for small households are larger than
this simple scaling reflects This can have implications if the
per capita MEB is used to inform targeting or transfer value
calculations For instance if the needs of smaller households
are underestimated they are more likely to be miscategorized
as being able to meet their essential needs and might therefore
not receive the assistance they require
7 Accounting for household composition and economies of scale
Expenditures
Household sizeno economies of scale expenditures proportional to household sizeeconomies of scale expenditures non-proportional to household size
1 2 3 4 5 6 7 8 9 10
EXPENDITURES PER CAPITA
Figure 3 Economies of scale and expenditures per capita ndash illustration of the concept
31
Minimum Expenditure Baskets Guidance Note | December 2020
In other contexts economies of scale might be smaller
because of the higher relative importance of ldquoprivaterdquo goods
such as food and certain non-food items (for example soap)
or if shared costs such as shelter are not prominent How
household size is catered for in the MEB ultimately depends
on context and how needs are related to household size
Some suggested steps to account for economies of scale and
household composition are listed below
When examining how to account for different household
sizes in the MEB start by ascertaining whether economies
of scale exist and to which extent51 Figure 3 provides a
hypothetical illustration of two extreme cases no economies
of scale at all and strong economies of scale If there are no or
little economies of scale the per capita expenditures will be
very similar across household sizes while they will decrease
by household size if economies of scale are present52
Plotting per capita expenditures against household size
helps enable for this type of examinations It can be useful
to further disaggregate the analysis into different categories
(for instance food non-food or shelter expenditures per
capita) to understand which expenditures might be driving the
economies of scale if present
Box 19 illustrates two different country examples
expenditures by household size for Syrian refugees in
Lebanon and for vulnerable populations in Coxrsquos Bazar
Bangladesh In Lebanon where shelter plays an important
role household expenditures double only at a household size
of 5 and they triple at a household size of 11
COUNTRYEXAMPLE
ECONOMIES OF SCALE INLEBANON AND COXrsquoS BAZAR
Box 19
Figure a shows expenditures by household size compared to one-person households For Syrian refugees in Lebanon
average expenditure doubles only when the household size reaches five and it takes 11 members to triple the expenditures
of a one-person household The economies of scale are therefore large primarily due to the importance of shelter costs for
the refugees
In Coxrsquos Bazar in contrast total expenditures grow almost proportionally with household size (double at a two-person
household triple at a three-person household) Slight economies of scale can be seen for food For non-food expenditures
larger households even spent more per person From this data the economies of scale seem to be small
Figure a Increase in household expenditure by household size comparedto one-person households
Multiplicationfactor
Household sizeHousehold size
100
90
80
70
60
50
40
30
20
10
Coxrsquos Bazar (Bangladesh)Lebanon
1 2 3 4 5 6 7 8 9 10 11
Total Food Non-food
1 2 3 4 5 6 7 8 9 10 11
Note Figure based on authorsrsquo calculations Data from the Vulnerability Assessment of Syrian Refugees in Lebanon (VaSyr) 2017
and the Refugee influx Emergency Vulnerability Assessment (REVA II) 2019
51 Expenditure data is required to perform this analysis If no information on expenditure exists information on how needs change with household size can be collected through qualitative means such as focus group discussions or key informant interviews
52 Theoretically it is possible to also analyse expenditures by household composition but sample sizes rarely allow for such detailed disaggregation
32
Minimum Expenditure Baskets Guidance Note | December 2020
If the analysis reveals small economies of scale or none at all it is reasonable to use a per capita approach to scale up the MEB proportional to household size
Even for food strong economies of scale can be detected
which could be a result of large households being able to
buy food in bulk at a lower price However in Coxrsquos Bazar
where shelter and other shareable non-food goods are of less
importance household expenditures are close to proportional
to household size
If the analysis reveals small economies of scale or none at all
it is reasonable to use a per capita approach to scale up the
MEB proportional to household size If significant economies
of scale are present it is important to think about how to
take this into account when constructing the MEB Here are
some suggestions
One possible solution (in the expenditure-based
approach) is to disaggregate (or re-select see below)
the reference cohort for each household size sub-
sample and using the expenditures for each of these
cohorts construct specific MEBs for each household
size53 This approach takes into account economies of
scale by looking directly at the specific needs of different
size households but only reflects average differences
in household composition within each household size
The approach will most likely suffer from very small
sample sizes once analysis needs to be performed by
household size If this is the case household sizes could
be grouped into categories so that the analysis uses sub-
samples eg for household sizes 1ndash2 3ndash5 and 6ndash8 etc
or other groupings meaningful for the context When
following this approach bear in mind that if the reference
cohort is selected based on expenditure distribution
characteristics such as the removal of extreme deciles or
quintiles this procedure of removal of quintiles or deciles
needs to be repeated within each household size (or
household size group) Otherwise if there are economies
of scale for consumption there is a risk of skewing the
sample against the smallest and largest households
because their per-capita expenditures will be at the
extreme ends of the expenditure distribution
Another solution is to divide the MEB content into
ldquoprivaterdquo (non-shared) and ldquopublicrdquo (shared) consumption
For example food could be non-shared and rent and
fuel shared Examine the MEB expenditures for the
non-shared and shared goods for an average sized
household (or for household sizes around the average
for instance 4ndash6 members in order to leverage a larger
share of the sample) The non-shared value can then be
scaled proportionally to household size while the shared
value is held constant across household sizes This way
the resulting MEB consists of a lsquoflatrsquo and a proportional
element54 This is a relatively crude but intuitive way to
approximate economies of scale Figure 4 provides a
simple illustration of this approach
In the literature on poverty the most common solution
used to adjust for economies of scale and difference
in household composition is to use adult equivalents
instead of per capita numbers These equivalence scales
assign an ldquoadult equivalent numberrdquo to each household
depending on its size and composition taking into
account economies of scale as well as the different needs
of children and adults ie household composition For
example the first adult in the household is counted
as 1 and each additional adult as for example 07 A
child under 15 is counted as a fraction of an adult (eg
05) The effective adult equivalent household size is
then the sum of these adult-equivalent fractions55 Next
total household expenditures are divided by the adult
equivalent household size The MEB is then calculated
using these adjusted per-adult-equivalent expenditures
While this is not necessarily a complicated approach
from an analytical point of view equivalence scales can
53 See Lanjouw (1998) on the construction of poverty lines specific to household size (and composition)53 Alternatively the flat element can also be lsquosemi-flatrsquo and set according to household size groups ndashby examining shared costs and applying the same flat value within eg household size groups 1-2 3-5 6-8 or other
groupings as dictated by the context 53 One common equivalence scale is the OECD scale it assigns the weight 1 to the household head 07 to all additional adults and 05 to all children A household with five people say two adults and three children
consists of 32 adult equivalents (1+07+05+05+05) This is a common scale used in many developing and developed countries Another common scale is to give weight 1 to each adult and different weights to children depending on their age For the official poverty line in Zambia the following weights are given to children 0ndash3 years 036 4ndash6 years 062 7ndash9 years 076 and 10ndash12 years 078
33
Minimum Expenditure Baskets Guidance Note | December 2020
MEB - COMBINING FLAT ANDPROPORTIONAL ELEMENTS -ILLUSTRATION
MEB value
Household size
1 2 3 4 5 6 7 8 9
140
120
100
80
60
40
20
0
Proportional element - non-shared part of MEB
Flat element - shared part of MEB
MEB value per capita
Figure 4 Combining flat and proportional elements in the MEB
prove challenging when operationalising the MEB If
equivalence scales are used in constructing the MEB they
will also need to be applied when measuring household
expenditures compared with the MEB for gap analysis
against the MEB and in monitoring Translating the
concept of equivalence scaling into operational decision
making may therefore prove tricky Additionally results
can be quite sensitive to the choice of equivalence scales
so selecting appropriate scales is important yet often not
straightforward and a range of different scales exist56 In
some countries country-specific equivalence scales may
have been devised for the purpose of the calculation of
the national poverty line
No matter the approach the recommendation is always
to leverage data analysis as much as possible in order
to understand how needs evolve with household size
(and possibly composition) while keeping in mind that
the final MEB needs to be operationally relevant
Particularly in the (common) cases where MEBs are
used to calculate household transfer values it is worth
considering what level of analytical granularity can
feasibly be turned into programmatic action In some
cases it may not be operationally possible to handle
different per-capita size transfers for differently sized
households and the extra effort of achieving accurate
MEB figures by household size may not be worth it
The same general recommendation as for all aspects
of MEB construction also applies here the final result
should be realistic a fair depiction of needs and an
operationally relevant product
56 See for instance httpwwwoecdorgeconomygrowthOECD-Note-EquivalenceScalespdf
34
Minimum Expenditure Baskets Guidance Note | December 2020
A SMEB can be expenditure-based or rights-based or a hybrid of the two approaches depending on data availability and programmatic requirements
The SMEB is the absolute minimum amount required to maintain existence and cover lifesaving needs which could involve the deprivation of certain human rights
A survival minimum expenditure basket (SMEB) is often
constructed alongside a MEB While the MEB is defined as
what a household requires in order to meet their essential
needs on a regular or seasonal basis and its average cost the
SMEB is the absolute minimum amount required to maintain
existence and cover lifesaving needs which could involve the
deprivation of certain human rights However the concepts
of SMEB and MEB have not always been used consistently
by the humanitarian community and are sometimes used
interchangeably It is therefore important to be clear from the
outset of the analysis whether a MEB or a SMEB is the goal
A SMEB can serve at least two purposes First together with
the MEB it can be used to classify households into different
categories of economic capacity to meet their needs whereby
households whose expenditures fall below the SMEB have
highly insufficient economic capacity households between the
SMEB and the MEB have insufficient economic capacity and
households above the MEB have sufficient economic capacity
This information can then be used for profiling people in need
prioritizing beneficiaries or monitoring Second the SMEB
can inform programmatic decisions such as transfer values in
situations where immediate lifesaving assistance is required
The approaches presented here follow the MEB methods
adjusted to suit the different purpose of the SMEB
Accordingly a SMEB can be expenditure-based or rights-
based or a hybrid of the two approaches depending on data
availability and programmatic requirements
8 How to construct a SMEBExpenditure-based approach toconstructing a SMEBThe calculation of an expenditure-based SMEB is closely aligned
with the literature on how to estimate national poverty lines
While the MEB corresponds to an ldquoupperrdquo poverty line a ldquolowerrdquo
extreme or austere poverty line is often defined by taking the
food part of a MEB and adding this to the non-food needs
regarded as the essential minimum for household survival57
But how are survival non-food needs defined based on
expenditure data When people receive assistance it is
sometimes observed that households sell part of their food
rations to cover some non-food items These households forgo
some of the required food intake in order to cover what they
regard as survival non-food needs Using expenditure data to
construct a SMEB a similar idea is explored to calculate the
SMEB analysts identify those households whose total food AND
non-food expenditures are approximately equal to the MEB food
basket amount only In order to access non-food items these
households will compromise their food intake to some extent
because their total expenditures would only be enough to cover
their essential food requirements ie the food MEB anything
spent on non-food items means that they are not meeting their
essential food requirements It is therefore fair to assume that
the amount they choose to spend on non-food items must
be regarded by the households as absolutely necessary The
non-food expenditures of these households can therefore be
considered as the survival non-food needs The SMEB is then
calculated by adding these survival non-food expenditures
to the food MEB This SMEB allows households to meet their
essential food needs and their survival non-food consumption
Note that this approach requires a food MEB figure (either
already available or calculated as part of the SMEB analysis)
57 See Lanjouw 1998 and Haughton and Khandker 2009
35
Minimum Expenditure Baskets Guidance Note | December 2020
The steps for constructing an expenditure-based SMEB are
similar to those taken to construct a MEB with the following
additional considerations
1 Prepare expenditure data the expenditure data source can
be the same as that used for the MEB
2 Select the reference cohort this step is different The cohort
is selected by computing total household expenditures
and comparing them to the food MEB Households with
total expenditures equal to (or in an interval around) the
food MEB are selected as the SMEB reference cohort
3 Establish food basket and 4) Establish non-food basket
Using the SMEB reference cohort start by examining
how much these households spend on non-food items
Add this value to the MEB food value to arrive at the total
value of the SMEB To establish a food and non-food
basket there are two options i) use the MEB food basket
as the SMEB food basket and the non-food expenditures
of the SMEB reference cohort as the non-food basket
or ii) look at a third cohort of households namely those
whose total expenditures are around the just established
total SMEB level examine their food and non-food
expenditures and unpack those into food and non-food
baskets While both options will provide the same overall
value of the SMEB they will differ in composition and the
share of foodnon-food expenditures
Annex 2 provides an illustration of this method of constructing
a SMEB
Rights-based approach to constructing a SMEBThe rights-based approach to constructing a SMEB closely
follows the rights-based approach to constructing a MEB The
main difference is that needs and the items and quantities
included should be restricted to what is regarded as absolutely
necessary for survival ndash which can be challenging to define
This applies to both the food basket and the non-food
basket The MEB can be a starting point if there is one or
the Sphere Standards Sometimes rights-based SMEBs have
been constructed based on a MEB but with lower quantities
for certain items or by keeping some needs while removing
others
Hybrid SMEBs and reality checking resultsAs with MEBs it can be advantageous to combine the
expenditure-based and rights-based approaches to create
a hybrid SMEB The guiding principles are the same as for
the MEB with the difference that the resulting SMEB should
continue to contain nothing but the minimum required for
survival
The same logic applies to the ldquoreality checkrdquo of the SMEB
results as for the MEB it is crucial to ensure that the end
result is realistic and operationally relevant bearing in mind
the conceptual difference between the MEB and the SMEB It
is important to consult the population of interest as much as
possible to understand their views on what constitutes the
bare minimum needed by households to maintain existence
and cover lifesaving needs
COUNTRYEXAMPLE
RIGHTS-BASED SMEBS Box 20
In Lebanon health and education are excluded
from the rights-based SMEB while other needs are
covered with smaller amounts than in the MEB For
example the SMEB has a less diverse food basket
than the MEB58
In Syria the SMEB developed for the northern part
of the country includes food kerosene hygiene
products water and a small amount to cover other
survival goods Rent and utilities are not covered59
58 El Koury and Hajal 201659 Cash Based Responses Technical Working Group Syria 2014
36
Minimum Expenditure Baskets Guidance Note | December 2020
COUNTRYEXAMPLE
HYBRID SMEBs Box 21
For the MEB review in Lebanon for Syrian refugees60 a hybrid SMEB approach was chosen First an expenditure-based
SMEB was used calculating the non-food expenditures of households whose total expenditures equalled the food MEB
and adding this to the food MEB This resulted in very low expenditures on shelter (SMEB A) Due to the importance of
shelter in urban settings a second hybrid version was established calculating the non-food expenditures of households
whose total expenditures equalled the sum of the food MEB plus a rights-based value of a tent as survival shelter the cost
of which came from a rights-based SMEB (SMEB B)
Cohort HH size 4ndash6quint 2ndash4 acceptable FCS
n=923
Cohort total expenditure= food MEB
n=923210
Cohort total expenditure= food MEB + tent value
n=923210
SMEB Afood + survivalnon-food
Hybrid SMEB
437
83
40
93
20
16
29
19
314
1033
437
43
18
37
06
04
17
60
621
437
47
24
42
11
06
20
162
750
Food
Utilities (water gas fuel electricity)
Non-food items (hygiene clothing)
Health
Education
Transport
Communication
Other expenditures
Shelter
Total (USD)
Table a Hybrid SMEB for Syrian refugees
SMEB Bfood + survivalnon-food amp tent
In the Kinshasa urban assessment61 a SMEB was established in addition to the MEB comprising a basket of the most
essential items based on expenditure data used for the MEB For the food SMEB a less diverse diet was established by
excluding certain food items from the food MEB and rescaling the resulting basket to 2100 kcal For the non-food
component the only items included were those that were seen as critical to attaining the most basic standards for safety
food preparation water sanitation and hygiene These consisted of water cooking fuel hygiene products and lighting The
value for these items in the SMEB was derived from the median expenditures of the non-poor cohort
Expenditure-basedMEB
Expenditure-basedSMEB
60 Hohfeld et al 2020 61 WFP et al 2018
37
Minimum Expenditure Baskets Guidance Note | December 2020
91 Adjustment for seasonal or regional price differencesIf the MEB will only be used in one area where prices are
relatively homogenous it is often not necessary to adjust for
regional price differences However if the MEB is intended
for use across different urbanperi-urban andor rural
areas throughout the country it could be vital to adjust for
differences This means that the MEB can be priced differently
for different regions or rural or urbanperi-urban areas (or any
other division of areas that makes sense in relation to price
behaviour) There are a few approaches for this
Price the MEB based on available price data for different
regions or urbanrural areas For the food reference
basket this is most often possible using WFP food prices
or other similar price time series For non-food items
including housing utilities and services this can be more
challenging and may rely on price data collection by
different partners or require new data collection
For some countries price data provided by the national
statistical office is useful In the case of Turkey regional
purchasing power parity indices were used to provide
price estimates for components of the MEB for which
direct price information was not available
Use approximations from expenditure data If the
household survey has sufficient regional coverage the
expenditure levels in different regions can be explored
using the cohort of households just above the poverty
line Care should be taken in using this method
particularly if the sample size by region is very small
9 Additional considerations when constructing MEBs
92 Needs that vary by season or areaIn many countries where WFP works household needs change
with the seasons For instance in Turkey where winters are
cold households have additional needs for heating and warm
clothes to survive In other contexts there are significant
differences in needs between lean and rainy seasons These
changing needs could be a reason to construct different MEB
reference baskets to use at different times during the year or
to design seasonal top-ups In the case of items needed for cold
winters this is often referred to as ldquowinterizationrdquo
While this does not influence the approach used to construct
the MEB it does mean that analysts need to consider when
the data used in its construction was collected and whether
this influences the resulting MEB These considerations also
matter when using the MEB for monitoring if a monitoring
expenditure survey is used to analyse whether peoplersquos
expenditures are above or below the MEB threshold but
the survey is undertaken when prices are high or when
winters are cold if the MEB is not adjusted the results will
probably show a decrease in the percentage of people whose
expenditures are below the MEB as households have higher
needs andor are confronted with higher prices and thus
have higher expenditures without in reality being better off
In Turkey it was estimated that household needs during the
winter would result in a 48 percent increase in minimum
expenditures
In other cases different baskets might be necessary
for different areas of the country eg rural and urban
areas While the MEB should be constructed for a relatively
homogenous population it may sometimes be desirable to
construct a MEB covering all or most of a country where
consumption patterns vary substantially In this case it is
worth considering whether (some elements of) the MEB should
be different between areas Again the selected approach to
construct the MEB should not change but analysts need to
check where the data used in its construction was collected
and whether consumption patterns are very different between
different regionsareas For example in the case of Somalia
the main cereal consumed varies significantly between the
north and the south of the country so the MEB uses different
main cereals in the food reference basket according to region
While the MEB should be constructed for a relatively homogenous population it may sometimes be desirable to construct a MEB covering all or most of a country where consumption patterns vary substantially
38
Minimum Expenditure Baskets Guidance Note | December 2020
Constructing a MEB can be challenging in a sudden onset
emergency or if data is scarce or unavailable Below are some
ideas on how this can be resolved However from a ldquodo no
harmrdquo perspective it is important to emphasize that proxies
should only be used in the interim when no other solutions are
available
Use the national MEB or MEB reference basket If survey
data is not directly available and if the population of
interest is part of and similar to the overall population of
the country the national MEB or MEB reference basket
used for the national poverty line can be used if available
Bear in mind however that this basket should be used on
the condition that it corresponds to data that WFP collects
or has access to through partners or the Government to
ensure that monitoring can be conducted against the MEB
In its most basic form a MEB essentially only requires an
approximate value for the food basket and an estimate
of the average expenditure share that households use
on food Even if no relevant survey data is available this
information should be available to a country office or can
rapidly be collected or approximated
Consider using the minimum wage as a proxy Bear in
mind that while the MEB captures household-level needs
the minimum wage is individual-level income so an
assessment of how many minimum wages are needed per
household depending on the household size is required
It is also advisable to find out how the minimum wage has
been constructed
Ultimately a MEB is a good preparedness measure and should
be constructed before an emergency While both prices and
availability will be affected by an emergency it is still likely to
provide a useful starting point
11 Monitoring and updating the MEB111 Monitoring the cost of the MEBTo be operationally useful the MEB must be tracked and
updated over time to account for price changes If inflation is
high this might have to be done every month if it is low as
little as once a year could be sufficient This should be planned
for when the MEB is constructed to ensure that the costs of the
MEB components can be updated
There are different ways to update the MEB with price changes
If a reference basket is adequately defined (for food
and for non-food items) and prices are collected for the
individual items in the basket by WFP or its partners the
MEB can be priced anew using the updated prices for
each item and multiplying them by the quantities in the
reference basket
A simple solution is to adjust the MEB using the
nationalsub-national CPI or its components This
simply involves updating the cost of the MEB with
the increase (or decrease) in the CPI for the period
in question However in some contexts CPIs are not
updated or relevant for the target population Urban
areas are often over-represented in the national CPI on
the other hand prices and costs faced by for example
displaced populations can be very different from national
price levels In contexts of poverty where food constitutes
a large part of household expenditures the evolution of
food and fuel prices is central when it comes to capturing
price changes
If a CPI does not exist or is not considered applicable
a price index for key consumption items can be
constructed using price data collection for food items
and basic non-food items conducted by WFP andor
other agencies this can then be used to update the cost
of the MEB In contexts where shelter is a major part of
household expenditures changes in shelter costs should
also be captured
10 How to find a proxy for a MEB when data or time is insufficient
39
Minimum Expenditure Baskets Guidance Note | December 2020
112 When to construct a new MEBThe composition of MEB reflects consumption patterns
It is recommended as much as possible keeping the MEB
composition constant and only monitor how cost changes
over time However when there is reason to believe that
consumption patterns of the population for whom the MEB
is constructed has significantly changed it is time to review
its composition and possibly reconstruct the MEB to reflect
these changes
What could suggest such consumption changes have
occurred The figure to the right summarises some typical
events that could result in a significant change in household
consumption Shocks eg a natural disaster might create
additional needs if livelihoods are disrupted or living
conditions are altered Significant changes to the prices of
key consumption items can also alter consumption pattens
insofar it pushes households to substitute certain items
for other items (be aware however that reconstructing
the MEB would only be advisable if the substitution is not
just temporary) Population changes such as an influx of
displaced people or other events that changes the population Figure 5 Possible triggers for MEB composition review
Has a shock occured creating
different or additional needs
Have costs changed significantly
between key consumption items so
that households have substituted
consumption patterns
Has there been a change in
population - eg a displacement
Has the supply side or service
provision changed leading to a
change in household consumption
Shock
Substitution
Population
Supply
composition in the area that the MEB is constructed for
could also lead to a review Finally if supply of essential
goods and services changes this may also shift household
consumption eg if health services are made free of charge
and no longer require households to pay for them
40
Minimum Expenditure Baskets Guidance Note | December 2020
CaLP The Cash Learning Partnership
CBT cash-based transfers
CotD Cost of the Diet [approach]
CPI consumer price index
FCN-N food consumption score ndash nutrition
FCS food consumption score
FNG Fill the Nutrient Gap
HEA household economy approach
LSMS Living standard measurement survey
MEB minimum expenditure basket
OCHA United Nations Office for the Coordination of Humanitarian Affairs
REVA II 2019 Refugee Influx Emergency Vulnerability Analysis
SDG Sustainable Development Goal
SMEB survival minimum expenditure basket
UNHCR Office of the United Nations High Commissioner for Refugees
VAM Vulnerability Analysis and Mapping
WFP World Food Programme
WHO World Health Organization
Abbreviations
41
Minimum Expenditure Baskets Guidance Note | December 2020
Deaton and Grosh 2000 ldquoConsumptionrdquo in Designing Household Survey Questionnaires for Developing Countries Lessons from Ten
Year of LSMS Experience httpsscholarprincetonedudeatonpublicationsconsumption
Deaton and Zaidi 2002 Guidelines for Constructing Consumption Aggregates for Welfare Analysis LSMS Working Paper no 135
httpsopenknowledgeworldbankorghandle1098614101
The Cash Learning Partnership (CaLP) Glossary of terminology for cash and voucher assistance
httpswwwcalpnetworkorglearning-toolsglossary-of-terms
Cash Based Responses Technical Working Group Syria 2014 Northern Syria Survival Minimum Expenditure Basket Guidance
Document httpswwwhumanitarianresponseinfositeswwwhumanitarianresponseinfofilesdocumentsfilesnorthern_
syria_smeb_guidance_document_dec_2014pdf
Cash Working Group Nigeria 2018 Minimum Expenditure Basket for North East Nigeria ndash Justification and recommendations Draft
report httpswwwhumanitarianresponseinfositeswwwhumanitarianresponseinfofilesdocumentsfilesmeb_justification_
guidelinespdf
Baizan and Klein 2019 Minimum Expenditure Basket (MEB) Decision Making Tools The Cash Learning Partnership httpswww
calpnetworkorgpublicationminimum-expenditure-basket-meb-decision-making-tools-2
El Koury and Hajal 2016 MEB and SMEB revision Community Consultation Lebanon Cash Consortium httpsreliefwebintsites
reliefwebintfilesresourcessmeb-fgd-report-final-1pdf
Geniez Mathiassen de Pee Grede and Rose 2014 ldquoIntegrating food poverty and minimum cost diet methods into a single
framework A case study using a Nepalese household expenditure surveyrdquo in Food and Nutrition Bulletin vol 35 no 2 https
journalssagepubcomdoi101177156482651403500201
Haughton and Khandker 2009 Handbook on Inequality and Poverty The World Bank httpsopenknowledgeworldbankorg
handle1098611985
Hobbs 2016 MEBSMEB calculation for Syrians living in Turkey Report commissioned by the Cash-Based Interventions Technical
Working Group in Turkey httpsdata2unhcrorgendocumentsdownload57031
Hohfeld Papavero Sandstrom Dalbai and Renk 2020 Minimum Expenditure Basket for Syrian Refugees in Lebanon ndash Rights-based
versus Expenditure Based Approaches WFP httpsreliefwebintsitesreliefwebintfilesresources76229pdf
Inter-Agency Network for Education in Emergencies (INEE) Minimum Standards for Education Handbook Preparedness Response
Recovery httpsineeorgstandards
Jolliff and Prydz 2016 Estimating International Poverty Lines from Comparable National Thresholds World Bank Policy Research
Paper 7606 httpsopenknowledgeworldbankorgbitstreamhandle1098624148Estimating0int00national0thresholdspdf
Lanjouw 1998 Demystifying Poverty Lines World Bank
Ravallion 1994 ldquoPoverty Comparisonsrdquo in Fundamentals of Pure and Applied Economics 56
Republic of Zambia Central Statistical Office 2016 2015 Living Conditions Monitoring Survey (LCMS) Report httpswwwzamstats
govzmphocadownloadLiving_Conditions201520Living20Conditions20Monitoring20Survey20Reportpdf
Save the Children UK 2018 Basic Needs Assessment Guidance and Toolbox Part I Background and Concepts httpsreliefwebint
reportworldbasic-needs-assessment-guidance-and-toolbox
Sphere Standards Handbook Humanitarian Charter and Minimum Standards in Humanitarian Response 2018 edition httpswww
spherestandardsorghandbook
UNHCR CaLP Danish Refugee Council OCHA Oxfam Save the Children and WFP 2015 Operational Guidance and Toolkit for
Multipurpose Cash Grants httpswwwcalpnetworkorgwp-contentuploads202001operational-guidance-and-toolkit-for-
multipurpose-cash-grants-webpdf
References
42
Minimum Expenditure Baskets Guidance Note | December 2020
WFP 2004 Sampling Guidelines for Vulnerability Analysis Thematic guidance httpsdocumentswfporgstellentgroupspublic
documentsmanual_guide_procedwfp197270pdf
WFP 2008 Food Consumption Analysis Calculation and use of the Food Consumption Score in food security analysis https
documentswfporgstellentgroupspublicdocumentsmanual_guide_procedwfp197216pdf
WFP 2015 Food Consumption Score Nutritional Analysis (FCS-N) Guidelines httpswwwwfporgpublicationsfood-consumption-
score-nutritional-quality-analysis-fcs-n-technical-guidance-note
WFP 2018 Revising the Food Basket and Minimum Expenditure Basket Analysis to calculate a realistic cost of living for refugees in
Turkey httpsreliefwebintreportturkeyrevising-food-basket-minimum-expenditure-basket-analysis-calculate-realistic-cost
WFP 2019 Refugee influx Emergency Vulnerability Assessment ndash Coxrsquos Bazar Bangladesh httpsreliefwebintsitesreliefwebintfiles
resourcesWFP-0000106095pdf
WFP 2020a Essential Needs Assessment Guidance note httpswwwwfporgpublicationsessential-needs-guidelines-july-2018
WFP 2020b Technical Note Fill the Nutrient Gap and Minimum Expenditure Basket An explanation of approaches and identification of
synergies httpsdocswfporgapidocumentsWFP-0000116644download
WFP 2020c Setting the transfer value for CBT interventions Transfer Value Interim Guidance httpsdocswfporgapi
documentsWFP-0000117963download
WFP global Food Security Cluster and Food Security Cluster for the Democratic Republic of the Congo 2018 Adapting to an Urban
World Urban Essential Needs Assessment in the five communes of Kimbanseke Kinsenso Makala Nrsquosele and Selambao (Kinshasa)
httpswwwwfporgpublicationsdemocratic-republic-congo-urban-essential-needs-assessment-five-communes-kimbanseke-
kinsenso
World Health Organisation and Global Health Cluster ndash Cash Task Team 2020 Technical Note on the Inclusion of Health
Expenditures in the Minimum Expenditure Basket and Subsequent Multi-purpose Cash Transfer httpswwwcalpnetworkorg
publicationinclusion-of-health-expenditures-in-the-meb
43
Minimum Expenditure Baskets Guidance Note | December 2020
Survivalnon-foodexpenditure
TOTALEXPENDITURE
FOODEXPENDITURE
MEBnon-foodexpenditure
EXPE
ND
ITU
RE
CONSUMPTION
SMEBAusterepoverty line
Essential foodneeds (MEB)
Acceptable food consumption(based on FCS)
Food expenditure for HHwith tot exp at essential
food needs (MEB)
Analysts should always ensure that the expenditure data is properly cleaned and outliers removed and that it is converted into
the same recall period (food and non-food items usually have different recall periods)
Expenditures should be calculated into per capita figures (eg by dividing total household expenditures by household size) in
order to make them immediately comparable across households (or per adult equivalent see section 7 on how to account for
economies of scale and household composition)
Before starting the MEB analysis it is highly recommended to carry out some simple descriptive analysis of the expenditure
data in order to understand it Analyse the mean and median expenditures for the sample This will help understand the
distribution of the expenditures and detect possible issues While the median is more robust to outliers if a large part of the
sample has 0 expenditures on a particular item the median could be 0 and may therefore not be the best estimate of the need
In this case the mean may be preferable A frequency analysis of non-zero expenditures by groupitem can also be helpful in
understanding whether certain expenditures are infrequent or lumpy
Annex 1 - Good practice when analysing expenditure data
Figure based on Lanjouw 1998 Demystifying poverty lines and World Bank and Ravallion 1994 ldquoPoverty comparisonsrdquo in
Fundamentals of Pure and Applied Economics 56
Annex 2 - The expenditure-based SMEB ndash an illustration
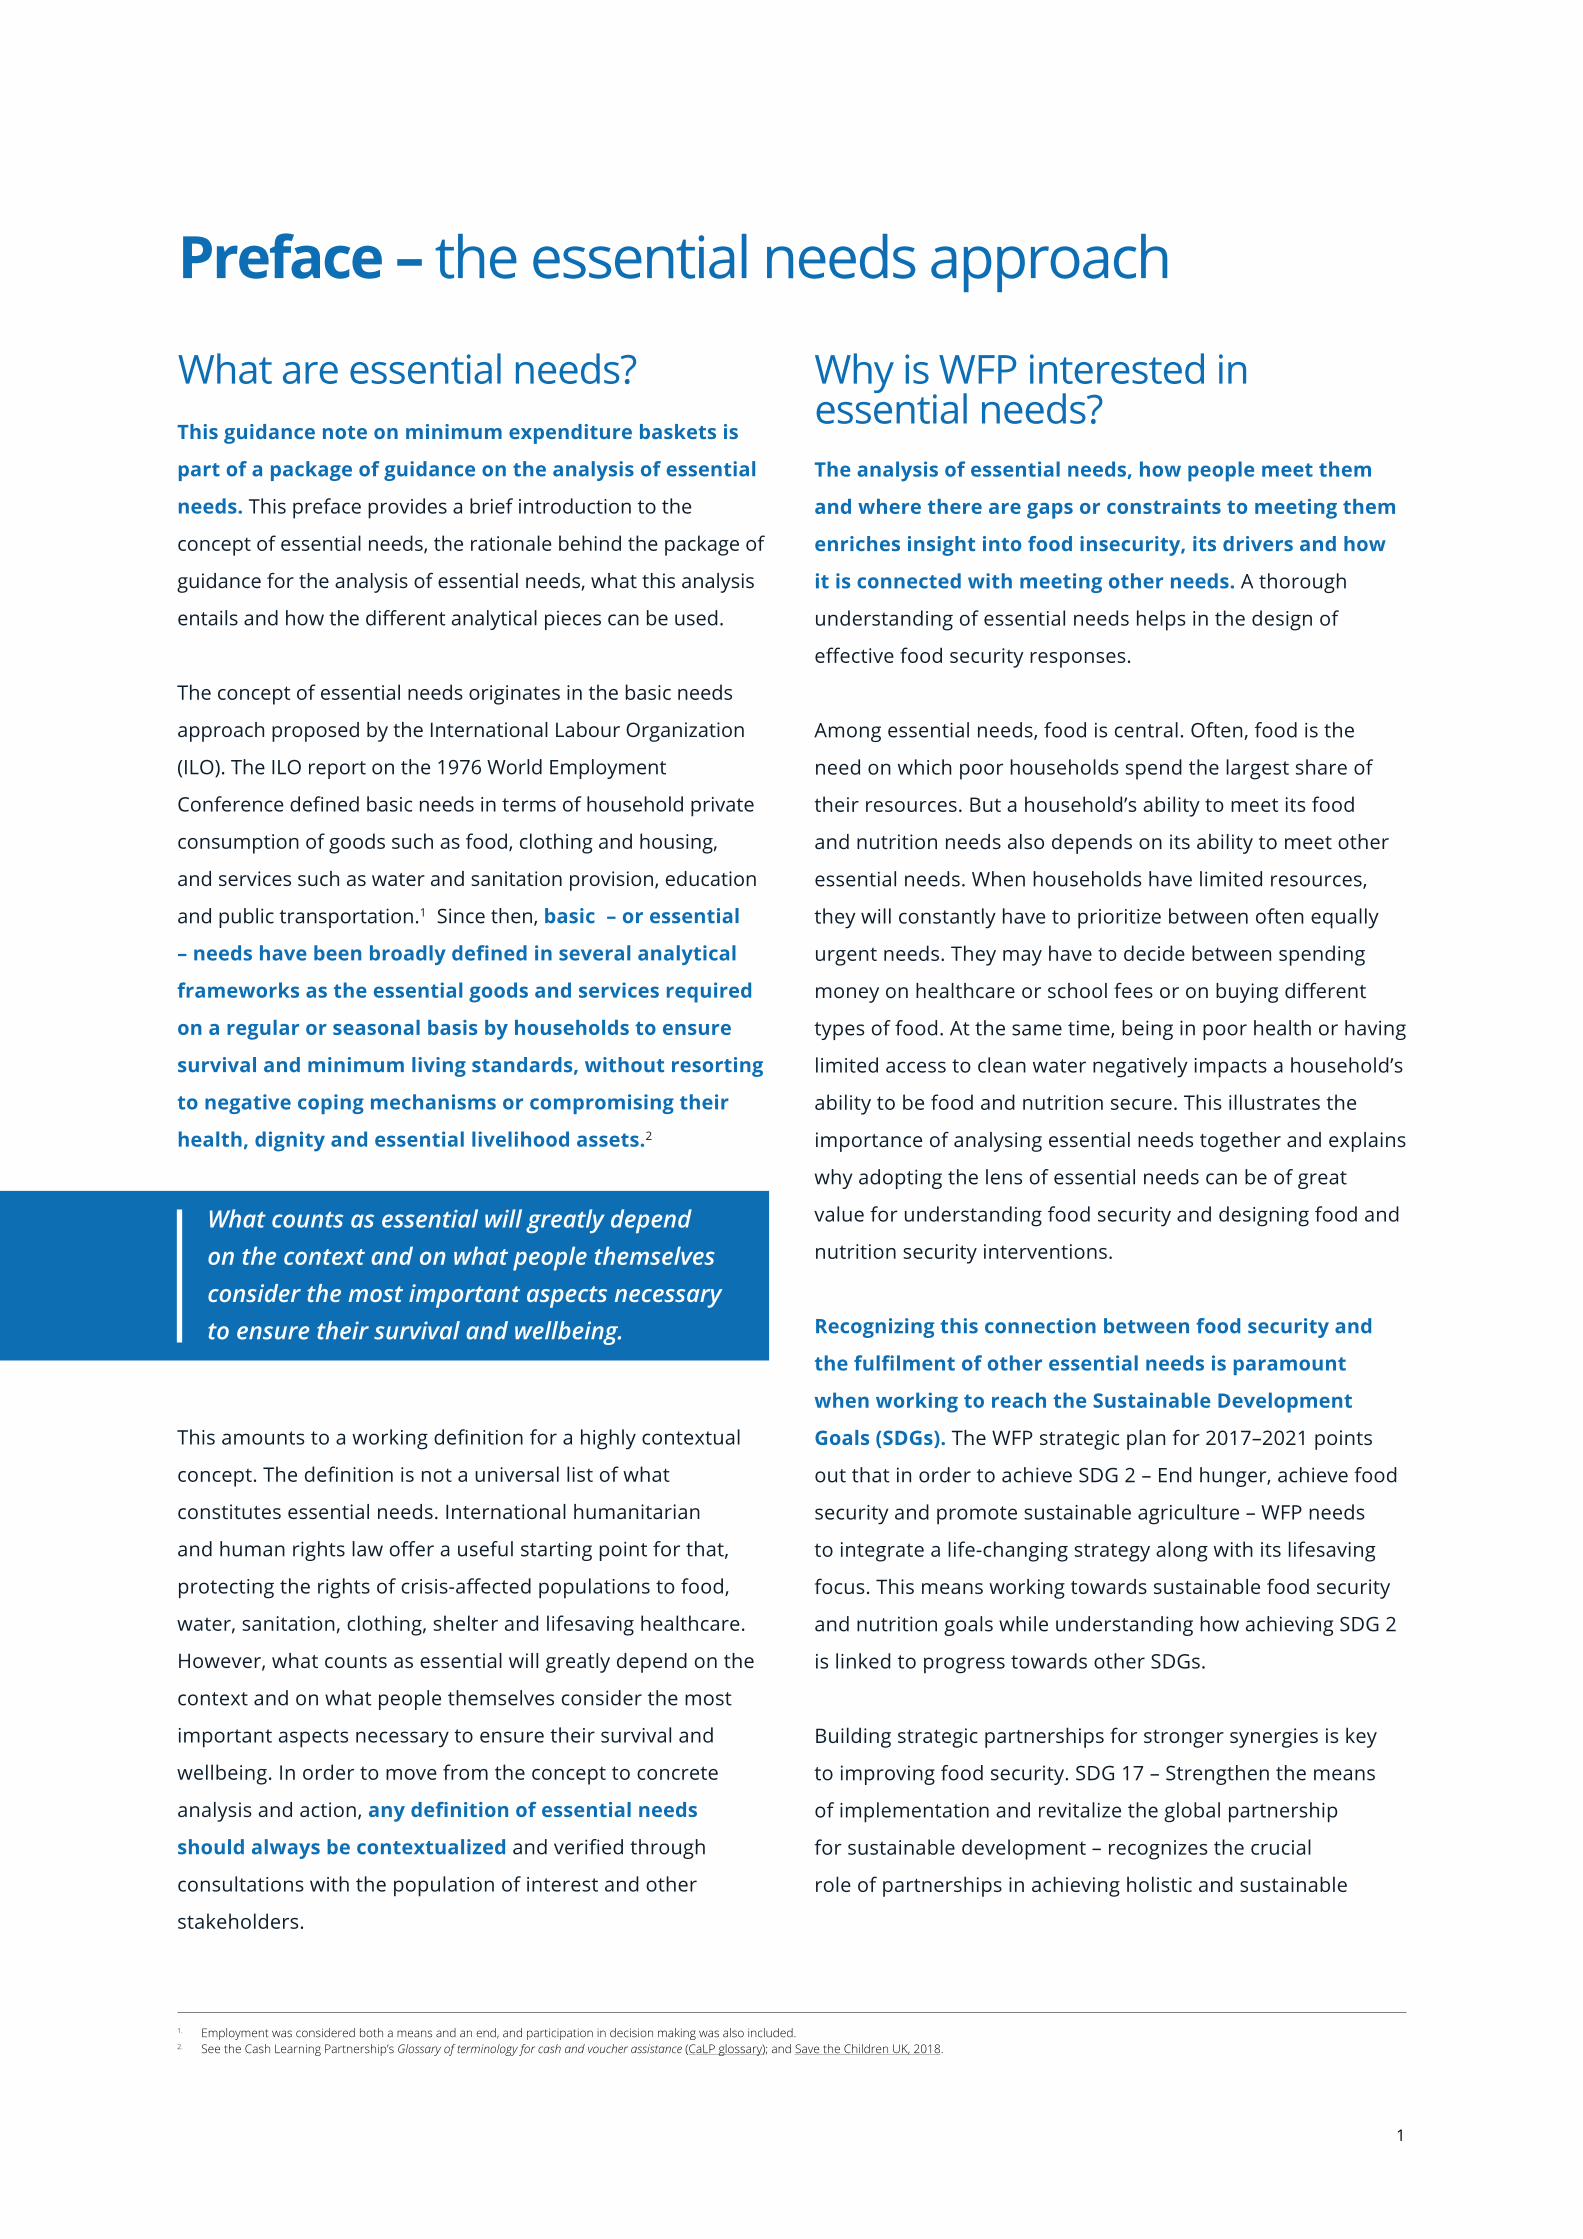
1
This guidance note on minimum expenditure baskets is
part of a package of guidance on the analysis of essential
needs This preface provides a brief introduction to the
concept of essential needs the rationale behind the package of
guidance for the analysis of essential needs what this analysis
entails and how the different analytical pieces can be used
The concept of essential needs originates in the basic needs
approach proposed by the International Labour Organization
(ILO) The ILO report on the 1976 World Employment
Conference defined basic needs in terms of household private
consumption of goods such as food clothing and housing
and services such as water and sanitation provision education
and public transportation1 Since then basic ndash or essential
ndash needs have been broadly defined in several analytical
frameworks as the essential goods and services required
on a regular or seasonal basis by households to ensure
survival and minimum living standards without resorting
to negative coping mechanisms or compromising their
health dignity and essential livelihood assets2
This amounts to a working definition for a highly contextual
concept The definition is not a universal list of what
constitutes essential needs International humanitarian
and human rights law offer a useful starting point for that
protecting the rights of crisis-affected populations to food
water sanitation clothing shelter and lifesaving healthcare
However what counts as essential will greatly depend on the
context and on what people themselves consider the most
important aspects necessary to ensure their survival and
wellbeing In order to move from the concept to concrete
analysis and action any definition of essential needs
should always be contextualized and verified through
consultations with the population of interest and other
stakeholders
Preface ndash the essential needs approach
The analysis of essential needs how people meet them
and where there are gaps or constraints to meeting them
enriches insight into food insecurity its drivers and how
it is connected with meeting other needs A thorough
understanding of essential needs helps in the design of
effective food security responses
Among essential needs food is central Often food is the
need on which poor households spend the largest share of
their resources But a householdrsquos ability to meet its food
and nutrition needs also depends on its ability to meet other
essential needs When households have limited resources
they will constantly have to prioritize between often equally
urgent needs They may have to decide between spending
money on healthcare or school fees or on buying different
types of food At the same time being in poor health or having
limited access to clean water negatively impacts a householdrsquos
ability to be food and nutrition secure This illustrates the
importance of analysing essential needs together and explains
why adopting the lens of essential needs can be of great
value for understanding food security and designing food and
nutrition security interventions
Recognizing this connection between food security and
the fulfilment of other essential needs is paramount
when working to reach the Sustainable Development
Goals (SDGs) The WFP strategic plan for 2017ndash2021 points
out that in order to achieve SDG 2 ndash End hunger achieve food
security and promote sustainable agriculture ndash WFP needs
to integrate a life-changing strategy along with its lifesaving
focus This means working towards sustainable food security
and nutrition goals while understanding how achieving SDG 2
is linked to progress towards other SDGs
Building strategic partnerships for stronger synergies is key
to improving food security SDG 17 ndash Strengthen the means
of implementation and revitalize the global partnership
for sustainable development ndash recognizes the crucial
role of partnerships in achieving holistic and sustainable
What are essential needs Why is WFP interested inessential needs
What counts as essential will greatly depend on the context and on what people themselves consider the most important aspects necessary to ensure their survival and wellbeing
1 Employment was considered both a means and an end and participation in decision making was also included2 See the Cash Learning Partnershiprsquos Glossary of terminology for cash and voucher assistance (CaLP glossary) and Save the Children UK 2018
2
Minimum Expenditure Baskets Guidance Note | December 2020
outcomes for affected populations Another key international
agreement the Grand Bargain committed its signatories to
working together in a more efficient and harmonious manner
in order to better assist the growing number of vulnerable
people affected by crises around the world
Against this backdrop and based on best practices by WFP and
partners an integrated analytical package has been prepared
to provide guidance on how to analyse essential needs This
package builds on existing guidance and research together
with practical experience and lessons learned It is designed to
provide analytical results that can be used to inform strategic
and operational decision making and programme design
As analysing understanding and assisting people in
meeting their essential needs is by definition not a single-
agency undertaking the package developed by WFP is
intended as an analytical starting point for interagency
collaboration It offers data-driven approaches and
quantitative indicators but also allows for analytical flexibility
emphasizing the importance of collaboration qualitative
inquiry and contextual adaptation
Essential needs analysis is particularly relevant where WFP
and partners seek to support government strategies and
policies such as informing the design of social safety nets
as a toolbox to support the design of multi-stakeholder
joint assessments or joint harmonized or complementary
interventions Essential needs analysis has proven useful in
a variety of contexts from refugee camps to chronic food
insecurity settings It is often highly relevant when assessing
the situation of poor urban populations urban households
depend heavily on markets to meet their food and other
essential needs including housing high living costs and
unstable income sources make them vulnerable to shocks
forcing households to choose between meeting different
essential needs in times of hardship
What is essential needs analysisThe analytical packageThe WFP essential needs analysis package consists of three parts
The essential needs assessment is a household andor
community assessment that helps to understand if and how
people are meeting their essential needs as such it focuses
on the demand side of essential needs The assessment seeks
to identify and analyse essential needs and gaps estimate
the number of people in need and profile them by describing
their main characteristics It aims to answer the following
questions
What are the populationrsquos essential needs and how
do people meet them
Which essential needs are unmet and why
How many people are unable to meet their
essential needs
Who are the people that are unable to meet their
essential needs
Where are the people that are unable to meet their
essential needs
How can households be assisted to meet their
essential needs
The essential needs assessment promotes the use of
qualitative and quantitative analysis It proposes a suite
of essential needs indicators that capture various aspects
of essential needs and a householdrsquos ability to meet them
including measures of household economic capacity to meet
essential needs deprivations of different essential needs how
households cope when they struggle to meet their essential
needs and how they prioritize unmet needs
An integrated analytical package has been prepared to provide guidance on how to analyse essential needs This package builds on existing guidance and research together with practical experience and lessons learned
3
Minimum Expenditure Baskets Guidance Note | December 2020
The foundational understanding of essential needs gained
from the essential needs assessment can feed into the supply
analysis The results can help to focus a complex market
analysis on the most critical needs while household data
can be used to understand how households perceive the
supply and quality of essential services and their access to
them At the same time a thorough analysis of the supply
of essential goods and services enriches the understanding
of household demand and enables the analyst to identify
possible interventions Which needs can be met through
the market Is there effective demand and would supply
or demand-side interventions or a combination of these be
better suited to assisting the population of interest The MEB
connects supply and demand in the sense that it identifies
a monetary threshold for meeting essential needs through
the market It enables the essential needs assessment to
identify households with sufficient economic capacity it also
has strong complementarities with the supply analysis as it
helps reveal market consumption patterns In turn the supply
analysis is a valuable input for a MEB analysis as it highlights
which goods and services are adequately supplied
The analytical approach draws on different schools
of thought from the fields of humanitarian action
development and poverty analysis It combines ideas from
the cost-of-basic-needs approach for monetary poverty
lines which sees poverty as the deprivation of consumption
with more multidimensional poverty perspectives from
human development and capabilities approaches Through
this combination the essential needs analysis provides a
framework that is easy to operationalize while offering the
flexibility and detail necessary to adjust to different contexts
and to produce information relevant for programmatic
decision making
The minimum expenditure basket (MEB) looks at the needs
that are covered partially or fully through the market It sets
a monetary threshold which is defined as what households
require in order to meet their essential needs The starting
point for constructing a MEB is usually household expenditure
data This data is analysed and triangulated with sector-based
needs information to obtain a measure of the minimum
cost of essential needs based on the population of interestrsquos
actual demand pattern and consumption priorities The
expenditure data can be gathered as part of the essential
needs assessment data collection Once constructed the MEB
itself serves as a key input in the essential needs assessment
set of indicators as it is
used to assess which
households have the
economic capacity to
cover their needs through
the market
The supply analysis looks at the supply of essential goods
and services and examines whether the market andor public
provision can sustain the demand related to essential needs
It integrates quantitative methods for examining the basic
functioning of the marketplace with qualitative investigation
of supply and access
The three guidance tools are designed so that they can
be used independently or together A full essential needs
analysis would require undertaking an essential needs
assessment constructing a MEB and carrying out a supply
analysis this combination is recommended for the most
complete analysis as each piece complements the others
A full essential needs analysis would require undertaking an essential needs assessment constructing a minimum expenditure basket and carrying out a supply analysis
Essential needs analysis provides a framework that is easy to operationalize while offering the flexibility and detail necessary to adjust to different contexts
4
Minimum Expenditure Baskets Guidance Note | December 2020
Essential needs analysis package
Esse
ntia
l nee
ds
ESSENTIAL NEEDS ASSESSMENTDemand for essential needs
SUPPLY ANALYSISSupply of essential goods and services
MINIMUM EXPENDITURE BASKETExpenditures on essential needs
Decision making
Operationalization
Monitoring
While the three pieces of analysis should be carried out
together as much as possible there may be situations in
which only one piece is necessary for example when the
analysis is spread out over time or different collaborators
lead on different pieces Each guidance note is designed as a
standalone document enabling analysts to follow it without
reference to the others
A series of operationalization guidance notes and
documented best practices complement the analytical
package The series offers concrete guidance on how the
results of the essential needs analysis can be translated into
programme design and inform decision-making Essential
needs analysis identifies where households face critical
gaps in meeting their needs the cost of meeting those
needs in the market and whether the necessary essential
goods and services are available As such it forms the
basis for programme design for both demand and supply-
side interventions Results can for example be used to
inform the targeting and prioritization of beneficiaries the
selection of transfer modality the setting of transfer values
and other programme design features It is well suited for
monitoring needs over time and evaluating the effectiveness
of programmes This series will be continuously updated to
reflect new learning
While essential needs analysis can inform programme design
it does not have to imply an essential needs response
Essential needs analysis and the analytical package can be a
service offering particularly when supporting governments in
designing policies strategies and programmes at national and
local levels
Figure 1 Essential needs analysis
5
Minimum Expenditure Baskets Guidance Note | December 2020
This guidance note sets out the basic steps for constructing a
minimum expenditure basket (MEB) It is designed to provide
conceptual clarity and best practices built on experience from
the humanitarian and development fields The guidance is
designed to provide a series of options in order to facilitate
a context-specific application of the recommendations it
presents
The guidance note begins by introducing the concept of the
MEB and its different usages (sections 1 and 2) Sections 3 to
6 cover how to construct a MEB including important aspects
to consider before starting the analysis and the different MEB
approaches Section 7 examines how to deal with household
size and composition in MEB analysis while the concept of the
survival minimum expenditure basket (SMEB) is introduced
in section 8 Section 9 sets out additional considerations
such as regional or seasonal price adjustments and section
10 explains how to find MEB proxies when time or data is
insufficient In closing section 11 offers guidance on how to
update and monitor the MEB
A MEB is defined as what a household requires in order to
meet their essential needs on a regular or seasonal basis
and its cost3 Essential (or basic) needs are defined as ldquothe
essential goods and services required on a regular or seasonal
basis by households to ensure survival and minimum living
standards without resorting to negative coping mechanisms
or compromising their health dignity and essential livelihoods
assetsrdquo4 The MEB is a monetary threshold ndash the cost of these
goods utilities services and resources ndash and is conceptually
equivalent to a poverty line5 It typically describes the cost
of meeting one monthrsquos worth of essential needs Since the
MEB sets a monetary threshold for what is needed to cover
essential needs the households whose expenditures fall
below the MEB are defined as being unable to meet their
essential needs
i About this guidance note
3 This builds on the definition in UNHCR et al 2015 4 Definition of basic needs See CaLP glossary 5 Note that conceptually a MEB is equivalent to a poverty line in that it describes a monetary threshold for being able to cover essential needs This does not mean that the MEB is equivalent to the national poverty line6 Haughton and Khandker 2009
In poverty literature and research MEBs have long been
constructed primarily to set national poverty lines and
determine the percentage of households in the population
who are poor ie who cannot meet their essential needs
The ldquocost of basic needsrdquo approach which entails establishing
a MEB is fairly new in humanitarian contexts however it
has long been the most common way to construct national
poverty lines6 As a result there is often national experience to
draw on when setting out to construct a MEB
A MEB does not necessarily contain all the essential needs
of a household It only captures needs that the households
cover entirely or partly through the market It should not
be an attempt to monetize all the needs of a population
For example in contexts where electricity is considered an
essential need but not available for the population of interest
it should not be included in the MEB If shelter is provided free
of charge in a refugee camp or education is publicly provided for
free these needs and their costs are not captured in the MEB
Hence a need can be essential but not included in the MEB
A MEB does not necessarily contain all the essential needs
of a household It only captures needs that the households
cover entirely or partly through the market It should not
be an attempt to monetize all the needs of a population
For example in contexts where electricity is considered
an essential need but is not available for the population of
interest it should not be included in the MEB If shelter is
provided free of charge in a refugee camp or public education
is provided for free these needs and their costs are not
captured in the MEB A need can therefore be essential but
not included in the MEB
A MEB captures the cost of essential needs for average
households It does not typically capture ad-hoc or one-
off costs This can be challenging particularly in emergency
situations when needs are dynamic While this guidance
suggests keeping the MEB composition fixed as far as
possible in such situations it might be justified to create
an interim MEB (see section How to find a proxy for a MEB
when data or time is insufficient) and when the situation has
stabilized a final one A similar challenge is presented with
1 What is a minimum expenditure basket
6
Minimum Expenditure Baskets Guidance Note | December 2020
needs that are inherently irregular large and unpredictable
such as health needs This is also examined in the sections on
MEB construction
There are different approaches to establishing a MEB
As the World Bankrsquos Handbook for Poverty and Inequality
explains7 the typical starting point for establishing a MEB is
to estimate the cost of acquiring enough food to meet energy
requirements usually 2100 calories per person per day as
per the Sphere Standard Yet the cost of 2100 calories varies
with the diet of households which typically depends on their
economic status The cost of other essential non-food needs
is then added There are two approaches to establishing
which food and non-food items should be in the MEB an
expenditure-based approach that focuses on effective
demand and a rights-based approach based on assessed
needs While the expenditure-based approach is usually used
to construct national poverty lines the rights-based approach
is the principal method followed in the operational guidance
for multipurpose cash grants developed for humanitarian
purposes8 A combination of these approaches a hybrid
approach can also be used and is often recommended This
guidance describes each approach
The construction of a MEB is always somewhat arbitrary
However a MEB is constructed choices need to be made along
the way The objective of the MEB can influence how best to
approach its construction The choice of the group of people
whose effective demand will be examined ndash the ldquoaveragerdquo
households ndash is another important influencing factor This
guidance provides direction on how to make these choices but
analysts will always be required to exercise judgement
A MEB is not equivalent to a transfer value A transfer
value is understood as the monetary value transferred from
governments or organizations such as WFP to households
in order to support the latter in meeting their needs The
value of the MEB is not the same as the value that should
be transferred to households but the MEB can be a critical
component when determining transfer values Most
households can rely on their own resources to meet at least
some of their needs so the transfer value will usually be
less than the value of the MEB covering the gap between
householdsrsquo own resources other assistance received and
the MEB The distinction between the MEB and the transfer
value is also important because the MEB remains the same
regardless of assistance and funding constraints while the
transfer value could be impacted by these factors9
When using the MEB to monitor impacts of an
intervention or programme the MEB should not be
changed over time The threshold should only be adjusted
for price changes or when any major changes in context and
households needs occur that would require the construction
of a new MEB
2 Why have a MEBThe MEB has a range of applications In humanitarian
and development programming the MEB can support
household profiling by identifying characteristics of those
who cannot meet their essential needs10 and support
decisions on transfer value amounts for food and non-
food needs For partnerships the MEB can support multi-
sector coordination and programming with government
partner organisations and donors In market and supply
analysis the MEB can help inform which goods and services
to include in a Supply Analysis by showing which essential
needs households cover through the market Finally in
monitoring the MEB can assist monitoring of immediate
and longer-term outcomes through analysis of expenditure
trends against the MEB and help establish a basket against
which to monitor market prices and the cost of living
7 Ibid8 UNHCR et al 20159 For further discussion on considerations when setting a transfer value see WFP 2020c 10 For one possible application see WFP 2020a
A hybrid approach to constructing the MEB combines the expenditure-based approach and the rights-based approach and is often recommended
7
Minimum Expenditure Baskets Guidance Note | December 2020
THE MEB TO-DO LIST DEPENDING ON CONTEXTALSO CONSIDER
Identify key partners and stakeholders and decide on objectives and process
Construct the food basket
Construct the non-food basket
Reality check results and validate with stakeholders
Determine the analytical starting point (eg examine national poverty lines set the population of interest check what data is available) and decide on approach
Accounting for household size and composition
Adapting the MEB to different needs across regions or seasons
Adjusting the MEB for regional or urbanrural price differences if significant
HOW TO
Box 1MEB
3 How to construct a MEB generic steps
11 This is in line with the cost of basic needs approach widely used for poverty lines as described in previous sections
A MEB is constructed by estimating the cost of acquiring
adequate food and adding the cost of other essential non-
food expenditures11 The box below shows the steps that are
always part of constructing a MEB
The two principal methods for constructing MEBs are
the expenditure-based approach and the rights-based
approach Sections 5 and 6 describe these approaches
and how to combine elements of both to apply a hybrid
approach
Regardless of approach it is crucial to arrive at a realistic
relevant and operational MEB that is rooted in
consumption behaviour ndash section 6 also looks at how to
ensure this Before going into the details of construction the
next section outlines the key questions to ask before starting
the MEB analysis
8
Minimum Expenditure Baskets Guidance Note | December 2020
Before embarking on the construction of the MEB
components consider the following questions to decide how
best to approach the analysis
What is the objective and whowill be the partnersStart by setting the objective and consider what the MEB will
be used for once the analysis is finished If the MEB analysis
is a joint exercise identify potential partners possibly in
interagency working groups such as a cash working group find
out what kind of information various organizations can share
and decide on the division of labour In some cases it can be
helpful to write terms of reference for the MEB analysis in
order to clarify the envisioned process and methodology Even
if the MEB analysis will be conducted by just one agency it is
always a good idea to identify partners who will be interested in
the results and who can be consulted along the way12
Who is the MEB being constructed forIt is important to define the population of interest for the
MEB Is it intended to be valid for the entire country Or will it
only be used in a refugee camp for example or a particular
region where needs might differ from those in the rest of
the country It is vital to decide from the start where and for
whom the MEB should apply Since the MEB describes the
cost of essential needs the population for whom the MEB
is constructed should ideally have relatively homogenous
consumption patterns and needs If consumption patterns are
very different consider constructing different MEBs or varying
certain components of the MEB for sections of the population
Have any MEBs already been created for the population of interest If there are one or more MEBs already in use the analytical
exercise might be aimed at updating or even ldquoreality
checkingrdquo the existing baskets to see whether they still match
consumption behaviour and price levels If existing baskets
are found to be valid and relevant it might not be necessary
to start a new MEB analysis
4 Before starting the analysis What information and data is already available and is new data neededConsider what data or analysis is already available from
essential needs assessments or other household surveys
(undertaken by WFP or others) Does the data cover the area
and population of interest Also consider what qualitative
information might be available to shed light on certain
expenditure patterns and whether there is access to market
and price information If the data available is insufficient or
outdated plan to collect fresh data A MEB analysis is greatly
strengthened by being conducted as part of a comprehensive
essential needs assessment The assessment describes the
essential needs of the population of interest which is a
useful starting point for a MEB analysis and complements the
monetary perspective provided by a MEB
Can the national poverty line be usedBefore beginning the construction of a MEB it is useful to find
out if a national poverty line exists and how and when it was
constructed Many countries have their own national poverty
lines so why not use this poverty line (and the corresponding
basket) as the MEB Whenever possible the first choice
should be to align with government practices However this is
often not feasible for three main reasons
Practices vary widely when it comes to constructing
national poverty lines Although the most common
approach is the cost of basic needs using MEBs
sometimes poverty lines are set as a share of the
country mean or median income or expenditures or
as a fixed percentage of the income or expenditure
distribution (although this is mostly not the case in low
income countries) Furthermore even when a MEB has
been constructed to develop the poverty line different
methodologies exist For example sometimes countries
exclude non-food items from their poverty line MEB
Since the MEB describes the cost of essential needs the population for whom the MEB is constructed should ideally have relatively homogenous consumption patterns and needs
12 The Cash Learning Partnershiprsquos MEB Tip Sheet contains useful advice on the interagency processes around constructing a MEB Baizan and Klein 2019
9
Minimum Expenditure Baskets Guidance Note | December 2020
Countries can also have different poverty lines for
different purposes and regions13 These factors can all
limit the use of the national poverty line as the MEB
The population of interest for a MEB could differ from the
overall population of the country and hence the national
poverty line This group of people may have different
essential needs for instance if they live in refugee camps
or do not have access to the same services as the resident
population (eg public education)
The data that WFP typically collects through essential
needs assessments comprehensive food security
and vulnerability analyses emergency food security
assessments baseline assessments and post distribution
monitoring is often much less detailed than that gathered
through the household budget surveys or living standards
measurement surveys used to calculate national poverty
lines It is widely observed that the more detailed the
survey questions about expenditures the higher the
reported expenditures14 If the national poverty line is
constructed using detailed data but the assessment of
household needs or expenditures relative to the poverty
line is based on less detailed data errors in the analysis
are likely to occur Furthermore WFP expenditure
modules do not include asset depreciation which is often
accounted for when calculating national poverty lines
Even if the national poverty line cannot be used in most
cases and especially in humanitarian contexts elements of
the methodology can perhaps be replicated It is therefore
important to find out how the national poverty line is
constructed
How about using the methodology applied for consumer price indices The consumer price index (CPI) is used to measure changes
in price levels based on a weighted average consumer basket
of goods and services In most countries household budget
survey data is used to construct the baskets used to measure
consumer prices A weight that corresponds to average
household expenditure patterns is applied to each component
of the CPI17 This basket is not ideal for MEB calculations
because it corresponds to overall national average
consumption patterns MEBs are based on the consumption
levels and patterns of those households who are just able to
meet their essential needs within the population of interest
(this is further described in the following sections)
13 Jolliff and Prydz 2016 14 Haughton and Khandker 200915 Republic of Zambia Central Statistical Office 2016 16 See Turkish institute of statistics data portal httpsdatatuikgovtrKategoriGetKategorip=Income-Living-Consumption-and-Poverty-10717 The CPI weights are usually available through national statistical offices
COUNTRYEXAMPLE
EXAMPLES OF NATIONAL POVERTY LINESEG Box 2
In Zambia the national poverty line is constructed using the cost of basic needs MEB approach based on a simple food
basket that meets minimum food needs for a family of six15 Imagine this food basket costs USD 100 per month This is
defined as the food poverty line To construct the full poverty line the minimum non-food needs of households are
estimated based on the average share of expenditure that households just above the food poverty line dedicate to needs
other than food Let us say that this corresponds to USD 35 per month The total poverty line is then the sum of the food
and non-food lines which with these hypothetical figures would be USD 100 + USD 35 = USD 135
By contrast Turkey uses the standard European Union approach to measuring poverty which is 50 or 60 percent of
median income16 However eligibility for social assistance is based on the gap between household income and the national
minimum wage
10
Minimum Expenditure Baskets Guidance Note | December 2020
In developing country contexts consumption is generally considered a better metric of wellbeing than income and in turn consumption expenditures as captured in household data generally provide the most reliable measure for consumption
5 Constructing a MEB expenditure-based and rights-based approaches
51 The expenditure-based approachThe expenditure-based approach to constructing a MEB
relies on household-level expenditure data to examine the
consumption behaviour of households who are just able
to meet their essential needs The expenditure level and
consumption patterns for this group of households reveal the
minimum cost of covering essentail food and non-food needs
and therefore form the basis of the expenditure-based MEB
The expenditure-based approach builds on the theory
behind poverty measurement and poverty line construction
To measure poverty the first step is to define a measure
of wellbeing In developing country contexts consumption
is generally considered a better metric of wellbeing than
income and in turn consumption expenditures as captured in
household data generally provide the most reliable measure
for consumption18 Household survey data on expenditures
therefore provides the foundation for measuring wellbeing
and is used to set the MEB threshold
The steps for constructing a MEB using the expenditure-based
approach are explained below
1 Prepare the expenditure data The prerequisite for an expenditure-based MEB is a
good-quality household survey with a detailed expenditure
module with a sufficient sample size representative of the
population for whom the MEB is being constructed (the
ldquopopulation of interestrdquo)
The notion of a ldquodetailedrdquo expenditure module is a
relative one Constructing an expenditure-based MEB
requires more detailed data on different types and
groups of expenditures than is usually gathered by
household surveys conducted in humanitarian settings
However this guidance has been designed to cope
with less detailed expenditure data than that gathered
through extensive national expenditure surveys such
as the very granular expenditure modules typically used
when constructing poverty lines (eg national household
budget surveys household income and expenditure
surveys living standards measurement surveys or other
large-scale household surveys)
What is a sufficient sample size The survey should
always follow good practices for sampling19 Consider
that for MEBs the analysis focuses on the consumption
patterns of a subset of the sample the ldquoreference cohortrdquo
(see next below) The characteristics of the population
and the cohort selection criteria determine the size of
this subsample in relation to the overall sample but
experience shows that the cohort can comprise between
10 and 60 percent of the sample The sample will be
further disaggregated if analysis by household size or
group of household size is desired (see section 7 on
accounting for household sizes)
Using expenditures to understand consumption involves
calculating a ldquoconsumption aggregaterdquo This entails
combining household expenditures on food and non-
food paid in cash or through credit as well as the
imputed monetary values of consumed own production
and received assistance Expenditures are analysed in
per-capita values Box 3 describes this process in more
detail Annex 1 further outlines some best practices when
analysing expenditure data
In addition to the household survey data market price
data is needed in order to estimate the final cost of the
basket The price data should be collected around the
same time as the household survey data
18 Deaton and Zaidi 2002 and Haughton and Khandker 2009 19 For guidance see WFP 2004 Additional resources can be found in the online VAM Resource Centre httpsresourcesvamwfporg
11
Minimum Expenditure Baskets Guidance Note | December 2020
HOW TO
EXPENDITURE DATA IN MEB CALCULATIONS -CONSTRUCTING A LIGHT ldquoCONSUMPTION AGGREGATErdquo
Box 3
Using expenditures to calculate a MEB entails combining different household expenditures to arrive at a measure of house-
hold consumption This is typically referred to as a consumption aggregate although a lighter version is used than those
usually constructed for national poverty lines due to the less granular data typically available for MEB construction20
Expenditures considered in a MEB should reflect household consumption related to essential needs Therefore both
household expenditures made in cash and those on credit must be considered as the latter also reflect current consump-
tion even if payment occurs later If the population can be expected to consume food from their own production the value
of this food should be captured to avoid underestimating food expenditures Lastly if the surveyed households are receiv-
ing and consuming assistance it is advisable to estimate the implied value of this assistance and include it in the expendi-
tures (however care needs to be taken if the population of interest includes a large group of in-kind assistance beneficiar-
ies as this can significantly skew consumption choices see next section on selecting the reference cohort) In summary the
expenditure module should capture any expenditures made in the reference period through cash and credit purchases as
well as the monetary value of consumed own production and assistance Most standard expenditure modules include all
these types of expenditures
Expenditures should be collected for both food and non-food goods and services For food expenditures at the food group
level are required as a minimum If food expenditures are collected at the item level a more granular analysis can be per-
formed The same applies for non-food expenditures they must be available at the group level and item-level data will add
detail However whenever household data is collected a balance needs to be struck between the granularity of the data
and the time and resources available for its collection
The WFP standard expenditure module can be used as a reference for the minimum requirement for expenditure data
collection WFP standard modules can be found in the online VAM Resource Centre httpsresourcesvamwfporg
+ ndash=
2 Select the reference cohort The next step is to identify the households in the survey
data that are just able to meet their essential needs and
examine their expenditures Including households below
this level would generate a basket that does not satisfy
essential needs while including relatively wealthier
households would lead to the inclusion of non-essential
needs and therefore inflate the MEB But what is ldquojust
enoughrdquo
Identifying the cohort of households who are just able
to meet their needs can be challenging How to approach
it depends on the characteristics of the population
and the available data The key is to identify one or
more criteria that can be good proxies for whether
households are just able to meet their essential
needs and that can be observed in the data One
basic indicator would be a food consumption of 2100
kcal per person per day21 However since the available
expenditure data is often too crude to make accurate
calibrations of diet compositions around the 2100
kcal point the use of alternative indicators is highly
recommended These could be indicators such as food
consumption score (FCS) or food consumption score ndash
nutrition (FCS-N)22 which indicate whether households
eat sufficient and balanced diets quality of housing
indicators use of coping strategies (selecting households
who do not engage in severe strategies) or any other
indicator that reflects a householdrsquos ability to meet its
needs Combining several indicators is often useful
20 For thorough guidance on constructing consumption aggregates using data from living standard measurement surveys (LSMS) see Deaton and Zaidi 2002 In most WFP cases household data is less granular than the LSMS-type datasets This section therefore describes how to construct consumption aggregates with less detailed data21 Use of calorie consumption close to the Sphere Standard of 2100 kcalpersonday as the starting point for selecting the reference cohort originates in the cost of basic needs approach used in most national poverty line estimations 22 WFP 2008 and WFP 2015
12
Minimum Expenditure Baskets Guidance Note | December 2020
Figure 2 Selecting the MEB cohort
In simple terms it is useful to think of the green people in the figure as the basis for selecting the reference cohort they are not amongst the worst-off
nor the wealthiest ndash but rather are just able to meet their essential needs
DESTITUTE
WEALTHY
It is also recommended to examine the expenditure
distribution Excluding households in the extreme ends
of the expenditure distribution can help ensure that
the cohort is neither ldquotoo poorrdquo nor ldquotoo wealthyrdquo (eg
by removing households in expenditure quintiles 1 and
5 or similar exclusion criteria based on distribution
characteristics) This is in particular useful if there is a
relatively large spread in wealth across the sampled
population
Figure 2 provides a simplistic depiction of selecting the
reference cohort the aim is to identify households that
are just able to cover their needs and hence do not fall in
either extreme end of the spectrum
13
Minimum Expenditure Baskets Guidance Note | December 2020
Box 4 outlines some typical cases and presents suggestions
for how to select the cohort in a survey sampled on
the population of interest
There is a spread in the
population in terms of well-being
and a proportion is able to cover
their essential needs no
households receive assistance
A relatively large proportion of
households receive food
assistance
The vast majority of the
households are far from being
able to cover their essential
needs (prior to receiving
assistance)
Select households with an acceptable FCS23 or with adequate consumption in FCS-N
who do not use negative coping strategies (or have a high coping strategy index)
Combine or cross-check with other criteria such as dwelling quality or asset index
Exclude extreme expenditure quintiles
Exclude households receiving in-kind food assistance from the reference group (if
sample size allows) This is because any assistance that is not unrestricted cash
might influence the consumption choices of the beneficiary households (in-kind
food means a large portion of food consumption is determined by the assistance
provided not the households) However be aware that if the majority of
households receive some form of restricted assistance excluding them all from the
cohort can lead to sample size issues as well as selection bias
Alternatively to the extent possible avoid using criteria that are highly influenced
by assistance For example in the presence of food assistance the FCS of some
households might be acceptable even if they are not able to meet their essential
needs Furthermore if in-kind food is provided the consumption behaviour of such
households might be skewed as most of their food needs are already covered by
assistance
Consider using dwelling quality an asset index or other similar indicators instead
(or in combination with the FCS)
Consider using a rights-based approach since it will be very difficult to obtain a big
enough sample of households who can meet their essential needs making it
challenging to construct an expenditure-based MEB Carry out a reality check using
the survey data to understand household consumption patterns keeping in mind
that the sample represents a population not able to fulfill their essential needs
HOW TO
REFERENCE COHORT SELECTIONBox 4
Scenario Possible approach to selecting the cohortUse one or several of the below criteria
The use of sensitivity tests is highly recommended in the form
of repetitions of the expenditure analysis for different versions
of the reference cohort this will indicate the extent to which
the choice of cohort selection criteria is influencing the MEB
23 It is usually not advisable to use the FCS as a single criterion If it is used alone the indicator should be capped at a certain level above the acceptable threshold (the FCS builds on a continuous score from 0ndash112 and applies thresholds for poor borderline and acceptable consumption) This is because if all households with acceptable FCS are included this will likely also capture some households who are ldquotoo wealthyrdquo to be considered in the reference cohort
14
Minimum Expenditure Baskets Guidance Note | December 2020
See box 5 for examples of how sensitivity tests can be
conducted as well as how the reference cohort has been
COUNTRYEXAMPLE
SELECTING AND CHECKING THE REFERENCE COHORTCHAD SYRIAN REFUGEES IN LEBANON AND COXrsquoS BAZAR
EG Box 5
Reference cohort sensitivity analysis ndashCoxrsquos Bazar MEB
Table a
In Chad the calculation of an expenditure-based MEB relied on national data collected by the Government during their
annual national food security and nutrition survey The reference cohort for the MEB was selected on the basis of two
criteria FCS between 35 and 70 eg in an interval around the acceptable threshold and no adoption of crisis or emergency
livelihood coping strategies based on the livelihood coping strategies indicator These two criteria ensured that the
selected reference cohort had consumption levels that provided sufficient food security and sustainable livelihood
strategies
For Syrian refugees in Lebanon24 an expenditure-based MEB was calculated by WFP in order to review an existing MEB
Shelter plays an important role as most refugees live in an urban host community and face high rents The FCS reveals
whether people can cover their food needs but could be influenced by the presence of food assistance To ensure results
would be robust against the choice of the cohort two different approaches were compared both included households of 4
to 6 members (as the MEB under review was defined only for households of these sizes) and excluded households in
expenditure quintiles 1 and 5 In version 1 an additional criterion of acceptable FCS was included while in version 2 an
additional criterion of acceptable housing conditions was applied The results were similar for both cohort versions
A MEB was calculated in Coxrsquos Bazar Bangladesh as part of the 2019 Refugee Influx Emergency Vulnerability Analysis
(REVA-II)25 for Rohingya refugees An expenditure-based MEB was built using a large household survey that included
refugees and host community households the reference cohort also included refugees and host communities as the MEB
was meant to apply to both groups Households receiving in-kind food assistance were excluded to avoid possible bias in
consumption choices which would be reflected in the expenditure data The reference cohort was then selected based on
FCS and expenditure quintiles To ascertain that the appropriate cohort had been chosen a sensitivity analysis was
conducted which tested the effect of removing different expenditure quintiles (quintiles 1 and 5 versus quintiles 1 4 and 5)
and including different FCS ranges (FCS 42+ versus FCS 35ndash80) This showed that across different iterations of the reference
cohort total food expenditures were relatively stable while non-food expenditures went up when richer households (eg in
the higher expenditure quintiles) were included This allowed the analysts to select the cohort of households who were just
at the point where the share of food expenditures out of total expenditures began to decrease as a high share of
expenditure on food is often an indicator of vulnerability In other words the selected cohort was just at the point where
households started meeting more needs than just food and the most basic non-food requirements The consumption
patterns of this cohort -highlighted in table a below - therefore became the basis for the MEB
Indicator 1expenditurequintiles
Indicator 2FCS Sample
size Value in taka
Total MEB
Exclude quintiles 1 4 and 5
Exclude quintiles 1 4 and 5
Exclude quintiles 1 and 5
Exclude quintiles 1 and 5
FCS 35ndash80
FCS gt= 42
FCS 35ndash80
FCS gt= 42
403
296
610
474
5259
5324
5691
5740
2304
2299
2990
3082
070
070
066
065
030
030
034
035
7562
7623
8681
8822
Food MEBValue in taka Value in taka
Non-food MEB
identified in different contexts
24 Hohfeld et al 2020 25 WFP 2019
15
Minimum Expenditure Baskets Guidance Note | December 2020
3 Establish the food basketWith the reference cohort identified the food basket value
should be calculated in correspondence with the food
consumption patterns of the reference cohort
To calculate the food basket start by computing the mean
(or median) food expenditures for the chosen reference
cohort It is good practice to compute the overall food
expenditures and break the analysis down into the different
food groups or food items in order to understand how food
consumption is distributed across different foods
Next consider whether an explicit reference food basket
is needed in the MEB this is a list of the food items in the
basket and their quantities Having a reference basket
brings advantages in terms of monitoring of the cost
of the MEB (as new prices can easily be applied to the
quantities) it shows consumption patterns in quantities
and can hence help check if food consumption is adequate
at the given level of expenditures and it can help when
communicating about the MEB It can therefore be a useful
practice to establish one However in some instances
a simple monetary value for the food MEB is sufficient
This could be the case when the MEB is calculated to
review an existing MEB if reference basket is not needed
for operational purposes when time is limited or
where limited data means a reference basket cannot be
adequately calculated Wherever a food reference basket
is not needed the food MEB will simply be the mean (or
median) food expenditures by food groups or food items
as calculated above If a reference food basket is feasible
and desired the next steps depend on the level of detail in
the data available
With expenditure data and market prices a food
reference basket can be approximated using expenditures
by food group or food item and dividing these
expenditures by the relevant food prices This provides
estimates of consumed quantities Expenditures and prices
must be collected at the same time in order to arrive at
correct quantities If for example prices are collected six
months later than expenditures and prices have changed
significantly dividing expenditures by prices will produce
inaccurate estimates
Note that the level of detail and accuracy with which a
food refence basket can be established using expenditures
and prices also depends on whether expenditures
were collected at the food group or food item level Box 6
illustrates how to approximate a reference basket when
expenditures are collected at the food group level and
box 7 shows an example of a food basket estimation from
an assessment in Kinshasa Democratic Republic of the
Congo
If the expenditure module includes consumed quantities
of food in addition to expenditures a food basket can be
established directly based on the consumed quantities by
food group or food item Having data on quantities will
also enable analysts to estimate prices directly from the
survey data by dividing the household expenditure on a
particular food item by the quantity consumed This can be
advantageous as it provides a direct estimate of the prices
households actually paid (unlike a price survey which uses
typically consumed items and is often only conducted
at specific points of sale) On the other hand this may
introduce issues related to non-standard measurement
units that make prices hard to compute and aggregate26
Box 8 shows an example from Coxrsquos Bazar of how a food
reference basket can be established using item-level
expenditures and quantities from the survey data
Once the quantities consumed have been established using
one of the methods described above it is good practice to
check the calories these quantities provide and the balance in
terms of nutrients The basket should be close to the Sphere
Standard of 2100 kcal per person per day ndash if it is not one
option could be to scale the basket Use information on the
calorie content of the different food items in the basket to
calculate the total calorie content of the basket27 The quantities
in the basket can then be scaled up or down to reach 2100
kcal However bear in mind that if the reference cohort has
been well selected and the data is of sufficient quality and
detail the basket should already be close to 2100 kcal If large
rescaling is required investigate the reasons behind this For
the sake of simplification quantities can be rounded and the
basket can be streamlined by removing items with very low
consumption or nutritional value
26 Deaton and Grosh 2000 27 Calorie information of food items can be drawn from a variety of sources The Nutval tool (httpwwwnutvalnet) provides information on calories and other nutrients for a list of items Consider that the
specifications and quality of a product can influence its caloric value (eg whole fish vs fish fillet) ndash it might be necessary to adjust for this for certain items that vary widely Many food composition tables (available from FAO for different continents httpwwwfaoorginfoodsinfoodstables-and-databasesfaoinfoods-databasesen) contain a wastage factor or edible portion conversion factor to convert from edible portions into full products as they are bought on the market
16
Minimum Expenditure Baskets Guidance Note | December 2020
After establishing the reference basket and possibly rescaling
it the basket is priced This is done by multiplying the basket
quantities by the food prices The basket can be priced using
current food prices from a price survey or by estimating food
prices from the expenditure data as described earlier The
result should be close to the expenditures for the reference
cohort although differences could arise from any rescaling or
simplification of the basket
APPROXIMATING A FOOD BASKET WITHGROUP-LEVEL FOOD EXPENDITURES
Box 6
HOW TO
Data quality and granularity has a big impact on the calculation of a food reference basket If consumed quantities are not
directly available in the dataset they need to be calculated by dividing expenditures by prices However this will always
produce an approximation and the more aggregated the data on expenditures is the more approximate the results will be
In particular when the food expenditure data is available at the food group level care needs to be taken when converting
expenditures into quantities
For example to convert expenditures on the food group ldquocerealsrdquo into a reference quantity analysts need to divide cereal
expenditures by the price of cereals But how do they determine the price of cereals This is a food group not a specific item
so there is no exact price The recommended way to approach this is to determine which is the most commonly consumed
item or combination of items for each food group Then a price for the most commonly consumed item or a composite price
of a combination of items can be used to arrive at quantities So if the most commonly consumed cereals for the population
of interest are maize and rice and they are eaten in equal measure by the population the cereal quantities for the reference
basket can be calculated in the following way
Mean cereal expenditures for our reference cohort = 150 shilling
Price of rice = 18 shillingkg
Price of maize = 12 shillingkg
Composite price of rice and maize = (18 + 12) 2 = 15 shillingkg
Cereal quantity consumed = 150 shilling (15 shillingkg) = 10 kg (5 kg rice 5 kg maize)
Of course this is an approximation care needs to be taken when converting expenditures into quantities using
group-level data
Certain food groups may lend themselves more to this approximate conversion than others For example cereals
might be relatively easy to convert using this method as cereal consumption often is concentrated on a few key staples In
contrast vegetable consumption may be so diverse that conversion via prices is not helpful In this latter case one option
could be to obtain reference basket quantities for the groups that can be converted and leave other groups as expenditures
only so that the food MEB becomes a combination of quantities and expenditures
In summary to establish the food basket
i Calculate mean (median) food expenditures by food group
or item If an explicit reference basket with quantities is not
needed stop here and simply use the expenditures as the food
basket
ii Estimate consumed quantities (by dividing expenditures
by prices or directly from data if it contains consumed
quantities)
iii Check the resulting quantities and consider scaling to meet
Sphere Standards
iv Price the basket using market prices or prices derived
from the household data
17
Minimum Expenditure Baskets Guidance Note | December 2020
Table a Food reference basket ndash Kinshasa MEB
COUNTRYEXAMPLE
KINSHASA FOOD REFERENCE BASKET USINGFOOD GROUP EXPENDITURES
Box 7
In the Kinshasa urban essential needs assessment28 the food reference basket for the MEB was established as follows
Expenditure data was available at the food group level only The caloric importance of each food group (column A of the
table below) as a part of the overall food intake was determined For each of the calorie-relevant food groups the most
commonly consumed food item was then identified (eg maize in the case of cereals) (see column B) Using the average per
capita expenditure from the household survey (column C) and the market price for each food item (column D) the
quantities consumed per person per month were approximated (column E) Next the total calorie intake was calculated
(column G) For urban Kinshasa this amounts to 1967 kcal which is close to the Sphere Standard of 2100 kcalpersonday
and suggests that the expenditure data is likely to be reliable However a proportional rescaling to 2100 kcalpersonday
was done to ensure consistency with Sphere (column H) On the basis of the rescaled total calories all values were then
converted back to monthly figures to arrive at a monetary value for each food item (columns I and J) In addition to the
calorie-relevant food items the mean expenditures on other food categories that households regularly consume were
added (vegetables fruit etc) As these food items represent little overall share of peoplersquos calorie consumption (given the
quantities consumed or the type of the foods) they were not included when calories were calculated Furthermore it would
be difficult to select specific food items in each of these categories as they are quite diverse (eg vegetables) However as
most households still consume these food items as part of their usual diet and they provide important micronutrients their
costs need to be reflected in the food MEB The mean expenditure on these food categories was therefore used as a
good-enough approximation for householdsrsquo consumption of these food groups Meals consumed outside the household
were excluded from the MEB as they were not considered essential
Food
grou
p
Food
item
per
capi
ta a
vm
onth
ly e
xp
Pric
e(f
ranc
kg)
kg c
ons
per
mon
th =
CD
food
item
kca
lpe
r 10
0g
kcal
con
s p
er d
ay=(
EF
10)
30
kcal
per
day
res
cale
d=G
(21
001
967)
kg p
er m
onth
res
cale
d=(
H(
F10
))30
roun
ded
MEB
food
-bas
ket
(fra
nc)=
ID
6898
1808
2089
2341
4306
1817
2826
833
799
2509
2144
900
500
1300
2300
2500
2200
77
36
16
10
17
08
920
412
179
302
44
110
1967
360
342
335
890
76
400
TOTAL
982
440
192
322
47
118
2100
82
39
17
11
18
09
7400
1900
2200
2500
4600
1900
2800
800
800
2500
27400
A B C D E F G H I JCereals
Tubers
Pulses
Oilsfats
Meatfish
Sugars
Vegetables
Fruit
Dairy
Condiments
Meals out-
side home
Maize
Cassava
Beans
Veg Oil
Fish
White sugar
Vegetables
Fruit
Dairy
Condiment
Meals out-
side home
29 WFP 2019 Also see box 5
18
Minimum Expenditure Baskets Guidance Note | December 2020
COUNTRYEXAMPLE
COXrsquoS BAZAR FOOD REFERENCE BASKETWITH DETAILED EXPENDITURE AND QUANTITY
Box 8
In the MEB for Coxrsquos Bazar calculated as part of the REVA II assessment expenditures and consumed quantities were
available for 87 food items which formed the basis for the consumption aggregate While the expenditure data was used to
select the appropriate reference cohort the reported quantities were used to determine household calorie intake
Quantities were reported at the food item level and consumed calories were calculated for each item The items were then
categorized by food group (cereals pulses oilsfats vegetables etc) and the total calories from each group were
calculated To create an operationally relevant reference basket without very large numbers of food items the number of
items in each food group were reduced where possible For example 95 percent of the calories that households get from
the food group ldquocerealsrdquo come from rice The cereal food group was therefore simplified to rice only keeping the total
calories sourced from cereals constant and adjusting the quantity of rice in the basket slightly upwards For pulses the four
main consumed items were identified and calories and quantities proportionally adjusted For other food groups such as
vegetables the variety of items consumed within the group was too great to simplify items to a small number for this
group no items were assigned and instead total expenditures on vegetables for the reference cohort were used directly in
the food MEB The total calories of all items were taken into account The resulting basket was close to 2100 kcal so only
minor rescaling was undertaken to arrive at final reference basket of 2100 kcalpersonday
Once the final basket had been determined quantities were priced using median prices derived from the household data
(by dividing expenditures by purchased quantities for the relevant items)
For vegetables fruits meat dairy and condiments expenditures are used directly in the food MEB (converted into monthly per
household values) For all other items quantities per capita per day are multiplied by the item median price (as derived from
the household data) and converted into monthly per household values
The MEB uses household size 5
Note The MEB for Coxrsquos Bazar was calculated for analytical purposes for the REVA II assessment It is not the operational MEB used
for the district
Foodgroup
Fooditem
Consumedquantity(grammescapitaday)
Calories(kcalcapitaday)rescaled
Median prices(takakg)
Value in MEB(taka per HHmonth)
424
14
7
2
1
182
6
81
1
33
6
28
1527
48
27
8
4
78
5
85
1
294
24
0
2100
30
80
60
40
80
-
-
-
-
80
60
-
1909
168
67
14
13
1065
48
1600
15
392
57
345
5691
Cereals
Pulses
Pulses
Pulses
Pulses
Vegetables
Fruit
Meat
Dairy
Fats
Sugar
Condiments
TOTAL FOOD
Rice
Lentil
Chickpea
Anchor daal
Mung
none
none
none
none
Soybean oil
Sugar
none
Table a Food reference basket ndash Coxrsquos Bazar MEB
19
Minimum Expenditure Baskets Guidance Note | December 2020
4 Establish the non-food basketOnce the food component has been established a non-
food component is added There is no wholly satisfactory
way to add a non-food component as it can be difficult to
define an essential minimum Unlike food needs many
non-food needs are often more contextual and are not
easy to anchor in a specific universal threshold (like the
food Sphere Standard of 2100 kcal per person per day)
While Sphere Standards exist they often need to be
contextualized and may not cover all non-food essential
needs
The non-food basket can be established with different
levels of detail depending on the available data and the
level of granularity desired
As for the food expenditures start by calculating the
mean (andor median) non-food expenditures for the
reference cohort If the expenditure data is detailed it can
be used to identify specific non-food needs Expenditures
can be analysed by non-food group (eg shelter hygiene
or transport) to design a non-food basket composed
of group-specific expenditures The precise non-food
components can vary by context but would generally
include the components discussed in the section on
the rights-based MEB below Some non-food items that
expenditure data has been collected for might need to be
excluded for the purpose of constructing the MEB (eg
tobacco which is hard to consider an essential need)
In theory it would be possible to establish a non-food
reference basket with specific quantities using the same
method as for food ie by dividing expenditures by prices
to arrive at quantities However this is usually not feasible
for non-food goods and services simply because non-food
expenditure data is often much harder to break down into
specific items than food expenditure data For instance
even if expenditures on clothing or transportation
are known relating this to exact clothing items or
transportation services and then obtaining accurate
prices for those itemsservices will often prove difficult if
not impossible Therefore as a general recommendation
in the expenditure-based approach when non-food
expenditure data is not available at the item level it is
best to keep the non-food basket to expenditures and not
provide quantities If reliable market price information on
relevant non-food items is available total expenditures
could be checked against prices to obtain an approximate
idea of the adequacy of the non-food expenditures
Particular groups of non-food expenditures may require
special attention due to their nature Box 9 highlights a
few examples
TIP BOXNON-FOOD EXPENDITURES ndashEXPENDITURES OF PARTICULAR INTEREST
$$
$
Box 9
Shelter expenditures can be a tricky component to deal with especially for urban populations If the share of the
population who rent accommodation is significant rent will typically be included in the MEB as it is the cost of shelter an
essential need Indeed it can form quite a significant part of the MEB However if the resulting MEB is compared to actual
expenditures to determine whether households fall below the MEB those who own their dwelling and therefore do not pay
rent might be classified as unable to cover their needs just because they do not have any major shelter expenditures
Therefore large single expenditures such as rent should be included with care and context will determine how shelter
expenditures are handled in the MEB Generally speaking if no or very few households in the population of interest have
major shelter expenditures such as rent this component should be left out of the MEB and no attempt made to impute it
(as is sometimes the case in poverty line estimations) If the majority of households rent their dwellings it is advisable to
include mean rent expenditures in the MEB The trickier case is when the households in the population of interest are split
between a significant number of households living in owned or no-rent housing and a significant number paying rent ndash
here it is difficult to reflect shelter expenditures adequately in the MEB Simply using mean rent estimations in the MEB will
underestimate the need for the renters while overestimating it for those who own their housing or do not pay rent In this
case insofar as data allows one solution could be to impute rent expenditures for the non-renters by estimating the
would-be rental cost for the type of housing they live in Doing this typically requires a housing module in the household
survey that contains information on ownership and types and sizes of housing so rental equivalents can be computed and
imputed for the non-renters
20
Minimum Expenditure Baskets Guidance Note | December 2020
NON-FOOD EXPENDITURES ndashEXPENDITURES OF PARTICULAR INTEREST
$$
$
Box 9
Health expenditures can also be challenging to capture adequately in survey data as such expenditures are often irregular
in nature Bear in mind that health expenditures usually consist of payment for goods such as medicines and for services
such as visits to the doctor When analysing the expenditures and deciding how to include them in the MEB consider which
services may be provided free of charge and what households pay themselves and at what cost30
Care should be taken when it comes to the underreporting of expenditures and treatment of expenditures that are
irregular in nature Remember that the MEB should include all recurrent essential needs but it typically does not include
one-off expenditures ldquolumpy expendituresrdquo such as marriage expenditures or dowries or investments Expenditures
on durables (for instance the purchase of vehicles or large household appliances) are also not included (in national poverty
lines the rental value of the durables owned by households adjusted for depreciation is sometimes included31 however
this is not recommended for MEB calculations)
Household expenditures on savings taxes and debt repayment are not usually included in the MEB as these types of
expenditures do not reflect actual consumption
Tobacco and alcohol are often included in expenditure surveys While households may choose to spend money on these
items they can fairly be assumed to be non-essential and are generally not recommended for inclusion in the MEB
The ldquoquick fixrdquo if data is very limited If the expenditure
data has no or very insufficient data on non-food
expenditures a ldquoquick fixrdquo solution is to use the average
non-food expenditure share of total expenditures This can
often be obtained from external sources such as monitoring
reports or food security assessments This is then added
COUNTRYEXAMPLE
Table a Non-food basket ndash valuesCoxrsquos Bazar
Value in MEB (takaHHmonth)
Non-food group
Toiletries and cleaning
Clothes shoes and towels
Cooking equipment
Education
Fuel and electricity
Medical treatment
Household textiles and small repairs
Communication
Transport
Total non-food
461
521
25
134
775
447
57
274
295
2990
Figure a Non-food basket ndash distribution Coxrsquos Bazar
Note The MEB for Coxrsquos Bazar was calculated for
analytical purposes in the REVA II assessment
It is not the operational MEB for the district
9Communication
10Transport
2Householdtextiles and
small repairs
15Medical
treatment
26Fuel andelectricity
5Education
1Cooking
equipment
17Clothes shoes
and towels
15Toiletries
and cleaning
EXPENDITURE-BASED NON-FOOD REFERENCEBASKET EXAMPLE FROM COXrsquoS BAZAR
Box 10EG
to the cost of the food basket to arrive at the total MEB
However when using an additional data source analysts
should understand how the average share of non-food
expenditures has been calculated and what sample it has
been derived from as it may not reflect the consumption
patterns of the reference cohort
30 The WHO and Global Health Cluster guidance on health expenditures in the MEB has some useful insights into household health expenditures See WHO and Global Health Cluster ndash Cash Task Team 2020 31 Deaton and Zaidi 2002
21
Minimum Expenditure Baskets Guidance Note | December 2020
52 The rights-based approachIn humanitarian contexts ldquoessential needsrdquo have been
understood as referring to access to full rights as set out by
international humanitarian law and the Humanitarian Sphere
Standards The term ldquorights-based MEBrdquo is derived from
this understanding According to the operational guidance
on multipurpose cash grants32 international humanitarian
and human rights law protects the right of crisis-affected
persons to food33 drinking water soap clothing shelter and
lifesaving medical care Humanitarian Sphere Standards
builds on this definition and outlines minimum humanitarian
standards in the areas of food security and nutrition
shelter and settlement health and WASH (water supply
sanitation and hygiene)34 In some contexts residency or legal
documentation is also included Humanitarian standards
for education are outlined in the Education in Emergencies
Minimum Standards Handbook35
The rights-based approach entails defining a detailed list
of the food and non-food items that make up the MEB
reference basket and pricing them using current market
prices MEBs built by the Interagency Cash Working Group or
other interagency coordination forum are often constructed
following the rights-based approach with each sector or
cluster contributing to the needs in their respective sectors
In these cases WFP is usually responsible for defining the
food component of the MEB For both food and non-food
items the reference basket is typically produced or cross-
checked through focus group discussions with the population
of interest partners and key informants It is usually put
together based on the needs of an average-sized household
1 Establish the food basketTo construct the food basket for a rights-based MEB compile
a list of food items and their quantities The Sphere Standards
offer a useful starting point recommending a diet of 2100
kcal per person per day with 10ndash12 percent of daily energy
intake from protein and 17 percent from fats36 The food
basket should be adapted to local diets and preferences
2 Establish the non-food basketOnce the food basket has been established a non-food basket
should be added In the rights-based approach this is typically
done by quantifying needs by producing a list of items by
sector Some examples are found below
Shelter This is the cost of accommodation that meets
basic shelter needs and rights What this means in practice
will depend on the context driven for example by weather
conditions and what is realistically available to the population
Utilities These include the cost of basic utilities such as safe
drinking water and depending on the context electricity
Non-food items These reflect basic household needs
related to cooking clothing and hygiene plus other general
household items Cooking gasfuel or firewood is often
included In line with the definition of the MEB the list should
focus on recurrent needs In practice these non-food items
can look very different depending on the context 38
Services This includes the costs of accessing basic services
such as healthcare education transport and communication
Healthcare costs are often difficult to quantify since they
are inherently irregular large and unpredictable Typically
however only basic minimum needs are covered in the MEB
such as eg two visits per year to the doctor expenses for
critical events deliveries and medicines are sometimes also
included Note that even if a need is not covered by the MEB
it does not mean that these needs do not need to be met for
the population of interest Health can be an example of this
health needs are often better met through service provision
than purchased through the market and therefore may
be only partially reflected in the MEB However guidance
from WHO and the Global Health Cluster notes that people
tend to have some level of health expenditures even when
COUNTRYEXAMPLE
SHELTER IN THE MEBFOR SYRIAN REFUGEES
EG Box 11
For the Syrian refugee operation in Turkey the MEB
includes the costs of shelter that meets certain
standards such as a minimum of 35 m2 per
person access to a toilet and running water
32 UNHCR et al 2015 33 Defined as energy needs not considering full nutrient needs (protein vitamins minerals etc) 34 See the Sphere Standards Handbook 35 INEE 2010 36 Further recommendations on micronutrient requirements can be found in the Sphere Standards Handbook37 Hobbs 201638 For some refugee contexts the Office of the United Nations High Commissioner for Refugees (UNHCR) has lists of specific items which can be considered for the MEB
22
Minimum Expenditure Baskets Guidance Note | December 2020
policies are in place that require the free public provision of
health services39
Education costs usually cover school fees materials
uniforms and transport depending on what households
have to pay themselves and what is publicly available
Transport and communication needs are often defined as
the average transport and communication costs reported by
household surveys and then validated with the communities
COUNTRYEXAMPLE
EXAMPLE OF A RIGHTS-BASED MEBFOR NORTHEAST NIGERIA
Box 12EG
The northeast Nigeria cash working group designed a MEB for a household of seven people40 the resulting reference
basket is shown below
Sectorgroup
Item Quantity(7 pers HH)
Sectorgroup
Item Quantity(7 pers HH)
Cooking fuel
WASH
Cooking fuel
WASH
Transportation
Communication
Health
Education
Firewoodbriquette
charcoal
Water + vendor fee
Bathing soap
Laundry soap
Sanitary pads
Firewoodbriquette
charcoal
Water + vendor fee
Bathing soap
Laundry soap
Sanitary pads
Rides
Airtime 500 NGN
Average expense
Pen
Pencil
Notebook
1 bag
158 jerrycans
13 bars
3 bars
4 packs
1 bag
158 jerrycans
13 bars
3 bars
4 packs
10 rides
1
7 pers
3 pcs
3 pcs
3 pcs
Table a MEB example northeast Nigeria
27 kg
45 kg
135 kg
18 L
27 kg
18 kg
36 L
09 kg
144 kg
2 kg
2 kg
1 kg
05 kg
12pcs
1L
Food Rice
Maize
Beans
Palm oil
Groundnuts
Sugar
Vegetable oil
Salt
Onion
Non-leafy vegetables
Leafy vegetables
Fruits
Meats
Chicken eggs
Vinegar
communication needs can also be specified as the cost of a
SIM card with a certain amount of data or airtime
3 Price the reference basketWith the food and non-food reference baskets established
the list of items and quantities are now priced using updated
prices from markets relevant to the population of interest
The pricing should be done based on actual current market
prices This produces the final rights-based MEB
39 WHO and Global Health Cluster ndash Cash Task Team 2020 40 Cash Working Group Nigeria 2018
23
Minimum Expenditure Baskets Guidance Note | December 2020
MEB APPROACHES ndash CONSTRUCTION SUMMARYBox 13
HOW TO
Rights-based approach
Establish the food basket
Define a list of relevant and locally preferred and
available food items and their quantities The Sphere
Standards can be used as a reference
Establish the non-food basket
Define a list of essential non-food items relevant to the
population of interest and their quantities Services such
as education or transport can also be included The list is
usually put together sector by sector
Price the basket
Use current market prices for the food and non-food
items in the reference baskets to calculate the price of
the basket Use prices from markets relevant to the
population of interest
1
2
3
4
1
2
3
Expenditure-based approach
Prepare the expenditure data
Ensure the data is cleaned Compute expenditures by
combining cash and credit expenditures the value of
consumed own production and consumed assistance
for both food and non-food expenditures Compute
expenditures as per capita figures
Select the reference cohort
Identify households ldquojust able to meet their essential
needsrdquo using indicators such as FCS FCS-N housing or
others excluding households in extreme quantiles of
expenditure distribution or other criteria or
combination of criteria Check the sensitivity of the
results to the selection of reference cohort
Establish the food basket
Calculate mean (median) food expenditures by food
group or item Either stop here or ndash to obtain a refence
basket ndash estimate consumed quantities check the
calorie content of the resulting quantities and consider
scaling them to Sphere Standards Price the basket
using market prices or prices derived from the
household data
Establish the non-food basket
Calculate mean (median) non-food expenditures by
non-food group or item If item-level data and prices
are available it is possible to derive a non-food
reference basket using same methodology as for the
food basket otherwise the non-food basket will
comprise the expenditures at the group level If a
quick-fix solution is needed add the average household
non-food expenditure share to the food MEB
53 Summary and data needs for expenditurendashbased and rights-based approachesBox 13 summarizes the steps to follow in order to construct a
MEB using an expenditure-based or a rights-based approach
24
Minimum Expenditure Baskets Guidance Note | December 2020
Qualitative understanding
of essential needs for the
population of interest
Representative household
survey with detailed
expenditure module
List of ldquorights-basedrdquo needs
Price information
Focus group discussions with key informants or population
of interest
Literature review of existing information on the essential needs of
the population of interest
WFP essential needs assessment emergency food security
assessment or comprehensive food security and vulnerability
analysis or other representative pre-assistance baseline survey
National household budget surveys household income and
expenditure surveys living standard measurement surveys or
other large-scale household survey
Clusters Cash Working Group other interagency forum
Sectoral assessments other secondary information
Price data series covering the area of interest for relevant food
and non-food items and services from WFP (Dataviz41 has
up-to-date price information) or partners
Price indices from national statistical offices
Prices derived from household expenditure data where quantities
are also reported
Suggested sources Expe
ndit
urendash
base
d
Righ
tsndashb
ased
INFORMATION NEEDS AND SOURCESMEB APPROACHES
Box 14
HOW TO
Information need
TIP BOXWHAT IF DATA USINGA HOUSEHOLD ECONOMY APPROACH IS AVAILABLE
$Box 15
The household economy approach (HEA) developed by Save The Children is commonly used for analysing food security and
livelihoods It is based on understanding how households normally access income food and other itemsservices required
for survival established through a baseline analysis As part of the baseline the HEA defines livelihood zones where
households share similar strategies for obtaining food and income It also distinguishes households within these livelihood
zones in at least three (often four and sometimes more) wealth groups The HEA baseline quantifies the sources of food
and income and the expenditure patterns for each wealth group and livelihood zone
The information collected on expenditures can be used as a data source for calculating a MEB However due to the relative
nature of the wealth cut-off points used there is no set standard regarding which group should be the reference for the
MEB If HEA data is utilized it is important to understand how it was collected ndash the HEA is simply an analytical framework
not a set method of data collection Thus while HEAs are often conducted through qualitative methods (eg focus group
discussions) they may also be based on quantitative modules in household surveys The latter yields more rigorous
information however qualitative data can be used but should be cross-checked or triangulated with other sources
39 See VAM data portal at httpsdatavizvamwfporg
25
Minimum Expenditure Baskets Guidance Note | December 2020
54 Expenditure-based or rightsndashbased approach Pros and consThere are advantages and disadvantages to both types of
approach which should be kept in mind when constructing
the MEB
The expenditure-based approach has the advantage that it
directly reflects the actual demand of the population of interest
as it uses survey data to examine peoplersquos consumption
behaviour It is also fairly straightforward to carry out if good
survey data on the population is available One disadvantage is
that it can be difficult to put into practice when the population
of interest is generally poor (such as in a pre-assistance
refugee situation) because the number of households who can
constitute the reference cohort can be too small to analyse
Also care has to be taken when looking at expenditure patterns
only as the reference cohort may not always cover all of their
essential needs to a desired level (from a ldquorightsrdquo perspective)
For example the food patterns for those ldquojust able to meet
their essential needsrdquo may not always be very nutritionally
diverse as they are based purely on consumption behaviour42
In general the expenditure-based approach should not be applied
without good quality household expenditure data
TIP BOX ADVANTAGES AND DISADVANTAGES OFDIFFERENT APPROACHES TO ESTABLISHING MEBS
Box 16
Pros
Cons
Expenditure-based Rights-based
Straightforward to carry out if household data
is of good quality
Builds on actual consumption patterns of the
population of interest
Difficult to identify reference cohort if
everybody is poor
Survey data may not capture all essential needs
fully from a ldquorightsrdquo perspective
Survey data is not needed
Effective demand can be different from identified
needs leading to a MEB that does not reflect
actual demand and making comparison with
monitoring data tricky
Contains incentives to inflate sector-specific needs
The advantage of the rights-based approach is that
it can be used to construct a MEB without survey data
(although survey data is needed to monitor the MEB) One
disadvantage is that the effective demand of households
can look quite different from the basket that results from
this approach Another disadvantage is that particularly
when constructed in an interagency setting a rights-based
MEB can easily become an instrument for different partners
to compete for and secure funding There is a substantial
incentive to include excessively high sectoral needs if sector-
specific interventions are envisaged Finally if the MEB is
very detailed but the expenditure module in the household
surveys used to monitor peoplersquos expenditures against the
MEB is very crude comparison is difficult and therefore the
practical use of the MEB can be limited Many households
may fall below the MEB simply because of the discrepancy in
methods between the MEB and the monitoring data This is
similar to the issue previously discussed regarding the use of
national poverty lines
Box 16 summarizes the advantages and disadvantages of the
two approaches
42 A study conducted in Nepal showed that the food poverty line is well below the so-called ldquonutrient povertyrdquo line (see Geniez et al 2014)
26
Minimum Expenditure Baskets Guidance Note | December 2020
6 Arriving at a realistic and operationally relevant MEBRegardless of which processes and approaches are used to
construct the MEB it is crucial to arrive at a final result that
is a realistic picture of the cost of essential needs for the
population of interest rooted in actual consumption
behaviour This section looks at how approaches can be
combined to generate a hybrid MEB and how the result can be
ldquoreality checkedrdquo and validated
61 Combining approaches the hybrid MEBAs described in section 54 there are disadvantages to the
expenditure-based and the rights-based MEB approaches that
can affect the final MEB One way to overcome this challenge
may be to combine information from each approach in
a ldquohybridrdquo MEB This means making sure that the MEB is
consistent with the actual consumption behaviour of the
population of interest as found in expenditure data while
keeping the rights-based lens There is no one way to go about
this the method is subject to the availability of expenditure
data and other information on essential needs as well as the
objective of the MEB
When good quality expenditure data with a large enough
sample size is available for constructing the MEB it is good
practice to use the expenditure-based approach as a basis
for the analysis as far as possible If the expenditures of
the reference cohort are subsequently found not to reflect the
costs of covering certain essential needs for the population of
interest rights-based information should be used to reinforce
the MEB with a hybrid model If expenditure data is not
available and cannot be collected a rights-based MEB can be
constructed but should be cross-checked against any available
household-level information on consumption patterns
When starting with the construction ofan expenditure-based MEB
Did the household survey capture all essential needs or
are some not included in the data at all
If some needs are wholly overlooked consider using
rights-based information to capture them but ensure these
needs are actually in demand by the population of interest
and only missing because the survey did not capture them
Are the expenditures that are typically trickier to capture
well reflected and are the reference cohortrsquos expenditures
on them adequate from a rights-based perspective
For example if education expenditures are completely
inadequate for the reference cohort (and this is not because
the reference cohort selected is ldquotoo poorrdquo) consider using
rights-based information to capture them eg by using the
cost of school fees or school supplies like books or
uniforms
Be particularly careful with the inclusion of needs where the
supply of goods or services is far from adequate or may be
inexistent The MEB needs to ultimately reflect consumption
behaviour so adding goods or services that are not
available to the population of interest or not in demand
will lead to an unrealistic MEB
When starting with the construction ofrights-based MEB
Are the identified needs in line with the actual
consumption patterns of the population of interest
Check the reference baskets against any available
information on demand and consumption and adjust items
and quantities to reflect actual consumption patterns This
could be done using data on consumption shares by food
group and non-food group for example
Are there needs that people consider essential and choose
to spend resources on but are not captured by any sector
Check the reference baskets against any available
information on demand and consumption and adjust items
and quantities to reflect actual consumption patterns
The key to constructing a hybrid MEB lies in triangulating
information and asking the right questions during the
analysis When constructing a MEB consider the following
27
Minimum Expenditure Baskets Guidance Note | December 2020
Box 17 contains examples of hybrid MEBs constructed in different contexts
COUNTRYEXAMPLE
HYBRID MEBS IN URBAN SETTINGS IN KINSHASATHE DEMOCRATIC REPUBLIC OF THE CONGOAND FOR SYRIAN REFUGEES IN TURKEY
Box 17
For the MEB calculated as part of an urban assessment in Kinshasa43 a hybrid approach was chosen to deal with
hard-to-capture but essential expenditures such as health and education Health costs are often difficult to estimate as they
are not regular and when they do occur they often make up a large share of monthly expenditures The analysts decided to
estimate health costs through a rights-based approach instead of using expenditures from the survey Qualitative
information from key informants was used to define the cost of one doctorrsquos visit per year for each household member In
each commune the median cost was between CDF5000 and CDF6000 per visit this was represented in the MEB as
CDF500 per household member per month Over-the-counter medication was also included as part of health-related
expenditure through the addition of a per-capita expenditure of CDF1500 every two months sufficient for a course of
antimalarial drugs or antibiotics and simple medication such as painkillers or anti-inflammatory drugs
In Turkey expenditure and price data from different sources was used to assess update and adjust an existing
rights-based MEB44 for Syrian refugees living in the country A hybrid food basket was calculated using detailed information
on the consumption behaviour of Syrian refugees in Lebanon collected through itemized receipts from food assistance
e-cards The resulting food basket was triangulated with the less detailed information available from a household survey on
Syrian refugees in Turkey The results showed strong consistency between consumption behaviour of both groups
The resulting food reference basket for the MEB was then priced with official price statistics data and inserted into the
rights-based MEB Quantities of non-food items were kept as before but updated with current price data To ensure that
the MEB reflected consumption behaviour expenditure shares were triangulated with household data See table a
To value and update the MEB price data was required The official price statistics included higher quality items and brands
consumed more by the average Turkish population than by the poorer refugees To correct for this the difference between
the price of the MEB and the food expenditures of a non-poor cohort were assessed and a correction factor applied to
compensate for the overestimation of the updated MEB
Commodity
Table a Food reference basket ndash MEB for Syrian refugees in Turkey
Daily ration perperson in gram
Dailykilocalorie
Old referential food basketDaily ration perperson in gram
Dailykilocalorie
Revised Turkey food basket
150
200
50
20
30
40
20
8
30
30
5
0
0
0
0
540
684
186
29
65
137
0
28
116
265
0
0
0
0
0
100
50
0
70
0
50
30
50
50
25
5
250
50
30
5
Rice white medium grain
Bulghur wheat
Pasta
Egg whole chicken fresh
Poultry
Beans dried
Cucumber
Cheese canned
Sugar
Oil sunflower fortified
Salt iodised
Bread made from wheat
Yoghurt whole milk (leban)
Tomatoes red ripe
Tea black nutrients per 100ml of brewed tea
360
171
0
100
0
170
0
178
194
221
0
675
31
5
0
Total Kcal 2050 Total Kcal 2104
43 WFP et al 201844 WFP 2018
28
Minimum Expenditure Baskets Guidance Note | December 2020
62 Reality checks and validation with stakeholdersIn addition to asking the right questions of the data as
described in the previous section it is crucial to reality check
results when constructing the MEB This means understanding
whether the MEB provides a picture of the cost of living that
matches the reality on the ground
First of all it is important to check the MEB result with the
real circumstances of the population of interest Focus group
discussions andor key informant interviews can be held when
starting work on the MEB and after a result is obtained in
order to ensure that the MEB is a true reflection of needs and
priorities
The MEB figures can be compared with the national poverty
line ndash even if it is not advisable to use the poverty line directly
as the MEB it is good practice to check the MEB results against
it They can also be checked against any social assistance
transfer values provided in government programmes the
minimum wage or the casual labour rate or any other
information available about needs and cost of living For
instance if the MEB is much higher than what the wages
from one month of work for a typical household can buy
that could indicate that it needs adjustment and that some
of the analytical steps need to be revisited ndash as long as the
wage rate itself is reasonable The same goes for the poverty
line ndash if the two are very far apart it could be a sign that the
MEB analysis should be crosschecked Perhaps the reference
cohort was not adequately selected some sectoral needs were
overestimated or there is a large proportion of consumption of
own production has not been properly taken into account
Something that is often of particular interest is the nutritional
composition of the food part of the MEB As seen above MEB
construction typically starts from the Sphere requirement of
2100 kcalpersonday However since the MEB follows the
actual consumption behaviour of the population of interest
(especially when following an expenditure-based approach)
the resulting food basket reflects what households actually
eat which is not necessarily a nutrient adequate diet If the
basket is found to be very low in essential nutrients it could
be that the reference cohort was not well selected and a
wealthier cohort with a more balanced diet at the 2100 kcal
personday threshold might need to be identified45 However
selecting better-off households will not necessarily lead to a
more nutritionally balanced basket as food preferences are
influenced by a range of factors in addition to budget
Analytical tools to determine the cost of nutritious diets
include Cost of the Diet (CotD) developed by Save the Children
UK and used by WFP in the Fill the Nutrient Gap Analysis
CotD uses linear programming to establish the lowest cost
diet that can meet requirements for energy protein fat and
13 micronutrients for individuals in a population considering
age gender body weight physical activity level and whether
a woman is pregnant or breastfeeding CotD can be thought
of as the lowest cost of an optimal diet considering individual
requirements It is therefore useful in illustrating the needs
of vulnerable populations and their nutrient intake barriers
However it is important to keep in mind that a MEB food
basket may not deliver adequate nutrient intake when used
to set a transfer value for households even if aligned with
an optimal diet As noted above because of household
consumption choices and food allocation within households
having more money to spend may not necessarily lead
households to buy more nutritious food
MEBs should be first and foremost built on consumption
patterns that reflect actual behaviour A large difference in
cost between the MEB food basket and CoTD may hence
be driven by factors such as low availabilityhigh cost of
nutritious foods or household preferences The WFP technical
note on Fill the Nutrient Gap and minimum expenditure
baskets offers further insights into the complementarities
of the two analyses and how to use them on conjunction for
programming purposes46 When a MEB is operationalised
additional nutritional considerations could be necessary
It is important to check the MEB result with the real circumstances of the population of interest Focus group discussions andor key informant interviews can be held when starting work on the MEB and after a result is obtained in order to ensure that the MEB is a true reflection of needs and priorities
45 Note that the 2100 kcal Sphere Standard for daily diet is an estimate based on a population average Nutrient needs vary across the lifecycle It is also recommended that a food basket based on the 2100 kcal threshold should include a minimum of between four and five different food groups
46 Also see WFP 2020b
29
Minimum Expenditure Baskets Guidance Note | December 2020
COUNTRYEXAMPLE
TURKEY NON-FOODBASKET MEBCOMPOSITION VERSUSACTUAL CONSUMPTION
Box 18
In the original rights-based MEB constructed for the
Syrian refugee operation in Turkey 17 percent was
devoted to education expenditure The average
education expenditure share in the pre-assistance
expenditure data was under 2 percent with little
variation by household vulnerability status50 The
large expenditure share in the MEB reflects the
costs for transportation to schools in rural areas
where no buses are available and where the only
way for households to send children to school is to
hire private transport In order to provide for
childrenrsquos right to education the transport costs are
counted for in the MEB
Since the MEB was constructed to assure full access
to all rights the high education expenditure was
justified However a comparison of the theoretical
costs for basic needs as estimated by humanitarian
partners and the actual consumption choices of
households can reveal divergence Even if
households are assisted there is nothing to say that
they will actually start hiring private transport to get
their children to school ie the principal ldquoneedrdquo
identified by humanitarian actors will not necessary
translate into effective demand if the MEB is used as
a basis for transfer value calculations While an
important access problem has been identified other
complementary interventions will likely be needed
to address it
depending on the objective of a particular intervention and
the choices targeted households are likely to make regarding
food and nutrition once they receive a transfer Targeted
nutrition interventions may be needed such as providing
certain nutritious foods for specific groups (through in-kind
assistance or commodity vouchers) and social behavioural
change communication to nudge people towards making
better choices for health and nutrition47 Expenditure data can
be helpful to understand the consumption patterns of people
at different points of the wealth distribution Fill the Nutrient
Gap analysis also examines packages of blanket and targeted
household interventions to estimate the most cost-effective
way to address the nutrient requirements of different target
groups For further considerations including complementary
programming please consult the WFP interim guidance on
transfer values48
MEBs are often constructed in an interagency context such
as the Cash Working Group which helps facilitate dialogue
and validation from the beginning of the process However
sometimes not all clusters or key partners are engaged in such
forums which can limit the buy-in and understanding of the
MEB unless there is adequate consultation It is also essential
to consult government stakeholders and development
partners Endorsement by government counterparts could be
needed if there are existing government safety nets or policies
regarding minimum wages For example if the population of
interest for the MEB are refugees or IDPs and a transfer value
based on the MEB is higher than the social assistance provided
by the Government to the resident population this could be a
point of contention Development partners might also wonder
why a MEB is needed in addition to the national poverty line
Dialogue and validation of the final MEB with partners is
therefore vital49
47 The Fill the Nutrient Gap (FNG) analysis of which CotD is often part can help understand what programming might be needed and how interventions can be combined to improve dietary intake and reach food and nutrition objectives
48 WFP 2020c49 The Cash Learning Partnershiprsquos MEB Tip Sheet contains useful advice on the interagency processes around constructing a MEB Baizan and Klein 201950 Hobbs 2016 and WFP 2018
30
Minimum Expenditure Baskets Guidance Note | December 2020
Naturally the needs of a household increase with the size of
the household How can the different magnitude of needs
for households of different sizes be taken into account when
constructing the MEB
One simple approach is to calculate the per capita MEB
and simply scale it up for households of different sizes For
example if the MEB is constructed for a household of six and
equals USD 120 the per capita MEB would be USD 20 USD and
the MEB for a household of three people would be USD 60
However this proportional scaling ignores one important
factor while the needs of a household grow with each
additional member the increase may not be proportional
This is because some goods consumed within a household
such as food are ldquoprivateldquo in character ndash once a person has
consumed it no one else can consume the same ndash while other
goods such as housing are ldquocommonrdquo or ldquopublicrdquo meaning they
can be shared among household members Hence the needs
for housing space or electricity are not necessarily three times
higher for a household with three members than for a single-
person household This is called economies of scale Changes
in household composition can also influence how needs
grow with household size consider large households with
many children who do not have the same needs as adults
Economies of scale are particularly relevant in contexts where
shared goods constitute a major part of household essential
needs for example where rent payment is a large expense A
one-bedroom apartment may be necessary for a one-person
household but could also possibly house a family of three
who would then share the expenditure When in a context of
large economies of scale the MEB is adjusted to household
size by scaling up average per capita needs proportionally
to household size the resulting MEB will underestimate
the needs for small households and overestimate the
needs for large households by construction This is because
the per capita needs for small households are larger than
this simple scaling reflects This can have implications if the
per capita MEB is used to inform targeting or transfer value
calculations For instance if the needs of smaller households
are underestimated they are more likely to be miscategorized
as being able to meet their essential needs and might therefore
not receive the assistance they require
7 Accounting for household composition and economies of scale
Expenditures
Household sizeno economies of scale expenditures proportional to household sizeeconomies of scale expenditures non-proportional to household size
1 2 3 4 5 6 7 8 9 10
EXPENDITURES PER CAPITA
Figure 3 Economies of scale and expenditures per capita ndash illustration of the concept
31
Minimum Expenditure Baskets Guidance Note | December 2020
In other contexts economies of scale might be smaller
because of the higher relative importance of ldquoprivaterdquo goods
such as food and certain non-food items (for example soap)
or if shared costs such as shelter are not prominent How
household size is catered for in the MEB ultimately depends
on context and how needs are related to household size
Some suggested steps to account for economies of scale and
household composition are listed below
When examining how to account for different household
sizes in the MEB start by ascertaining whether economies
of scale exist and to which extent51 Figure 3 provides a
hypothetical illustration of two extreme cases no economies
of scale at all and strong economies of scale If there are no or
little economies of scale the per capita expenditures will be
very similar across household sizes while they will decrease
by household size if economies of scale are present52
Plotting per capita expenditures against household size
helps enable for this type of examinations It can be useful
to further disaggregate the analysis into different categories
(for instance food non-food or shelter expenditures per
capita) to understand which expenditures might be driving the
economies of scale if present
Box 19 illustrates two different country examples
expenditures by household size for Syrian refugees in
Lebanon and for vulnerable populations in Coxrsquos Bazar
Bangladesh In Lebanon where shelter plays an important
role household expenditures double only at a household size
of 5 and they triple at a household size of 11
COUNTRYEXAMPLE
ECONOMIES OF SCALE INLEBANON AND COXrsquoS BAZAR
Box 19
Figure a shows expenditures by household size compared to one-person households For Syrian refugees in Lebanon
average expenditure doubles only when the household size reaches five and it takes 11 members to triple the expenditures
of a one-person household The economies of scale are therefore large primarily due to the importance of shelter costs for
the refugees
In Coxrsquos Bazar in contrast total expenditures grow almost proportionally with household size (double at a two-person
household triple at a three-person household) Slight economies of scale can be seen for food For non-food expenditures
larger households even spent more per person From this data the economies of scale seem to be small
Figure a Increase in household expenditure by household size comparedto one-person households
Multiplicationfactor
Household sizeHousehold size
100
90
80
70
60
50
40
30
20
10
Coxrsquos Bazar (Bangladesh)Lebanon
1 2 3 4 5 6 7 8 9 10 11
Total Food Non-food
1 2 3 4 5 6 7 8 9 10 11
Note Figure based on authorsrsquo calculations Data from the Vulnerability Assessment of Syrian Refugees in Lebanon (VaSyr) 2017
and the Refugee influx Emergency Vulnerability Assessment (REVA II) 2019
51 Expenditure data is required to perform this analysis If no information on expenditure exists information on how needs change with household size can be collected through qualitative means such as focus group discussions or key informant interviews
52 Theoretically it is possible to also analyse expenditures by household composition but sample sizes rarely allow for such detailed disaggregation
32
Minimum Expenditure Baskets Guidance Note | December 2020
If the analysis reveals small economies of scale or none at all it is reasonable to use a per capita approach to scale up the MEB proportional to household size
Even for food strong economies of scale can be detected
which could be a result of large households being able to
buy food in bulk at a lower price However in Coxrsquos Bazar
where shelter and other shareable non-food goods are of less
importance household expenditures are close to proportional
to household size
If the analysis reveals small economies of scale or none at all
it is reasonable to use a per capita approach to scale up the
MEB proportional to household size If significant economies
of scale are present it is important to think about how to
take this into account when constructing the MEB Here are
some suggestions
One possible solution (in the expenditure-based
approach) is to disaggregate (or re-select see below)
the reference cohort for each household size sub-
sample and using the expenditures for each of these
cohorts construct specific MEBs for each household
size53 This approach takes into account economies of
scale by looking directly at the specific needs of different
size households but only reflects average differences
in household composition within each household size
The approach will most likely suffer from very small
sample sizes once analysis needs to be performed by
household size If this is the case household sizes could
be grouped into categories so that the analysis uses sub-
samples eg for household sizes 1ndash2 3ndash5 and 6ndash8 etc
or other groupings meaningful for the context When
following this approach bear in mind that if the reference
cohort is selected based on expenditure distribution
characteristics such as the removal of extreme deciles or
quintiles this procedure of removal of quintiles or deciles
needs to be repeated within each household size (or
household size group) Otherwise if there are economies
of scale for consumption there is a risk of skewing the
sample against the smallest and largest households
because their per-capita expenditures will be at the
extreme ends of the expenditure distribution
Another solution is to divide the MEB content into
ldquoprivaterdquo (non-shared) and ldquopublicrdquo (shared) consumption
For example food could be non-shared and rent and
fuel shared Examine the MEB expenditures for the
non-shared and shared goods for an average sized
household (or for household sizes around the average
for instance 4ndash6 members in order to leverage a larger
share of the sample) The non-shared value can then be
scaled proportionally to household size while the shared
value is held constant across household sizes This way
the resulting MEB consists of a lsquoflatrsquo and a proportional
element54 This is a relatively crude but intuitive way to
approximate economies of scale Figure 4 provides a
simple illustration of this approach
In the literature on poverty the most common solution
used to adjust for economies of scale and difference
in household composition is to use adult equivalents
instead of per capita numbers These equivalence scales
assign an ldquoadult equivalent numberrdquo to each household
depending on its size and composition taking into
account economies of scale as well as the different needs
of children and adults ie household composition For
example the first adult in the household is counted
as 1 and each additional adult as for example 07 A
child under 15 is counted as a fraction of an adult (eg
05) The effective adult equivalent household size is
then the sum of these adult-equivalent fractions55 Next
total household expenditures are divided by the adult
equivalent household size The MEB is then calculated
using these adjusted per-adult-equivalent expenditures
While this is not necessarily a complicated approach
from an analytical point of view equivalence scales can
53 See Lanjouw (1998) on the construction of poverty lines specific to household size (and composition)53 Alternatively the flat element can also be lsquosemi-flatrsquo and set according to household size groups ndashby examining shared costs and applying the same flat value within eg household size groups 1-2 3-5 6-8 or other
groupings as dictated by the context 53 One common equivalence scale is the OECD scale it assigns the weight 1 to the household head 07 to all additional adults and 05 to all children A household with five people say two adults and three children
consists of 32 adult equivalents (1+07+05+05+05) This is a common scale used in many developing and developed countries Another common scale is to give weight 1 to each adult and different weights to children depending on their age For the official poverty line in Zambia the following weights are given to children 0ndash3 years 036 4ndash6 years 062 7ndash9 years 076 and 10ndash12 years 078
33
Minimum Expenditure Baskets Guidance Note | December 2020
MEB - COMBINING FLAT ANDPROPORTIONAL ELEMENTS -ILLUSTRATION
MEB value
Household size
1 2 3 4 5 6 7 8 9
140
120
100
80
60
40
20
0
Proportional element - non-shared part of MEB
Flat element - shared part of MEB
MEB value per capita
Figure 4 Combining flat and proportional elements in the MEB
prove challenging when operationalising the MEB If
equivalence scales are used in constructing the MEB they
will also need to be applied when measuring household
expenditures compared with the MEB for gap analysis
against the MEB and in monitoring Translating the
concept of equivalence scaling into operational decision
making may therefore prove tricky Additionally results
can be quite sensitive to the choice of equivalence scales
so selecting appropriate scales is important yet often not
straightforward and a range of different scales exist56 In
some countries country-specific equivalence scales may
have been devised for the purpose of the calculation of
the national poverty line
No matter the approach the recommendation is always
to leverage data analysis as much as possible in order
to understand how needs evolve with household size
(and possibly composition) while keeping in mind that
the final MEB needs to be operationally relevant
Particularly in the (common) cases where MEBs are
used to calculate household transfer values it is worth
considering what level of analytical granularity can
feasibly be turned into programmatic action In some
cases it may not be operationally possible to handle
different per-capita size transfers for differently sized
households and the extra effort of achieving accurate
MEB figures by household size may not be worth it
The same general recommendation as for all aspects
of MEB construction also applies here the final result
should be realistic a fair depiction of needs and an
operationally relevant product
56 See for instance httpwwwoecdorgeconomygrowthOECD-Note-EquivalenceScalespdf
34
Minimum Expenditure Baskets Guidance Note | December 2020
A SMEB can be expenditure-based or rights-based or a hybrid of the two approaches depending on data availability and programmatic requirements
The SMEB is the absolute minimum amount required to maintain existence and cover lifesaving needs which could involve the deprivation of certain human rights
A survival minimum expenditure basket (SMEB) is often
constructed alongside a MEB While the MEB is defined as
what a household requires in order to meet their essential
needs on a regular or seasonal basis and its average cost the
SMEB is the absolute minimum amount required to maintain
existence and cover lifesaving needs which could involve the
deprivation of certain human rights However the concepts
of SMEB and MEB have not always been used consistently
by the humanitarian community and are sometimes used
interchangeably It is therefore important to be clear from the
outset of the analysis whether a MEB or a SMEB is the goal
A SMEB can serve at least two purposes First together with
the MEB it can be used to classify households into different
categories of economic capacity to meet their needs whereby
households whose expenditures fall below the SMEB have
highly insufficient economic capacity households between the
SMEB and the MEB have insufficient economic capacity and
households above the MEB have sufficient economic capacity
This information can then be used for profiling people in need
prioritizing beneficiaries or monitoring Second the SMEB
can inform programmatic decisions such as transfer values in
situations where immediate lifesaving assistance is required
The approaches presented here follow the MEB methods
adjusted to suit the different purpose of the SMEB
Accordingly a SMEB can be expenditure-based or rights-
based or a hybrid of the two approaches depending on data
availability and programmatic requirements
8 How to construct a SMEBExpenditure-based approach toconstructing a SMEBThe calculation of an expenditure-based SMEB is closely aligned
with the literature on how to estimate national poverty lines
While the MEB corresponds to an ldquoupperrdquo poverty line a ldquolowerrdquo
extreme or austere poverty line is often defined by taking the
food part of a MEB and adding this to the non-food needs
regarded as the essential minimum for household survival57
But how are survival non-food needs defined based on
expenditure data When people receive assistance it is
sometimes observed that households sell part of their food
rations to cover some non-food items These households forgo
some of the required food intake in order to cover what they
regard as survival non-food needs Using expenditure data to
construct a SMEB a similar idea is explored to calculate the
SMEB analysts identify those households whose total food AND
non-food expenditures are approximately equal to the MEB food
basket amount only In order to access non-food items these
households will compromise their food intake to some extent
because their total expenditures would only be enough to cover
their essential food requirements ie the food MEB anything
spent on non-food items means that they are not meeting their
essential food requirements It is therefore fair to assume that
the amount they choose to spend on non-food items must
be regarded by the households as absolutely necessary The
non-food expenditures of these households can therefore be
considered as the survival non-food needs The SMEB is then
calculated by adding these survival non-food expenditures
to the food MEB This SMEB allows households to meet their
essential food needs and their survival non-food consumption
Note that this approach requires a food MEB figure (either
already available or calculated as part of the SMEB analysis)
57 See Lanjouw 1998 and Haughton and Khandker 2009
35
Minimum Expenditure Baskets Guidance Note | December 2020
The steps for constructing an expenditure-based SMEB are
similar to those taken to construct a MEB with the following
additional considerations
1 Prepare expenditure data the expenditure data source can
be the same as that used for the MEB
2 Select the reference cohort this step is different The cohort
is selected by computing total household expenditures
and comparing them to the food MEB Households with
total expenditures equal to (or in an interval around) the
food MEB are selected as the SMEB reference cohort
3 Establish food basket and 4) Establish non-food basket
Using the SMEB reference cohort start by examining
how much these households spend on non-food items
Add this value to the MEB food value to arrive at the total
value of the SMEB To establish a food and non-food
basket there are two options i) use the MEB food basket
as the SMEB food basket and the non-food expenditures
of the SMEB reference cohort as the non-food basket
or ii) look at a third cohort of households namely those
whose total expenditures are around the just established
total SMEB level examine their food and non-food
expenditures and unpack those into food and non-food
baskets While both options will provide the same overall
value of the SMEB they will differ in composition and the
share of foodnon-food expenditures
Annex 2 provides an illustration of this method of constructing
a SMEB
Rights-based approach to constructing a SMEBThe rights-based approach to constructing a SMEB closely
follows the rights-based approach to constructing a MEB The
main difference is that needs and the items and quantities
included should be restricted to what is regarded as absolutely
necessary for survival ndash which can be challenging to define
This applies to both the food basket and the non-food
basket The MEB can be a starting point if there is one or
the Sphere Standards Sometimes rights-based SMEBs have
been constructed based on a MEB but with lower quantities
for certain items or by keeping some needs while removing
others
Hybrid SMEBs and reality checking resultsAs with MEBs it can be advantageous to combine the
expenditure-based and rights-based approaches to create
a hybrid SMEB The guiding principles are the same as for
the MEB with the difference that the resulting SMEB should
continue to contain nothing but the minimum required for
survival
The same logic applies to the ldquoreality checkrdquo of the SMEB
results as for the MEB it is crucial to ensure that the end
result is realistic and operationally relevant bearing in mind
the conceptual difference between the MEB and the SMEB It
is important to consult the population of interest as much as
possible to understand their views on what constitutes the
bare minimum needed by households to maintain existence
and cover lifesaving needs
COUNTRYEXAMPLE
RIGHTS-BASED SMEBS Box 20
In Lebanon health and education are excluded
from the rights-based SMEB while other needs are
covered with smaller amounts than in the MEB For
example the SMEB has a less diverse food basket
than the MEB58
In Syria the SMEB developed for the northern part
of the country includes food kerosene hygiene
products water and a small amount to cover other
survival goods Rent and utilities are not covered59
58 El Koury and Hajal 201659 Cash Based Responses Technical Working Group Syria 2014
36
Minimum Expenditure Baskets Guidance Note | December 2020
COUNTRYEXAMPLE
HYBRID SMEBs Box 21
For the MEB review in Lebanon for Syrian refugees60 a hybrid SMEB approach was chosen First an expenditure-based
SMEB was used calculating the non-food expenditures of households whose total expenditures equalled the food MEB
and adding this to the food MEB This resulted in very low expenditures on shelter (SMEB A) Due to the importance of
shelter in urban settings a second hybrid version was established calculating the non-food expenditures of households
whose total expenditures equalled the sum of the food MEB plus a rights-based value of a tent as survival shelter the cost
of which came from a rights-based SMEB (SMEB B)
Cohort HH size 4ndash6quint 2ndash4 acceptable FCS
n=923
Cohort total expenditure= food MEB
n=923210
Cohort total expenditure= food MEB + tent value
n=923210
SMEB Afood + survivalnon-food
Hybrid SMEB
437
83
40
93
20
16
29
19
314
1033
437
43
18
37
06
04
17
60
621
437
47
24
42
11
06
20
162
750
Food
Utilities (water gas fuel electricity)
Non-food items (hygiene clothing)
Health
Education
Transport
Communication
Other expenditures
Shelter
Total (USD)
Table a Hybrid SMEB for Syrian refugees
SMEB Bfood + survivalnon-food amp tent
In the Kinshasa urban assessment61 a SMEB was established in addition to the MEB comprising a basket of the most
essential items based on expenditure data used for the MEB For the food SMEB a less diverse diet was established by
excluding certain food items from the food MEB and rescaling the resulting basket to 2100 kcal For the non-food
component the only items included were those that were seen as critical to attaining the most basic standards for safety
food preparation water sanitation and hygiene These consisted of water cooking fuel hygiene products and lighting The
value for these items in the SMEB was derived from the median expenditures of the non-poor cohort
Expenditure-basedMEB
Expenditure-basedSMEB
60 Hohfeld et al 2020 61 WFP et al 2018
37
Minimum Expenditure Baskets Guidance Note | December 2020
91 Adjustment for seasonal or regional price differencesIf the MEB will only be used in one area where prices are
relatively homogenous it is often not necessary to adjust for
regional price differences However if the MEB is intended
for use across different urbanperi-urban andor rural
areas throughout the country it could be vital to adjust for
differences This means that the MEB can be priced differently
for different regions or rural or urbanperi-urban areas (or any
other division of areas that makes sense in relation to price
behaviour) There are a few approaches for this
Price the MEB based on available price data for different
regions or urbanrural areas For the food reference
basket this is most often possible using WFP food prices
or other similar price time series For non-food items
including housing utilities and services this can be more
challenging and may rely on price data collection by
different partners or require new data collection
For some countries price data provided by the national
statistical office is useful In the case of Turkey regional
purchasing power parity indices were used to provide
price estimates for components of the MEB for which
direct price information was not available
Use approximations from expenditure data If the
household survey has sufficient regional coverage the
expenditure levels in different regions can be explored
using the cohort of households just above the poverty
line Care should be taken in using this method
particularly if the sample size by region is very small
9 Additional considerations when constructing MEBs
92 Needs that vary by season or areaIn many countries where WFP works household needs change
with the seasons For instance in Turkey where winters are
cold households have additional needs for heating and warm
clothes to survive In other contexts there are significant
differences in needs between lean and rainy seasons These
changing needs could be a reason to construct different MEB
reference baskets to use at different times during the year or
to design seasonal top-ups In the case of items needed for cold
winters this is often referred to as ldquowinterizationrdquo
While this does not influence the approach used to construct
the MEB it does mean that analysts need to consider when
the data used in its construction was collected and whether
this influences the resulting MEB These considerations also
matter when using the MEB for monitoring if a monitoring
expenditure survey is used to analyse whether peoplersquos
expenditures are above or below the MEB threshold but
the survey is undertaken when prices are high or when
winters are cold if the MEB is not adjusted the results will
probably show a decrease in the percentage of people whose
expenditures are below the MEB as households have higher
needs andor are confronted with higher prices and thus
have higher expenditures without in reality being better off
In Turkey it was estimated that household needs during the
winter would result in a 48 percent increase in minimum
expenditures
In other cases different baskets might be necessary
for different areas of the country eg rural and urban
areas While the MEB should be constructed for a relatively
homogenous population it may sometimes be desirable to
construct a MEB covering all or most of a country where
consumption patterns vary substantially In this case it is
worth considering whether (some elements of) the MEB should
be different between areas Again the selected approach to
construct the MEB should not change but analysts need to
check where the data used in its construction was collected
and whether consumption patterns are very different between
different regionsareas For example in the case of Somalia
the main cereal consumed varies significantly between the
north and the south of the country so the MEB uses different
main cereals in the food reference basket according to region
While the MEB should be constructed for a relatively homogenous population it may sometimes be desirable to construct a MEB covering all or most of a country where consumption patterns vary substantially
38
Minimum Expenditure Baskets Guidance Note | December 2020
Constructing a MEB can be challenging in a sudden onset
emergency or if data is scarce or unavailable Below are some
ideas on how this can be resolved However from a ldquodo no
harmrdquo perspective it is important to emphasize that proxies
should only be used in the interim when no other solutions are
available
Use the national MEB or MEB reference basket If survey
data is not directly available and if the population of
interest is part of and similar to the overall population of
the country the national MEB or MEB reference basket
used for the national poverty line can be used if available
Bear in mind however that this basket should be used on
the condition that it corresponds to data that WFP collects
or has access to through partners or the Government to
ensure that monitoring can be conducted against the MEB
In its most basic form a MEB essentially only requires an
approximate value for the food basket and an estimate
of the average expenditure share that households use
on food Even if no relevant survey data is available this
information should be available to a country office or can
rapidly be collected or approximated
Consider using the minimum wage as a proxy Bear in
mind that while the MEB captures household-level needs
the minimum wage is individual-level income so an
assessment of how many minimum wages are needed per
household depending on the household size is required
It is also advisable to find out how the minimum wage has
been constructed
Ultimately a MEB is a good preparedness measure and should
be constructed before an emergency While both prices and
availability will be affected by an emergency it is still likely to
provide a useful starting point
11 Monitoring and updating the MEB111 Monitoring the cost of the MEBTo be operationally useful the MEB must be tracked and
updated over time to account for price changes If inflation is
high this might have to be done every month if it is low as
little as once a year could be sufficient This should be planned
for when the MEB is constructed to ensure that the costs of the
MEB components can be updated
There are different ways to update the MEB with price changes
If a reference basket is adequately defined (for food
and for non-food items) and prices are collected for the
individual items in the basket by WFP or its partners the
MEB can be priced anew using the updated prices for
each item and multiplying them by the quantities in the
reference basket
A simple solution is to adjust the MEB using the
nationalsub-national CPI or its components This
simply involves updating the cost of the MEB with
the increase (or decrease) in the CPI for the period
in question However in some contexts CPIs are not
updated or relevant for the target population Urban
areas are often over-represented in the national CPI on
the other hand prices and costs faced by for example
displaced populations can be very different from national
price levels In contexts of poverty where food constitutes
a large part of household expenditures the evolution of
food and fuel prices is central when it comes to capturing
price changes
If a CPI does not exist or is not considered applicable
a price index for key consumption items can be
constructed using price data collection for food items
and basic non-food items conducted by WFP andor
other agencies this can then be used to update the cost
of the MEB In contexts where shelter is a major part of
household expenditures changes in shelter costs should
also be captured
10 How to find a proxy for a MEB when data or time is insufficient
39
Minimum Expenditure Baskets Guidance Note | December 2020
112 When to construct a new MEBThe composition of MEB reflects consumption patterns
It is recommended as much as possible keeping the MEB
composition constant and only monitor how cost changes
over time However when there is reason to believe that
consumption patterns of the population for whom the MEB
is constructed has significantly changed it is time to review
its composition and possibly reconstruct the MEB to reflect
these changes
What could suggest such consumption changes have
occurred The figure to the right summarises some typical
events that could result in a significant change in household
consumption Shocks eg a natural disaster might create
additional needs if livelihoods are disrupted or living
conditions are altered Significant changes to the prices of
key consumption items can also alter consumption pattens
insofar it pushes households to substitute certain items
for other items (be aware however that reconstructing
the MEB would only be advisable if the substitution is not
just temporary) Population changes such as an influx of
displaced people or other events that changes the population Figure 5 Possible triggers for MEB composition review
Has a shock occured creating
different or additional needs
Have costs changed significantly
between key consumption items so
that households have substituted
consumption patterns
Has there been a change in
population - eg a displacement
Has the supply side or service
provision changed leading to a
change in household consumption
Shock
Substitution
Population
Supply
composition in the area that the MEB is constructed for
could also lead to a review Finally if supply of essential
goods and services changes this may also shift household
consumption eg if health services are made free of charge
and no longer require households to pay for them
40
Minimum Expenditure Baskets Guidance Note | December 2020
CaLP The Cash Learning Partnership
CBT cash-based transfers
CotD Cost of the Diet [approach]
CPI consumer price index
FCN-N food consumption score ndash nutrition
FCS food consumption score
FNG Fill the Nutrient Gap
HEA household economy approach
LSMS Living standard measurement survey
MEB minimum expenditure basket
OCHA United Nations Office for the Coordination of Humanitarian Affairs
REVA II 2019 Refugee Influx Emergency Vulnerability Analysis
SDG Sustainable Development Goal
SMEB survival minimum expenditure basket
UNHCR Office of the United Nations High Commissioner for Refugees
VAM Vulnerability Analysis and Mapping
WFP World Food Programme
WHO World Health Organization
Abbreviations
41
Minimum Expenditure Baskets Guidance Note | December 2020
Deaton and Grosh 2000 ldquoConsumptionrdquo in Designing Household Survey Questionnaires for Developing Countries Lessons from Ten
Year of LSMS Experience httpsscholarprincetonedudeatonpublicationsconsumption
Deaton and Zaidi 2002 Guidelines for Constructing Consumption Aggregates for Welfare Analysis LSMS Working Paper no 135
httpsopenknowledgeworldbankorghandle1098614101
The Cash Learning Partnership (CaLP) Glossary of terminology for cash and voucher assistance
httpswwwcalpnetworkorglearning-toolsglossary-of-terms
Cash Based Responses Technical Working Group Syria 2014 Northern Syria Survival Minimum Expenditure Basket Guidance
Document httpswwwhumanitarianresponseinfositeswwwhumanitarianresponseinfofilesdocumentsfilesnorthern_
syria_smeb_guidance_document_dec_2014pdf
Cash Working Group Nigeria 2018 Minimum Expenditure Basket for North East Nigeria ndash Justification and recommendations Draft
report httpswwwhumanitarianresponseinfositeswwwhumanitarianresponseinfofilesdocumentsfilesmeb_justification_
guidelinespdf
Baizan and Klein 2019 Minimum Expenditure Basket (MEB) Decision Making Tools The Cash Learning Partnership httpswww
calpnetworkorgpublicationminimum-expenditure-basket-meb-decision-making-tools-2
El Koury and Hajal 2016 MEB and SMEB revision Community Consultation Lebanon Cash Consortium httpsreliefwebintsites
reliefwebintfilesresourcessmeb-fgd-report-final-1pdf
Geniez Mathiassen de Pee Grede and Rose 2014 ldquoIntegrating food poverty and minimum cost diet methods into a single
framework A case study using a Nepalese household expenditure surveyrdquo in Food and Nutrition Bulletin vol 35 no 2 https
journalssagepubcomdoi101177156482651403500201
Haughton and Khandker 2009 Handbook on Inequality and Poverty The World Bank httpsopenknowledgeworldbankorg
handle1098611985
Hobbs 2016 MEBSMEB calculation for Syrians living in Turkey Report commissioned by the Cash-Based Interventions Technical
Working Group in Turkey httpsdata2unhcrorgendocumentsdownload57031
Hohfeld Papavero Sandstrom Dalbai and Renk 2020 Minimum Expenditure Basket for Syrian Refugees in Lebanon ndash Rights-based
versus Expenditure Based Approaches WFP httpsreliefwebintsitesreliefwebintfilesresources76229pdf
Inter-Agency Network for Education in Emergencies (INEE) Minimum Standards for Education Handbook Preparedness Response
Recovery httpsineeorgstandards
Jolliff and Prydz 2016 Estimating International Poverty Lines from Comparable National Thresholds World Bank Policy Research
Paper 7606 httpsopenknowledgeworldbankorgbitstreamhandle1098624148Estimating0int00national0thresholdspdf
Lanjouw 1998 Demystifying Poverty Lines World Bank
Ravallion 1994 ldquoPoverty Comparisonsrdquo in Fundamentals of Pure and Applied Economics 56
Republic of Zambia Central Statistical Office 2016 2015 Living Conditions Monitoring Survey (LCMS) Report httpswwwzamstats
govzmphocadownloadLiving_Conditions201520Living20Conditions20Monitoring20Survey20Reportpdf
Save the Children UK 2018 Basic Needs Assessment Guidance and Toolbox Part I Background and Concepts httpsreliefwebint
reportworldbasic-needs-assessment-guidance-and-toolbox
Sphere Standards Handbook Humanitarian Charter and Minimum Standards in Humanitarian Response 2018 edition httpswww
spherestandardsorghandbook
UNHCR CaLP Danish Refugee Council OCHA Oxfam Save the Children and WFP 2015 Operational Guidance and Toolkit for
Multipurpose Cash Grants httpswwwcalpnetworkorgwp-contentuploads202001operational-guidance-and-toolkit-for-
multipurpose-cash-grants-webpdf
References
42
Minimum Expenditure Baskets Guidance Note | December 2020
WFP 2004 Sampling Guidelines for Vulnerability Analysis Thematic guidance httpsdocumentswfporgstellentgroupspublic
documentsmanual_guide_procedwfp197270pdf
WFP 2008 Food Consumption Analysis Calculation and use of the Food Consumption Score in food security analysis https
documentswfporgstellentgroupspublicdocumentsmanual_guide_procedwfp197216pdf
WFP 2015 Food Consumption Score Nutritional Analysis (FCS-N) Guidelines httpswwwwfporgpublicationsfood-consumption-
score-nutritional-quality-analysis-fcs-n-technical-guidance-note
WFP 2018 Revising the Food Basket and Minimum Expenditure Basket Analysis to calculate a realistic cost of living for refugees in
Turkey httpsreliefwebintreportturkeyrevising-food-basket-minimum-expenditure-basket-analysis-calculate-realistic-cost
WFP 2019 Refugee influx Emergency Vulnerability Assessment ndash Coxrsquos Bazar Bangladesh httpsreliefwebintsitesreliefwebintfiles
resourcesWFP-0000106095pdf
WFP 2020a Essential Needs Assessment Guidance note httpswwwwfporgpublicationsessential-needs-guidelines-july-2018
WFP 2020b Technical Note Fill the Nutrient Gap and Minimum Expenditure Basket An explanation of approaches and identification of
synergies httpsdocswfporgapidocumentsWFP-0000116644download
WFP 2020c Setting the transfer value for CBT interventions Transfer Value Interim Guidance httpsdocswfporgapi
documentsWFP-0000117963download
WFP global Food Security Cluster and Food Security Cluster for the Democratic Republic of the Congo 2018 Adapting to an Urban
World Urban Essential Needs Assessment in the five communes of Kimbanseke Kinsenso Makala Nrsquosele and Selambao (Kinshasa)
httpswwwwfporgpublicationsdemocratic-republic-congo-urban-essential-needs-assessment-five-communes-kimbanseke-
kinsenso
World Health Organisation and Global Health Cluster ndash Cash Task Team 2020 Technical Note on the Inclusion of Health
Expenditures in the Minimum Expenditure Basket and Subsequent Multi-purpose Cash Transfer httpswwwcalpnetworkorg
publicationinclusion-of-health-expenditures-in-the-meb
43
Minimum Expenditure Baskets Guidance Note | December 2020
Survivalnon-foodexpenditure
TOTALEXPENDITURE
FOODEXPENDITURE
MEBnon-foodexpenditure
EXPE
ND
ITU
RE
CONSUMPTION
SMEBAusterepoverty line
Essential foodneeds (MEB)
Acceptable food consumption(based on FCS)
Food expenditure for HHwith tot exp at essential
food needs (MEB)
Analysts should always ensure that the expenditure data is properly cleaned and outliers removed and that it is converted into
the same recall period (food and non-food items usually have different recall periods)
Expenditures should be calculated into per capita figures (eg by dividing total household expenditures by household size) in
order to make them immediately comparable across households (or per adult equivalent see section 7 on how to account for
economies of scale and household composition)
Before starting the MEB analysis it is highly recommended to carry out some simple descriptive analysis of the expenditure
data in order to understand it Analyse the mean and median expenditures for the sample This will help understand the
distribution of the expenditures and detect possible issues While the median is more robust to outliers if a large part of the
sample has 0 expenditures on a particular item the median could be 0 and may therefore not be the best estimate of the need
In this case the mean may be preferable A frequency analysis of non-zero expenditures by groupitem can also be helpful in
understanding whether certain expenditures are infrequent or lumpy
Annex 1 - Good practice when analysing expenditure data
Figure based on Lanjouw 1998 Demystifying poverty lines and World Bank and Ravallion 1994 ldquoPoverty comparisonsrdquo in
Fundamentals of Pure and Applied Economics 56
Annex 2 - The expenditure-based SMEB ndash an illustration
2
Minimum Expenditure Baskets Guidance Note | December 2020
outcomes for affected populations Another key international
agreement the Grand Bargain committed its signatories to
working together in a more efficient and harmonious manner
in order to better assist the growing number of vulnerable
people affected by crises around the world
Against this backdrop and based on best practices by WFP and
partners an integrated analytical package has been prepared
to provide guidance on how to analyse essential needs This
package builds on existing guidance and research together
with practical experience and lessons learned It is designed to
provide analytical results that can be used to inform strategic
and operational decision making and programme design
As analysing understanding and assisting people in
meeting their essential needs is by definition not a single-
agency undertaking the package developed by WFP is
intended as an analytical starting point for interagency
collaboration It offers data-driven approaches and
quantitative indicators but also allows for analytical flexibility
emphasizing the importance of collaboration qualitative
inquiry and contextual adaptation
Essential needs analysis is particularly relevant where WFP
and partners seek to support government strategies and
policies such as informing the design of social safety nets
as a toolbox to support the design of multi-stakeholder
joint assessments or joint harmonized or complementary
interventions Essential needs analysis has proven useful in
a variety of contexts from refugee camps to chronic food
insecurity settings It is often highly relevant when assessing
the situation of poor urban populations urban households
depend heavily on markets to meet their food and other
essential needs including housing high living costs and
unstable income sources make them vulnerable to shocks
forcing households to choose between meeting different
essential needs in times of hardship
What is essential needs analysisThe analytical packageThe WFP essential needs analysis package consists of three parts
The essential needs assessment is a household andor
community assessment that helps to understand if and how
people are meeting their essential needs as such it focuses
on the demand side of essential needs The assessment seeks
to identify and analyse essential needs and gaps estimate
the number of people in need and profile them by describing
their main characteristics It aims to answer the following
questions
What are the populationrsquos essential needs and how
do people meet them
Which essential needs are unmet and why
How many people are unable to meet their
essential needs
Who are the people that are unable to meet their
essential needs
Where are the people that are unable to meet their
essential needs
How can households be assisted to meet their
essential needs
The essential needs assessment promotes the use of
qualitative and quantitative analysis It proposes a suite
of essential needs indicators that capture various aspects
of essential needs and a householdrsquos ability to meet them
including measures of household economic capacity to meet
essential needs deprivations of different essential needs how
households cope when they struggle to meet their essential
needs and how they prioritize unmet needs
An integrated analytical package has been prepared to provide guidance on how to analyse essential needs This package builds on existing guidance and research together with practical experience and lessons learned
3
Minimum Expenditure Baskets Guidance Note | December 2020
The foundational understanding of essential needs gained
from the essential needs assessment can feed into the supply
analysis The results can help to focus a complex market
analysis on the most critical needs while household data
can be used to understand how households perceive the
supply and quality of essential services and their access to
them At the same time a thorough analysis of the supply
of essential goods and services enriches the understanding
of household demand and enables the analyst to identify
possible interventions Which needs can be met through
the market Is there effective demand and would supply
or demand-side interventions or a combination of these be
better suited to assisting the population of interest The MEB
connects supply and demand in the sense that it identifies
a monetary threshold for meeting essential needs through
the market It enables the essential needs assessment to
identify households with sufficient economic capacity it also
has strong complementarities with the supply analysis as it
helps reveal market consumption patterns In turn the supply
analysis is a valuable input for a MEB analysis as it highlights
which goods and services are adequately supplied
The analytical approach draws on different schools
of thought from the fields of humanitarian action
development and poverty analysis It combines ideas from
the cost-of-basic-needs approach for monetary poverty
lines which sees poverty as the deprivation of consumption
with more multidimensional poverty perspectives from
human development and capabilities approaches Through
this combination the essential needs analysis provides a
framework that is easy to operationalize while offering the
flexibility and detail necessary to adjust to different contexts
and to produce information relevant for programmatic
decision making
The minimum expenditure basket (MEB) looks at the needs
that are covered partially or fully through the market It sets
a monetary threshold which is defined as what households
require in order to meet their essential needs The starting
point for constructing a MEB is usually household expenditure
data This data is analysed and triangulated with sector-based
needs information to obtain a measure of the minimum
cost of essential needs based on the population of interestrsquos
actual demand pattern and consumption priorities The
expenditure data can be gathered as part of the essential
needs assessment data collection Once constructed the MEB
itself serves as a key input in the essential needs assessment
set of indicators as it is
used to assess which
households have the
economic capacity to
cover their needs through
the market
The supply analysis looks at the supply of essential goods
and services and examines whether the market andor public
provision can sustain the demand related to essential needs
It integrates quantitative methods for examining the basic
functioning of the marketplace with qualitative investigation
of supply and access
The three guidance tools are designed so that they can
be used independently or together A full essential needs
analysis would require undertaking an essential needs
assessment constructing a MEB and carrying out a supply
analysis this combination is recommended for the most
complete analysis as each piece complements the others
A full essential needs analysis would require undertaking an essential needs assessment constructing a minimum expenditure basket and carrying out a supply analysis
Essential needs analysis provides a framework that is easy to operationalize while offering the flexibility and detail necessary to adjust to different contexts
4
Minimum Expenditure Baskets Guidance Note | December 2020
Essential needs analysis package
Esse
ntia
l nee
ds
ESSENTIAL NEEDS ASSESSMENTDemand for essential needs
SUPPLY ANALYSISSupply of essential goods and services
MINIMUM EXPENDITURE BASKETExpenditures on essential needs
Decision making
Operationalization
Monitoring
While the three pieces of analysis should be carried out
together as much as possible there may be situations in
which only one piece is necessary for example when the
analysis is spread out over time or different collaborators
lead on different pieces Each guidance note is designed as a
standalone document enabling analysts to follow it without
reference to the others
A series of operationalization guidance notes and
documented best practices complement the analytical
package The series offers concrete guidance on how the
results of the essential needs analysis can be translated into
programme design and inform decision-making Essential
needs analysis identifies where households face critical
gaps in meeting their needs the cost of meeting those
needs in the market and whether the necessary essential
goods and services are available As such it forms the
basis for programme design for both demand and supply-
side interventions Results can for example be used to
inform the targeting and prioritization of beneficiaries the
selection of transfer modality the setting of transfer values
and other programme design features It is well suited for
monitoring needs over time and evaluating the effectiveness
of programmes This series will be continuously updated to
reflect new learning
While essential needs analysis can inform programme design
it does not have to imply an essential needs response
Essential needs analysis and the analytical package can be a
service offering particularly when supporting governments in
designing policies strategies and programmes at national and
local levels
Figure 1 Essential needs analysis
5
Minimum Expenditure Baskets Guidance Note | December 2020
This guidance note sets out the basic steps for constructing a
minimum expenditure basket (MEB) It is designed to provide
conceptual clarity and best practices built on experience from
the humanitarian and development fields The guidance is
designed to provide a series of options in order to facilitate
a context-specific application of the recommendations it
presents
The guidance note begins by introducing the concept of the
MEB and its different usages (sections 1 and 2) Sections 3 to
6 cover how to construct a MEB including important aspects
to consider before starting the analysis and the different MEB
approaches Section 7 examines how to deal with household
size and composition in MEB analysis while the concept of the
survival minimum expenditure basket (SMEB) is introduced
in section 8 Section 9 sets out additional considerations
such as regional or seasonal price adjustments and section
10 explains how to find MEB proxies when time or data is
insufficient In closing section 11 offers guidance on how to
update and monitor the MEB
A MEB is defined as what a household requires in order to
meet their essential needs on a regular or seasonal basis
and its cost3 Essential (or basic) needs are defined as ldquothe
essential goods and services required on a regular or seasonal
basis by households to ensure survival and minimum living
standards without resorting to negative coping mechanisms
or compromising their health dignity and essential livelihoods
assetsrdquo4 The MEB is a monetary threshold ndash the cost of these
goods utilities services and resources ndash and is conceptually
equivalent to a poverty line5 It typically describes the cost
of meeting one monthrsquos worth of essential needs Since the
MEB sets a monetary threshold for what is needed to cover
essential needs the households whose expenditures fall
below the MEB are defined as being unable to meet their
essential needs
i About this guidance note
3 This builds on the definition in UNHCR et al 2015 4 Definition of basic needs See CaLP glossary 5 Note that conceptually a MEB is equivalent to a poverty line in that it describes a monetary threshold for being able to cover essential needs This does not mean that the MEB is equivalent to the national poverty line6 Haughton and Khandker 2009
In poverty literature and research MEBs have long been
constructed primarily to set national poverty lines and
determine the percentage of households in the population
who are poor ie who cannot meet their essential needs
The ldquocost of basic needsrdquo approach which entails establishing
a MEB is fairly new in humanitarian contexts however it
has long been the most common way to construct national
poverty lines6 As a result there is often national experience to
draw on when setting out to construct a MEB
A MEB does not necessarily contain all the essential needs
of a household It only captures needs that the households
cover entirely or partly through the market It should not
be an attempt to monetize all the needs of a population
For example in contexts where electricity is considered an
essential need but not available for the population of interest
it should not be included in the MEB If shelter is provided free
of charge in a refugee camp or education is publicly provided for
free these needs and their costs are not captured in the MEB
Hence a need can be essential but not included in the MEB
A MEB does not necessarily contain all the essential needs
of a household It only captures needs that the households
cover entirely or partly through the market It should not
be an attempt to monetize all the needs of a population
For example in contexts where electricity is considered
an essential need but is not available for the population of
interest it should not be included in the MEB If shelter is
provided free of charge in a refugee camp or public education
is provided for free these needs and their costs are not
captured in the MEB A need can therefore be essential but
not included in the MEB
A MEB captures the cost of essential needs for average
households It does not typically capture ad-hoc or one-
off costs This can be challenging particularly in emergency
situations when needs are dynamic While this guidance
suggests keeping the MEB composition fixed as far as
possible in such situations it might be justified to create
an interim MEB (see section How to find a proxy for a MEB
when data or time is insufficient) and when the situation has
stabilized a final one A similar challenge is presented with
1 What is a minimum expenditure basket
6
Minimum Expenditure Baskets Guidance Note | December 2020
needs that are inherently irregular large and unpredictable
such as health needs This is also examined in the sections on
MEB construction
There are different approaches to establishing a MEB
As the World Bankrsquos Handbook for Poverty and Inequality
explains7 the typical starting point for establishing a MEB is
to estimate the cost of acquiring enough food to meet energy
requirements usually 2100 calories per person per day as
per the Sphere Standard Yet the cost of 2100 calories varies
with the diet of households which typically depends on their
economic status The cost of other essential non-food needs
is then added There are two approaches to establishing
which food and non-food items should be in the MEB an
expenditure-based approach that focuses on effective
demand and a rights-based approach based on assessed
needs While the expenditure-based approach is usually used
to construct national poverty lines the rights-based approach
is the principal method followed in the operational guidance
for multipurpose cash grants developed for humanitarian
purposes8 A combination of these approaches a hybrid
approach can also be used and is often recommended This
guidance describes each approach
The construction of a MEB is always somewhat arbitrary
However a MEB is constructed choices need to be made along
the way The objective of the MEB can influence how best to
approach its construction The choice of the group of people
whose effective demand will be examined ndash the ldquoaveragerdquo
households ndash is another important influencing factor This
guidance provides direction on how to make these choices but
analysts will always be required to exercise judgement
A MEB is not equivalent to a transfer value A transfer
value is understood as the monetary value transferred from
governments or organizations such as WFP to households
in order to support the latter in meeting their needs The
value of the MEB is not the same as the value that should
be transferred to households but the MEB can be a critical
component when determining transfer values Most
households can rely on their own resources to meet at least
some of their needs so the transfer value will usually be
less than the value of the MEB covering the gap between
householdsrsquo own resources other assistance received and
the MEB The distinction between the MEB and the transfer
value is also important because the MEB remains the same
regardless of assistance and funding constraints while the
transfer value could be impacted by these factors9
When using the MEB to monitor impacts of an
intervention or programme the MEB should not be
changed over time The threshold should only be adjusted
for price changes or when any major changes in context and
households needs occur that would require the construction
of a new MEB
2 Why have a MEBThe MEB has a range of applications In humanitarian
and development programming the MEB can support
household profiling by identifying characteristics of those
who cannot meet their essential needs10 and support
decisions on transfer value amounts for food and non-
food needs For partnerships the MEB can support multi-
sector coordination and programming with government
partner organisations and donors In market and supply
analysis the MEB can help inform which goods and services
to include in a Supply Analysis by showing which essential
needs households cover through the market Finally in
monitoring the MEB can assist monitoring of immediate
and longer-term outcomes through analysis of expenditure
trends against the MEB and help establish a basket against
which to monitor market prices and the cost of living
7 Ibid8 UNHCR et al 20159 For further discussion on considerations when setting a transfer value see WFP 2020c 10 For one possible application see WFP 2020a
A hybrid approach to constructing the MEB combines the expenditure-based approach and the rights-based approach and is often recommended
7
Minimum Expenditure Baskets Guidance Note | December 2020
THE MEB TO-DO LIST DEPENDING ON CONTEXTALSO CONSIDER
Identify key partners and stakeholders and decide on objectives and process
Construct the food basket
Construct the non-food basket
Reality check results and validate with stakeholders
Determine the analytical starting point (eg examine national poverty lines set the population of interest check what data is available) and decide on approach
Accounting for household size and composition
Adapting the MEB to different needs across regions or seasons
Adjusting the MEB for regional or urbanrural price differences if significant
HOW TO
Box 1MEB
3 How to construct a MEB generic steps
11 This is in line with the cost of basic needs approach widely used for poverty lines as described in previous sections
A MEB is constructed by estimating the cost of acquiring
adequate food and adding the cost of other essential non-
food expenditures11 The box below shows the steps that are
always part of constructing a MEB
The two principal methods for constructing MEBs are
the expenditure-based approach and the rights-based
approach Sections 5 and 6 describe these approaches
and how to combine elements of both to apply a hybrid
approach
Regardless of approach it is crucial to arrive at a realistic
relevant and operational MEB that is rooted in
consumption behaviour ndash section 6 also looks at how to
ensure this Before going into the details of construction the
next section outlines the key questions to ask before starting
the MEB analysis
8
Minimum Expenditure Baskets Guidance Note | December 2020
Before embarking on the construction of the MEB
components consider the following questions to decide how
best to approach the analysis
What is the objective and whowill be the partnersStart by setting the objective and consider what the MEB will
be used for once the analysis is finished If the MEB analysis
is a joint exercise identify potential partners possibly in
interagency working groups such as a cash working group find
out what kind of information various organizations can share
and decide on the division of labour In some cases it can be
helpful to write terms of reference for the MEB analysis in
order to clarify the envisioned process and methodology Even
if the MEB analysis will be conducted by just one agency it is
always a good idea to identify partners who will be interested in
the results and who can be consulted along the way12
Who is the MEB being constructed forIt is important to define the population of interest for the
MEB Is it intended to be valid for the entire country Or will it
only be used in a refugee camp for example or a particular
region where needs might differ from those in the rest of
the country It is vital to decide from the start where and for
whom the MEB should apply Since the MEB describes the
cost of essential needs the population for whom the MEB
is constructed should ideally have relatively homogenous
consumption patterns and needs If consumption patterns are
very different consider constructing different MEBs or varying
certain components of the MEB for sections of the population
Have any MEBs already been created for the population of interest If there are one or more MEBs already in use the analytical
exercise might be aimed at updating or even ldquoreality
checkingrdquo the existing baskets to see whether they still match
consumption behaviour and price levels If existing baskets
are found to be valid and relevant it might not be necessary
to start a new MEB analysis
4 Before starting the analysis What information and data is already available and is new data neededConsider what data or analysis is already available from
essential needs assessments or other household surveys
(undertaken by WFP or others) Does the data cover the area
and population of interest Also consider what qualitative
information might be available to shed light on certain
expenditure patterns and whether there is access to market
and price information If the data available is insufficient or
outdated plan to collect fresh data A MEB analysis is greatly
strengthened by being conducted as part of a comprehensive
essential needs assessment The assessment describes the
essential needs of the population of interest which is a
useful starting point for a MEB analysis and complements the
monetary perspective provided by a MEB
Can the national poverty line be usedBefore beginning the construction of a MEB it is useful to find
out if a national poverty line exists and how and when it was
constructed Many countries have their own national poverty
lines so why not use this poverty line (and the corresponding
basket) as the MEB Whenever possible the first choice
should be to align with government practices However this is
often not feasible for three main reasons
Practices vary widely when it comes to constructing
national poverty lines Although the most common
approach is the cost of basic needs using MEBs
sometimes poverty lines are set as a share of the
country mean or median income or expenditures or
as a fixed percentage of the income or expenditure
distribution (although this is mostly not the case in low
income countries) Furthermore even when a MEB has
been constructed to develop the poverty line different
methodologies exist For example sometimes countries
exclude non-food items from their poverty line MEB
Since the MEB describes the cost of essential needs the population for whom the MEB is constructed should ideally have relatively homogenous consumption patterns and needs
12 The Cash Learning Partnershiprsquos MEB Tip Sheet contains useful advice on the interagency processes around constructing a MEB Baizan and Klein 2019
9
Minimum Expenditure Baskets Guidance Note | December 2020
Countries can also have different poverty lines for
different purposes and regions13 These factors can all
limit the use of the national poverty line as the MEB
The population of interest for a MEB could differ from the
overall population of the country and hence the national
poverty line This group of people may have different
essential needs for instance if they live in refugee camps
or do not have access to the same services as the resident
population (eg public education)
The data that WFP typically collects through essential
needs assessments comprehensive food security
and vulnerability analyses emergency food security
assessments baseline assessments and post distribution
monitoring is often much less detailed than that gathered
through the household budget surveys or living standards
measurement surveys used to calculate national poverty
lines It is widely observed that the more detailed the
survey questions about expenditures the higher the
reported expenditures14 If the national poverty line is
constructed using detailed data but the assessment of
household needs or expenditures relative to the poverty
line is based on less detailed data errors in the analysis
are likely to occur Furthermore WFP expenditure
modules do not include asset depreciation which is often
accounted for when calculating national poverty lines
Even if the national poverty line cannot be used in most
cases and especially in humanitarian contexts elements of
the methodology can perhaps be replicated It is therefore
important to find out how the national poverty line is
constructed
How about using the methodology applied for consumer price indices The consumer price index (CPI) is used to measure changes
in price levels based on a weighted average consumer basket
of goods and services In most countries household budget
survey data is used to construct the baskets used to measure
consumer prices A weight that corresponds to average
household expenditure patterns is applied to each component
of the CPI17 This basket is not ideal for MEB calculations
because it corresponds to overall national average
consumption patterns MEBs are based on the consumption
levels and patterns of those households who are just able to
meet their essential needs within the population of interest
(this is further described in the following sections)
13 Jolliff and Prydz 2016 14 Haughton and Khandker 200915 Republic of Zambia Central Statistical Office 2016 16 See Turkish institute of statistics data portal httpsdatatuikgovtrKategoriGetKategorip=Income-Living-Consumption-and-Poverty-10717 The CPI weights are usually available through national statistical offices
COUNTRYEXAMPLE
EXAMPLES OF NATIONAL POVERTY LINESEG Box 2
In Zambia the national poverty line is constructed using the cost of basic needs MEB approach based on a simple food
basket that meets minimum food needs for a family of six15 Imagine this food basket costs USD 100 per month This is
defined as the food poverty line To construct the full poverty line the minimum non-food needs of households are
estimated based on the average share of expenditure that households just above the food poverty line dedicate to needs
other than food Let us say that this corresponds to USD 35 per month The total poverty line is then the sum of the food
and non-food lines which with these hypothetical figures would be USD 100 + USD 35 = USD 135
By contrast Turkey uses the standard European Union approach to measuring poverty which is 50 or 60 percent of
median income16 However eligibility for social assistance is based on the gap between household income and the national
minimum wage
10
Minimum Expenditure Baskets Guidance Note | December 2020
In developing country contexts consumption is generally considered a better metric of wellbeing than income and in turn consumption expenditures as captured in household data generally provide the most reliable measure for consumption
5 Constructing a MEB expenditure-based and rights-based approaches
51 The expenditure-based approachThe expenditure-based approach to constructing a MEB
relies on household-level expenditure data to examine the
consumption behaviour of households who are just able
to meet their essential needs The expenditure level and
consumption patterns for this group of households reveal the
minimum cost of covering essentail food and non-food needs
and therefore form the basis of the expenditure-based MEB
The expenditure-based approach builds on the theory
behind poverty measurement and poverty line construction
To measure poverty the first step is to define a measure
of wellbeing In developing country contexts consumption
is generally considered a better metric of wellbeing than
income and in turn consumption expenditures as captured in
household data generally provide the most reliable measure
for consumption18 Household survey data on expenditures
therefore provides the foundation for measuring wellbeing
and is used to set the MEB threshold
The steps for constructing a MEB using the expenditure-based
approach are explained below
1 Prepare the expenditure data The prerequisite for an expenditure-based MEB is a
good-quality household survey with a detailed expenditure
module with a sufficient sample size representative of the
population for whom the MEB is being constructed (the
ldquopopulation of interestrdquo)
The notion of a ldquodetailedrdquo expenditure module is a
relative one Constructing an expenditure-based MEB
requires more detailed data on different types and
groups of expenditures than is usually gathered by
household surveys conducted in humanitarian settings
However this guidance has been designed to cope
with less detailed expenditure data than that gathered
through extensive national expenditure surveys such
as the very granular expenditure modules typically used
when constructing poverty lines (eg national household
budget surveys household income and expenditure
surveys living standards measurement surveys or other
large-scale household surveys)
What is a sufficient sample size The survey should
always follow good practices for sampling19 Consider
that for MEBs the analysis focuses on the consumption
patterns of a subset of the sample the ldquoreference cohortrdquo
(see next below) The characteristics of the population
and the cohort selection criteria determine the size of
this subsample in relation to the overall sample but
experience shows that the cohort can comprise between
10 and 60 percent of the sample The sample will be
further disaggregated if analysis by household size or
group of household size is desired (see section 7 on
accounting for household sizes)
Using expenditures to understand consumption involves
calculating a ldquoconsumption aggregaterdquo This entails
combining household expenditures on food and non-
food paid in cash or through credit as well as the
imputed monetary values of consumed own production
and received assistance Expenditures are analysed in
per-capita values Box 3 describes this process in more
detail Annex 1 further outlines some best practices when
analysing expenditure data
In addition to the household survey data market price
data is needed in order to estimate the final cost of the
basket The price data should be collected around the
same time as the household survey data
18 Deaton and Zaidi 2002 and Haughton and Khandker 2009 19 For guidance see WFP 2004 Additional resources can be found in the online VAM Resource Centre httpsresourcesvamwfporg
11
Minimum Expenditure Baskets Guidance Note | December 2020
HOW TO
EXPENDITURE DATA IN MEB CALCULATIONS -CONSTRUCTING A LIGHT ldquoCONSUMPTION AGGREGATErdquo
Box 3
Using expenditures to calculate a MEB entails combining different household expenditures to arrive at a measure of house-
hold consumption This is typically referred to as a consumption aggregate although a lighter version is used than those
usually constructed for national poverty lines due to the less granular data typically available for MEB construction20
Expenditures considered in a MEB should reflect household consumption related to essential needs Therefore both
household expenditures made in cash and those on credit must be considered as the latter also reflect current consump-
tion even if payment occurs later If the population can be expected to consume food from their own production the value
of this food should be captured to avoid underestimating food expenditures Lastly if the surveyed households are receiv-
ing and consuming assistance it is advisable to estimate the implied value of this assistance and include it in the expendi-
tures (however care needs to be taken if the population of interest includes a large group of in-kind assistance beneficiar-
ies as this can significantly skew consumption choices see next section on selecting the reference cohort) In summary the
expenditure module should capture any expenditures made in the reference period through cash and credit purchases as
well as the monetary value of consumed own production and assistance Most standard expenditure modules include all
these types of expenditures
Expenditures should be collected for both food and non-food goods and services For food expenditures at the food group
level are required as a minimum If food expenditures are collected at the item level a more granular analysis can be per-
formed The same applies for non-food expenditures they must be available at the group level and item-level data will add
detail However whenever household data is collected a balance needs to be struck between the granularity of the data
and the time and resources available for its collection
The WFP standard expenditure module can be used as a reference for the minimum requirement for expenditure data
collection WFP standard modules can be found in the online VAM Resource Centre httpsresourcesvamwfporg
+ ndash=
2 Select the reference cohort The next step is to identify the households in the survey
data that are just able to meet their essential needs and
examine their expenditures Including households below
this level would generate a basket that does not satisfy
essential needs while including relatively wealthier
households would lead to the inclusion of non-essential
needs and therefore inflate the MEB But what is ldquojust
enoughrdquo
Identifying the cohort of households who are just able
to meet their needs can be challenging How to approach
it depends on the characteristics of the population
and the available data The key is to identify one or
more criteria that can be good proxies for whether
households are just able to meet their essential
needs and that can be observed in the data One
basic indicator would be a food consumption of 2100
kcal per person per day21 However since the available
expenditure data is often too crude to make accurate
calibrations of diet compositions around the 2100
kcal point the use of alternative indicators is highly
recommended These could be indicators such as food
consumption score (FCS) or food consumption score ndash
nutrition (FCS-N)22 which indicate whether households
eat sufficient and balanced diets quality of housing
indicators use of coping strategies (selecting households
who do not engage in severe strategies) or any other
indicator that reflects a householdrsquos ability to meet its
needs Combining several indicators is often useful
20 For thorough guidance on constructing consumption aggregates using data from living standard measurement surveys (LSMS) see Deaton and Zaidi 2002 In most WFP cases household data is less granular than the LSMS-type datasets This section therefore describes how to construct consumption aggregates with less detailed data21 Use of calorie consumption close to the Sphere Standard of 2100 kcalpersonday as the starting point for selecting the reference cohort originates in the cost of basic needs approach used in most national poverty line estimations 22 WFP 2008 and WFP 2015
12
Minimum Expenditure Baskets Guidance Note | December 2020
Figure 2 Selecting the MEB cohort
In simple terms it is useful to think of the green people in the figure as the basis for selecting the reference cohort they are not amongst the worst-off
nor the wealthiest ndash but rather are just able to meet their essential needs
DESTITUTE
WEALTHY
It is also recommended to examine the expenditure
distribution Excluding households in the extreme ends
of the expenditure distribution can help ensure that
the cohort is neither ldquotoo poorrdquo nor ldquotoo wealthyrdquo (eg
by removing households in expenditure quintiles 1 and
5 or similar exclusion criteria based on distribution
characteristics) This is in particular useful if there is a
relatively large spread in wealth across the sampled
population
Figure 2 provides a simplistic depiction of selecting the
reference cohort the aim is to identify households that
are just able to cover their needs and hence do not fall in
either extreme end of the spectrum
13
Minimum Expenditure Baskets Guidance Note | December 2020
Box 4 outlines some typical cases and presents suggestions
for how to select the cohort in a survey sampled on
the population of interest
There is a spread in the
population in terms of well-being
and a proportion is able to cover
their essential needs no
households receive assistance
A relatively large proportion of
households receive food
assistance
The vast majority of the
households are far from being
able to cover their essential
needs (prior to receiving
assistance)
Select households with an acceptable FCS23 or with adequate consumption in FCS-N
who do not use negative coping strategies (or have a high coping strategy index)
Combine or cross-check with other criteria such as dwelling quality or asset index
Exclude extreme expenditure quintiles
Exclude households receiving in-kind food assistance from the reference group (if
sample size allows) This is because any assistance that is not unrestricted cash
might influence the consumption choices of the beneficiary households (in-kind
food means a large portion of food consumption is determined by the assistance
provided not the households) However be aware that if the majority of
households receive some form of restricted assistance excluding them all from the
cohort can lead to sample size issues as well as selection bias
Alternatively to the extent possible avoid using criteria that are highly influenced
by assistance For example in the presence of food assistance the FCS of some
households might be acceptable even if they are not able to meet their essential
needs Furthermore if in-kind food is provided the consumption behaviour of such
households might be skewed as most of their food needs are already covered by
assistance
Consider using dwelling quality an asset index or other similar indicators instead
(or in combination with the FCS)
Consider using a rights-based approach since it will be very difficult to obtain a big
enough sample of households who can meet their essential needs making it
challenging to construct an expenditure-based MEB Carry out a reality check using
the survey data to understand household consumption patterns keeping in mind
that the sample represents a population not able to fulfill their essential needs
HOW TO
REFERENCE COHORT SELECTIONBox 4
Scenario Possible approach to selecting the cohortUse one or several of the below criteria
The use of sensitivity tests is highly recommended in the form
of repetitions of the expenditure analysis for different versions
of the reference cohort this will indicate the extent to which
the choice of cohort selection criteria is influencing the MEB
23 It is usually not advisable to use the FCS as a single criterion If it is used alone the indicator should be capped at a certain level above the acceptable threshold (the FCS builds on a continuous score from 0ndash112 and applies thresholds for poor borderline and acceptable consumption) This is because if all households with acceptable FCS are included this will likely also capture some households who are ldquotoo wealthyrdquo to be considered in the reference cohort
14
Minimum Expenditure Baskets Guidance Note | December 2020
See box 5 for examples of how sensitivity tests can be
conducted as well as how the reference cohort has been
COUNTRYEXAMPLE
SELECTING AND CHECKING THE REFERENCE COHORTCHAD SYRIAN REFUGEES IN LEBANON AND COXrsquoS BAZAR
EG Box 5
Reference cohort sensitivity analysis ndashCoxrsquos Bazar MEB
Table a
In Chad the calculation of an expenditure-based MEB relied on national data collected by the Government during their
annual national food security and nutrition survey The reference cohort for the MEB was selected on the basis of two
criteria FCS between 35 and 70 eg in an interval around the acceptable threshold and no adoption of crisis or emergency
livelihood coping strategies based on the livelihood coping strategies indicator These two criteria ensured that the
selected reference cohort had consumption levels that provided sufficient food security and sustainable livelihood
strategies
For Syrian refugees in Lebanon24 an expenditure-based MEB was calculated by WFP in order to review an existing MEB
Shelter plays an important role as most refugees live in an urban host community and face high rents The FCS reveals
whether people can cover their food needs but could be influenced by the presence of food assistance To ensure results
would be robust against the choice of the cohort two different approaches were compared both included households of 4
to 6 members (as the MEB under review was defined only for households of these sizes) and excluded households in
expenditure quintiles 1 and 5 In version 1 an additional criterion of acceptable FCS was included while in version 2 an
additional criterion of acceptable housing conditions was applied The results were similar for both cohort versions
A MEB was calculated in Coxrsquos Bazar Bangladesh as part of the 2019 Refugee Influx Emergency Vulnerability Analysis
(REVA-II)25 for Rohingya refugees An expenditure-based MEB was built using a large household survey that included
refugees and host community households the reference cohort also included refugees and host communities as the MEB
was meant to apply to both groups Households receiving in-kind food assistance were excluded to avoid possible bias in
consumption choices which would be reflected in the expenditure data The reference cohort was then selected based on
FCS and expenditure quintiles To ascertain that the appropriate cohort had been chosen a sensitivity analysis was
conducted which tested the effect of removing different expenditure quintiles (quintiles 1 and 5 versus quintiles 1 4 and 5)
and including different FCS ranges (FCS 42+ versus FCS 35ndash80) This showed that across different iterations of the reference
cohort total food expenditures were relatively stable while non-food expenditures went up when richer households (eg in
the higher expenditure quintiles) were included This allowed the analysts to select the cohort of households who were just
at the point where the share of food expenditures out of total expenditures began to decrease as a high share of
expenditure on food is often an indicator of vulnerability In other words the selected cohort was just at the point where
households started meeting more needs than just food and the most basic non-food requirements The consumption
patterns of this cohort -highlighted in table a below - therefore became the basis for the MEB
Indicator 1expenditurequintiles
Indicator 2FCS Sample
size Value in taka
Total MEB
Exclude quintiles 1 4 and 5
Exclude quintiles 1 4 and 5
Exclude quintiles 1 and 5
Exclude quintiles 1 and 5
FCS 35ndash80
FCS gt= 42
FCS 35ndash80
FCS gt= 42
403
296
610
474
5259
5324
5691
5740
2304
2299
2990
3082
070
070
066
065
030
030
034
035
7562
7623
8681
8822
Food MEBValue in taka Value in taka
Non-food MEB
identified in different contexts
24 Hohfeld et al 2020 25 WFP 2019
15
Minimum Expenditure Baskets Guidance Note | December 2020
3 Establish the food basketWith the reference cohort identified the food basket value
should be calculated in correspondence with the food
consumption patterns of the reference cohort
To calculate the food basket start by computing the mean
(or median) food expenditures for the chosen reference
cohort It is good practice to compute the overall food
expenditures and break the analysis down into the different
food groups or food items in order to understand how food
consumption is distributed across different foods
Next consider whether an explicit reference food basket
is needed in the MEB this is a list of the food items in the
basket and their quantities Having a reference basket
brings advantages in terms of monitoring of the cost
of the MEB (as new prices can easily be applied to the
quantities) it shows consumption patterns in quantities
and can hence help check if food consumption is adequate
at the given level of expenditures and it can help when
communicating about the MEB It can therefore be a useful
practice to establish one However in some instances
a simple monetary value for the food MEB is sufficient
This could be the case when the MEB is calculated to
review an existing MEB if reference basket is not needed
for operational purposes when time is limited or
where limited data means a reference basket cannot be
adequately calculated Wherever a food reference basket
is not needed the food MEB will simply be the mean (or
median) food expenditures by food groups or food items
as calculated above If a reference food basket is feasible
and desired the next steps depend on the level of detail in
the data available
With expenditure data and market prices a food
reference basket can be approximated using expenditures
by food group or food item and dividing these
expenditures by the relevant food prices This provides
estimates of consumed quantities Expenditures and prices
must be collected at the same time in order to arrive at
correct quantities If for example prices are collected six
months later than expenditures and prices have changed
significantly dividing expenditures by prices will produce
inaccurate estimates
Note that the level of detail and accuracy with which a
food refence basket can be established using expenditures
and prices also depends on whether expenditures
were collected at the food group or food item level Box 6
illustrates how to approximate a reference basket when
expenditures are collected at the food group level and
box 7 shows an example of a food basket estimation from
an assessment in Kinshasa Democratic Republic of the
Congo
If the expenditure module includes consumed quantities
of food in addition to expenditures a food basket can be
established directly based on the consumed quantities by
food group or food item Having data on quantities will
also enable analysts to estimate prices directly from the
survey data by dividing the household expenditure on a
particular food item by the quantity consumed This can be
advantageous as it provides a direct estimate of the prices
households actually paid (unlike a price survey which uses
typically consumed items and is often only conducted
at specific points of sale) On the other hand this may
introduce issues related to non-standard measurement
units that make prices hard to compute and aggregate26
Box 8 shows an example from Coxrsquos Bazar of how a food
reference basket can be established using item-level
expenditures and quantities from the survey data
Once the quantities consumed have been established using
one of the methods described above it is good practice to
check the calories these quantities provide and the balance in
terms of nutrients The basket should be close to the Sphere
Standard of 2100 kcal per person per day ndash if it is not one
option could be to scale the basket Use information on the
calorie content of the different food items in the basket to
calculate the total calorie content of the basket27 The quantities
in the basket can then be scaled up or down to reach 2100
kcal However bear in mind that if the reference cohort has
been well selected and the data is of sufficient quality and
detail the basket should already be close to 2100 kcal If large
rescaling is required investigate the reasons behind this For
the sake of simplification quantities can be rounded and the
basket can be streamlined by removing items with very low
consumption or nutritional value
26 Deaton and Grosh 2000 27 Calorie information of food items can be drawn from a variety of sources The Nutval tool (httpwwwnutvalnet) provides information on calories and other nutrients for a list of items Consider that the
specifications and quality of a product can influence its caloric value (eg whole fish vs fish fillet) ndash it might be necessary to adjust for this for certain items that vary widely Many food composition tables (available from FAO for different continents httpwwwfaoorginfoodsinfoodstables-and-databasesfaoinfoods-databasesen) contain a wastage factor or edible portion conversion factor to convert from edible portions into full products as they are bought on the market
16
Minimum Expenditure Baskets Guidance Note | December 2020
After establishing the reference basket and possibly rescaling
it the basket is priced This is done by multiplying the basket
quantities by the food prices The basket can be priced using
current food prices from a price survey or by estimating food
prices from the expenditure data as described earlier The
result should be close to the expenditures for the reference
cohort although differences could arise from any rescaling or
simplification of the basket
APPROXIMATING A FOOD BASKET WITHGROUP-LEVEL FOOD EXPENDITURES
Box 6
HOW TO
Data quality and granularity has a big impact on the calculation of a food reference basket If consumed quantities are not
directly available in the dataset they need to be calculated by dividing expenditures by prices However this will always
produce an approximation and the more aggregated the data on expenditures is the more approximate the results will be
In particular when the food expenditure data is available at the food group level care needs to be taken when converting
expenditures into quantities
For example to convert expenditures on the food group ldquocerealsrdquo into a reference quantity analysts need to divide cereal
expenditures by the price of cereals But how do they determine the price of cereals This is a food group not a specific item
so there is no exact price The recommended way to approach this is to determine which is the most commonly consumed
item or combination of items for each food group Then a price for the most commonly consumed item or a composite price
of a combination of items can be used to arrive at quantities So if the most commonly consumed cereals for the population
of interest are maize and rice and they are eaten in equal measure by the population the cereal quantities for the reference
basket can be calculated in the following way
Mean cereal expenditures for our reference cohort = 150 shilling
Price of rice = 18 shillingkg
Price of maize = 12 shillingkg
Composite price of rice and maize = (18 + 12) 2 = 15 shillingkg
Cereal quantity consumed = 150 shilling (15 shillingkg) = 10 kg (5 kg rice 5 kg maize)
Of course this is an approximation care needs to be taken when converting expenditures into quantities using
group-level data
Certain food groups may lend themselves more to this approximate conversion than others For example cereals
might be relatively easy to convert using this method as cereal consumption often is concentrated on a few key staples In
contrast vegetable consumption may be so diverse that conversion via prices is not helpful In this latter case one option
could be to obtain reference basket quantities for the groups that can be converted and leave other groups as expenditures
only so that the food MEB becomes a combination of quantities and expenditures
In summary to establish the food basket
i Calculate mean (median) food expenditures by food group
or item If an explicit reference basket with quantities is not
needed stop here and simply use the expenditures as the food
basket
ii Estimate consumed quantities (by dividing expenditures
by prices or directly from data if it contains consumed
quantities)
iii Check the resulting quantities and consider scaling to meet
Sphere Standards
iv Price the basket using market prices or prices derived
from the household data
17
Minimum Expenditure Baskets Guidance Note | December 2020
Table a Food reference basket ndash Kinshasa MEB
COUNTRYEXAMPLE
KINSHASA FOOD REFERENCE BASKET USINGFOOD GROUP EXPENDITURES
Box 7
In the Kinshasa urban essential needs assessment28 the food reference basket for the MEB was established as follows
Expenditure data was available at the food group level only The caloric importance of each food group (column A of the
table below) as a part of the overall food intake was determined For each of the calorie-relevant food groups the most
commonly consumed food item was then identified (eg maize in the case of cereals) (see column B) Using the average per
capita expenditure from the household survey (column C) and the market price for each food item (column D) the
quantities consumed per person per month were approximated (column E) Next the total calorie intake was calculated
(column G) For urban Kinshasa this amounts to 1967 kcal which is close to the Sphere Standard of 2100 kcalpersonday
and suggests that the expenditure data is likely to be reliable However a proportional rescaling to 2100 kcalpersonday
was done to ensure consistency with Sphere (column H) On the basis of the rescaled total calories all values were then
converted back to monthly figures to arrive at a monetary value for each food item (columns I and J) In addition to the
calorie-relevant food items the mean expenditures on other food categories that households regularly consume were
added (vegetables fruit etc) As these food items represent little overall share of peoplersquos calorie consumption (given the
quantities consumed or the type of the foods) they were not included when calories were calculated Furthermore it would
be difficult to select specific food items in each of these categories as they are quite diverse (eg vegetables) However as
most households still consume these food items as part of their usual diet and they provide important micronutrients their
costs need to be reflected in the food MEB The mean expenditure on these food categories was therefore used as a
good-enough approximation for householdsrsquo consumption of these food groups Meals consumed outside the household
were excluded from the MEB as they were not considered essential
Food
grou
p
Food
item
per
capi
ta a
vm
onth
ly e
xp
Pric
e(f
ranc
kg)
kg c
ons
per
mon
th =
CD
food
item
kca
lpe
r 10
0g
kcal
con
s p
er d
ay=(
EF
10)
30
kcal
per
day
res
cale
d=G
(21
001
967)
kg p
er m
onth
res
cale
d=(
H(
F10
))30
roun
ded
MEB
food
-bas
ket
(fra
nc)=
ID
6898
1808
2089
2341
4306
1817
2826
833
799
2509
2144
900
500
1300
2300
2500
2200
77
36
16
10
17
08
920
412
179
302
44
110
1967
360
342
335
890
76
400
TOTAL
982
440
192
322
47
118
2100
82
39
17
11
18
09
7400
1900
2200
2500
4600
1900
2800
800
800
2500
27400
A B C D E F G H I JCereals
Tubers
Pulses
Oilsfats
Meatfish
Sugars
Vegetables
Fruit
Dairy
Condiments
Meals out-
side home
Maize
Cassava
Beans
Veg Oil
Fish
White sugar
Vegetables
Fruit
Dairy
Condiment
Meals out-
side home
29 WFP 2019 Also see box 5
18
Minimum Expenditure Baskets Guidance Note | December 2020
COUNTRYEXAMPLE
COXrsquoS BAZAR FOOD REFERENCE BASKETWITH DETAILED EXPENDITURE AND QUANTITY
Box 8
In the MEB for Coxrsquos Bazar calculated as part of the REVA II assessment expenditures and consumed quantities were
available for 87 food items which formed the basis for the consumption aggregate While the expenditure data was used to
select the appropriate reference cohort the reported quantities were used to determine household calorie intake
Quantities were reported at the food item level and consumed calories were calculated for each item The items were then
categorized by food group (cereals pulses oilsfats vegetables etc) and the total calories from each group were
calculated To create an operationally relevant reference basket without very large numbers of food items the number of
items in each food group were reduced where possible For example 95 percent of the calories that households get from
the food group ldquocerealsrdquo come from rice The cereal food group was therefore simplified to rice only keeping the total
calories sourced from cereals constant and adjusting the quantity of rice in the basket slightly upwards For pulses the four
main consumed items were identified and calories and quantities proportionally adjusted For other food groups such as
vegetables the variety of items consumed within the group was too great to simplify items to a small number for this
group no items were assigned and instead total expenditures on vegetables for the reference cohort were used directly in
the food MEB The total calories of all items were taken into account The resulting basket was close to 2100 kcal so only
minor rescaling was undertaken to arrive at final reference basket of 2100 kcalpersonday
Once the final basket had been determined quantities were priced using median prices derived from the household data
(by dividing expenditures by purchased quantities for the relevant items)
For vegetables fruits meat dairy and condiments expenditures are used directly in the food MEB (converted into monthly per
household values) For all other items quantities per capita per day are multiplied by the item median price (as derived from
the household data) and converted into monthly per household values
The MEB uses household size 5
Note The MEB for Coxrsquos Bazar was calculated for analytical purposes for the REVA II assessment It is not the operational MEB used
for the district
Foodgroup
Fooditem
Consumedquantity(grammescapitaday)
Calories(kcalcapitaday)rescaled
Median prices(takakg)
Value in MEB(taka per HHmonth)
424
14
7
2
1
182
6
81
1
33
6
28
1527
48
27
8
4
78
5
85
1
294
24
0
2100
30
80
60
40
80
-
-
-
-
80
60
-
1909
168
67
14
13
1065
48
1600
15
392
57
345
5691
Cereals
Pulses
Pulses
Pulses
Pulses
Vegetables
Fruit
Meat
Dairy
Fats
Sugar
Condiments
TOTAL FOOD
Rice
Lentil
Chickpea
Anchor daal
Mung
none
none
none
none
Soybean oil
Sugar
none
Table a Food reference basket ndash Coxrsquos Bazar MEB
19
Minimum Expenditure Baskets Guidance Note | December 2020
4 Establish the non-food basketOnce the food component has been established a non-
food component is added There is no wholly satisfactory
way to add a non-food component as it can be difficult to
define an essential minimum Unlike food needs many
non-food needs are often more contextual and are not
easy to anchor in a specific universal threshold (like the
food Sphere Standard of 2100 kcal per person per day)
While Sphere Standards exist they often need to be
contextualized and may not cover all non-food essential
needs
The non-food basket can be established with different
levels of detail depending on the available data and the
level of granularity desired
As for the food expenditures start by calculating the
mean (andor median) non-food expenditures for the
reference cohort If the expenditure data is detailed it can
be used to identify specific non-food needs Expenditures
can be analysed by non-food group (eg shelter hygiene
or transport) to design a non-food basket composed
of group-specific expenditures The precise non-food
components can vary by context but would generally
include the components discussed in the section on
the rights-based MEB below Some non-food items that
expenditure data has been collected for might need to be
excluded for the purpose of constructing the MEB (eg
tobacco which is hard to consider an essential need)
In theory it would be possible to establish a non-food
reference basket with specific quantities using the same
method as for food ie by dividing expenditures by prices
to arrive at quantities However this is usually not feasible
for non-food goods and services simply because non-food
expenditure data is often much harder to break down into
specific items than food expenditure data For instance
even if expenditures on clothing or transportation
are known relating this to exact clothing items or
transportation services and then obtaining accurate
prices for those itemsservices will often prove difficult if
not impossible Therefore as a general recommendation
in the expenditure-based approach when non-food
expenditure data is not available at the item level it is
best to keep the non-food basket to expenditures and not
provide quantities If reliable market price information on
relevant non-food items is available total expenditures
could be checked against prices to obtain an approximate
idea of the adequacy of the non-food expenditures
Particular groups of non-food expenditures may require
special attention due to their nature Box 9 highlights a
few examples
TIP BOXNON-FOOD EXPENDITURES ndashEXPENDITURES OF PARTICULAR INTEREST
$$
$
Box 9
Shelter expenditures can be a tricky component to deal with especially for urban populations If the share of the
population who rent accommodation is significant rent will typically be included in the MEB as it is the cost of shelter an
essential need Indeed it can form quite a significant part of the MEB However if the resulting MEB is compared to actual
expenditures to determine whether households fall below the MEB those who own their dwelling and therefore do not pay
rent might be classified as unable to cover their needs just because they do not have any major shelter expenditures
Therefore large single expenditures such as rent should be included with care and context will determine how shelter
expenditures are handled in the MEB Generally speaking if no or very few households in the population of interest have
major shelter expenditures such as rent this component should be left out of the MEB and no attempt made to impute it
(as is sometimes the case in poverty line estimations) If the majority of households rent their dwellings it is advisable to
include mean rent expenditures in the MEB The trickier case is when the households in the population of interest are split
between a significant number of households living in owned or no-rent housing and a significant number paying rent ndash
here it is difficult to reflect shelter expenditures adequately in the MEB Simply using mean rent estimations in the MEB will
underestimate the need for the renters while overestimating it for those who own their housing or do not pay rent In this
case insofar as data allows one solution could be to impute rent expenditures for the non-renters by estimating the
would-be rental cost for the type of housing they live in Doing this typically requires a housing module in the household
survey that contains information on ownership and types and sizes of housing so rental equivalents can be computed and
imputed for the non-renters
20
Minimum Expenditure Baskets Guidance Note | December 2020
NON-FOOD EXPENDITURES ndashEXPENDITURES OF PARTICULAR INTEREST
$$
$
Box 9
Health expenditures can also be challenging to capture adequately in survey data as such expenditures are often irregular
in nature Bear in mind that health expenditures usually consist of payment for goods such as medicines and for services
such as visits to the doctor When analysing the expenditures and deciding how to include them in the MEB consider which
services may be provided free of charge and what households pay themselves and at what cost30
Care should be taken when it comes to the underreporting of expenditures and treatment of expenditures that are
irregular in nature Remember that the MEB should include all recurrent essential needs but it typically does not include
one-off expenditures ldquolumpy expendituresrdquo such as marriage expenditures or dowries or investments Expenditures
on durables (for instance the purchase of vehicles or large household appliances) are also not included (in national poverty
lines the rental value of the durables owned by households adjusted for depreciation is sometimes included31 however
this is not recommended for MEB calculations)
Household expenditures on savings taxes and debt repayment are not usually included in the MEB as these types of
expenditures do not reflect actual consumption
Tobacco and alcohol are often included in expenditure surveys While households may choose to spend money on these
items they can fairly be assumed to be non-essential and are generally not recommended for inclusion in the MEB
The ldquoquick fixrdquo if data is very limited If the expenditure
data has no or very insufficient data on non-food
expenditures a ldquoquick fixrdquo solution is to use the average
non-food expenditure share of total expenditures This can
often be obtained from external sources such as monitoring
reports or food security assessments This is then added
COUNTRYEXAMPLE
Table a Non-food basket ndash valuesCoxrsquos Bazar
Value in MEB (takaHHmonth)
Non-food group
Toiletries and cleaning
Clothes shoes and towels
Cooking equipment
Education
Fuel and electricity
Medical treatment
Household textiles and small repairs
Communication
Transport
Total non-food
461
521
25
134
775
447
57
274
295
2990
Figure a Non-food basket ndash distribution Coxrsquos Bazar
Note The MEB for Coxrsquos Bazar was calculated for
analytical purposes in the REVA II assessment
It is not the operational MEB for the district
9Communication
10Transport
2Householdtextiles and
small repairs
15Medical
treatment
26Fuel andelectricity
5Education
1Cooking
equipment
17Clothes shoes
and towels
15Toiletries
and cleaning
EXPENDITURE-BASED NON-FOOD REFERENCEBASKET EXAMPLE FROM COXrsquoS BAZAR
Box 10EG
to the cost of the food basket to arrive at the total MEB
However when using an additional data source analysts
should understand how the average share of non-food
expenditures has been calculated and what sample it has
been derived from as it may not reflect the consumption
patterns of the reference cohort
30 The WHO and Global Health Cluster guidance on health expenditures in the MEB has some useful insights into household health expenditures See WHO and Global Health Cluster ndash Cash Task Team 2020 31 Deaton and Zaidi 2002
21
Minimum Expenditure Baskets Guidance Note | December 2020
52 The rights-based approachIn humanitarian contexts ldquoessential needsrdquo have been
understood as referring to access to full rights as set out by
international humanitarian law and the Humanitarian Sphere
Standards The term ldquorights-based MEBrdquo is derived from
this understanding According to the operational guidance
on multipurpose cash grants32 international humanitarian
and human rights law protects the right of crisis-affected
persons to food33 drinking water soap clothing shelter and
lifesaving medical care Humanitarian Sphere Standards
builds on this definition and outlines minimum humanitarian
standards in the areas of food security and nutrition
shelter and settlement health and WASH (water supply
sanitation and hygiene)34 In some contexts residency or legal
documentation is also included Humanitarian standards
for education are outlined in the Education in Emergencies
Minimum Standards Handbook35
The rights-based approach entails defining a detailed list
of the food and non-food items that make up the MEB
reference basket and pricing them using current market
prices MEBs built by the Interagency Cash Working Group or
other interagency coordination forum are often constructed
following the rights-based approach with each sector or
cluster contributing to the needs in their respective sectors
In these cases WFP is usually responsible for defining the
food component of the MEB For both food and non-food
items the reference basket is typically produced or cross-
checked through focus group discussions with the population
of interest partners and key informants It is usually put
together based on the needs of an average-sized household
1 Establish the food basketTo construct the food basket for a rights-based MEB compile
a list of food items and their quantities The Sphere Standards
offer a useful starting point recommending a diet of 2100
kcal per person per day with 10ndash12 percent of daily energy
intake from protein and 17 percent from fats36 The food
basket should be adapted to local diets and preferences
2 Establish the non-food basketOnce the food basket has been established a non-food basket
should be added In the rights-based approach this is typically
done by quantifying needs by producing a list of items by
sector Some examples are found below
Shelter This is the cost of accommodation that meets
basic shelter needs and rights What this means in practice
will depend on the context driven for example by weather
conditions and what is realistically available to the population
Utilities These include the cost of basic utilities such as safe
drinking water and depending on the context electricity
Non-food items These reflect basic household needs
related to cooking clothing and hygiene plus other general
household items Cooking gasfuel or firewood is often
included In line with the definition of the MEB the list should
focus on recurrent needs In practice these non-food items
can look very different depending on the context 38
Services This includes the costs of accessing basic services
such as healthcare education transport and communication
Healthcare costs are often difficult to quantify since they
are inherently irregular large and unpredictable Typically
however only basic minimum needs are covered in the MEB
such as eg two visits per year to the doctor expenses for
critical events deliveries and medicines are sometimes also
included Note that even if a need is not covered by the MEB
it does not mean that these needs do not need to be met for
the population of interest Health can be an example of this
health needs are often better met through service provision
than purchased through the market and therefore may
be only partially reflected in the MEB However guidance
from WHO and the Global Health Cluster notes that people
tend to have some level of health expenditures even when
COUNTRYEXAMPLE
SHELTER IN THE MEBFOR SYRIAN REFUGEES
EG Box 11
For the Syrian refugee operation in Turkey the MEB
includes the costs of shelter that meets certain
standards such as a minimum of 35 m2 per
person access to a toilet and running water
32 UNHCR et al 2015 33 Defined as energy needs not considering full nutrient needs (protein vitamins minerals etc) 34 See the Sphere Standards Handbook 35 INEE 2010 36 Further recommendations on micronutrient requirements can be found in the Sphere Standards Handbook37 Hobbs 201638 For some refugee contexts the Office of the United Nations High Commissioner for Refugees (UNHCR) has lists of specific items which can be considered for the MEB
22
Minimum Expenditure Baskets Guidance Note | December 2020
policies are in place that require the free public provision of
health services39
Education costs usually cover school fees materials
uniforms and transport depending on what households
have to pay themselves and what is publicly available
Transport and communication needs are often defined as
the average transport and communication costs reported by
household surveys and then validated with the communities
COUNTRYEXAMPLE
EXAMPLE OF A RIGHTS-BASED MEBFOR NORTHEAST NIGERIA
Box 12EG
The northeast Nigeria cash working group designed a MEB for a household of seven people40 the resulting reference
basket is shown below
Sectorgroup
Item Quantity(7 pers HH)
Sectorgroup
Item Quantity(7 pers HH)
Cooking fuel
WASH
Cooking fuel
WASH
Transportation
Communication
Health
Education
Firewoodbriquette
charcoal
Water + vendor fee
Bathing soap
Laundry soap
Sanitary pads
Firewoodbriquette
charcoal
Water + vendor fee
Bathing soap
Laundry soap
Sanitary pads
Rides
Airtime 500 NGN
Average expense
Pen
Pencil
Notebook
1 bag
158 jerrycans
13 bars
3 bars
4 packs
1 bag
158 jerrycans
13 bars
3 bars
4 packs
10 rides
1
7 pers
3 pcs
3 pcs
3 pcs
Table a MEB example northeast Nigeria
27 kg
45 kg
135 kg
18 L
27 kg
18 kg
36 L
09 kg
144 kg
2 kg
2 kg
1 kg
05 kg
12pcs
1L
Food Rice
Maize
Beans
Palm oil
Groundnuts
Sugar
Vegetable oil
Salt
Onion
Non-leafy vegetables
Leafy vegetables
Fruits
Meats
Chicken eggs
Vinegar
communication needs can also be specified as the cost of a
SIM card with a certain amount of data or airtime
3 Price the reference basketWith the food and non-food reference baskets established
the list of items and quantities are now priced using updated
prices from markets relevant to the population of interest
The pricing should be done based on actual current market
prices This produces the final rights-based MEB
39 WHO and Global Health Cluster ndash Cash Task Team 2020 40 Cash Working Group Nigeria 2018
23
Minimum Expenditure Baskets Guidance Note | December 2020
MEB APPROACHES ndash CONSTRUCTION SUMMARYBox 13
HOW TO
Rights-based approach
Establish the food basket
Define a list of relevant and locally preferred and
available food items and their quantities The Sphere
Standards can be used as a reference
Establish the non-food basket
Define a list of essential non-food items relevant to the
population of interest and their quantities Services such
as education or transport can also be included The list is
usually put together sector by sector
Price the basket
Use current market prices for the food and non-food
items in the reference baskets to calculate the price of
the basket Use prices from markets relevant to the
population of interest
1
2
3
4
1
2
3
Expenditure-based approach
Prepare the expenditure data
Ensure the data is cleaned Compute expenditures by
combining cash and credit expenditures the value of
consumed own production and consumed assistance
for both food and non-food expenditures Compute
expenditures as per capita figures
Select the reference cohort
Identify households ldquojust able to meet their essential
needsrdquo using indicators such as FCS FCS-N housing or
others excluding households in extreme quantiles of
expenditure distribution or other criteria or
combination of criteria Check the sensitivity of the
results to the selection of reference cohort
Establish the food basket
Calculate mean (median) food expenditures by food
group or item Either stop here or ndash to obtain a refence
basket ndash estimate consumed quantities check the
calorie content of the resulting quantities and consider
scaling them to Sphere Standards Price the basket
using market prices or prices derived from the
household data
Establish the non-food basket
Calculate mean (median) non-food expenditures by
non-food group or item If item-level data and prices
are available it is possible to derive a non-food
reference basket using same methodology as for the
food basket otherwise the non-food basket will
comprise the expenditures at the group level If a
quick-fix solution is needed add the average household
non-food expenditure share to the food MEB
53 Summary and data needs for expenditurendashbased and rights-based approachesBox 13 summarizes the steps to follow in order to construct a
MEB using an expenditure-based or a rights-based approach
24
Minimum Expenditure Baskets Guidance Note | December 2020
Qualitative understanding
of essential needs for the
population of interest
Representative household
survey with detailed
expenditure module
List of ldquorights-basedrdquo needs
Price information
Focus group discussions with key informants or population
of interest
Literature review of existing information on the essential needs of
the population of interest
WFP essential needs assessment emergency food security
assessment or comprehensive food security and vulnerability
analysis or other representative pre-assistance baseline survey
National household budget surveys household income and
expenditure surveys living standard measurement surveys or
other large-scale household survey
Clusters Cash Working Group other interagency forum
Sectoral assessments other secondary information
Price data series covering the area of interest for relevant food
and non-food items and services from WFP (Dataviz41 has
up-to-date price information) or partners
Price indices from national statistical offices
Prices derived from household expenditure data where quantities
are also reported
Suggested sources Expe
ndit
urendash
base
d
Righ
tsndashb
ased
INFORMATION NEEDS AND SOURCESMEB APPROACHES
Box 14
HOW TO
Information need
TIP BOXWHAT IF DATA USINGA HOUSEHOLD ECONOMY APPROACH IS AVAILABLE
$Box 15
The household economy approach (HEA) developed by Save The Children is commonly used for analysing food security and
livelihoods It is based on understanding how households normally access income food and other itemsservices required
for survival established through a baseline analysis As part of the baseline the HEA defines livelihood zones where
households share similar strategies for obtaining food and income It also distinguishes households within these livelihood
zones in at least three (often four and sometimes more) wealth groups The HEA baseline quantifies the sources of food
and income and the expenditure patterns for each wealth group and livelihood zone
The information collected on expenditures can be used as a data source for calculating a MEB However due to the relative
nature of the wealth cut-off points used there is no set standard regarding which group should be the reference for the
MEB If HEA data is utilized it is important to understand how it was collected ndash the HEA is simply an analytical framework
not a set method of data collection Thus while HEAs are often conducted through qualitative methods (eg focus group
discussions) they may also be based on quantitative modules in household surveys The latter yields more rigorous
information however qualitative data can be used but should be cross-checked or triangulated with other sources
39 See VAM data portal at httpsdatavizvamwfporg
25
Minimum Expenditure Baskets Guidance Note | December 2020
54 Expenditure-based or rightsndashbased approach Pros and consThere are advantages and disadvantages to both types of
approach which should be kept in mind when constructing
the MEB
The expenditure-based approach has the advantage that it
directly reflects the actual demand of the population of interest
as it uses survey data to examine peoplersquos consumption
behaviour It is also fairly straightforward to carry out if good
survey data on the population is available One disadvantage is
that it can be difficult to put into practice when the population
of interest is generally poor (such as in a pre-assistance
refugee situation) because the number of households who can
constitute the reference cohort can be too small to analyse
Also care has to be taken when looking at expenditure patterns
only as the reference cohort may not always cover all of their
essential needs to a desired level (from a ldquorightsrdquo perspective)
For example the food patterns for those ldquojust able to meet
their essential needsrdquo may not always be very nutritionally
diverse as they are based purely on consumption behaviour42
In general the expenditure-based approach should not be applied
without good quality household expenditure data
TIP BOX ADVANTAGES AND DISADVANTAGES OFDIFFERENT APPROACHES TO ESTABLISHING MEBS
Box 16
Pros
Cons
Expenditure-based Rights-based
Straightforward to carry out if household data
is of good quality
Builds on actual consumption patterns of the
population of interest
Difficult to identify reference cohort if
everybody is poor
Survey data may not capture all essential needs
fully from a ldquorightsrdquo perspective
Survey data is not needed
Effective demand can be different from identified
needs leading to a MEB that does not reflect
actual demand and making comparison with
monitoring data tricky
Contains incentives to inflate sector-specific needs
The advantage of the rights-based approach is that
it can be used to construct a MEB without survey data
(although survey data is needed to monitor the MEB) One
disadvantage is that the effective demand of households
can look quite different from the basket that results from
this approach Another disadvantage is that particularly
when constructed in an interagency setting a rights-based
MEB can easily become an instrument for different partners
to compete for and secure funding There is a substantial
incentive to include excessively high sectoral needs if sector-
specific interventions are envisaged Finally if the MEB is
very detailed but the expenditure module in the household
surveys used to monitor peoplersquos expenditures against the
MEB is very crude comparison is difficult and therefore the
practical use of the MEB can be limited Many households
may fall below the MEB simply because of the discrepancy in
methods between the MEB and the monitoring data This is
similar to the issue previously discussed regarding the use of
national poverty lines
Box 16 summarizes the advantages and disadvantages of the
two approaches
42 A study conducted in Nepal showed that the food poverty line is well below the so-called ldquonutrient povertyrdquo line (see Geniez et al 2014)
26
Minimum Expenditure Baskets Guidance Note | December 2020
6 Arriving at a realistic and operationally relevant MEBRegardless of which processes and approaches are used to
construct the MEB it is crucial to arrive at a final result that
is a realistic picture of the cost of essential needs for the
population of interest rooted in actual consumption
behaviour This section looks at how approaches can be
combined to generate a hybrid MEB and how the result can be
ldquoreality checkedrdquo and validated
61 Combining approaches the hybrid MEBAs described in section 54 there are disadvantages to the
expenditure-based and the rights-based MEB approaches that
can affect the final MEB One way to overcome this challenge
may be to combine information from each approach in
a ldquohybridrdquo MEB This means making sure that the MEB is
consistent with the actual consumption behaviour of the
population of interest as found in expenditure data while
keeping the rights-based lens There is no one way to go about
this the method is subject to the availability of expenditure
data and other information on essential needs as well as the
objective of the MEB
When good quality expenditure data with a large enough
sample size is available for constructing the MEB it is good
practice to use the expenditure-based approach as a basis
for the analysis as far as possible If the expenditures of
the reference cohort are subsequently found not to reflect the
costs of covering certain essential needs for the population of
interest rights-based information should be used to reinforce
the MEB with a hybrid model If expenditure data is not
available and cannot be collected a rights-based MEB can be
constructed but should be cross-checked against any available
household-level information on consumption patterns
When starting with the construction ofan expenditure-based MEB
Did the household survey capture all essential needs or
are some not included in the data at all
If some needs are wholly overlooked consider using
rights-based information to capture them but ensure these
needs are actually in demand by the population of interest
and only missing because the survey did not capture them
Are the expenditures that are typically trickier to capture
well reflected and are the reference cohortrsquos expenditures
on them adequate from a rights-based perspective
For example if education expenditures are completely
inadequate for the reference cohort (and this is not because
the reference cohort selected is ldquotoo poorrdquo) consider using
rights-based information to capture them eg by using the
cost of school fees or school supplies like books or
uniforms
Be particularly careful with the inclusion of needs where the
supply of goods or services is far from adequate or may be
inexistent The MEB needs to ultimately reflect consumption
behaviour so adding goods or services that are not
available to the population of interest or not in demand
will lead to an unrealistic MEB
When starting with the construction ofrights-based MEB
Are the identified needs in line with the actual
consumption patterns of the population of interest
Check the reference baskets against any available
information on demand and consumption and adjust items
and quantities to reflect actual consumption patterns This
could be done using data on consumption shares by food
group and non-food group for example
Are there needs that people consider essential and choose
to spend resources on but are not captured by any sector
Check the reference baskets against any available
information on demand and consumption and adjust items
and quantities to reflect actual consumption patterns
The key to constructing a hybrid MEB lies in triangulating
information and asking the right questions during the
analysis When constructing a MEB consider the following
27
Minimum Expenditure Baskets Guidance Note | December 2020
Box 17 contains examples of hybrid MEBs constructed in different contexts
COUNTRYEXAMPLE
HYBRID MEBS IN URBAN SETTINGS IN KINSHASATHE DEMOCRATIC REPUBLIC OF THE CONGOAND FOR SYRIAN REFUGEES IN TURKEY
Box 17
For the MEB calculated as part of an urban assessment in Kinshasa43 a hybrid approach was chosen to deal with
hard-to-capture but essential expenditures such as health and education Health costs are often difficult to estimate as they
are not regular and when they do occur they often make up a large share of monthly expenditures The analysts decided to
estimate health costs through a rights-based approach instead of using expenditures from the survey Qualitative
information from key informants was used to define the cost of one doctorrsquos visit per year for each household member In
each commune the median cost was between CDF5000 and CDF6000 per visit this was represented in the MEB as
CDF500 per household member per month Over-the-counter medication was also included as part of health-related
expenditure through the addition of a per-capita expenditure of CDF1500 every two months sufficient for a course of
antimalarial drugs or antibiotics and simple medication such as painkillers or anti-inflammatory drugs
In Turkey expenditure and price data from different sources was used to assess update and adjust an existing
rights-based MEB44 for Syrian refugees living in the country A hybrid food basket was calculated using detailed information
on the consumption behaviour of Syrian refugees in Lebanon collected through itemized receipts from food assistance
e-cards The resulting food basket was triangulated with the less detailed information available from a household survey on
Syrian refugees in Turkey The results showed strong consistency between consumption behaviour of both groups
The resulting food reference basket for the MEB was then priced with official price statistics data and inserted into the
rights-based MEB Quantities of non-food items were kept as before but updated with current price data To ensure that
the MEB reflected consumption behaviour expenditure shares were triangulated with household data See table a
To value and update the MEB price data was required The official price statistics included higher quality items and brands
consumed more by the average Turkish population than by the poorer refugees To correct for this the difference between
the price of the MEB and the food expenditures of a non-poor cohort were assessed and a correction factor applied to
compensate for the overestimation of the updated MEB
Commodity
Table a Food reference basket ndash MEB for Syrian refugees in Turkey
Daily ration perperson in gram
Dailykilocalorie
Old referential food basketDaily ration perperson in gram
Dailykilocalorie
Revised Turkey food basket
150
200
50
20
30
40
20
8
30
30
5
0
0
0
0
540
684
186
29
65
137
0
28
116
265
0
0
0
0
0
100
50
0
70
0
50
30
50
50
25
5
250
50
30
5
Rice white medium grain
Bulghur wheat
Pasta
Egg whole chicken fresh
Poultry
Beans dried
Cucumber
Cheese canned
Sugar
Oil sunflower fortified
Salt iodised
Bread made from wheat
Yoghurt whole milk (leban)
Tomatoes red ripe
Tea black nutrients per 100ml of brewed tea
360
171
0
100
0
170
0
178
194
221
0
675
31
5
0
Total Kcal 2050 Total Kcal 2104
43 WFP et al 201844 WFP 2018
28
Minimum Expenditure Baskets Guidance Note | December 2020
62 Reality checks and validation with stakeholdersIn addition to asking the right questions of the data as
described in the previous section it is crucial to reality check
results when constructing the MEB This means understanding
whether the MEB provides a picture of the cost of living that
matches the reality on the ground
First of all it is important to check the MEB result with the
real circumstances of the population of interest Focus group
discussions andor key informant interviews can be held when
starting work on the MEB and after a result is obtained in
order to ensure that the MEB is a true reflection of needs and
priorities
The MEB figures can be compared with the national poverty
line ndash even if it is not advisable to use the poverty line directly
as the MEB it is good practice to check the MEB results against
it They can also be checked against any social assistance
transfer values provided in government programmes the
minimum wage or the casual labour rate or any other
information available about needs and cost of living For
instance if the MEB is much higher than what the wages
from one month of work for a typical household can buy
that could indicate that it needs adjustment and that some
of the analytical steps need to be revisited ndash as long as the
wage rate itself is reasonable The same goes for the poverty
line ndash if the two are very far apart it could be a sign that the
MEB analysis should be crosschecked Perhaps the reference
cohort was not adequately selected some sectoral needs were
overestimated or there is a large proportion of consumption of
own production has not been properly taken into account
Something that is often of particular interest is the nutritional
composition of the food part of the MEB As seen above MEB
construction typically starts from the Sphere requirement of
2100 kcalpersonday However since the MEB follows the
actual consumption behaviour of the population of interest
(especially when following an expenditure-based approach)
the resulting food basket reflects what households actually
eat which is not necessarily a nutrient adequate diet If the
basket is found to be very low in essential nutrients it could
be that the reference cohort was not well selected and a
wealthier cohort with a more balanced diet at the 2100 kcal
personday threshold might need to be identified45 However
selecting better-off households will not necessarily lead to a
more nutritionally balanced basket as food preferences are
influenced by a range of factors in addition to budget
Analytical tools to determine the cost of nutritious diets
include Cost of the Diet (CotD) developed by Save the Children
UK and used by WFP in the Fill the Nutrient Gap Analysis
CotD uses linear programming to establish the lowest cost
diet that can meet requirements for energy protein fat and
13 micronutrients for individuals in a population considering
age gender body weight physical activity level and whether
a woman is pregnant or breastfeeding CotD can be thought
of as the lowest cost of an optimal diet considering individual
requirements It is therefore useful in illustrating the needs
of vulnerable populations and their nutrient intake barriers
However it is important to keep in mind that a MEB food
basket may not deliver adequate nutrient intake when used
to set a transfer value for households even if aligned with
an optimal diet As noted above because of household
consumption choices and food allocation within households
having more money to spend may not necessarily lead
households to buy more nutritious food
MEBs should be first and foremost built on consumption
patterns that reflect actual behaviour A large difference in
cost between the MEB food basket and CoTD may hence
be driven by factors such as low availabilityhigh cost of
nutritious foods or household preferences The WFP technical
note on Fill the Nutrient Gap and minimum expenditure
baskets offers further insights into the complementarities
of the two analyses and how to use them on conjunction for
programming purposes46 When a MEB is operationalised
additional nutritional considerations could be necessary
It is important to check the MEB result with the real circumstances of the population of interest Focus group discussions andor key informant interviews can be held when starting work on the MEB and after a result is obtained in order to ensure that the MEB is a true reflection of needs and priorities
45 Note that the 2100 kcal Sphere Standard for daily diet is an estimate based on a population average Nutrient needs vary across the lifecycle It is also recommended that a food basket based on the 2100 kcal threshold should include a minimum of between four and five different food groups
46 Also see WFP 2020b
29
Minimum Expenditure Baskets Guidance Note | December 2020
COUNTRYEXAMPLE
TURKEY NON-FOODBASKET MEBCOMPOSITION VERSUSACTUAL CONSUMPTION
Box 18
In the original rights-based MEB constructed for the
Syrian refugee operation in Turkey 17 percent was
devoted to education expenditure The average
education expenditure share in the pre-assistance
expenditure data was under 2 percent with little
variation by household vulnerability status50 The
large expenditure share in the MEB reflects the
costs for transportation to schools in rural areas
where no buses are available and where the only
way for households to send children to school is to
hire private transport In order to provide for
childrenrsquos right to education the transport costs are
counted for in the MEB
Since the MEB was constructed to assure full access
to all rights the high education expenditure was
justified However a comparison of the theoretical
costs for basic needs as estimated by humanitarian
partners and the actual consumption choices of
households can reveal divergence Even if
households are assisted there is nothing to say that
they will actually start hiring private transport to get
their children to school ie the principal ldquoneedrdquo
identified by humanitarian actors will not necessary
translate into effective demand if the MEB is used as
a basis for transfer value calculations While an
important access problem has been identified other
complementary interventions will likely be needed
to address it
depending on the objective of a particular intervention and
the choices targeted households are likely to make regarding
food and nutrition once they receive a transfer Targeted
nutrition interventions may be needed such as providing
certain nutritious foods for specific groups (through in-kind
assistance or commodity vouchers) and social behavioural
change communication to nudge people towards making
better choices for health and nutrition47 Expenditure data can
be helpful to understand the consumption patterns of people
at different points of the wealth distribution Fill the Nutrient
Gap analysis also examines packages of blanket and targeted
household interventions to estimate the most cost-effective
way to address the nutrient requirements of different target
groups For further considerations including complementary
programming please consult the WFP interim guidance on
transfer values48
MEBs are often constructed in an interagency context such
as the Cash Working Group which helps facilitate dialogue
and validation from the beginning of the process However
sometimes not all clusters or key partners are engaged in such
forums which can limit the buy-in and understanding of the
MEB unless there is adequate consultation It is also essential
to consult government stakeholders and development
partners Endorsement by government counterparts could be
needed if there are existing government safety nets or policies
regarding minimum wages For example if the population of
interest for the MEB are refugees or IDPs and a transfer value
based on the MEB is higher than the social assistance provided
by the Government to the resident population this could be a
point of contention Development partners might also wonder
why a MEB is needed in addition to the national poverty line
Dialogue and validation of the final MEB with partners is
therefore vital49
47 The Fill the Nutrient Gap (FNG) analysis of which CotD is often part can help understand what programming might be needed and how interventions can be combined to improve dietary intake and reach food and nutrition objectives
48 WFP 2020c49 The Cash Learning Partnershiprsquos MEB Tip Sheet contains useful advice on the interagency processes around constructing a MEB Baizan and Klein 201950 Hobbs 2016 and WFP 2018
30
Minimum Expenditure Baskets Guidance Note | December 2020
Naturally the needs of a household increase with the size of
the household How can the different magnitude of needs
for households of different sizes be taken into account when
constructing the MEB
One simple approach is to calculate the per capita MEB
and simply scale it up for households of different sizes For
example if the MEB is constructed for a household of six and
equals USD 120 the per capita MEB would be USD 20 USD and
the MEB for a household of three people would be USD 60
However this proportional scaling ignores one important
factor while the needs of a household grow with each
additional member the increase may not be proportional
This is because some goods consumed within a household
such as food are ldquoprivateldquo in character ndash once a person has
consumed it no one else can consume the same ndash while other
goods such as housing are ldquocommonrdquo or ldquopublicrdquo meaning they
can be shared among household members Hence the needs
for housing space or electricity are not necessarily three times
higher for a household with three members than for a single-
person household This is called economies of scale Changes
in household composition can also influence how needs
grow with household size consider large households with
many children who do not have the same needs as adults
Economies of scale are particularly relevant in contexts where
shared goods constitute a major part of household essential
needs for example where rent payment is a large expense A
one-bedroom apartment may be necessary for a one-person
household but could also possibly house a family of three
who would then share the expenditure When in a context of
large economies of scale the MEB is adjusted to household
size by scaling up average per capita needs proportionally
to household size the resulting MEB will underestimate
the needs for small households and overestimate the
needs for large households by construction This is because
the per capita needs for small households are larger than
this simple scaling reflects This can have implications if the
per capita MEB is used to inform targeting or transfer value
calculations For instance if the needs of smaller households
are underestimated they are more likely to be miscategorized
as being able to meet their essential needs and might therefore
not receive the assistance they require
7 Accounting for household composition and economies of scale
Expenditures
Household sizeno economies of scale expenditures proportional to household sizeeconomies of scale expenditures non-proportional to household size
1 2 3 4 5 6 7 8 9 10
EXPENDITURES PER CAPITA
Figure 3 Economies of scale and expenditures per capita ndash illustration of the concept
31
Minimum Expenditure Baskets Guidance Note | December 2020
In other contexts economies of scale might be smaller
because of the higher relative importance of ldquoprivaterdquo goods
such as food and certain non-food items (for example soap)
or if shared costs such as shelter are not prominent How
household size is catered for in the MEB ultimately depends
on context and how needs are related to household size
Some suggested steps to account for economies of scale and
household composition are listed below
When examining how to account for different household
sizes in the MEB start by ascertaining whether economies
of scale exist and to which extent51 Figure 3 provides a
hypothetical illustration of two extreme cases no economies
of scale at all and strong economies of scale If there are no or
little economies of scale the per capita expenditures will be
very similar across household sizes while they will decrease
by household size if economies of scale are present52
Plotting per capita expenditures against household size
helps enable for this type of examinations It can be useful
to further disaggregate the analysis into different categories
(for instance food non-food or shelter expenditures per
capita) to understand which expenditures might be driving the
economies of scale if present
Box 19 illustrates two different country examples
expenditures by household size for Syrian refugees in
Lebanon and for vulnerable populations in Coxrsquos Bazar
Bangladesh In Lebanon where shelter plays an important
role household expenditures double only at a household size
of 5 and they triple at a household size of 11
COUNTRYEXAMPLE
ECONOMIES OF SCALE INLEBANON AND COXrsquoS BAZAR
Box 19
Figure a shows expenditures by household size compared to one-person households For Syrian refugees in Lebanon
average expenditure doubles only when the household size reaches five and it takes 11 members to triple the expenditures
of a one-person household The economies of scale are therefore large primarily due to the importance of shelter costs for
the refugees
In Coxrsquos Bazar in contrast total expenditures grow almost proportionally with household size (double at a two-person
household triple at a three-person household) Slight economies of scale can be seen for food For non-food expenditures
larger households even spent more per person From this data the economies of scale seem to be small
Figure a Increase in household expenditure by household size comparedto one-person households
Multiplicationfactor
Household sizeHousehold size
100
90
80
70
60
50
40
30
20
10
Coxrsquos Bazar (Bangladesh)Lebanon
1 2 3 4 5 6 7 8 9 10 11
Total Food Non-food
1 2 3 4 5 6 7 8 9 10 11
Note Figure based on authorsrsquo calculations Data from the Vulnerability Assessment of Syrian Refugees in Lebanon (VaSyr) 2017
and the Refugee influx Emergency Vulnerability Assessment (REVA II) 2019
51 Expenditure data is required to perform this analysis If no information on expenditure exists information on how needs change with household size can be collected through qualitative means such as focus group discussions or key informant interviews
52 Theoretically it is possible to also analyse expenditures by household composition but sample sizes rarely allow for such detailed disaggregation
32
Minimum Expenditure Baskets Guidance Note | December 2020
If the analysis reveals small economies of scale or none at all it is reasonable to use a per capita approach to scale up the MEB proportional to household size
Even for food strong economies of scale can be detected
which could be a result of large households being able to
buy food in bulk at a lower price However in Coxrsquos Bazar
where shelter and other shareable non-food goods are of less
importance household expenditures are close to proportional
to household size
If the analysis reveals small economies of scale or none at all
it is reasonable to use a per capita approach to scale up the
MEB proportional to household size If significant economies
of scale are present it is important to think about how to
take this into account when constructing the MEB Here are
some suggestions
One possible solution (in the expenditure-based
approach) is to disaggregate (or re-select see below)
the reference cohort for each household size sub-
sample and using the expenditures for each of these
cohorts construct specific MEBs for each household
size53 This approach takes into account economies of
scale by looking directly at the specific needs of different
size households but only reflects average differences
in household composition within each household size
The approach will most likely suffer from very small
sample sizes once analysis needs to be performed by
household size If this is the case household sizes could
be grouped into categories so that the analysis uses sub-
samples eg for household sizes 1ndash2 3ndash5 and 6ndash8 etc
or other groupings meaningful for the context When
following this approach bear in mind that if the reference
cohort is selected based on expenditure distribution
characteristics such as the removal of extreme deciles or
quintiles this procedure of removal of quintiles or deciles
needs to be repeated within each household size (or
household size group) Otherwise if there are economies
of scale for consumption there is a risk of skewing the
sample against the smallest and largest households
because their per-capita expenditures will be at the
extreme ends of the expenditure distribution
Another solution is to divide the MEB content into
ldquoprivaterdquo (non-shared) and ldquopublicrdquo (shared) consumption
For example food could be non-shared and rent and
fuel shared Examine the MEB expenditures for the
non-shared and shared goods for an average sized
household (or for household sizes around the average
for instance 4ndash6 members in order to leverage a larger
share of the sample) The non-shared value can then be
scaled proportionally to household size while the shared
value is held constant across household sizes This way
the resulting MEB consists of a lsquoflatrsquo and a proportional
element54 This is a relatively crude but intuitive way to
approximate economies of scale Figure 4 provides a
simple illustration of this approach
In the literature on poverty the most common solution
used to adjust for economies of scale and difference
in household composition is to use adult equivalents
instead of per capita numbers These equivalence scales
assign an ldquoadult equivalent numberrdquo to each household
depending on its size and composition taking into
account economies of scale as well as the different needs
of children and adults ie household composition For
example the first adult in the household is counted
as 1 and each additional adult as for example 07 A
child under 15 is counted as a fraction of an adult (eg
05) The effective adult equivalent household size is
then the sum of these adult-equivalent fractions55 Next
total household expenditures are divided by the adult
equivalent household size The MEB is then calculated
using these adjusted per-adult-equivalent expenditures
While this is not necessarily a complicated approach
from an analytical point of view equivalence scales can
53 See Lanjouw (1998) on the construction of poverty lines specific to household size (and composition)53 Alternatively the flat element can also be lsquosemi-flatrsquo and set according to household size groups ndashby examining shared costs and applying the same flat value within eg household size groups 1-2 3-5 6-8 or other
groupings as dictated by the context 53 One common equivalence scale is the OECD scale it assigns the weight 1 to the household head 07 to all additional adults and 05 to all children A household with five people say two adults and three children
consists of 32 adult equivalents (1+07+05+05+05) This is a common scale used in many developing and developed countries Another common scale is to give weight 1 to each adult and different weights to children depending on their age For the official poverty line in Zambia the following weights are given to children 0ndash3 years 036 4ndash6 years 062 7ndash9 years 076 and 10ndash12 years 078
33
Minimum Expenditure Baskets Guidance Note | December 2020
MEB - COMBINING FLAT ANDPROPORTIONAL ELEMENTS -ILLUSTRATION
MEB value
Household size
1 2 3 4 5 6 7 8 9
140
120
100
80
60
40
20
0
Proportional element - non-shared part of MEB
Flat element - shared part of MEB
MEB value per capita
Figure 4 Combining flat and proportional elements in the MEB
prove challenging when operationalising the MEB If
equivalence scales are used in constructing the MEB they
will also need to be applied when measuring household
expenditures compared with the MEB for gap analysis
against the MEB and in monitoring Translating the
concept of equivalence scaling into operational decision
making may therefore prove tricky Additionally results
can be quite sensitive to the choice of equivalence scales
so selecting appropriate scales is important yet often not
straightforward and a range of different scales exist56 In
some countries country-specific equivalence scales may
have been devised for the purpose of the calculation of
the national poverty line
No matter the approach the recommendation is always
to leverage data analysis as much as possible in order
to understand how needs evolve with household size
(and possibly composition) while keeping in mind that
the final MEB needs to be operationally relevant
Particularly in the (common) cases where MEBs are
used to calculate household transfer values it is worth
considering what level of analytical granularity can
feasibly be turned into programmatic action In some
cases it may not be operationally possible to handle
different per-capita size transfers for differently sized
households and the extra effort of achieving accurate
MEB figures by household size may not be worth it
The same general recommendation as for all aspects
of MEB construction also applies here the final result
should be realistic a fair depiction of needs and an
operationally relevant product
56 See for instance httpwwwoecdorgeconomygrowthOECD-Note-EquivalenceScalespdf
34
Minimum Expenditure Baskets Guidance Note | December 2020
A SMEB can be expenditure-based or rights-based or a hybrid of the two approaches depending on data availability and programmatic requirements
The SMEB is the absolute minimum amount required to maintain existence and cover lifesaving needs which could involve the deprivation of certain human rights
A survival minimum expenditure basket (SMEB) is often
constructed alongside a MEB While the MEB is defined as
what a household requires in order to meet their essential
needs on a regular or seasonal basis and its average cost the
SMEB is the absolute minimum amount required to maintain
existence and cover lifesaving needs which could involve the
deprivation of certain human rights However the concepts
of SMEB and MEB have not always been used consistently
by the humanitarian community and are sometimes used
interchangeably It is therefore important to be clear from the
outset of the analysis whether a MEB or a SMEB is the goal
A SMEB can serve at least two purposes First together with
the MEB it can be used to classify households into different
categories of economic capacity to meet their needs whereby
households whose expenditures fall below the SMEB have
highly insufficient economic capacity households between the
SMEB and the MEB have insufficient economic capacity and
households above the MEB have sufficient economic capacity
This information can then be used for profiling people in need
prioritizing beneficiaries or monitoring Second the SMEB
can inform programmatic decisions such as transfer values in
situations where immediate lifesaving assistance is required
The approaches presented here follow the MEB methods
adjusted to suit the different purpose of the SMEB
Accordingly a SMEB can be expenditure-based or rights-
based or a hybrid of the two approaches depending on data
availability and programmatic requirements
8 How to construct a SMEBExpenditure-based approach toconstructing a SMEBThe calculation of an expenditure-based SMEB is closely aligned
with the literature on how to estimate national poverty lines
While the MEB corresponds to an ldquoupperrdquo poverty line a ldquolowerrdquo
extreme or austere poverty line is often defined by taking the
food part of a MEB and adding this to the non-food needs
regarded as the essential minimum for household survival57
But how are survival non-food needs defined based on
expenditure data When people receive assistance it is
sometimes observed that households sell part of their food
rations to cover some non-food items These households forgo
some of the required food intake in order to cover what they
regard as survival non-food needs Using expenditure data to
construct a SMEB a similar idea is explored to calculate the
SMEB analysts identify those households whose total food AND
non-food expenditures are approximately equal to the MEB food
basket amount only In order to access non-food items these
households will compromise their food intake to some extent
because their total expenditures would only be enough to cover
their essential food requirements ie the food MEB anything
spent on non-food items means that they are not meeting their
essential food requirements It is therefore fair to assume that
the amount they choose to spend on non-food items must
be regarded by the households as absolutely necessary The
non-food expenditures of these households can therefore be
considered as the survival non-food needs The SMEB is then
calculated by adding these survival non-food expenditures
to the food MEB This SMEB allows households to meet their
essential food needs and their survival non-food consumption
Note that this approach requires a food MEB figure (either
already available or calculated as part of the SMEB analysis)
57 See Lanjouw 1998 and Haughton and Khandker 2009
35
Minimum Expenditure Baskets Guidance Note | December 2020
The steps for constructing an expenditure-based SMEB are
similar to those taken to construct a MEB with the following
additional considerations
1 Prepare expenditure data the expenditure data source can
be the same as that used for the MEB
2 Select the reference cohort this step is different The cohort
is selected by computing total household expenditures
and comparing them to the food MEB Households with
total expenditures equal to (or in an interval around) the
food MEB are selected as the SMEB reference cohort
3 Establish food basket and 4) Establish non-food basket
Using the SMEB reference cohort start by examining
how much these households spend on non-food items
Add this value to the MEB food value to arrive at the total
value of the SMEB To establish a food and non-food
basket there are two options i) use the MEB food basket
as the SMEB food basket and the non-food expenditures
of the SMEB reference cohort as the non-food basket
or ii) look at a third cohort of households namely those
whose total expenditures are around the just established
total SMEB level examine their food and non-food
expenditures and unpack those into food and non-food
baskets While both options will provide the same overall
value of the SMEB they will differ in composition and the
share of foodnon-food expenditures
Annex 2 provides an illustration of this method of constructing
a SMEB
Rights-based approach to constructing a SMEBThe rights-based approach to constructing a SMEB closely
follows the rights-based approach to constructing a MEB The
main difference is that needs and the items and quantities
included should be restricted to what is regarded as absolutely
necessary for survival ndash which can be challenging to define
This applies to both the food basket and the non-food
basket The MEB can be a starting point if there is one or
the Sphere Standards Sometimes rights-based SMEBs have
been constructed based on a MEB but with lower quantities
for certain items or by keeping some needs while removing
others
Hybrid SMEBs and reality checking resultsAs with MEBs it can be advantageous to combine the
expenditure-based and rights-based approaches to create
a hybrid SMEB The guiding principles are the same as for
the MEB with the difference that the resulting SMEB should
continue to contain nothing but the minimum required for
survival
The same logic applies to the ldquoreality checkrdquo of the SMEB
results as for the MEB it is crucial to ensure that the end
result is realistic and operationally relevant bearing in mind
the conceptual difference between the MEB and the SMEB It
is important to consult the population of interest as much as
possible to understand their views on what constitutes the
bare minimum needed by households to maintain existence
and cover lifesaving needs
COUNTRYEXAMPLE
RIGHTS-BASED SMEBS Box 20
In Lebanon health and education are excluded
from the rights-based SMEB while other needs are
covered with smaller amounts than in the MEB For
example the SMEB has a less diverse food basket
than the MEB58
In Syria the SMEB developed for the northern part
of the country includes food kerosene hygiene
products water and a small amount to cover other
survival goods Rent and utilities are not covered59
58 El Koury and Hajal 201659 Cash Based Responses Technical Working Group Syria 2014
36
Minimum Expenditure Baskets Guidance Note | December 2020
COUNTRYEXAMPLE
HYBRID SMEBs Box 21
For the MEB review in Lebanon for Syrian refugees60 a hybrid SMEB approach was chosen First an expenditure-based
SMEB was used calculating the non-food expenditures of households whose total expenditures equalled the food MEB
and adding this to the food MEB This resulted in very low expenditures on shelter (SMEB A) Due to the importance of
shelter in urban settings a second hybrid version was established calculating the non-food expenditures of households
whose total expenditures equalled the sum of the food MEB plus a rights-based value of a tent as survival shelter the cost
of which came from a rights-based SMEB (SMEB B)
Cohort HH size 4ndash6quint 2ndash4 acceptable FCS
n=923
Cohort total expenditure= food MEB
n=923210
Cohort total expenditure= food MEB + tent value
n=923210
SMEB Afood + survivalnon-food
Hybrid SMEB
437
83
40
93
20
16
29
19
314
1033
437
43
18
37
06
04
17
60
621
437
47
24
42
11
06
20
162
750
Food
Utilities (water gas fuel electricity)
Non-food items (hygiene clothing)
Health
Education
Transport
Communication
Other expenditures
Shelter
Total (USD)
Table a Hybrid SMEB for Syrian refugees
SMEB Bfood + survivalnon-food amp tent
In the Kinshasa urban assessment61 a SMEB was established in addition to the MEB comprising a basket of the most
essential items based on expenditure data used for the MEB For the food SMEB a less diverse diet was established by
excluding certain food items from the food MEB and rescaling the resulting basket to 2100 kcal For the non-food
component the only items included were those that were seen as critical to attaining the most basic standards for safety
food preparation water sanitation and hygiene These consisted of water cooking fuel hygiene products and lighting The
value for these items in the SMEB was derived from the median expenditures of the non-poor cohort
Expenditure-basedMEB
Expenditure-basedSMEB
60 Hohfeld et al 2020 61 WFP et al 2018
37
Minimum Expenditure Baskets Guidance Note | December 2020
91 Adjustment for seasonal or regional price differencesIf the MEB will only be used in one area where prices are
relatively homogenous it is often not necessary to adjust for
regional price differences However if the MEB is intended
for use across different urbanperi-urban andor rural
areas throughout the country it could be vital to adjust for
differences This means that the MEB can be priced differently
for different regions or rural or urbanperi-urban areas (or any
other division of areas that makes sense in relation to price
behaviour) There are a few approaches for this
Price the MEB based on available price data for different
regions or urbanrural areas For the food reference
basket this is most often possible using WFP food prices
or other similar price time series For non-food items
including housing utilities and services this can be more
challenging and may rely on price data collection by
different partners or require new data collection
For some countries price data provided by the national
statistical office is useful In the case of Turkey regional
purchasing power parity indices were used to provide
price estimates for components of the MEB for which
direct price information was not available
Use approximations from expenditure data If the
household survey has sufficient regional coverage the
expenditure levels in different regions can be explored
using the cohort of households just above the poverty
line Care should be taken in using this method
particularly if the sample size by region is very small
9 Additional considerations when constructing MEBs
92 Needs that vary by season or areaIn many countries where WFP works household needs change
with the seasons For instance in Turkey where winters are
cold households have additional needs for heating and warm
clothes to survive In other contexts there are significant
differences in needs between lean and rainy seasons These
changing needs could be a reason to construct different MEB
reference baskets to use at different times during the year or
to design seasonal top-ups In the case of items needed for cold
winters this is often referred to as ldquowinterizationrdquo
While this does not influence the approach used to construct
the MEB it does mean that analysts need to consider when
the data used in its construction was collected and whether
this influences the resulting MEB These considerations also
matter when using the MEB for monitoring if a monitoring
expenditure survey is used to analyse whether peoplersquos
expenditures are above or below the MEB threshold but
the survey is undertaken when prices are high or when
winters are cold if the MEB is not adjusted the results will
probably show a decrease in the percentage of people whose
expenditures are below the MEB as households have higher
needs andor are confronted with higher prices and thus
have higher expenditures without in reality being better off
In Turkey it was estimated that household needs during the
winter would result in a 48 percent increase in minimum
expenditures
In other cases different baskets might be necessary
for different areas of the country eg rural and urban
areas While the MEB should be constructed for a relatively
homogenous population it may sometimes be desirable to
construct a MEB covering all or most of a country where
consumption patterns vary substantially In this case it is
worth considering whether (some elements of) the MEB should
be different between areas Again the selected approach to
construct the MEB should not change but analysts need to
check where the data used in its construction was collected
and whether consumption patterns are very different between
different regionsareas For example in the case of Somalia
the main cereal consumed varies significantly between the
north and the south of the country so the MEB uses different
main cereals in the food reference basket according to region
While the MEB should be constructed for a relatively homogenous population it may sometimes be desirable to construct a MEB covering all or most of a country where consumption patterns vary substantially
38
Minimum Expenditure Baskets Guidance Note | December 2020
Constructing a MEB can be challenging in a sudden onset
emergency or if data is scarce or unavailable Below are some
ideas on how this can be resolved However from a ldquodo no
harmrdquo perspective it is important to emphasize that proxies
should only be used in the interim when no other solutions are
available
Use the national MEB or MEB reference basket If survey
data is not directly available and if the population of
interest is part of and similar to the overall population of
the country the national MEB or MEB reference basket
used for the national poverty line can be used if available
Bear in mind however that this basket should be used on
the condition that it corresponds to data that WFP collects
or has access to through partners or the Government to
ensure that monitoring can be conducted against the MEB
In its most basic form a MEB essentially only requires an
approximate value for the food basket and an estimate
of the average expenditure share that households use
on food Even if no relevant survey data is available this
information should be available to a country office or can
rapidly be collected or approximated
Consider using the minimum wage as a proxy Bear in
mind that while the MEB captures household-level needs
the minimum wage is individual-level income so an
assessment of how many minimum wages are needed per
household depending on the household size is required
It is also advisable to find out how the minimum wage has
been constructed
Ultimately a MEB is a good preparedness measure and should
be constructed before an emergency While both prices and
availability will be affected by an emergency it is still likely to
provide a useful starting point
11 Monitoring and updating the MEB111 Monitoring the cost of the MEBTo be operationally useful the MEB must be tracked and
updated over time to account for price changes If inflation is
high this might have to be done every month if it is low as
little as once a year could be sufficient This should be planned
for when the MEB is constructed to ensure that the costs of the
MEB components can be updated
There are different ways to update the MEB with price changes
If a reference basket is adequately defined (for food
and for non-food items) and prices are collected for the
individual items in the basket by WFP or its partners the
MEB can be priced anew using the updated prices for
each item and multiplying them by the quantities in the
reference basket
A simple solution is to adjust the MEB using the
nationalsub-national CPI or its components This
simply involves updating the cost of the MEB with
the increase (or decrease) in the CPI for the period
in question However in some contexts CPIs are not
updated or relevant for the target population Urban
areas are often over-represented in the national CPI on
the other hand prices and costs faced by for example
displaced populations can be very different from national
price levels In contexts of poverty where food constitutes
a large part of household expenditures the evolution of
food and fuel prices is central when it comes to capturing
price changes
If a CPI does not exist or is not considered applicable
a price index for key consumption items can be
constructed using price data collection for food items
and basic non-food items conducted by WFP andor
other agencies this can then be used to update the cost
of the MEB In contexts where shelter is a major part of
household expenditures changes in shelter costs should
also be captured
10 How to find a proxy for a MEB when data or time is insufficient
39
Minimum Expenditure Baskets Guidance Note | December 2020
112 When to construct a new MEBThe composition of MEB reflects consumption patterns
It is recommended as much as possible keeping the MEB
composition constant and only monitor how cost changes
over time However when there is reason to believe that
consumption patterns of the population for whom the MEB
is constructed has significantly changed it is time to review
its composition and possibly reconstruct the MEB to reflect
these changes
What could suggest such consumption changes have
occurred The figure to the right summarises some typical
events that could result in a significant change in household
consumption Shocks eg a natural disaster might create
additional needs if livelihoods are disrupted or living
conditions are altered Significant changes to the prices of
key consumption items can also alter consumption pattens
insofar it pushes households to substitute certain items
for other items (be aware however that reconstructing
the MEB would only be advisable if the substitution is not
just temporary) Population changes such as an influx of
displaced people or other events that changes the population Figure 5 Possible triggers for MEB composition review
Has a shock occured creating
different or additional needs
Have costs changed significantly
between key consumption items so
that households have substituted
consumption patterns
Has there been a change in
population - eg a displacement
Has the supply side or service
provision changed leading to a
change in household consumption
Shock
Substitution
Population
Supply
composition in the area that the MEB is constructed for
could also lead to a review Finally if supply of essential
goods and services changes this may also shift household
consumption eg if health services are made free of charge
and no longer require households to pay for them
40
Minimum Expenditure Baskets Guidance Note | December 2020
CaLP The Cash Learning Partnership
CBT cash-based transfers
CotD Cost of the Diet [approach]
CPI consumer price index
FCN-N food consumption score ndash nutrition
FCS food consumption score
FNG Fill the Nutrient Gap
HEA household economy approach
LSMS Living standard measurement survey
MEB minimum expenditure basket
OCHA United Nations Office for the Coordination of Humanitarian Affairs
REVA II 2019 Refugee Influx Emergency Vulnerability Analysis
SDG Sustainable Development Goal
SMEB survival minimum expenditure basket
UNHCR Office of the United Nations High Commissioner for Refugees
VAM Vulnerability Analysis and Mapping
WFP World Food Programme
WHO World Health Organization
Abbreviations
41
Minimum Expenditure Baskets Guidance Note | December 2020
Deaton and Grosh 2000 ldquoConsumptionrdquo in Designing Household Survey Questionnaires for Developing Countries Lessons from Ten
Year of LSMS Experience httpsscholarprincetonedudeatonpublicationsconsumption
Deaton and Zaidi 2002 Guidelines for Constructing Consumption Aggregates for Welfare Analysis LSMS Working Paper no 135
httpsopenknowledgeworldbankorghandle1098614101
The Cash Learning Partnership (CaLP) Glossary of terminology for cash and voucher assistance
httpswwwcalpnetworkorglearning-toolsglossary-of-terms
Cash Based Responses Technical Working Group Syria 2014 Northern Syria Survival Minimum Expenditure Basket Guidance
Document httpswwwhumanitarianresponseinfositeswwwhumanitarianresponseinfofilesdocumentsfilesnorthern_
syria_smeb_guidance_document_dec_2014pdf
Cash Working Group Nigeria 2018 Minimum Expenditure Basket for North East Nigeria ndash Justification and recommendations Draft
report httpswwwhumanitarianresponseinfositeswwwhumanitarianresponseinfofilesdocumentsfilesmeb_justification_
guidelinespdf
Baizan and Klein 2019 Minimum Expenditure Basket (MEB) Decision Making Tools The Cash Learning Partnership httpswww
calpnetworkorgpublicationminimum-expenditure-basket-meb-decision-making-tools-2
El Koury and Hajal 2016 MEB and SMEB revision Community Consultation Lebanon Cash Consortium httpsreliefwebintsites
reliefwebintfilesresourcessmeb-fgd-report-final-1pdf
Geniez Mathiassen de Pee Grede and Rose 2014 ldquoIntegrating food poverty and minimum cost diet methods into a single
framework A case study using a Nepalese household expenditure surveyrdquo in Food and Nutrition Bulletin vol 35 no 2 https
journalssagepubcomdoi101177156482651403500201
Haughton and Khandker 2009 Handbook on Inequality and Poverty The World Bank httpsopenknowledgeworldbankorg
handle1098611985
Hobbs 2016 MEBSMEB calculation for Syrians living in Turkey Report commissioned by the Cash-Based Interventions Technical
Working Group in Turkey httpsdata2unhcrorgendocumentsdownload57031
Hohfeld Papavero Sandstrom Dalbai and Renk 2020 Minimum Expenditure Basket for Syrian Refugees in Lebanon ndash Rights-based
versus Expenditure Based Approaches WFP httpsreliefwebintsitesreliefwebintfilesresources76229pdf
Inter-Agency Network for Education in Emergencies (INEE) Minimum Standards for Education Handbook Preparedness Response
Recovery httpsineeorgstandards
Jolliff and Prydz 2016 Estimating International Poverty Lines from Comparable National Thresholds World Bank Policy Research
Paper 7606 httpsopenknowledgeworldbankorgbitstreamhandle1098624148Estimating0int00national0thresholdspdf
Lanjouw 1998 Demystifying Poverty Lines World Bank
Ravallion 1994 ldquoPoverty Comparisonsrdquo in Fundamentals of Pure and Applied Economics 56
Republic of Zambia Central Statistical Office 2016 2015 Living Conditions Monitoring Survey (LCMS) Report httpswwwzamstats
govzmphocadownloadLiving_Conditions201520Living20Conditions20Monitoring20Survey20Reportpdf
Save the Children UK 2018 Basic Needs Assessment Guidance and Toolbox Part I Background and Concepts httpsreliefwebint
reportworldbasic-needs-assessment-guidance-and-toolbox
Sphere Standards Handbook Humanitarian Charter and Minimum Standards in Humanitarian Response 2018 edition httpswww
spherestandardsorghandbook
UNHCR CaLP Danish Refugee Council OCHA Oxfam Save the Children and WFP 2015 Operational Guidance and Toolkit for
Multipurpose Cash Grants httpswwwcalpnetworkorgwp-contentuploads202001operational-guidance-and-toolkit-for-
multipurpose-cash-grants-webpdf
References
42
Minimum Expenditure Baskets Guidance Note | December 2020
WFP 2004 Sampling Guidelines for Vulnerability Analysis Thematic guidance httpsdocumentswfporgstellentgroupspublic
documentsmanual_guide_procedwfp197270pdf
WFP 2008 Food Consumption Analysis Calculation and use of the Food Consumption Score in food security analysis https
documentswfporgstellentgroupspublicdocumentsmanual_guide_procedwfp197216pdf
WFP 2015 Food Consumption Score Nutritional Analysis (FCS-N) Guidelines httpswwwwfporgpublicationsfood-consumption-
score-nutritional-quality-analysis-fcs-n-technical-guidance-note
WFP 2018 Revising the Food Basket and Minimum Expenditure Basket Analysis to calculate a realistic cost of living for refugees in
Turkey httpsreliefwebintreportturkeyrevising-food-basket-minimum-expenditure-basket-analysis-calculate-realistic-cost
WFP 2019 Refugee influx Emergency Vulnerability Assessment ndash Coxrsquos Bazar Bangladesh httpsreliefwebintsitesreliefwebintfiles
resourcesWFP-0000106095pdf
WFP 2020a Essential Needs Assessment Guidance note httpswwwwfporgpublicationsessential-needs-guidelines-july-2018
WFP 2020b Technical Note Fill the Nutrient Gap and Minimum Expenditure Basket An explanation of approaches and identification of
synergies httpsdocswfporgapidocumentsWFP-0000116644download
WFP 2020c Setting the transfer value for CBT interventions Transfer Value Interim Guidance httpsdocswfporgapi
documentsWFP-0000117963download
WFP global Food Security Cluster and Food Security Cluster for the Democratic Republic of the Congo 2018 Adapting to an Urban
World Urban Essential Needs Assessment in the five communes of Kimbanseke Kinsenso Makala Nrsquosele and Selambao (Kinshasa)
httpswwwwfporgpublicationsdemocratic-republic-congo-urban-essential-needs-assessment-five-communes-kimbanseke-
kinsenso
World Health Organisation and Global Health Cluster ndash Cash Task Team 2020 Technical Note on the Inclusion of Health
Expenditures in the Minimum Expenditure Basket and Subsequent Multi-purpose Cash Transfer httpswwwcalpnetworkorg
publicationinclusion-of-health-expenditures-in-the-meb
43
Minimum Expenditure Baskets Guidance Note | December 2020
Survivalnon-foodexpenditure
TOTALEXPENDITURE
FOODEXPENDITURE
MEBnon-foodexpenditure
EXPE
ND
ITU
RE
CONSUMPTION
SMEBAusterepoverty line
Essential foodneeds (MEB)
Acceptable food consumption(based on FCS)
Food expenditure for HHwith tot exp at essential
food needs (MEB)
Analysts should always ensure that the expenditure data is properly cleaned and outliers removed and that it is converted into
the same recall period (food and non-food items usually have different recall periods)
Expenditures should be calculated into per capita figures (eg by dividing total household expenditures by household size) in
order to make them immediately comparable across households (or per adult equivalent see section 7 on how to account for
economies of scale and household composition)
Before starting the MEB analysis it is highly recommended to carry out some simple descriptive analysis of the expenditure
data in order to understand it Analyse the mean and median expenditures for the sample This will help understand the
distribution of the expenditures and detect possible issues While the median is more robust to outliers if a large part of the
sample has 0 expenditures on a particular item the median could be 0 and may therefore not be the best estimate of the need
In this case the mean may be preferable A frequency analysis of non-zero expenditures by groupitem can also be helpful in
understanding whether certain expenditures are infrequent or lumpy
Annex 1 - Good practice when analysing expenditure data
Figure based on Lanjouw 1998 Demystifying poverty lines and World Bank and Ravallion 1994 ldquoPoverty comparisonsrdquo in
Fundamentals of Pure and Applied Economics 56
Annex 2 - The expenditure-based SMEB ndash an illustration

3
Minimum Expenditure Baskets Guidance Note | December 2020
The foundational understanding of essential needs gained
from the essential needs assessment can feed into the supply
analysis The results can help to focus a complex market
analysis on the most critical needs while household data
can be used to understand how households perceive the
supply and quality of essential services and their access to
them At the same time a thorough analysis of the supply
of essential goods and services enriches the understanding
of household demand and enables the analyst to identify
possible interventions Which needs can be met through
the market Is there effective demand and would supply
or demand-side interventions or a combination of these be
better suited to assisting the population of interest The MEB
connects supply and demand in the sense that it identifies
a monetary threshold for meeting essential needs through
the market It enables the essential needs assessment to
identify households with sufficient economic capacity it also
has strong complementarities with the supply analysis as it
helps reveal market consumption patterns In turn the supply
analysis is a valuable input for a MEB analysis as it highlights
which goods and services are adequately supplied
The analytical approach draws on different schools
of thought from the fields of humanitarian action
development and poverty analysis It combines ideas from
the cost-of-basic-needs approach for monetary poverty
lines which sees poverty as the deprivation of consumption
with more multidimensional poverty perspectives from
human development and capabilities approaches Through
this combination the essential needs analysis provides a
framework that is easy to operationalize while offering the
flexibility and detail necessary to adjust to different contexts
and to produce information relevant for programmatic
decision making
The minimum expenditure basket (MEB) looks at the needs
that are covered partially or fully through the market It sets
a monetary threshold which is defined as what households
require in order to meet their essential needs The starting
point for constructing a MEB is usually household expenditure
data This data is analysed and triangulated with sector-based
needs information to obtain a measure of the minimum
cost of essential needs based on the population of interestrsquos
actual demand pattern and consumption priorities The
expenditure data can be gathered as part of the essential
needs assessment data collection Once constructed the MEB
itself serves as a key input in the essential needs assessment
set of indicators as it is
used to assess which
households have the
economic capacity to
cover their needs through
the market
The supply analysis looks at the supply of essential goods
and services and examines whether the market andor public
provision can sustain the demand related to essential needs
It integrates quantitative methods for examining the basic
functioning of the marketplace with qualitative investigation
of supply and access
The three guidance tools are designed so that they can
be used independently or together A full essential needs
analysis would require undertaking an essential needs
assessment constructing a MEB and carrying out a supply
analysis this combination is recommended for the most
complete analysis as each piece complements the others
A full essential needs analysis would require undertaking an essential needs assessment constructing a minimum expenditure basket and carrying out a supply analysis
Essential needs analysis provides a framework that is easy to operationalize while offering the flexibility and detail necessary to adjust to different contexts
4
Minimum Expenditure Baskets Guidance Note | December 2020
Essential needs analysis package
Esse
ntia
l nee
ds
ESSENTIAL NEEDS ASSESSMENTDemand for essential needs
SUPPLY ANALYSISSupply of essential goods and services
MINIMUM EXPENDITURE BASKETExpenditures on essential needs
Decision making
Operationalization
Monitoring
While the three pieces of analysis should be carried out
together as much as possible there may be situations in
which only one piece is necessary for example when the
analysis is spread out over time or different collaborators
lead on different pieces Each guidance note is designed as a
standalone document enabling analysts to follow it without
reference to the others
A series of operationalization guidance notes and
documented best practices complement the analytical
package The series offers concrete guidance on how the
results of the essential needs analysis can be translated into
programme design and inform decision-making Essential
needs analysis identifies where households face critical
gaps in meeting their needs the cost of meeting those
needs in the market and whether the necessary essential
goods and services are available As such it forms the
basis for programme design for both demand and supply-
side interventions Results can for example be used to
inform the targeting and prioritization of beneficiaries the
selection of transfer modality the setting of transfer values
and other programme design features It is well suited for
monitoring needs over time and evaluating the effectiveness
of programmes This series will be continuously updated to
reflect new learning
While essential needs analysis can inform programme design
it does not have to imply an essential needs response
Essential needs analysis and the analytical package can be a
service offering particularly when supporting governments in
designing policies strategies and programmes at national and
local levels
Figure 1 Essential needs analysis
5
Minimum Expenditure Baskets Guidance Note | December 2020
This guidance note sets out the basic steps for constructing a
minimum expenditure basket (MEB) It is designed to provide
conceptual clarity and best practices built on experience from
the humanitarian and development fields The guidance is
designed to provide a series of options in order to facilitate
a context-specific application of the recommendations it
presents
The guidance note begins by introducing the concept of the
MEB and its different usages (sections 1 and 2) Sections 3 to
6 cover how to construct a MEB including important aspects
to consider before starting the analysis and the different MEB
approaches Section 7 examines how to deal with household
size and composition in MEB analysis while the concept of the
survival minimum expenditure basket (SMEB) is introduced
in section 8 Section 9 sets out additional considerations
such as regional or seasonal price adjustments and section
10 explains how to find MEB proxies when time or data is
insufficient In closing section 11 offers guidance on how to
update and monitor the MEB
A MEB is defined as what a household requires in order to
meet their essential needs on a regular or seasonal basis
and its cost3 Essential (or basic) needs are defined as ldquothe
essential goods and services required on a regular or seasonal
basis by households to ensure survival and minimum living
standards without resorting to negative coping mechanisms
or compromising their health dignity and essential livelihoods
assetsrdquo4 The MEB is a monetary threshold ndash the cost of these
goods utilities services and resources ndash and is conceptually
equivalent to a poverty line5 It typically describes the cost
of meeting one monthrsquos worth of essential needs Since the
MEB sets a monetary threshold for what is needed to cover
essential needs the households whose expenditures fall
below the MEB are defined as being unable to meet their
essential needs
i About this guidance note
3 This builds on the definition in UNHCR et al 2015 4 Definition of basic needs See CaLP glossary 5 Note that conceptually a MEB is equivalent to a poverty line in that it describes a monetary threshold for being able to cover essential needs This does not mean that the MEB is equivalent to the national poverty line6 Haughton and Khandker 2009
In poverty literature and research MEBs have long been
constructed primarily to set national poverty lines and
determine the percentage of households in the population
who are poor ie who cannot meet their essential needs
The ldquocost of basic needsrdquo approach which entails establishing
a MEB is fairly new in humanitarian contexts however it
has long been the most common way to construct national
poverty lines6 As a result there is often national experience to
draw on when setting out to construct a MEB
A MEB does not necessarily contain all the essential needs
of a household It only captures needs that the households
cover entirely or partly through the market It should not
be an attempt to monetize all the needs of a population
For example in contexts where electricity is considered an
essential need but not available for the population of interest
it should not be included in the MEB If shelter is provided free
of charge in a refugee camp or education is publicly provided for
free these needs and their costs are not captured in the MEB
Hence a need can be essential but not included in the MEB
A MEB does not necessarily contain all the essential needs
of a household It only captures needs that the households
cover entirely or partly through the market It should not
be an attempt to monetize all the needs of a population
For example in contexts where electricity is considered
an essential need but is not available for the population of
interest it should not be included in the MEB If shelter is
provided free of charge in a refugee camp or public education
is provided for free these needs and their costs are not
captured in the MEB A need can therefore be essential but
not included in the MEB
A MEB captures the cost of essential needs for average
households It does not typically capture ad-hoc or one-
off costs This can be challenging particularly in emergency
situations when needs are dynamic While this guidance
suggests keeping the MEB composition fixed as far as
possible in such situations it might be justified to create
an interim MEB (see section How to find a proxy for a MEB
when data or time is insufficient) and when the situation has
stabilized a final one A similar challenge is presented with
1 What is a minimum expenditure basket
6
Minimum Expenditure Baskets Guidance Note | December 2020
needs that are inherently irregular large and unpredictable
such as health needs This is also examined in the sections on
MEB construction
There are different approaches to establishing a MEB
As the World Bankrsquos Handbook for Poverty and Inequality
explains7 the typical starting point for establishing a MEB is
to estimate the cost of acquiring enough food to meet energy
requirements usually 2100 calories per person per day as
per the Sphere Standard Yet the cost of 2100 calories varies
with the diet of households which typically depends on their
economic status The cost of other essential non-food needs
is then added There are two approaches to establishing
which food and non-food items should be in the MEB an
expenditure-based approach that focuses on effective
demand and a rights-based approach based on assessed
needs While the expenditure-based approach is usually used
to construct national poverty lines the rights-based approach
is the principal method followed in the operational guidance
for multipurpose cash grants developed for humanitarian
purposes8 A combination of these approaches a hybrid
approach can also be used and is often recommended This
guidance describes each approach
The construction of a MEB is always somewhat arbitrary
However a MEB is constructed choices need to be made along
the way The objective of the MEB can influence how best to
approach its construction The choice of the group of people
whose effective demand will be examined ndash the ldquoaveragerdquo
households ndash is another important influencing factor This
guidance provides direction on how to make these choices but
analysts will always be required to exercise judgement
A MEB is not equivalent to a transfer value A transfer
value is understood as the monetary value transferred from
governments or organizations such as WFP to households
in order to support the latter in meeting their needs The
value of the MEB is not the same as the value that should
be transferred to households but the MEB can be a critical
component when determining transfer values Most
households can rely on their own resources to meet at least
some of their needs so the transfer value will usually be
less than the value of the MEB covering the gap between
householdsrsquo own resources other assistance received and
the MEB The distinction between the MEB and the transfer
value is also important because the MEB remains the same
regardless of assistance and funding constraints while the
transfer value could be impacted by these factors9
When using the MEB to monitor impacts of an
intervention or programme the MEB should not be
changed over time The threshold should only be adjusted
for price changes or when any major changes in context and
households needs occur that would require the construction
of a new MEB
2 Why have a MEBThe MEB has a range of applications In humanitarian
and development programming the MEB can support
household profiling by identifying characteristics of those
who cannot meet their essential needs10 and support
decisions on transfer value amounts for food and non-
food needs For partnerships the MEB can support multi-
sector coordination and programming with government
partner organisations and donors In market and supply
analysis the MEB can help inform which goods and services
to include in a Supply Analysis by showing which essential
needs households cover through the market Finally in
monitoring the MEB can assist monitoring of immediate
and longer-term outcomes through analysis of expenditure
trends against the MEB and help establish a basket against
which to monitor market prices and the cost of living
7 Ibid8 UNHCR et al 20159 For further discussion on considerations when setting a transfer value see WFP 2020c 10 For one possible application see WFP 2020a
A hybrid approach to constructing the MEB combines the expenditure-based approach and the rights-based approach and is often recommended
7
Minimum Expenditure Baskets Guidance Note | December 2020
THE MEB TO-DO LIST DEPENDING ON CONTEXTALSO CONSIDER
Identify key partners and stakeholders and decide on objectives and process
Construct the food basket
Construct the non-food basket
Reality check results and validate with stakeholders
Determine the analytical starting point (eg examine national poverty lines set the population of interest check what data is available) and decide on approach
Accounting for household size and composition
Adapting the MEB to different needs across regions or seasons
Adjusting the MEB for regional or urbanrural price differences if significant
HOW TO
Box 1MEB
3 How to construct a MEB generic steps
11 This is in line with the cost of basic needs approach widely used for poverty lines as described in previous sections
A MEB is constructed by estimating the cost of acquiring
adequate food and adding the cost of other essential non-
food expenditures11 The box below shows the steps that are
always part of constructing a MEB
The two principal methods for constructing MEBs are
the expenditure-based approach and the rights-based
approach Sections 5 and 6 describe these approaches
and how to combine elements of both to apply a hybrid
approach
Regardless of approach it is crucial to arrive at a realistic
relevant and operational MEB that is rooted in
consumption behaviour ndash section 6 also looks at how to
ensure this Before going into the details of construction the
next section outlines the key questions to ask before starting
the MEB analysis
8
Minimum Expenditure Baskets Guidance Note | December 2020
Before embarking on the construction of the MEB
components consider the following questions to decide how
best to approach the analysis
What is the objective and whowill be the partnersStart by setting the objective and consider what the MEB will
be used for once the analysis is finished If the MEB analysis
is a joint exercise identify potential partners possibly in
interagency working groups such as a cash working group find
out what kind of information various organizations can share
and decide on the division of labour In some cases it can be
helpful to write terms of reference for the MEB analysis in
order to clarify the envisioned process and methodology Even
if the MEB analysis will be conducted by just one agency it is
always a good idea to identify partners who will be interested in
the results and who can be consulted along the way12
Who is the MEB being constructed forIt is important to define the population of interest for the
MEB Is it intended to be valid for the entire country Or will it
only be used in a refugee camp for example or a particular
region where needs might differ from those in the rest of
the country It is vital to decide from the start where and for
whom the MEB should apply Since the MEB describes the
cost of essential needs the population for whom the MEB
is constructed should ideally have relatively homogenous
consumption patterns and needs If consumption patterns are
very different consider constructing different MEBs or varying
certain components of the MEB for sections of the population
Have any MEBs already been created for the population of interest If there are one or more MEBs already in use the analytical
exercise might be aimed at updating or even ldquoreality
checkingrdquo the existing baskets to see whether they still match
consumption behaviour and price levels If existing baskets
are found to be valid and relevant it might not be necessary
to start a new MEB analysis
4 Before starting the analysis What information and data is already available and is new data neededConsider what data or analysis is already available from
essential needs assessments or other household surveys
(undertaken by WFP or others) Does the data cover the area
and population of interest Also consider what qualitative
information might be available to shed light on certain
expenditure patterns and whether there is access to market
and price information If the data available is insufficient or
outdated plan to collect fresh data A MEB analysis is greatly
strengthened by being conducted as part of a comprehensive
essential needs assessment The assessment describes the
essential needs of the population of interest which is a
useful starting point for a MEB analysis and complements the
monetary perspective provided by a MEB
Can the national poverty line be usedBefore beginning the construction of a MEB it is useful to find
out if a national poverty line exists and how and when it was
constructed Many countries have their own national poverty
lines so why not use this poverty line (and the corresponding
basket) as the MEB Whenever possible the first choice
should be to align with government practices However this is
often not feasible for three main reasons
Practices vary widely when it comes to constructing
national poverty lines Although the most common
approach is the cost of basic needs using MEBs
sometimes poverty lines are set as a share of the
country mean or median income or expenditures or
as a fixed percentage of the income or expenditure
distribution (although this is mostly not the case in low
income countries) Furthermore even when a MEB has
been constructed to develop the poverty line different
methodologies exist For example sometimes countries
exclude non-food items from their poverty line MEB
Since the MEB describes the cost of essential needs the population for whom the MEB is constructed should ideally have relatively homogenous consumption patterns and needs
12 The Cash Learning Partnershiprsquos MEB Tip Sheet contains useful advice on the interagency processes around constructing a MEB Baizan and Klein 2019
9
Minimum Expenditure Baskets Guidance Note | December 2020
Countries can also have different poverty lines for
different purposes and regions13 These factors can all
limit the use of the national poverty line as the MEB
The population of interest for a MEB could differ from the
overall population of the country and hence the national
poverty line This group of people may have different
essential needs for instance if they live in refugee camps
or do not have access to the same services as the resident
population (eg public education)
The data that WFP typically collects through essential
needs assessments comprehensive food security
and vulnerability analyses emergency food security
assessments baseline assessments and post distribution
monitoring is often much less detailed than that gathered
through the household budget surveys or living standards
measurement surveys used to calculate national poverty
lines It is widely observed that the more detailed the
survey questions about expenditures the higher the
reported expenditures14 If the national poverty line is
constructed using detailed data but the assessment of
household needs or expenditures relative to the poverty
line is based on less detailed data errors in the analysis
are likely to occur Furthermore WFP expenditure
modules do not include asset depreciation which is often
accounted for when calculating national poverty lines
Even if the national poverty line cannot be used in most
cases and especially in humanitarian contexts elements of
the methodology can perhaps be replicated It is therefore
important to find out how the national poverty line is
constructed
How about using the methodology applied for consumer price indices The consumer price index (CPI) is used to measure changes
in price levels based on a weighted average consumer basket
of goods and services In most countries household budget
survey data is used to construct the baskets used to measure
consumer prices A weight that corresponds to average
household expenditure patterns is applied to each component
of the CPI17 This basket is not ideal for MEB calculations
because it corresponds to overall national average
consumption patterns MEBs are based on the consumption
levels and patterns of those households who are just able to
meet their essential needs within the population of interest
(this is further described in the following sections)
13 Jolliff and Prydz 2016 14 Haughton and Khandker 200915 Republic of Zambia Central Statistical Office 2016 16 See Turkish institute of statistics data portal httpsdatatuikgovtrKategoriGetKategorip=Income-Living-Consumption-and-Poverty-10717 The CPI weights are usually available through national statistical offices
COUNTRYEXAMPLE
EXAMPLES OF NATIONAL POVERTY LINESEG Box 2
In Zambia the national poverty line is constructed using the cost of basic needs MEB approach based on a simple food
basket that meets minimum food needs for a family of six15 Imagine this food basket costs USD 100 per month This is
defined as the food poverty line To construct the full poverty line the minimum non-food needs of households are
estimated based on the average share of expenditure that households just above the food poverty line dedicate to needs
other than food Let us say that this corresponds to USD 35 per month The total poverty line is then the sum of the food
and non-food lines which with these hypothetical figures would be USD 100 + USD 35 = USD 135
By contrast Turkey uses the standard European Union approach to measuring poverty which is 50 or 60 percent of
median income16 However eligibility for social assistance is based on the gap between household income and the national
minimum wage
10
Minimum Expenditure Baskets Guidance Note | December 2020
In developing country contexts consumption is generally considered a better metric of wellbeing than income and in turn consumption expenditures as captured in household data generally provide the most reliable measure for consumption
5 Constructing a MEB expenditure-based and rights-based approaches
51 The expenditure-based approachThe expenditure-based approach to constructing a MEB
relies on household-level expenditure data to examine the
consumption behaviour of households who are just able
to meet their essential needs The expenditure level and
consumption patterns for this group of households reveal the
minimum cost of covering essentail food and non-food needs
and therefore form the basis of the expenditure-based MEB
The expenditure-based approach builds on the theory
behind poverty measurement and poverty line construction
To measure poverty the first step is to define a measure
of wellbeing In developing country contexts consumption
is generally considered a better metric of wellbeing than
income and in turn consumption expenditures as captured in
household data generally provide the most reliable measure
for consumption18 Household survey data on expenditures
therefore provides the foundation for measuring wellbeing
and is used to set the MEB threshold
The steps for constructing a MEB using the expenditure-based
approach are explained below
1 Prepare the expenditure data The prerequisite for an expenditure-based MEB is a
good-quality household survey with a detailed expenditure
module with a sufficient sample size representative of the
population for whom the MEB is being constructed (the
ldquopopulation of interestrdquo)
The notion of a ldquodetailedrdquo expenditure module is a
relative one Constructing an expenditure-based MEB
requires more detailed data on different types and
groups of expenditures than is usually gathered by
household surveys conducted in humanitarian settings
However this guidance has been designed to cope
with less detailed expenditure data than that gathered
through extensive national expenditure surveys such
as the very granular expenditure modules typically used
when constructing poverty lines (eg national household
budget surveys household income and expenditure
surveys living standards measurement surveys or other
large-scale household surveys)
What is a sufficient sample size The survey should
always follow good practices for sampling19 Consider
that for MEBs the analysis focuses on the consumption
patterns of a subset of the sample the ldquoreference cohortrdquo
(see next below) The characteristics of the population
and the cohort selection criteria determine the size of
this subsample in relation to the overall sample but
experience shows that the cohort can comprise between
10 and 60 percent of the sample The sample will be
further disaggregated if analysis by household size or
group of household size is desired (see section 7 on
accounting for household sizes)
Using expenditures to understand consumption involves
calculating a ldquoconsumption aggregaterdquo This entails
combining household expenditures on food and non-
food paid in cash or through credit as well as the
imputed monetary values of consumed own production
and received assistance Expenditures are analysed in
per-capita values Box 3 describes this process in more
detail Annex 1 further outlines some best practices when
analysing expenditure data
In addition to the household survey data market price
data is needed in order to estimate the final cost of the
basket The price data should be collected around the
same time as the household survey data
18 Deaton and Zaidi 2002 and Haughton and Khandker 2009 19 For guidance see WFP 2004 Additional resources can be found in the online VAM Resource Centre httpsresourcesvamwfporg
11
Minimum Expenditure Baskets Guidance Note | December 2020
HOW TO
EXPENDITURE DATA IN MEB CALCULATIONS -CONSTRUCTING A LIGHT ldquoCONSUMPTION AGGREGATErdquo
Box 3
Using expenditures to calculate a MEB entails combining different household expenditures to arrive at a measure of house-
hold consumption This is typically referred to as a consumption aggregate although a lighter version is used than those
usually constructed for national poverty lines due to the less granular data typically available for MEB construction20
Expenditures considered in a MEB should reflect household consumption related to essential needs Therefore both
household expenditures made in cash and those on credit must be considered as the latter also reflect current consump-
tion even if payment occurs later If the population can be expected to consume food from their own production the value
of this food should be captured to avoid underestimating food expenditures Lastly if the surveyed households are receiv-
ing and consuming assistance it is advisable to estimate the implied value of this assistance and include it in the expendi-
tures (however care needs to be taken if the population of interest includes a large group of in-kind assistance beneficiar-
ies as this can significantly skew consumption choices see next section on selecting the reference cohort) In summary the
expenditure module should capture any expenditures made in the reference period through cash and credit purchases as
well as the monetary value of consumed own production and assistance Most standard expenditure modules include all
these types of expenditures
Expenditures should be collected for both food and non-food goods and services For food expenditures at the food group
level are required as a minimum If food expenditures are collected at the item level a more granular analysis can be per-
formed The same applies for non-food expenditures they must be available at the group level and item-level data will add
detail However whenever household data is collected a balance needs to be struck between the granularity of the data
and the time and resources available for its collection
The WFP standard expenditure module can be used as a reference for the minimum requirement for expenditure data
collection WFP standard modules can be found in the online VAM Resource Centre httpsresourcesvamwfporg
+ ndash=
2 Select the reference cohort The next step is to identify the households in the survey
data that are just able to meet their essential needs and
examine their expenditures Including households below
this level would generate a basket that does not satisfy
essential needs while including relatively wealthier
households would lead to the inclusion of non-essential
needs and therefore inflate the MEB But what is ldquojust
enoughrdquo
Identifying the cohort of households who are just able
to meet their needs can be challenging How to approach
it depends on the characteristics of the population
and the available data The key is to identify one or
more criteria that can be good proxies for whether
households are just able to meet their essential
needs and that can be observed in the data One
basic indicator would be a food consumption of 2100
kcal per person per day21 However since the available
expenditure data is often too crude to make accurate
calibrations of diet compositions around the 2100
kcal point the use of alternative indicators is highly
recommended These could be indicators such as food
consumption score (FCS) or food consumption score ndash
nutrition (FCS-N)22 which indicate whether households
eat sufficient and balanced diets quality of housing
indicators use of coping strategies (selecting households
who do not engage in severe strategies) or any other
indicator that reflects a householdrsquos ability to meet its
needs Combining several indicators is often useful
20 For thorough guidance on constructing consumption aggregates using data from living standard measurement surveys (LSMS) see Deaton and Zaidi 2002 In most WFP cases household data is less granular than the LSMS-type datasets This section therefore describes how to construct consumption aggregates with less detailed data21 Use of calorie consumption close to the Sphere Standard of 2100 kcalpersonday as the starting point for selecting the reference cohort originates in the cost of basic needs approach used in most national poverty line estimations 22 WFP 2008 and WFP 2015
12
Minimum Expenditure Baskets Guidance Note | December 2020
Figure 2 Selecting the MEB cohort
In simple terms it is useful to think of the green people in the figure as the basis for selecting the reference cohort they are not amongst the worst-off
nor the wealthiest ndash but rather are just able to meet their essential needs
DESTITUTE
WEALTHY
It is also recommended to examine the expenditure
distribution Excluding households in the extreme ends
of the expenditure distribution can help ensure that
the cohort is neither ldquotoo poorrdquo nor ldquotoo wealthyrdquo (eg
by removing households in expenditure quintiles 1 and
5 or similar exclusion criteria based on distribution
characteristics) This is in particular useful if there is a
relatively large spread in wealth across the sampled
population
Figure 2 provides a simplistic depiction of selecting the
reference cohort the aim is to identify households that
are just able to cover their needs and hence do not fall in
either extreme end of the spectrum
13
Minimum Expenditure Baskets Guidance Note | December 2020
Box 4 outlines some typical cases and presents suggestions
for how to select the cohort in a survey sampled on
the population of interest
There is a spread in the
population in terms of well-being
and a proportion is able to cover
their essential needs no
households receive assistance
A relatively large proportion of
households receive food
assistance
The vast majority of the
households are far from being
able to cover their essential
needs (prior to receiving
assistance)
Select households with an acceptable FCS23 or with adequate consumption in FCS-N
who do not use negative coping strategies (or have a high coping strategy index)
Combine or cross-check with other criteria such as dwelling quality or asset index
Exclude extreme expenditure quintiles
Exclude households receiving in-kind food assistance from the reference group (if
sample size allows) This is because any assistance that is not unrestricted cash
might influence the consumption choices of the beneficiary households (in-kind
food means a large portion of food consumption is determined by the assistance
provided not the households) However be aware that if the majority of
households receive some form of restricted assistance excluding them all from the
cohort can lead to sample size issues as well as selection bias
Alternatively to the extent possible avoid using criteria that are highly influenced
by assistance For example in the presence of food assistance the FCS of some
households might be acceptable even if they are not able to meet their essential
needs Furthermore if in-kind food is provided the consumption behaviour of such
households might be skewed as most of their food needs are already covered by
assistance
Consider using dwelling quality an asset index or other similar indicators instead
(or in combination with the FCS)
Consider using a rights-based approach since it will be very difficult to obtain a big
enough sample of households who can meet their essential needs making it
challenging to construct an expenditure-based MEB Carry out a reality check using
the survey data to understand household consumption patterns keeping in mind
that the sample represents a population not able to fulfill their essential needs
HOW TO
REFERENCE COHORT SELECTIONBox 4
Scenario Possible approach to selecting the cohortUse one or several of the below criteria
The use of sensitivity tests is highly recommended in the form
of repetitions of the expenditure analysis for different versions
of the reference cohort this will indicate the extent to which
the choice of cohort selection criteria is influencing the MEB
23 It is usually not advisable to use the FCS as a single criterion If it is used alone the indicator should be capped at a certain level above the acceptable threshold (the FCS builds on a continuous score from 0ndash112 and applies thresholds for poor borderline and acceptable consumption) This is because if all households with acceptable FCS are included this will likely also capture some households who are ldquotoo wealthyrdquo to be considered in the reference cohort
14
Minimum Expenditure Baskets Guidance Note | December 2020
See box 5 for examples of how sensitivity tests can be
conducted as well as how the reference cohort has been
COUNTRYEXAMPLE
SELECTING AND CHECKING THE REFERENCE COHORTCHAD SYRIAN REFUGEES IN LEBANON AND COXrsquoS BAZAR
EG Box 5
Reference cohort sensitivity analysis ndashCoxrsquos Bazar MEB
Table a
In Chad the calculation of an expenditure-based MEB relied on national data collected by the Government during their
annual national food security and nutrition survey The reference cohort for the MEB was selected on the basis of two
criteria FCS between 35 and 70 eg in an interval around the acceptable threshold and no adoption of crisis or emergency
livelihood coping strategies based on the livelihood coping strategies indicator These two criteria ensured that the
selected reference cohort had consumption levels that provided sufficient food security and sustainable livelihood
strategies
For Syrian refugees in Lebanon24 an expenditure-based MEB was calculated by WFP in order to review an existing MEB
Shelter plays an important role as most refugees live in an urban host community and face high rents The FCS reveals
whether people can cover their food needs but could be influenced by the presence of food assistance To ensure results
would be robust against the choice of the cohort two different approaches were compared both included households of 4
to 6 members (as the MEB under review was defined only for households of these sizes) and excluded households in
expenditure quintiles 1 and 5 In version 1 an additional criterion of acceptable FCS was included while in version 2 an
additional criterion of acceptable housing conditions was applied The results were similar for both cohort versions
A MEB was calculated in Coxrsquos Bazar Bangladesh as part of the 2019 Refugee Influx Emergency Vulnerability Analysis
(REVA-II)25 for Rohingya refugees An expenditure-based MEB was built using a large household survey that included
refugees and host community households the reference cohort also included refugees and host communities as the MEB
was meant to apply to both groups Households receiving in-kind food assistance were excluded to avoid possible bias in
consumption choices which would be reflected in the expenditure data The reference cohort was then selected based on
FCS and expenditure quintiles To ascertain that the appropriate cohort had been chosen a sensitivity analysis was
conducted which tested the effect of removing different expenditure quintiles (quintiles 1 and 5 versus quintiles 1 4 and 5)
and including different FCS ranges (FCS 42+ versus FCS 35ndash80) This showed that across different iterations of the reference
cohort total food expenditures were relatively stable while non-food expenditures went up when richer households (eg in
the higher expenditure quintiles) were included This allowed the analysts to select the cohort of households who were just
at the point where the share of food expenditures out of total expenditures began to decrease as a high share of
expenditure on food is often an indicator of vulnerability In other words the selected cohort was just at the point where
households started meeting more needs than just food and the most basic non-food requirements The consumption
patterns of this cohort -highlighted in table a below - therefore became the basis for the MEB
Indicator 1expenditurequintiles
Indicator 2FCS Sample
size Value in taka
Total MEB
Exclude quintiles 1 4 and 5
Exclude quintiles 1 4 and 5
Exclude quintiles 1 and 5
Exclude quintiles 1 and 5
FCS 35ndash80
FCS gt= 42
FCS 35ndash80
FCS gt= 42
403
296
610
474
5259
5324
5691
5740
2304
2299
2990
3082
070
070
066
065
030
030
034
035
7562
7623
8681
8822
Food MEBValue in taka Value in taka
Non-food MEB
identified in different contexts
24 Hohfeld et al 2020 25 WFP 2019
15
Minimum Expenditure Baskets Guidance Note | December 2020
3 Establish the food basketWith the reference cohort identified the food basket value
should be calculated in correspondence with the food
consumption patterns of the reference cohort
To calculate the food basket start by computing the mean
(or median) food expenditures for the chosen reference
cohort It is good practice to compute the overall food
expenditures and break the analysis down into the different
food groups or food items in order to understand how food
consumption is distributed across different foods
Next consider whether an explicit reference food basket
is needed in the MEB this is a list of the food items in the
basket and their quantities Having a reference basket
brings advantages in terms of monitoring of the cost
of the MEB (as new prices can easily be applied to the
quantities) it shows consumption patterns in quantities
and can hence help check if food consumption is adequate
at the given level of expenditures and it can help when
communicating about the MEB It can therefore be a useful
practice to establish one However in some instances
a simple monetary value for the food MEB is sufficient
This could be the case when the MEB is calculated to
review an existing MEB if reference basket is not needed
for operational purposes when time is limited or
where limited data means a reference basket cannot be
adequately calculated Wherever a food reference basket
is not needed the food MEB will simply be the mean (or
median) food expenditures by food groups or food items
as calculated above If a reference food basket is feasible
and desired the next steps depend on the level of detail in
the data available
With expenditure data and market prices a food
reference basket can be approximated using expenditures
by food group or food item and dividing these
expenditures by the relevant food prices This provides
estimates of consumed quantities Expenditures and prices
must be collected at the same time in order to arrive at
correct quantities If for example prices are collected six
months later than expenditures and prices have changed
significantly dividing expenditures by prices will produce
inaccurate estimates
Note that the level of detail and accuracy with which a
food refence basket can be established using expenditures
and prices also depends on whether expenditures
were collected at the food group or food item level Box 6
illustrates how to approximate a reference basket when
expenditures are collected at the food group level and
box 7 shows an example of a food basket estimation from
an assessment in Kinshasa Democratic Republic of the
Congo
If the expenditure module includes consumed quantities
of food in addition to expenditures a food basket can be
established directly based on the consumed quantities by
food group or food item Having data on quantities will
also enable analysts to estimate prices directly from the
survey data by dividing the household expenditure on a
particular food item by the quantity consumed This can be
advantageous as it provides a direct estimate of the prices
households actually paid (unlike a price survey which uses
typically consumed items and is often only conducted
at specific points of sale) On the other hand this may
introduce issues related to non-standard measurement
units that make prices hard to compute and aggregate26
Box 8 shows an example from Coxrsquos Bazar of how a food
reference basket can be established using item-level
expenditures and quantities from the survey data
Once the quantities consumed have been established using
one of the methods described above it is good practice to
check the calories these quantities provide and the balance in
terms of nutrients The basket should be close to the Sphere
Standard of 2100 kcal per person per day ndash if it is not one
option could be to scale the basket Use information on the
calorie content of the different food items in the basket to
calculate the total calorie content of the basket27 The quantities
in the basket can then be scaled up or down to reach 2100
kcal However bear in mind that if the reference cohort has
been well selected and the data is of sufficient quality and
detail the basket should already be close to 2100 kcal If large
rescaling is required investigate the reasons behind this For
the sake of simplification quantities can be rounded and the
basket can be streamlined by removing items with very low
consumption or nutritional value
26 Deaton and Grosh 2000 27 Calorie information of food items can be drawn from a variety of sources The Nutval tool (httpwwwnutvalnet) provides information on calories and other nutrients for a list of items Consider that the
specifications and quality of a product can influence its caloric value (eg whole fish vs fish fillet) ndash it might be necessary to adjust for this for certain items that vary widely Many food composition tables (available from FAO for different continents httpwwwfaoorginfoodsinfoodstables-and-databasesfaoinfoods-databasesen) contain a wastage factor or edible portion conversion factor to convert from edible portions into full products as they are bought on the market
16
Minimum Expenditure Baskets Guidance Note | December 2020
After establishing the reference basket and possibly rescaling
it the basket is priced This is done by multiplying the basket
quantities by the food prices The basket can be priced using
current food prices from a price survey or by estimating food
prices from the expenditure data as described earlier The
result should be close to the expenditures for the reference
cohort although differences could arise from any rescaling or
simplification of the basket
APPROXIMATING A FOOD BASKET WITHGROUP-LEVEL FOOD EXPENDITURES
Box 6
HOW TO
Data quality and granularity has a big impact on the calculation of a food reference basket If consumed quantities are not
directly available in the dataset they need to be calculated by dividing expenditures by prices However this will always
produce an approximation and the more aggregated the data on expenditures is the more approximate the results will be
In particular when the food expenditure data is available at the food group level care needs to be taken when converting
expenditures into quantities
For example to convert expenditures on the food group ldquocerealsrdquo into a reference quantity analysts need to divide cereal
expenditures by the price of cereals But how do they determine the price of cereals This is a food group not a specific item
so there is no exact price The recommended way to approach this is to determine which is the most commonly consumed
item or combination of items for each food group Then a price for the most commonly consumed item or a composite price
of a combination of items can be used to arrive at quantities So if the most commonly consumed cereals for the population
of interest are maize and rice and they are eaten in equal measure by the population the cereal quantities for the reference
basket can be calculated in the following way
Mean cereal expenditures for our reference cohort = 150 shilling
Price of rice = 18 shillingkg
Price of maize = 12 shillingkg
Composite price of rice and maize = (18 + 12) 2 = 15 shillingkg
Cereal quantity consumed = 150 shilling (15 shillingkg) = 10 kg (5 kg rice 5 kg maize)
Of course this is an approximation care needs to be taken when converting expenditures into quantities using
group-level data
Certain food groups may lend themselves more to this approximate conversion than others For example cereals
might be relatively easy to convert using this method as cereal consumption often is concentrated on a few key staples In
contrast vegetable consumption may be so diverse that conversion via prices is not helpful In this latter case one option
could be to obtain reference basket quantities for the groups that can be converted and leave other groups as expenditures
only so that the food MEB becomes a combination of quantities and expenditures
In summary to establish the food basket
i Calculate mean (median) food expenditures by food group
or item If an explicit reference basket with quantities is not
needed stop here and simply use the expenditures as the food
basket
ii Estimate consumed quantities (by dividing expenditures
by prices or directly from data if it contains consumed
quantities)
iii Check the resulting quantities and consider scaling to meet
Sphere Standards
iv Price the basket using market prices or prices derived
from the household data
17
Minimum Expenditure Baskets Guidance Note | December 2020
Table a Food reference basket ndash Kinshasa MEB
COUNTRYEXAMPLE
KINSHASA FOOD REFERENCE BASKET USINGFOOD GROUP EXPENDITURES
Box 7
In the Kinshasa urban essential needs assessment28 the food reference basket for the MEB was established as follows
Expenditure data was available at the food group level only The caloric importance of each food group (column A of the
table below) as a part of the overall food intake was determined For each of the calorie-relevant food groups the most
commonly consumed food item was then identified (eg maize in the case of cereals) (see column B) Using the average per
capita expenditure from the household survey (column C) and the market price for each food item (column D) the
quantities consumed per person per month were approximated (column E) Next the total calorie intake was calculated
(column G) For urban Kinshasa this amounts to 1967 kcal which is close to the Sphere Standard of 2100 kcalpersonday
and suggests that the expenditure data is likely to be reliable However a proportional rescaling to 2100 kcalpersonday
was done to ensure consistency with Sphere (column H) On the basis of the rescaled total calories all values were then
converted back to monthly figures to arrive at a monetary value for each food item (columns I and J) In addition to the
calorie-relevant food items the mean expenditures on other food categories that households regularly consume were
added (vegetables fruit etc) As these food items represent little overall share of peoplersquos calorie consumption (given the
quantities consumed or the type of the foods) they were not included when calories were calculated Furthermore it would
be difficult to select specific food items in each of these categories as they are quite diverse (eg vegetables) However as
most households still consume these food items as part of their usual diet and they provide important micronutrients their
costs need to be reflected in the food MEB The mean expenditure on these food categories was therefore used as a
good-enough approximation for householdsrsquo consumption of these food groups Meals consumed outside the household
were excluded from the MEB as they were not considered essential
Food
grou
p
Food
item
per
capi
ta a
vm
onth
ly e
xp
Pric
e(f
ranc
kg)
kg c
ons
per
mon
th =
CD
food
item
kca
lpe
r 10
0g
kcal
con
s p
er d
ay=(
EF
10)
30
kcal
per
day
res
cale
d=G
(21
001
967)
kg p
er m
onth
res
cale
d=(
H(
F10
))30
roun
ded
MEB
food
-bas
ket
(fra
nc)=
ID
6898
1808
2089
2341
4306
1817
2826
833
799
2509
2144
900
500
1300
2300
2500
2200
77
36
16
10
17
08
920
412
179
302
44
110
1967
360
342
335
890
76
400
TOTAL
982
440
192
322
47
118
2100
82
39
17
11
18
09
7400
1900
2200
2500
4600
1900
2800
800
800
2500
27400
A B C D E F G H I JCereals
Tubers
Pulses
Oilsfats
Meatfish
Sugars
Vegetables
Fruit
Dairy
Condiments
Meals out-
side home
Maize
Cassava
Beans
Veg Oil
Fish
White sugar
Vegetables
Fruit
Dairy
Condiment
Meals out-
side home
29 WFP 2019 Also see box 5
18
Minimum Expenditure Baskets Guidance Note | December 2020
COUNTRYEXAMPLE
COXrsquoS BAZAR FOOD REFERENCE BASKETWITH DETAILED EXPENDITURE AND QUANTITY
Box 8
In the MEB for Coxrsquos Bazar calculated as part of the REVA II assessment expenditures and consumed quantities were
available for 87 food items which formed the basis for the consumption aggregate While the expenditure data was used to
select the appropriate reference cohort the reported quantities were used to determine household calorie intake
Quantities were reported at the food item level and consumed calories were calculated for each item The items were then
categorized by food group (cereals pulses oilsfats vegetables etc) and the total calories from each group were
calculated To create an operationally relevant reference basket without very large numbers of food items the number of
items in each food group were reduced where possible For example 95 percent of the calories that households get from
the food group ldquocerealsrdquo come from rice The cereal food group was therefore simplified to rice only keeping the total
calories sourced from cereals constant and adjusting the quantity of rice in the basket slightly upwards For pulses the four
main consumed items were identified and calories and quantities proportionally adjusted For other food groups such as
vegetables the variety of items consumed within the group was too great to simplify items to a small number for this
group no items were assigned and instead total expenditures on vegetables for the reference cohort were used directly in
the food MEB The total calories of all items were taken into account The resulting basket was close to 2100 kcal so only
minor rescaling was undertaken to arrive at final reference basket of 2100 kcalpersonday
Once the final basket had been determined quantities were priced using median prices derived from the household data
(by dividing expenditures by purchased quantities for the relevant items)
For vegetables fruits meat dairy and condiments expenditures are used directly in the food MEB (converted into monthly per
household values) For all other items quantities per capita per day are multiplied by the item median price (as derived from
the household data) and converted into monthly per household values
The MEB uses household size 5
Note The MEB for Coxrsquos Bazar was calculated for analytical purposes for the REVA II assessment It is not the operational MEB used
for the district
Foodgroup
Fooditem
Consumedquantity(grammescapitaday)
Calories(kcalcapitaday)rescaled
Median prices(takakg)
Value in MEB(taka per HHmonth)
424
14
7
2
1
182
6
81
1
33
6
28
1527
48
27
8
4
78
5
85
1
294
24
0
2100
30
80
60
40
80
-
-
-
-
80
60
-
1909
168
67
14
13
1065
48
1600
15
392
57
345
5691
Cereals
Pulses
Pulses
Pulses
Pulses
Vegetables
Fruit
Meat
Dairy
Fats
Sugar
Condiments
TOTAL FOOD
Rice
Lentil
Chickpea
Anchor daal
Mung
none
none
none
none
Soybean oil
Sugar
none
Table a Food reference basket ndash Coxrsquos Bazar MEB
19
Minimum Expenditure Baskets Guidance Note | December 2020
4 Establish the non-food basketOnce the food component has been established a non-
food component is added There is no wholly satisfactory
way to add a non-food component as it can be difficult to
define an essential minimum Unlike food needs many
non-food needs are often more contextual and are not
easy to anchor in a specific universal threshold (like the
food Sphere Standard of 2100 kcal per person per day)
While Sphere Standards exist they often need to be
contextualized and may not cover all non-food essential
needs
The non-food basket can be established with different
levels of detail depending on the available data and the
level of granularity desired
As for the food expenditures start by calculating the
mean (andor median) non-food expenditures for the
reference cohort If the expenditure data is detailed it can
be used to identify specific non-food needs Expenditures
can be analysed by non-food group (eg shelter hygiene
or transport) to design a non-food basket composed
of group-specific expenditures The precise non-food
components can vary by context but would generally
include the components discussed in the section on
the rights-based MEB below Some non-food items that
expenditure data has been collected for might need to be
excluded for the purpose of constructing the MEB (eg
tobacco which is hard to consider an essential need)
In theory it would be possible to establish a non-food
reference basket with specific quantities using the same
method as for food ie by dividing expenditures by prices
to arrive at quantities However this is usually not feasible
for non-food goods and services simply because non-food
expenditure data is often much harder to break down into
specific items than food expenditure data For instance
even if expenditures on clothing or transportation
are known relating this to exact clothing items or
transportation services and then obtaining accurate
prices for those itemsservices will often prove difficult if
not impossible Therefore as a general recommendation
in the expenditure-based approach when non-food
expenditure data is not available at the item level it is
best to keep the non-food basket to expenditures and not
provide quantities If reliable market price information on
relevant non-food items is available total expenditures
could be checked against prices to obtain an approximate
idea of the adequacy of the non-food expenditures
Particular groups of non-food expenditures may require
special attention due to their nature Box 9 highlights a
few examples
TIP BOXNON-FOOD EXPENDITURES ndashEXPENDITURES OF PARTICULAR INTEREST
$$
$
Box 9
Shelter expenditures can be a tricky component to deal with especially for urban populations If the share of the
population who rent accommodation is significant rent will typically be included in the MEB as it is the cost of shelter an
essential need Indeed it can form quite a significant part of the MEB However if the resulting MEB is compared to actual
expenditures to determine whether households fall below the MEB those who own their dwelling and therefore do not pay
rent might be classified as unable to cover their needs just because they do not have any major shelter expenditures
Therefore large single expenditures such as rent should be included with care and context will determine how shelter
expenditures are handled in the MEB Generally speaking if no or very few households in the population of interest have
major shelter expenditures such as rent this component should be left out of the MEB and no attempt made to impute it
(as is sometimes the case in poverty line estimations) If the majority of households rent their dwellings it is advisable to
include mean rent expenditures in the MEB The trickier case is when the households in the population of interest are split
between a significant number of households living in owned or no-rent housing and a significant number paying rent ndash
here it is difficult to reflect shelter expenditures adequately in the MEB Simply using mean rent estimations in the MEB will
underestimate the need for the renters while overestimating it for those who own their housing or do not pay rent In this
case insofar as data allows one solution could be to impute rent expenditures for the non-renters by estimating the
would-be rental cost for the type of housing they live in Doing this typically requires a housing module in the household
survey that contains information on ownership and types and sizes of housing so rental equivalents can be computed and
imputed for the non-renters
20
Minimum Expenditure Baskets Guidance Note | December 2020
NON-FOOD EXPENDITURES ndashEXPENDITURES OF PARTICULAR INTEREST
$$
$
Box 9
Health expenditures can also be challenging to capture adequately in survey data as such expenditures are often irregular
in nature Bear in mind that health expenditures usually consist of payment for goods such as medicines and for services
such as visits to the doctor When analysing the expenditures and deciding how to include them in the MEB consider which
services may be provided free of charge and what households pay themselves and at what cost30
Care should be taken when it comes to the underreporting of expenditures and treatment of expenditures that are
irregular in nature Remember that the MEB should include all recurrent essential needs but it typically does not include
one-off expenditures ldquolumpy expendituresrdquo such as marriage expenditures or dowries or investments Expenditures
on durables (for instance the purchase of vehicles or large household appliances) are also not included (in national poverty
lines the rental value of the durables owned by households adjusted for depreciation is sometimes included31 however
this is not recommended for MEB calculations)
Household expenditures on savings taxes and debt repayment are not usually included in the MEB as these types of
expenditures do not reflect actual consumption
Tobacco and alcohol are often included in expenditure surveys While households may choose to spend money on these
items they can fairly be assumed to be non-essential and are generally not recommended for inclusion in the MEB
The ldquoquick fixrdquo if data is very limited If the expenditure
data has no or very insufficient data on non-food
expenditures a ldquoquick fixrdquo solution is to use the average
non-food expenditure share of total expenditures This can
often be obtained from external sources such as monitoring
reports or food security assessments This is then added
COUNTRYEXAMPLE
Table a Non-food basket ndash valuesCoxrsquos Bazar
Value in MEB (takaHHmonth)
Non-food group
Toiletries and cleaning
Clothes shoes and towels
Cooking equipment
Education
Fuel and electricity
Medical treatment
Household textiles and small repairs
Communication
Transport
Total non-food
461
521
25
134
775
447
57
274
295
2990
Figure a Non-food basket ndash distribution Coxrsquos Bazar
Note The MEB for Coxrsquos Bazar was calculated for
analytical purposes in the REVA II assessment
It is not the operational MEB for the district
9Communication
10Transport
2Householdtextiles and
small repairs
15Medical
treatment
26Fuel andelectricity
5Education
1Cooking
equipment
17Clothes shoes
and towels
15Toiletries
and cleaning
EXPENDITURE-BASED NON-FOOD REFERENCEBASKET EXAMPLE FROM COXrsquoS BAZAR
Box 10EG
to the cost of the food basket to arrive at the total MEB
However when using an additional data source analysts
should understand how the average share of non-food
expenditures has been calculated and what sample it has
been derived from as it may not reflect the consumption
patterns of the reference cohort
30 The WHO and Global Health Cluster guidance on health expenditures in the MEB has some useful insights into household health expenditures See WHO and Global Health Cluster ndash Cash Task Team 2020 31 Deaton and Zaidi 2002
21
Minimum Expenditure Baskets Guidance Note | December 2020
52 The rights-based approachIn humanitarian contexts ldquoessential needsrdquo have been
understood as referring to access to full rights as set out by
international humanitarian law and the Humanitarian Sphere
Standards The term ldquorights-based MEBrdquo is derived from
this understanding According to the operational guidance
on multipurpose cash grants32 international humanitarian
and human rights law protects the right of crisis-affected
persons to food33 drinking water soap clothing shelter and
lifesaving medical care Humanitarian Sphere Standards
builds on this definition and outlines minimum humanitarian
standards in the areas of food security and nutrition
shelter and settlement health and WASH (water supply
sanitation and hygiene)34 In some contexts residency or legal
documentation is also included Humanitarian standards
for education are outlined in the Education in Emergencies
Minimum Standards Handbook35
The rights-based approach entails defining a detailed list
of the food and non-food items that make up the MEB
reference basket and pricing them using current market
prices MEBs built by the Interagency Cash Working Group or
other interagency coordination forum are often constructed
following the rights-based approach with each sector or
cluster contributing to the needs in their respective sectors
In these cases WFP is usually responsible for defining the
food component of the MEB For both food and non-food
items the reference basket is typically produced or cross-
checked through focus group discussions with the population
of interest partners and key informants It is usually put
together based on the needs of an average-sized household
1 Establish the food basketTo construct the food basket for a rights-based MEB compile
a list of food items and their quantities The Sphere Standards
offer a useful starting point recommending a diet of 2100
kcal per person per day with 10ndash12 percent of daily energy
intake from protein and 17 percent from fats36 The food
basket should be adapted to local diets and preferences
2 Establish the non-food basketOnce the food basket has been established a non-food basket
should be added In the rights-based approach this is typically
done by quantifying needs by producing a list of items by
sector Some examples are found below
Shelter This is the cost of accommodation that meets
basic shelter needs and rights What this means in practice
will depend on the context driven for example by weather
conditions and what is realistically available to the population
Utilities These include the cost of basic utilities such as safe
drinking water and depending on the context electricity
Non-food items These reflect basic household needs
related to cooking clothing and hygiene plus other general
household items Cooking gasfuel or firewood is often
included In line with the definition of the MEB the list should
focus on recurrent needs In practice these non-food items
can look very different depending on the context 38
Services This includes the costs of accessing basic services
such as healthcare education transport and communication
Healthcare costs are often difficult to quantify since they
are inherently irregular large and unpredictable Typically
however only basic minimum needs are covered in the MEB
such as eg two visits per year to the doctor expenses for
critical events deliveries and medicines are sometimes also
included Note that even if a need is not covered by the MEB
it does not mean that these needs do not need to be met for
the population of interest Health can be an example of this
health needs are often better met through service provision
than purchased through the market and therefore may
be only partially reflected in the MEB However guidance
from WHO and the Global Health Cluster notes that people
tend to have some level of health expenditures even when
COUNTRYEXAMPLE
SHELTER IN THE MEBFOR SYRIAN REFUGEES
EG Box 11
For the Syrian refugee operation in Turkey the MEB
includes the costs of shelter that meets certain
standards such as a minimum of 35 m2 per
person access to a toilet and running water
32 UNHCR et al 2015 33 Defined as energy needs not considering full nutrient needs (protein vitamins minerals etc) 34 See the Sphere Standards Handbook 35 INEE 2010 36 Further recommendations on micronutrient requirements can be found in the Sphere Standards Handbook37 Hobbs 201638 For some refugee contexts the Office of the United Nations High Commissioner for Refugees (UNHCR) has lists of specific items which can be considered for the MEB
22
Minimum Expenditure Baskets Guidance Note | December 2020
policies are in place that require the free public provision of
health services39
Education costs usually cover school fees materials
uniforms and transport depending on what households
have to pay themselves and what is publicly available
Transport and communication needs are often defined as
the average transport and communication costs reported by
household surveys and then validated with the communities
COUNTRYEXAMPLE
EXAMPLE OF A RIGHTS-BASED MEBFOR NORTHEAST NIGERIA
Box 12EG
The northeast Nigeria cash working group designed a MEB for a household of seven people40 the resulting reference
basket is shown below
Sectorgroup
Item Quantity(7 pers HH)
Sectorgroup
Item Quantity(7 pers HH)
Cooking fuel
WASH
Cooking fuel
WASH
Transportation
Communication
Health
Education
Firewoodbriquette
charcoal
Water + vendor fee
Bathing soap
Laundry soap
Sanitary pads
Firewoodbriquette
charcoal
Water + vendor fee
Bathing soap
Laundry soap
Sanitary pads
Rides
Airtime 500 NGN
Average expense
Pen
Pencil
Notebook
1 bag
158 jerrycans
13 bars
3 bars
4 packs
1 bag
158 jerrycans
13 bars
3 bars
4 packs
10 rides
1
7 pers
3 pcs
3 pcs
3 pcs
Table a MEB example northeast Nigeria
27 kg
45 kg
135 kg
18 L
27 kg
18 kg
36 L
09 kg
144 kg
2 kg
2 kg
1 kg
05 kg
12pcs
1L
Food Rice
Maize
Beans
Palm oil
Groundnuts
Sugar
Vegetable oil
Salt
Onion
Non-leafy vegetables
Leafy vegetables
Fruits
Meats
Chicken eggs
Vinegar
communication needs can also be specified as the cost of a
SIM card with a certain amount of data or airtime
3 Price the reference basketWith the food and non-food reference baskets established
the list of items and quantities are now priced using updated
prices from markets relevant to the population of interest
The pricing should be done based on actual current market
prices This produces the final rights-based MEB
39 WHO and Global Health Cluster ndash Cash Task Team 2020 40 Cash Working Group Nigeria 2018
23
Minimum Expenditure Baskets Guidance Note | December 2020
MEB APPROACHES ndash CONSTRUCTION SUMMARYBox 13
HOW TO
Rights-based approach
Establish the food basket
Define a list of relevant and locally preferred and
available food items and their quantities The Sphere
Standards can be used as a reference
Establish the non-food basket
Define a list of essential non-food items relevant to the
population of interest and their quantities Services such
as education or transport can also be included The list is
usually put together sector by sector
Price the basket
Use current market prices for the food and non-food
items in the reference baskets to calculate the price of
the basket Use prices from markets relevant to the
population of interest
1
2
3
4
1
2
3
Expenditure-based approach
Prepare the expenditure data
Ensure the data is cleaned Compute expenditures by
combining cash and credit expenditures the value of
consumed own production and consumed assistance
for both food and non-food expenditures Compute
expenditures as per capita figures
Select the reference cohort
Identify households ldquojust able to meet their essential
needsrdquo using indicators such as FCS FCS-N housing or
others excluding households in extreme quantiles of
expenditure distribution or other criteria or
combination of criteria Check the sensitivity of the
results to the selection of reference cohort
Establish the food basket
Calculate mean (median) food expenditures by food
group or item Either stop here or ndash to obtain a refence
basket ndash estimate consumed quantities check the
calorie content of the resulting quantities and consider
scaling them to Sphere Standards Price the basket
using market prices or prices derived from the
household data
Establish the non-food basket
Calculate mean (median) non-food expenditures by
non-food group or item If item-level data and prices
are available it is possible to derive a non-food
reference basket using same methodology as for the
food basket otherwise the non-food basket will
comprise the expenditures at the group level If a
quick-fix solution is needed add the average household
non-food expenditure share to the food MEB
53 Summary and data needs for expenditurendashbased and rights-based approachesBox 13 summarizes the steps to follow in order to construct a
MEB using an expenditure-based or a rights-based approach
24
Minimum Expenditure Baskets Guidance Note | December 2020
Qualitative understanding
of essential needs for the
population of interest
Representative household
survey with detailed
expenditure module
List of ldquorights-basedrdquo needs
Price information
Focus group discussions with key informants or population
of interest
Literature review of existing information on the essential needs of
the population of interest
WFP essential needs assessment emergency food security
assessment or comprehensive food security and vulnerability
analysis or other representative pre-assistance baseline survey
National household budget surveys household income and
expenditure surveys living standard measurement surveys or
other large-scale household survey
Clusters Cash Working Group other interagency forum
Sectoral assessments other secondary information
Price data series covering the area of interest for relevant food
and non-food items and services from WFP (Dataviz41 has
up-to-date price information) or partners
Price indices from national statistical offices
Prices derived from household expenditure data where quantities
are also reported
Suggested sources Expe
ndit
urendash
base
d
Righ
tsndashb
ased
INFORMATION NEEDS AND SOURCESMEB APPROACHES
Box 14
HOW TO
Information need
TIP BOXWHAT IF DATA USINGA HOUSEHOLD ECONOMY APPROACH IS AVAILABLE
$Box 15
The household economy approach (HEA) developed by Save The Children is commonly used for analysing food security and
livelihoods It is based on understanding how households normally access income food and other itemsservices required
for survival established through a baseline analysis As part of the baseline the HEA defines livelihood zones where
households share similar strategies for obtaining food and income It also distinguishes households within these livelihood
zones in at least three (often four and sometimes more) wealth groups The HEA baseline quantifies the sources of food
and income and the expenditure patterns for each wealth group and livelihood zone
The information collected on expenditures can be used as a data source for calculating a MEB However due to the relative
nature of the wealth cut-off points used there is no set standard regarding which group should be the reference for the
MEB If HEA data is utilized it is important to understand how it was collected ndash the HEA is simply an analytical framework
not a set method of data collection Thus while HEAs are often conducted through qualitative methods (eg focus group
discussions) they may also be based on quantitative modules in household surveys The latter yields more rigorous
information however qualitative data can be used but should be cross-checked or triangulated with other sources
39 See VAM data portal at httpsdatavizvamwfporg
25
Minimum Expenditure Baskets Guidance Note | December 2020
54 Expenditure-based or rightsndashbased approach Pros and consThere are advantages and disadvantages to both types of
approach which should be kept in mind when constructing
the MEB
The expenditure-based approach has the advantage that it
directly reflects the actual demand of the population of interest
as it uses survey data to examine peoplersquos consumption
behaviour It is also fairly straightforward to carry out if good
survey data on the population is available One disadvantage is
that it can be difficult to put into practice when the population
of interest is generally poor (such as in a pre-assistance
refugee situation) because the number of households who can
constitute the reference cohort can be too small to analyse
Also care has to be taken when looking at expenditure patterns
only as the reference cohort may not always cover all of their
essential needs to a desired level (from a ldquorightsrdquo perspective)
For example the food patterns for those ldquojust able to meet
their essential needsrdquo may not always be very nutritionally
diverse as they are based purely on consumption behaviour42
In general the expenditure-based approach should not be applied
without good quality household expenditure data
TIP BOX ADVANTAGES AND DISADVANTAGES OFDIFFERENT APPROACHES TO ESTABLISHING MEBS
Box 16
Pros
Cons
Expenditure-based Rights-based
Straightforward to carry out if household data
is of good quality
Builds on actual consumption patterns of the
population of interest
Difficult to identify reference cohort if
everybody is poor
Survey data may not capture all essential needs
fully from a ldquorightsrdquo perspective
Survey data is not needed
Effective demand can be different from identified
needs leading to a MEB that does not reflect
actual demand and making comparison with
monitoring data tricky
Contains incentives to inflate sector-specific needs
The advantage of the rights-based approach is that
it can be used to construct a MEB without survey data
(although survey data is needed to monitor the MEB) One
disadvantage is that the effective demand of households
can look quite different from the basket that results from
this approach Another disadvantage is that particularly
when constructed in an interagency setting a rights-based
MEB can easily become an instrument for different partners
to compete for and secure funding There is a substantial
incentive to include excessively high sectoral needs if sector-
specific interventions are envisaged Finally if the MEB is
very detailed but the expenditure module in the household
surveys used to monitor peoplersquos expenditures against the
MEB is very crude comparison is difficult and therefore the
practical use of the MEB can be limited Many households
may fall below the MEB simply because of the discrepancy in
methods between the MEB and the monitoring data This is
similar to the issue previously discussed regarding the use of
national poverty lines
Box 16 summarizes the advantages and disadvantages of the
two approaches
42 A study conducted in Nepal showed that the food poverty line is well below the so-called ldquonutrient povertyrdquo line (see Geniez et al 2014)
26
Minimum Expenditure Baskets Guidance Note | December 2020
6 Arriving at a realistic and operationally relevant MEBRegardless of which processes and approaches are used to
construct the MEB it is crucial to arrive at a final result that
is a realistic picture of the cost of essential needs for the
population of interest rooted in actual consumption
behaviour This section looks at how approaches can be
combined to generate a hybrid MEB and how the result can be
ldquoreality checkedrdquo and validated
61 Combining approaches the hybrid MEBAs described in section 54 there are disadvantages to the
expenditure-based and the rights-based MEB approaches that
can affect the final MEB One way to overcome this challenge
may be to combine information from each approach in
a ldquohybridrdquo MEB This means making sure that the MEB is
consistent with the actual consumption behaviour of the
population of interest as found in expenditure data while
keeping the rights-based lens There is no one way to go about
this the method is subject to the availability of expenditure
data and other information on essential needs as well as the
objective of the MEB
When good quality expenditure data with a large enough
sample size is available for constructing the MEB it is good
practice to use the expenditure-based approach as a basis
for the analysis as far as possible If the expenditures of
the reference cohort are subsequently found not to reflect the
costs of covering certain essential needs for the population of
interest rights-based information should be used to reinforce
the MEB with a hybrid model If expenditure data is not
available and cannot be collected a rights-based MEB can be
constructed but should be cross-checked against any available
household-level information on consumption patterns
When starting with the construction ofan expenditure-based MEB
Did the household survey capture all essential needs or
are some not included in the data at all
If some needs are wholly overlooked consider using
rights-based information to capture them but ensure these
needs are actually in demand by the population of interest
and only missing because the survey did not capture them
Are the expenditures that are typically trickier to capture
well reflected and are the reference cohortrsquos expenditures
on them adequate from a rights-based perspective
For example if education expenditures are completely
inadequate for the reference cohort (and this is not because
the reference cohort selected is ldquotoo poorrdquo) consider using
rights-based information to capture them eg by using the
cost of school fees or school supplies like books or
uniforms
Be particularly careful with the inclusion of needs where the
supply of goods or services is far from adequate or may be
inexistent The MEB needs to ultimately reflect consumption
behaviour so adding goods or services that are not
available to the population of interest or not in demand
will lead to an unrealistic MEB
When starting with the construction ofrights-based MEB
Are the identified needs in line with the actual
consumption patterns of the population of interest
Check the reference baskets against any available
information on demand and consumption and adjust items
and quantities to reflect actual consumption patterns This
could be done using data on consumption shares by food
group and non-food group for example
Are there needs that people consider essential and choose
to spend resources on but are not captured by any sector
Check the reference baskets against any available
information on demand and consumption and adjust items
and quantities to reflect actual consumption patterns
The key to constructing a hybrid MEB lies in triangulating
information and asking the right questions during the
analysis When constructing a MEB consider the following
27
Minimum Expenditure Baskets Guidance Note | December 2020
Box 17 contains examples of hybrid MEBs constructed in different contexts
COUNTRYEXAMPLE
HYBRID MEBS IN URBAN SETTINGS IN KINSHASATHE DEMOCRATIC REPUBLIC OF THE CONGOAND FOR SYRIAN REFUGEES IN TURKEY
Box 17
For the MEB calculated as part of an urban assessment in Kinshasa43 a hybrid approach was chosen to deal with
hard-to-capture but essential expenditures such as health and education Health costs are often difficult to estimate as they
are not regular and when they do occur they often make up a large share of monthly expenditures The analysts decided to
estimate health costs through a rights-based approach instead of using expenditures from the survey Qualitative
information from key informants was used to define the cost of one doctorrsquos visit per year for each household member In
each commune the median cost was between CDF5000 and CDF6000 per visit this was represented in the MEB as
CDF500 per household member per month Over-the-counter medication was also included as part of health-related
expenditure through the addition of a per-capita expenditure of CDF1500 every two months sufficient for a course of
antimalarial drugs or antibiotics and simple medication such as painkillers or anti-inflammatory drugs
In Turkey expenditure and price data from different sources was used to assess update and adjust an existing
rights-based MEB44 for Syrian refugees living in the country A hybrid food basket was calculated using detailed information
on the consumption behaviour of Syrian refugees in Lebanon collected through itemized receipts from food assistance
e-cards The resulting food basket was triangulated with the less detailed information available from a household survey on
Syrian refugees in Turkey The results showed strong consistency between consumption behaviour of both groups
The resulting food reference basket for the MEB was then priced with official price statistics data and inserted into the
rights-based MEB Quantities of non-food items were kept as before but updated with current price data To ensure that
the MEB reflected consumption behaviour expenditure shares were triangulated with household data See table a
To value and update the MEB price data was required The official price statistics included higher quality items and brands
consumed more by the average Turkish population than by the poorer refugees To correct for this the difference between
the price of the MEB and the food expenditures of a non-poor cohort were assessed and a correction factor applied to
compensate for the overestimation of the updated MEB
Commodity
Table a Food reference basket ndash MEB for Syrian refugees in Turkey
Daily ration perperson in gram
Dailykilocalorie
Old referential food basketDaily ration perperson in gram
Dailykilocalorie
Revised Turkey food basket
150
200
50
20
30
40
20
8
30
30
5
0
0
0
0
540
684
186
29
65
137
0
28
116
265
0
0
0
0
0
100
50
0
70
0
50
30
50
50
25
5
250
50
30
5
Rice white medium grain
Bulghur wheat
Pasta
Egg whole chicken fresh
Poultry
Beans dried
Cucumber
Cheese canned
Sugar
Oil sunflower fortified
Salt iodised
Bread made from wheat
Yoghurt whole milk (leban)
Tomatoes red ripe
Tea black nutrients per 100ml of brewed tea
360
171
0
100
0
170
0
178
194
221
0
675
31
5
0
Total Kcal 2050 Total Kcal 2104
43 WFP et al 201844 WFP 2018
28
Minimum Expenditure Baskets Guidance Note | December 2020
62 Reality checks and validation with stakeholdersIn addition to asking the right questions of the data as
described in the previous section it is crucial to reality check
results when constructing the MEB This means understanding
whether the MEB provides a picture of the cost of living that
matches the reality on the ground
First of all it is important to check the MEB result with the
real circumstances of the population of interest Focus group
discussions andor key informant interviews can be held when
starting work on the MEB and after a result is obtained in
order to ensure that the MEB is a true reflection of needs and
priorities
The MEB figures can be compared with the national poverty
line ndash even if it is not advisable to use the poverty line directly
as the MEB it is good practice to check the MEB results against
it They can also be checked against any social assistance
transfer values provided in government programmes the
minimum wage or the casual labour rate or any other
information available about needs and cost of living For
instance if the MEB is much higher than what the wages
from one month of work for a typical household can buy
that could indicate that it needs adjustment and that some
of the analytical steps need to be revisited ndash as long as the
wage rate itself is reasonable The same goes for the poverty
line ndash if the two are very far apart it could be a sign that the
MEB analysis should be crosschecked Perhaps the reference
cohort was not adequately selected some sectoral needs were
overestimated or there is a large proportion of consumption of
own production has not been properly taken into account
Something that is often of particular interest is the nutritional
composition of the food part of the MEB As seen above MEB
construction typically starts from the Sphere requirement of
2100 kcalpersonday However since the MEB follows the
actual consumption behaviour of the population of interest
(especially when following an expenditure-based approach)
the resulting food basket reflects what households actually
eat which is not necessarily a nutrient adequate diet If the
basket is found to be very low in essential nutrients it could
be that the reference cohort was not well selected and a
wealthier cohort with a more balanced diet at the 2100 kcal
personday threshold might need to be identified45 However
selecting better-off households will not necessarily lead to a
more nutritionally balanced basket as food preferences are
influenced by a range of factors in addition to budget
Analytical tools to determine the cost of nutritious diets
include Cost of the Diet (CotD) developed by Save the Children
UK and used by WFP in the Fill the Nutrient Gap Analysis
CotD uses linear programming to establish the lowest cost
diet that can meet requirements for energy protein fat and
13 micronutrients for individuals in a population considering
age gender body weight physical activity level and whether
a woman is pregnant or breastfeeding CotD can be thought
of as the lowest cost of an optimal diet considering individual
requirements It is therefore useful in illustrating the needs
of vulnerable populations and their nutrient intake barriers
However it is important to keep in mind that a MEB food
basket may not deliver adequate nutrient intake when used
to set a transfer value for households even if aligned with
an optimal diet As noted above because of household
consumption choices and food allocation within households
having more money to spend may not necessarily lead
households to buy more nutritious food
MEBs should be first and foremost built on consumption
patterns that reflect actual behaviour A large difference in
cost between the MEB food basket and CoTD may hence
be driven by factors such as low availabilityhigh cost of
nutritious foods or household preferences The WFP technical
note on Fill the Nutrient Gap and minimum expenditure
baskets offers further insights into the complementarities
of the two analyses and how to use them on conjunction for
programming purposes46 When a MEB is operationalised
additional nutritional considerations could be necessary
It is important to check the MEB result with the real circumstances of the population of interest Focus group discussions andor key informant interviews can be held when starting work on the MEB and after a result is obtained in order to ensure that the MEB is a true reflection of needs and priorities
45 Note that the 2100 kcal Sphere Standard for daily diet is an estimate based on a population average Nutrient needs vary across the lifecycle It is also recommended that a food basket based on the 2100 kcal threshold should include a minimum of between four and five different food groups
46 Also see WFP 2020b
29
Minimum Expenditure Baskets Guidance Note | December 2020
COUNTRYEXAMPLE
TURKEY NON-FOODBASKET MEBCOMPOSITION VERSUSACTUAL CONSUMPTION
Box 18
In the original rights-based MEB constructed for the
Syrian refugee operation in Turkey 17 percent was
devoted to education expenditure The average
education expenditure share in the pre-assistance
expenditure data was under 2 percent with little
variation by household vulnerability status50 The
large expenditure share in the MEB reflects the
costs for transportation to schools in rural areas
where no buses are available and where the only
way for households to send children to school is to
hire private transport In order to provide for
childrenrsquos right to education the transport costs are
counted for in the MEB
Since the MEB was constructed to assure full access
to all rights the high education expenditure was
justified However a comparison of the theoretical
costs for basic needs as estimated by humanitarian
partners and the actual consumption choices of
households can reveal divergence Even if
households are assisted there is nothing to say that
they will actually start hiring private transport to get
their children to school ie the principal ldquoneedrdquo
identified by humanitarian actors will not necessary
translate into effective demand if the MEB is used as
a basis for transfer value calculations While an
important access problem has been identified other
complementary interventions will likely be needed
to address it
depending on the objective of a particular intervention and
the choices targeted households are likely to make regarding
food and nutrition once they receive a transfer Targeted
nutrition interventions may be needed such as providing
certain nutritious foods for specific groups (through in-kind
assistance or commodity vouchers) and social behavioural
change communication to nudge people towards making
better choices for health and nutrition47 Expenditure data can
be helpful to understand the consumption patterns of people
at different points of the wealth distribution Fill the Nutrient
Gap analysis also examines packages of blanket and targeted
household interventions to estimate the most cost-effective
way to address the nutrient requirements of different target
groups For further considerations including complementary
programming please consult the WFP interim guidance on
transfer values48
MEBs are often constructed in an interagency context such
as the Cash Working Group which helps facilitate dialogue
and validation from the beginning of the process However
sometimes not all clusters or key partners are engaged in such
forums which can limit the buy-in and understanding of the
MEB unless there is adequate consultation It is also essential
to consult government stakeholders and development
partners Endorsement by government counterparts could be
needed if there are existing government safety nets or policies
regarding minimum wages For example if the population of
interest for the MEB are refugees or IDPs and a transfer value
based on the MEB is higher than the social assistance provided
by the Government to the resident population this could be a
point of contention Development partners might also wonder
why a MEB is needed in addition to the national poverty line
Dialogue and validation of the final MEB with partners is
therefore vital49
47 The Fill the Nutrient Gap (FNG) analysis of which CotD is often part can help understand what programming might be needed and how interventions can be combined to improve dietary intake and reach food and nutrition objectives
48 WFP 2020c49 The Cash Learning Partnershiprsquos MEB Tip Sheet contains useful advice on the interagency processes around constructing a MEB Baizan and Klein 201950 Hobbs 2016 and WFP 2018
30
Minimum Expenditure Baskets Guidance Note | December 2020
Naturally the needs of a household increase with the size of
the household How can the different magnitude of needs
for households of different sizes be taken into account when
constructing the MEB
One simple approach is to calculate the per capita MEB
and simply scale it up for households of different sizes For
example if the MEB is constructed for a household of six and
equals USD 120 the per capita MEB would be USD 20 USD and
the MEB for a household of three people would be USD 60
However this proportional scaling ignores one important
factor while the needs of a household grow with each
additional member the increase may not be proportional
This is because some goods consumed within a household
such as food are ldquoprivateldquo in character ndash once a person has
consumed it no one else can consume the same ndash while other
goods such as housing are ldquocommonrdquo or ldquopublicrdquo meaning they
can be shared among household members Hence the needs
for housing space or electricity are not necessarily three times
higher for a household with three members than for a single-
person household This is called economies of scale Changes
in household composition can also influence how needs
grow with household size consider large households with
many children who do not have the same needs as adults
Economies of scale are particularly relevant in contexts where
shared goods constitute a major part of household essential
needs for example where rent payment is a large expense A
one-bedroom apartment may be necessary for a one-person
household but could also possibly house a family of three
who would then share the expenditure When in a context of
large economies of scale the MEB is adjusted to household
size by scaling up average per capita needs proportionally
to household size the resulting MEB will underestimate
the needs for small households and overestimate the
needs for large households by construction This is because
the per capita needs for small households are larger than
this simple scaling reflects This can have implications if the
per capita MEB is used to inform targeting or transfer value
calculations For instance if the needs of smaller households
are underestimated they are more likely to be miscategorized
as being able to meet their essential needs and might therefore
not receive the assistance they require
7 Accounting for household composition and economies of scale
Expenditures
Household sizeno economies of scale expenditures proportional to household sizeeconomies of scale expenditures non-proportional to household size
1 2 3 4 5 6 7 8 9 10
EXPENDITURES PER CAPITA
Figure 3 Economies of scale and expenditures per capita ndash illustration of the concept
31
Minimum Expenditure Baskets Guidance Note | December 2020
In other contexts economies of scale might be smaller
because of the higher relative importance of ldquoprivaterdquo goods
such as food and certain non-food items (for example soap)
or if shared costs such as shelter are not prominent How
household size is catered for in the MEB ultimately depends
on context and how needs are related to household size
Some suggested steps to account for economies of scale and
household composition are listed below
When examining how to account for different household
sizes in the MEB start by ascertaining whether economies
of scale exist and to which extent51 Figure 3 provides a
hypothetical illustration of two extreme cases no economies
of scale at all and strong economies of scale If there are no or
little economies of scale the per capita expenditures will be
very similar across household sizes while they will decrease
by household size if economies of scale are present52
Plotting per capita expenditures against household size
helps enable for this type of examinations It can be useful
to further disaggregate the analysis into different categories
(for instance food non-food or shelter expenditures per
capita) to understand which expenditures might be driving the
economies of scale if present
Box 19 illustrates two different country examples
expenditures by household size for Syrian refugees in
Lebanon and for vulnerable populations in Coxrsquos Bazar
Bangladesh In Lebanon where shelter plays an important
role household expenditures double only at a household size
of 5 and they triple at a household size of 11
COUNTRYEXAMPLE
ECONOMIES OF SCALE INLEBANON AND COXrsquoS BAZAR
Box 19
Figure a shows expenditures by household size compared to one-person households For Syrian refugees in Lebanon
average expenditure doubles only when the household size reaches five and it takes 11 members to triple the expenditures
of a one-person household The economies of scale are therefore large primarily due to the importance of shelter costs for
the refugees
In Coxrsquos Bazar in contrast total expenditures grow almost proportionally with household size (double at a two-person
household triple at a three-person household) Slight economies of scale can be seen for food For non-food expenditures
larger households even spent more per person From this data the economies of scale seem to be small
Figure a Increase in household expenditure by household size comparedto one-person households
Multiplicationfactor
Household sizeHousehold size
100
90
80
70
60
50
40
30
20
10
Coxrsquos Bazar (Bangladesh)Lebanon
1 2 3 4 5 6 7 8 9 10 11
Total Food Non-food
1 2 3 4 5 6 7 8 9 10 11
Note Figure based on authorsrsquo calculations Data from the Vulnerability Assessment of Syrian Refugees in Lebanon (VaSyr) 2017
and the Refugee influx Emergency Vulnerability Assessment (REVA II) 2019
51 Expenditure data is required to perform this analysis If no information on expenditure exists information on how needs change with household size can be collected through qualitative means such as focus group discussions or key informant interviews
52 Theoretically it is possible to also analyse expenditures by household composition but sample sizes rarely allow for such detailed disaggregation
32
Minimum Expenditure Baskets Guidance Note | December 2020
If the analysis reveals small economies of scale or none at all it is reasonable to use a per capita approach to scale up the MEB proportional to household size
Even for food strong economies of scale can be detected
which could be a result of large households being able to
buy food in bulk at a lower price However in Coxrsquos Bazar
where shelter and other shareable non-food goods are of less
importance household expenditures are close to proportional
to household size
If the analysis reveals small economies of scale or none at all
it is reasonable to use a per capita approach to scale up the
MEB proportional to household size If significant economies
of scale are present it is important to think about how to
take this into account when constructing the MEB Here are
some suggestions
One possible solution (in the expenditure-based
approach) is to disaggregate (or re-select see below)
the reference cohort for each household size sub-
sample and using the expenditures for each of these
cohorts construct specific MEBs for each household
size53 This approach takes into account economies of
scale by looking directly at the specific needs of different
size households but only reflects average differences
in household composition within each household size
The approach will most likely suffer from very small
sample sizes once analysis needs to be performed by
household size If this is the case household sizes could
be grouped into categories so that the analysis uses sub-
samples eg for household sizes 1ndash2 3ndash5 and 6ndash8 etc
or other groupings meaningful for the context When
following this approach bear in mind that if the reference
cohort is selected based on expenditure distribution
characteristics such as the removal of extreme deciles or
quintiles this procedure of removal of quintiles or deciles
needs to be repeated within each household size (or
household size group) Otherwise if there are economies
of scale for consumption there is a risk of skewing the
sample against the smallest and largest households
because their per-capita expenditures will be at the
extreme ends of the expenditure distribution
Another solution is to divide the MEB content into
ldquoprivaterdquo (non-shared) and ldquopublicrdquo (shared) consumption
For example food could be non-shared and rent and
fuel shared Examine the MEB expenditures for the
non-shared and shared goods for an average sized
household (or for household sizes around the average
for instance 4ndash6 members in order to leverage a larger
share of the sample) The non-shared value can then be
scaled proportionally to household size while the shared
value is held constant across household sizes This way
the resulting MEB consists of a lsquoflatrsquo and a proportional
element54 This is a relatively crude but intuitive way to
approximate economies of scale Figure 4 provides a
simple illustration of this approach
In the literature on poverty the most common solution
used to adjust for economies of scale and difference
in household composition is to use adult equivalents
instead of per capita numbers These equivalence scales
assign an ldquoadult equivalent numberrdquo to each household
depending on its size and composition taking into
account economies of scale as well as the different needs
of children and adults ie household composition For
example the first adult in the household is counted
as 1 and each additional adult as for example 07 A
child under 15 is counted as a fraction of an adult (eg
05) The effective adult equivalent household size is
then the sum of these adult-equivalent fractions55 Next
total household expenditures are divided by the adult
equivalent household size The MEB is then calculated
using these adjusted per-adult-equivalent expenditures
While this is not necessarily a complicated approach
from an analytical point of view equivalence scales can
53 See Lanjouw (1998) on the construction of poverty lines specific to household size (and composition)53 Alternatively the flat element can also be lsquosemi-flatrsquo and set according to household size groups ndashby examining shared costs and applying the same flat value within eg household size groups 1-2 3-5 6-8 or other
groupings as dictated by the context 53 One common equivalence scale is the OECD scale it assigns the weight 1 to the household head 07 to all additional adults and 05 to all children A household with five people say two adults and three children
consists of 32 adult equivalents (1+07+05+05+05) This is a common scale used in many developing and developed countries Another common scale is to give weight 1 to each adult and different weights to children depending on their age For the official poverty line in Zambia the following weights are given to children 0ndash3 years 036 4ndash6 years 062 7ndash9 years 076 and 10ndash12 years 078
33
Minimum Expenditure Baskets Guidance Note | December 2020
MEB - COMBINING FLAT ANDPROPORTIONAL ELEMENTS -ILLUSTRATION
MEB value
Household size
1 2 3 4 5 6 7 8 9
140
120
100
80
60
40
20
0
Proportional element - non-shared part of MEB
Flat element - shared part of MEB
MEB value per capita
Figure 4 Combining flat and proportional elements in the MEB
prove challenging when operationalising the MEB If
equivalence scales are used in constructing the MEB they
will also need to be applied when measuring household
expenditures compared with the MEB for gap analysis
against the MEB and in monitoring Translating the
concept of equivalence scaling into operational decision
making may therefore prove tricky Additionally results
can be quite sensitive to the choice of equivalence scales
so selecting appropriate scales is important yet often not
straightforward and a range of different scales exist56 In
some countries country-specific equivalence scales may
have been devised for the purpose of the calculation of
the national poverty line
No matter the approach the recommendation is always
to leverage data analysis as much as possible in order
to understand how needs evolve with household size
(and possibly composition) while keeping in mind that
the final MEB needs to be operationally relevant
Particularly in the (common) cases where MEBs are
used to calculate household transfer values it is worth
considering what level of analytical granularity can
feasibly be turned into programmatic action In some
cases it may not be operationally possible to handle
different per-capita size transfers for differently sized
households and the extra effort of achieving accurate
MEB figures by household size may not be worth it
The same general recommendation as for all aspects
of MEB construction also applies here the final result
should be realistic a fair depiction of needs and an
operationally relevant product
56 See for instance httpwwwoecdorgeconomygrowthOECD-Note-EquivalenceScalespdf
34
Minimum Expenditure Baskets Guidance Note | December 2020
A SMEB can be expenditure-based or rights-based or a hybrid of the two approaches depending on data availability and programmatic requirements
The SMEB is the absolute minimum amount required to maintain existence and cover lifesaving needs which could involve the deprivation of certain human rights
A survival minimum expenditure basket (SMEB) is often
constructed alongside a MEB While the MEB is defined as
what a household requires in order to meet their essential
needs on a regular or seasonal basis and its average cost the
SMEB is the absolute minimum amount required to maintain
existence and cover lifesaving needs which could involve the
deprivation of certain human rights However the concepts
of SMEB and MEB have not always been used consistently
by the humanitarian community and are sometimes used
interchangeably It is therefore important to be clear from the
outset of the analysis whether a MEB or a SMEB is the goal
A SMEB can serve at least two purposes First together with
the MEB it can be used to classify households into different
categories of economic capacity to meet their needs whereby
households whose expenditures fall below the SMEB have
highly insufficient economic capacity households between the
SMEB and the MEB have insufficient economic capacity and
households above the MEB have sufficient economic capacity
This information can then be used for profiling people in need
prioritizing beneficiaries or monitoring Second the SMEB
can inform programmatic decisions such as transfer values in
situations where immediate lifesaving assistance is required
The approaches presented here follow the MEB methods
adjusted to suit the different purpose of the SMEB
Accordingly a SMEB can be expenditure-based or rights-
based or a hybrid of the two approaches depending on data
availability and programmatic requirements
8 How to construct a SMEBExpenditure-based approach toconstructing a SMEBThe calculation of an expenditure-based SMEB is closely aligned
with the literature on how to estimate national poverty lines
While the MEB corresponds to an ldquoupperrdquo poverty line a ldquolowerrdquo
extreme or austere poverty line is often defined by taking the
food part of a MEB and adding this to the non-food needs
regarded as the essential minimum for household survival57
But how are survival non-food needs defined based on
expenditure data When people receive assistance it is
sometimes observed that households sell part of their food
rations to cover some non-food items These households forgo
some of the required food intake in order to cover what they
regard as survival non-food needs Using expenditure data to
construct a SMEB a similar idea is explored to calculate the
SMEB analysts identify those households whose total food AND
non-food expenditures are approximately equal to the MEB food
basket amount only In order to access non-food items these
households will compromise their food intake to some extent
because their total expenditures would only be enough to cover
their essential food requirements ie the food MEB anything
spent on non-food items means that they are not meeting their
essential food requirements It is therefore fair to assume that
the amount they choose to spend on non-food items must
be regarded by the households as absolutely necessary The
non-food expenditures of these households can therefore be
considered as the survival non-food needs The SMEB is then
calculated by adding these survival non-food expenditures
to the food MEB This SMEB allows households to meet their
essential food needs and their survival non-food consumption
Note that this approach requires a food MEB figure (either
already available or calculated as part of the SMEB analysis)
57 See Lanjouw 1998 and Haughton and Khandker 2009
35
Minimum Expenditure Baskets Guidance Note | December 2020
The steps for constructing an expenditure-based SMEB are
similar to those taken to construct a MEB with the following
additional considerations
1 Prepare expenditure data the expenditure data source can
be the same as that used for the MEB
2 Select the reference cohort this step is different The cohort
is selected by computing total household expenditures
and comparing them to the food MEB Households with
total expenditures equal to (or in an interval around) the
food MEB are selected as the SMEB reference cohort
3 Establish food basket and 4) Establish non-food basket
Using the SMEB reference cohort start by examining
how much these households spend on non-food items
Add this value to the MEB food value to arrive at the total
value of the SMEB To establish a food and non-food
basket there are two options i) use the MEB food basket
as the SMEB food basket and the non-food expenditures
of the SMEB reference cohort as the non-food basket
or ii) look at a third cohort of households namely those
whose total expenditures are around the just established
total SMEB level examine their food and non-food
expenditures and unpack those into food and non-food
baskets While both options will provide the same overall
value of the SMEB they will differ in composition and the
share of foodnon-food expenditures
Annex 2 provides an illustration of this method of constructing
a SMEB
Rights-based approach to constructing a SMEBThe rights-based approach to constructing a SMEB closely
follows the rights-based approach to constructing a MEB The
main difference is that needs and the items and quantities
included should be restricted to what is regarded as absolutely
necessary for survival ndash which can be challenging to define
This applies to both the food basket and the non-food
basket The MEB can be a starting point if there is one or
the Sphere Standards Sometimes rights-based SMEBs have
been constructed based on a MEB but with lower quantities
for certain items or by keeping some needs while removing
others
Hybrid SMEBs and reality checking resultsAs with MEBs it can be advantageous to combine the
expenditure-based and rights-based approaches to create
a hybrid SMEB The guiding principles are the same as for
the MEB with the difference that the resulting SMEB should
continue to contain nothing but the minimum required for
survival
The same logic applies to the ldquoreality checkrdquo of the SMEB
results as for the MEB it is crucial to ensure that the end
result is realistic and operationally relevant bearing in mind
the conceptual difference between the MEB and the SMEB It
is important to consult the population of interest as much as
possible to understand their views on what constitutes the
bare minimum needed by households to maintain existence
and cover lifesaving needs
COUNTRYEXAMPLE
RIGHTS-BASED SMEBS Box 20
In Lebanon health and education are excluded
from the rights-based SMEB while other needs are
covered with smaller amounts than in the MEB For
example the SMEB has a less diverse food basket
than the MEB58
In Syria the SMEB developed for the northern part
of the country includes food kerosene hygiene
products water and a small amount to cover other
survival goods Rent and utilities are not covered59
58 El Koury and Hajal 201659 Cash Based Responses Technical Working Group Syria 2014
36
Minimum Expenditure Baskets Guidance Note | December 2020
COUNTRYEXAMPLE
HYBRID SMEBs Box 21
For the MEB review in Lebanon for Syrian refugees60 a hybrid SMEB approach was chosen First an expenditure-based
SMEB was used calculating the non-food expenditures of households whose total expenditures equalled the food MEB
and adding this to the food MEB This resulted in very low expenditures on shelter (SMEB A) Due to the importance of
shelter in urban settings a second hybrid version was established calculating the non-food expenditures of households
whose total expenditures equalled the sum of the food MEB plus a rights-based value of a tent as survival shelter the cost
of which came from a rights-based SMEB (SMEB B)
Cohort HH size 4ndash6quint 2ndash4 acceptable FCS
n=923
Cohort total expenditure= food MEB
n=923210
Cohort total expenditure= food MEB + tent value
n=923210
SMEB Afood + survivalnon-food
Hybrid SMEB
437
83
40
93
20
16
29
19
314
1033
437
43
18
37
06
04
17
60
621
437
47
24
42
11
06
20
162
750
Food
Utilities (water gas fuel electricity)
Non-food items (hygiene clothing)
Health
Education
Transport
Communication
Other expenditures
Shelter
Total (USD)
Table a Hybrid SMEB for Syrian refugees
SMEB Bfood + survivalnon-food amp tent
In the Kinshasa urban assessment61 a SMEB was established in addition to the MEB comprising a basket of the most
essential items based on expenditure data used for the MEB For the food SMEB a less diverse diet was established by
excluding certain food items from the food MEB and rescaling the resulting basket to 2100 kcal For the non-food
component the only items included were those that were seen as critical to attaining the most basic standards for safety
food preparation water sanitation and hygiene These consisted of water cooking fuel hygiene products and lighting The
value for these items in the SMEB was derived from the median expenditures of the non-poor cohort
Expenditure-basedMEB
Expenditure-basedSMEB
60 Hohfeld et al 2020 61 WFP et al 2018
37
Minimum Expenditure Baskets Guidance Note | December 2020
91 Adjustment for seasonal or regional price differencesIf the MEB will only be used in one area where prices are
relatively homogenous it is often not necessary to adjust for
regional price differences However if the MEB is intended
for use across different urbanperi-urban andor rural
areas throughout the country it could be vital to adjust for
differences This means that the MEB can be priced differently
for different regions or rural or urbanperi-urban areas (or any
other division of areas that makes sense in relation to price
behaviour) There are a few approaches for this
Price the MEB based on available price data for different
regions or urbanrural areas For the food reference
basket this is most often possible using WFP food prices
or other similar price time series For non-food items
including housing utilities and services this can be more
challenging and may rely on price data collection by
different partners or require new data collection
For some countries price data provided by the national
statistical office is useful In the case of Turkey regional
purchasing power parity indices were used to provide
price estimates for components of the MEB for which
direct price information was not available
Use approximations from expenditure data If the
household survey has sufficient regional coverage the
expenditure levels in different regions can be explored
using the cohort of households just above the poverty
line Care should be taken in using this method
particularly if the sample size by region is very small
9 Additional considerations when constructing MEBs
92 Needs that vary by season or areaIn many countries where WFP works household needs change
with the seasons For instance in Turkey where winters are
cold households have additional needs for heating and warm
clothes to survive In other contexts there are significant
differences in needs between lean and rainy seasons These
changing needs could be a reason to construct different MEB
reference baskets to use at different times during the year or
to design seasonal top-ups In the case of items needed for cold
winters this is often referred to as ldquowinterizationrdquo
While this does not influence the approach used to construct
the MEB it does mean that analysts need to consider when
the data used in its construction was collected and whether
this influences the resulting MEB These considerations also
matter when using the MEB for monitoring if a monitoring
expenditure survey is used to analyse whether peoplersquos
expenditures are above or below the MEB threshold but
the survey is undertaken when prices are high or when
winters are cold if the MEB is not adjusted the results will
probably show a decrease in the percentage of people whose
expenditures are below the MEB as households have higher
needs andor are confronted with higher prices and thus
have higher expenditures without in reality being better off
In Turkey it was estimated that household needs during the
winter would result in a 48 percent increase in minimum
expenditures
In other cases different baskets might be necessary
for different areas of the country eg rural and urban
areas While the MEB should be constructed for a relatively
homogenous population it may sometimes be desirable to
construct a MEB covering all or most of a country where
consumption patterns vary substantially In this case it is
worth considering whether (some elements of) the MEB should
be different between areas Again the selected approach to
construct the MEB should not change but analysts need to
check where the data used in its construction was collected
and whether consumption patterns are very different between
different regionsareas For example in the case of Somalia
the main cereal consumed varies significantly between the
north and the south of the country so the MEB uses different
main cereals in the food reference basket according to region
While the MEB should be constructed for a relatively homogenous population it may sometimes be desirable to construct a MEB covering all or most of a country where consumption patterns vary substantially
38
Minimum Expenditure Baskets Guidance Note | December 2020
Constructing a MEB can be challenging in a sudden onset
emergency or if data is scarce or unavailable Below are some
ideas on how this can be resolved However from a ldquodo no
harmrdquo perspective it is important to emphasize that proxies
should only be used in the interim when no other solutions are
available
Use the national MEB or MEB reference basket If survey
data is not directly available and if the population of
interest is part of and similar to the overall population of
the country the national MEB or MEB reference basket
used for the national poverty line can be used if available
Bear in mind however that this basket should be used on
the condition that it corresponds to data that WFP collects
or has access to through partners or the Government to
ensure that monitoring can be conducted against the MEB
In its most basic form a MEB essentially only requires an
approximate value for the food basket and an estimate
of the average expenditure share that households use
on food Even if no relevant survey data is available this
information should be available to a country office or can
rapidly be collected or approximated
Consider using the minimum wage as a proxy Bear in
mind that while the MEB captures household-level needs
the minimum wage is individual-level income so an
assessment of how many minimum wages are needed per
household depending on the household size is required
It is also advisable to find out how the minimum wage has
been constructed
Ultimately a MEB is a good preparedness measure and should
be constructed before an emergency While both prices and
availability will be affected by an emergency it is still likely to
provide a useful starting point
11 Monitoring and updating the MEB111 Monitoring the cost of the MEBTo be operationally useful the MEB must be tracked and
updated over time to account for price changes If inflation is
high this might have to be done every month if it is low as
little as once a year could be sufficient This should be planned
for when the MEB is constructed to ensure that the costs of the
MEB components can be updated
There are different ways to update the MEB with price changes
If a reference basket is adequately defined (for food
and for non-food items) and prices are collected for the
individual items in the basket by WFP or its partners the
MEB can be priced anew using the updated prices for
each item and multiplying them by the quantities in the
reference basket
A simple solution is to adjust the MEB using the
nationalsub-national CPI or its components This
simply involves updating the cost of the MEB with
the increase (or decrease) in the CPI for the period
in question However in some contexts CPIs are not
updated or relevant for the target population Urban
areas are often over-represented in the national CPI on
the other hand prices and costs faced by for example
displaced populations can be very different from national
price levels In contexts of poverty where food constitutes
a large part of household expenditures the evolution of
food and fuel prices is central when it comes to capturing
price changes
If a CPI does not exist or is not considered applicable
a price index for key consumption items can be
constructed using price data collection for food items
and basic non-food items conducted by WFP andor
other agencies this can then be used to update the cost
of the MEB In contexts where shelter is a major part of
household expenditures changes in shelter costs should
also be captured
10 How to find a proxy for a MEB when data or time is insufficient
39
Minimum Expenditure Baskets Guidance Note | December 2020
112 When to construct a new MEBThe composition of MEB reflects consumption patterns
It is recommended as much as possible keeping the MEB
composition constant and only monitor how cost changes
over time However when there is reason to believe that
consumption patterns of the population for whom the MEB
is constructed has significantly changed it is time to review
its composition and possibly reconstruct the MEB to reflect
these changes
What could suggest such consumption changes have
occurred The figure to the right summarises some typical
events that could result in a significant change in household
consumption Shocks eg a natural disaster might create
additional needs if livelihoods are disrupted or living
conditions are altered Significant changes to the prices of
key consumption items can also alter consumption pattens
insofar it pushes households to substitute certain items
for other items (be aware however that reconstructing
the MEB would only be advisable if the substitution is not
just temporary) Population changes such as an influx of
displaced people or other events that changes the population Figure 5 Possible triggers for MEB composition review
Has a shock occured creating
different or additional needs
Have costs changed significantly
between key consumption items so
that households have substituted
consumption patterns
Has there been a change in
population - eg a displacement
Has the supply side or service
provision changed leading to a
change in household consumption
Shock
Substitution
Population
Supply
composition in the area that the MEB is constructed for
could also lead to a review Finally if supply of essential
goods and services changes this may also shift household
consumption eg if health services are made free of charge
and no longer require households to pay for them
40
Minimum Expenditure Baskets Guidance Note | December 2020
CaLP The Cash Learning Partnership
CBT cash-based transfers
CotD Cost of the Diet [approach]
CPI consumer price index
FCN-N food consumption score ndash nutrition
FCS food consumption score
FNG Fill the Nutrient Gap
HEA household economy approach
LSMS Living standard measurement survey
MEB minimum expenditure basket
OCHA United Nations Office for the Coordination of Humanitarian Affairs
REVA II 2019 Refugee Influx Emergency Vulnerability Analysis
SDG Sustainable Development Goal
SMEB survival minimum expenditure basket
UNHCR Office of the United Nations High Commissioner for Refugees
VAM Vulnerability Analysis and Mapping
WFP World Food Programme
WHO World Health Organization
Abbreviations
41
Minimum Expenditure Baskets Guidance Note | December 2020
Deaton and Grosh 2000 ldquoConsumptionrdquo in Designing Household Survey Questionnaires for Developing Countries Lessons from Ten
Year of LSMS Experience httpsscholarprincetonedudeatonpublicationsconsumption
Deaton and Zaidi 2002 Guidelines for Constructing Consumption Aggregates for Welfare Analysis LSMS Working Paper no 135
httpsopenknowledgeworldbankorghandle1098614101
The Cash Learning Partnership (CaLP) Glossary of terminology for cash and voucher assistance
httpswwwcalpnetworkorglearning-toolsglossary-of-terms
Cash Based Responses Technical Working Group Syria 2014 Northern Syria Survival Minimum Expenditure Basket Guidance
Document httpswwwhumanitarianresponseinfositeswwwhumanitarianresponseinfofilesdocumentsfilesnorthern_
syria_smeb_guidance_document_dec_2014pdf
Cash Working Group Nigeria 2018 Minimum Expenditure Basket for North East Nigeria ndash Justification and recommendations Draft
report httpswwwhumanitarianresponseinfositeswwwhumanitarianresponseinfofilesdocumentsfilesmeb_justification_
guidelinespdf
Baizan and Klein 2019 Minimum Expenditure Basket (MEB) Decision Making Tools The Cash Learning Partnership httpswww
calpnetworkorgpublicationminimum-expenditure-basket-meb-decision-making-tools-2
El Koury and Hajal 2016 MEB and SMEB revision Community Consultation Lebanon Cash Consortium httpsreliefwebintsites
reliefwebintfilesresourcessmeb-fgd-report-final-1pdf
Geniez Mathiassen de Pee Grede and Rose 2014 ldquoIntegrating food poverty and minimum cost diet methods into a single
framework A case study using a Nepalese household expenditure surveyrdquo in Food and Nutrition Bulletin vol 35 no 2 https
journalssagepubcomdoi101177156482651403500201
Haughton and Khandker 2009 Handbook on Inequality and Poverty The World Bank httpsopenknowledgeworldbankorg
handle1098611985
Hobbs 2016 MEBSMEB calculation for Syrians living in Turkey Report commissioned by the Cash-Based Interventions Technical
Working Group in Turkey httpsdata2unhcrorgendocumentsdownload57031
Hohfeld Papavero Sandstrom Dalbai and Renk 2020 Minimum Expenditure Basket for Syrian Refugees in Lebanon ndash Rights-based
versus Expenditure Based Approaches WFP httpsreliefwebintsitesreliefwebintfilesresources76229pdf
Inter-Agency Network for Education in Emergencies (INEE) Minimum Standards for Education Handbook Preparedness Response
Recovery httpsineeorgstandards
Jolliff and Prydz 2016 Estimating International Poverty Lines from Comparable National Thresholds World Bank Policy Research
Paper 7606 httpsopenknowledgeworldbankorgbitstreamhandle1098624148Estimating0int00national0thresholdspdf
Lanjouw 1998 Demystifying Poverty Lines World Bank
Ravallion 1994 ldquoPoverty Comparisonsrdquo in Fundamentals of Pure and Applied Economics 56
Republic of Zambia Central Statistical Office 2016 2015 Living Conditions Monitoring Survey (LCMS) Report httpswwwzamstats
govzmphocadownloadLiving_Conditions201520Living20Conditions20Monitoring20Survey20Reportpdf
Save the Children UK 2018 Basic Needs Assessment Guidance and Toolbox Part I Background and Concepts httpsreliefwebint
reportworldbasic-needs-assessment-guidance-and-toolbox
Sphere Standards Handbook Humanitarian Charter and Minimum Standards in Humanitarian Response 2018 edition httpswww
spherestandardsorghandbook
UNHCR CaLP Danish Refugee Council OCHA Oxfam Save the Children and WFP 2015 Operational Guidance and Toolkit for
Multipurpose Cash Grants httpswwwcalpnetworkorgwp-contentuploads202001operational-guidance-and-toolkit-for-
multipurpose-cash-grants-webpdf
References
42
Minimum Expenditure Baskets Guidance Note | December 2020
WFP 2004 Sampling Guidelines for Vulnerability Analysis Thematic guidance httpsdocumentswfporgstellentgroupspublic
documentsmanual_guide_procedwfp197270pdf
WFP 2008 Food Consumption Analysis Calculation and use of the Food Consumption Score in food security analysis https
documentswfporgstellentgroupspublicdocumentsmanual_guide_procedwfp197216pdf
WFP 2015 Food Consumption Score Nutritional Analysis (FCS-N) Guidelines httpswwwwfporgpublicationsfood-consumption-
score-nutritional-quality-analysis-fcs-n-technical-guidance-note
WFP 2018 Revising the Food Basket and Minimum Expenditure Basket Analysis to calculate a realistic cost of living for refugees in
Turkey httpsreliefwebintreportturkeyrevising-food-basket-minimum-expenditure-basket-analysis-calculate-realistic-cost
WFP 2019 Refugee influx Emergency Vulnerability Assessment ndash Coxrsquos Bazar Bangladesh httpsreliefwebintsitesreliefwebintfiles
resourcesWFP-0000106095pdf
WFP 2020a Essential Needs Assessment Guidance note httpswwwwfporgpublicationsessential-needs-guidelines-july-2018
WFP 2020b Technical Note Fill the Nutrient Gap and Minimum Expenditure Basket An explanation of approaches and identification of
synergies httpsdocswfporgapidocumentsWFP-0000116644download
WFP 2020c Setting the transfer value for CBT interventions Transfer Value Interim Guidance httpsdocswfporgapi
documentsWFP-0000117963download
WFP global Food Security Cluster and Food Security Cluster for the Democratic Republic of the Congo 2018 Adapting to an Urban
World Urban Essential Needs Assessment in the five communes of Kimbanseke Kinsenso Makala Nrsquosele and Selambao (Kinshasa)
httpswwwwfporgpublicationsdemocratic-republic-congo-urban-essential-needs-assessment-five-communes-kimbanseke-
kinsenso
World Health Organisation and Global Health Cluster ndash Cash Task Team 2020 Technical Note on the Inclusion of Health
Expenditures in the Minimum Expenditure Basket and Subsequent Multi-purpose Cash Transfer httpswwwcalpnetworkorg
publicationinclusion-of-health-expenditures-in-the-meb
43
Minimum Expenditure Baskets Guidance Note | December 2020
Survivalnon-foodexpenditure
TOTALEXPENDITURE
FOODEXPENDITURE
MEBnon-foodexpenditure
EXPE
ND
ITU
RE
CONSUMPTION
SMEBAusterepoverty line
Essential foodneeds (MEB)
Acceptable food consumption(based on FCS)
Food expenditure for HHwith tot exp at essential
food needs (MEB)
Analysts should always ensure that the expenditure data is properly cleaned and outliers removed and that it is converted into
the same recall period (food and non-food items usually have different recall periods)
Expenditures should be calculated into per capita figures (eg by dividing total household expenditures by household size) in
order to make them immediately comparable across households (or per adult equivalent see section 7 on how to account for
economies of scale and household composition)
Before starting the MEB analysis it is highly recommended to carry out some simple descriptive analysis of the expenditure
data in order to understand it Analyse the mean and median expenditures for the sample This will help understand the
distribution of the expenditures and detect possible issues While the median is more robust to outliers if a large part of the
sample has 0 expenditures on a particular item the median could be 0 and may therefore not be the best estimate of the need
In this case the mean may be preferable A frequency analysis of non-zero expenditures by groupitem can also be helpful in
understanding whether certain expenditures are infrequent or lumpy
Annex 1 - Good practice when analysing expenditure data
Figure based on Lanjouw 1998 Demystifying poverty lines and World Bank and Ravallion 1994 ldquoPoverty comparisonsrdquo in
Fundamentals of Pure and Applied Economics 56
Annex 2 - The expenditure-based SMEB ndash an illustration
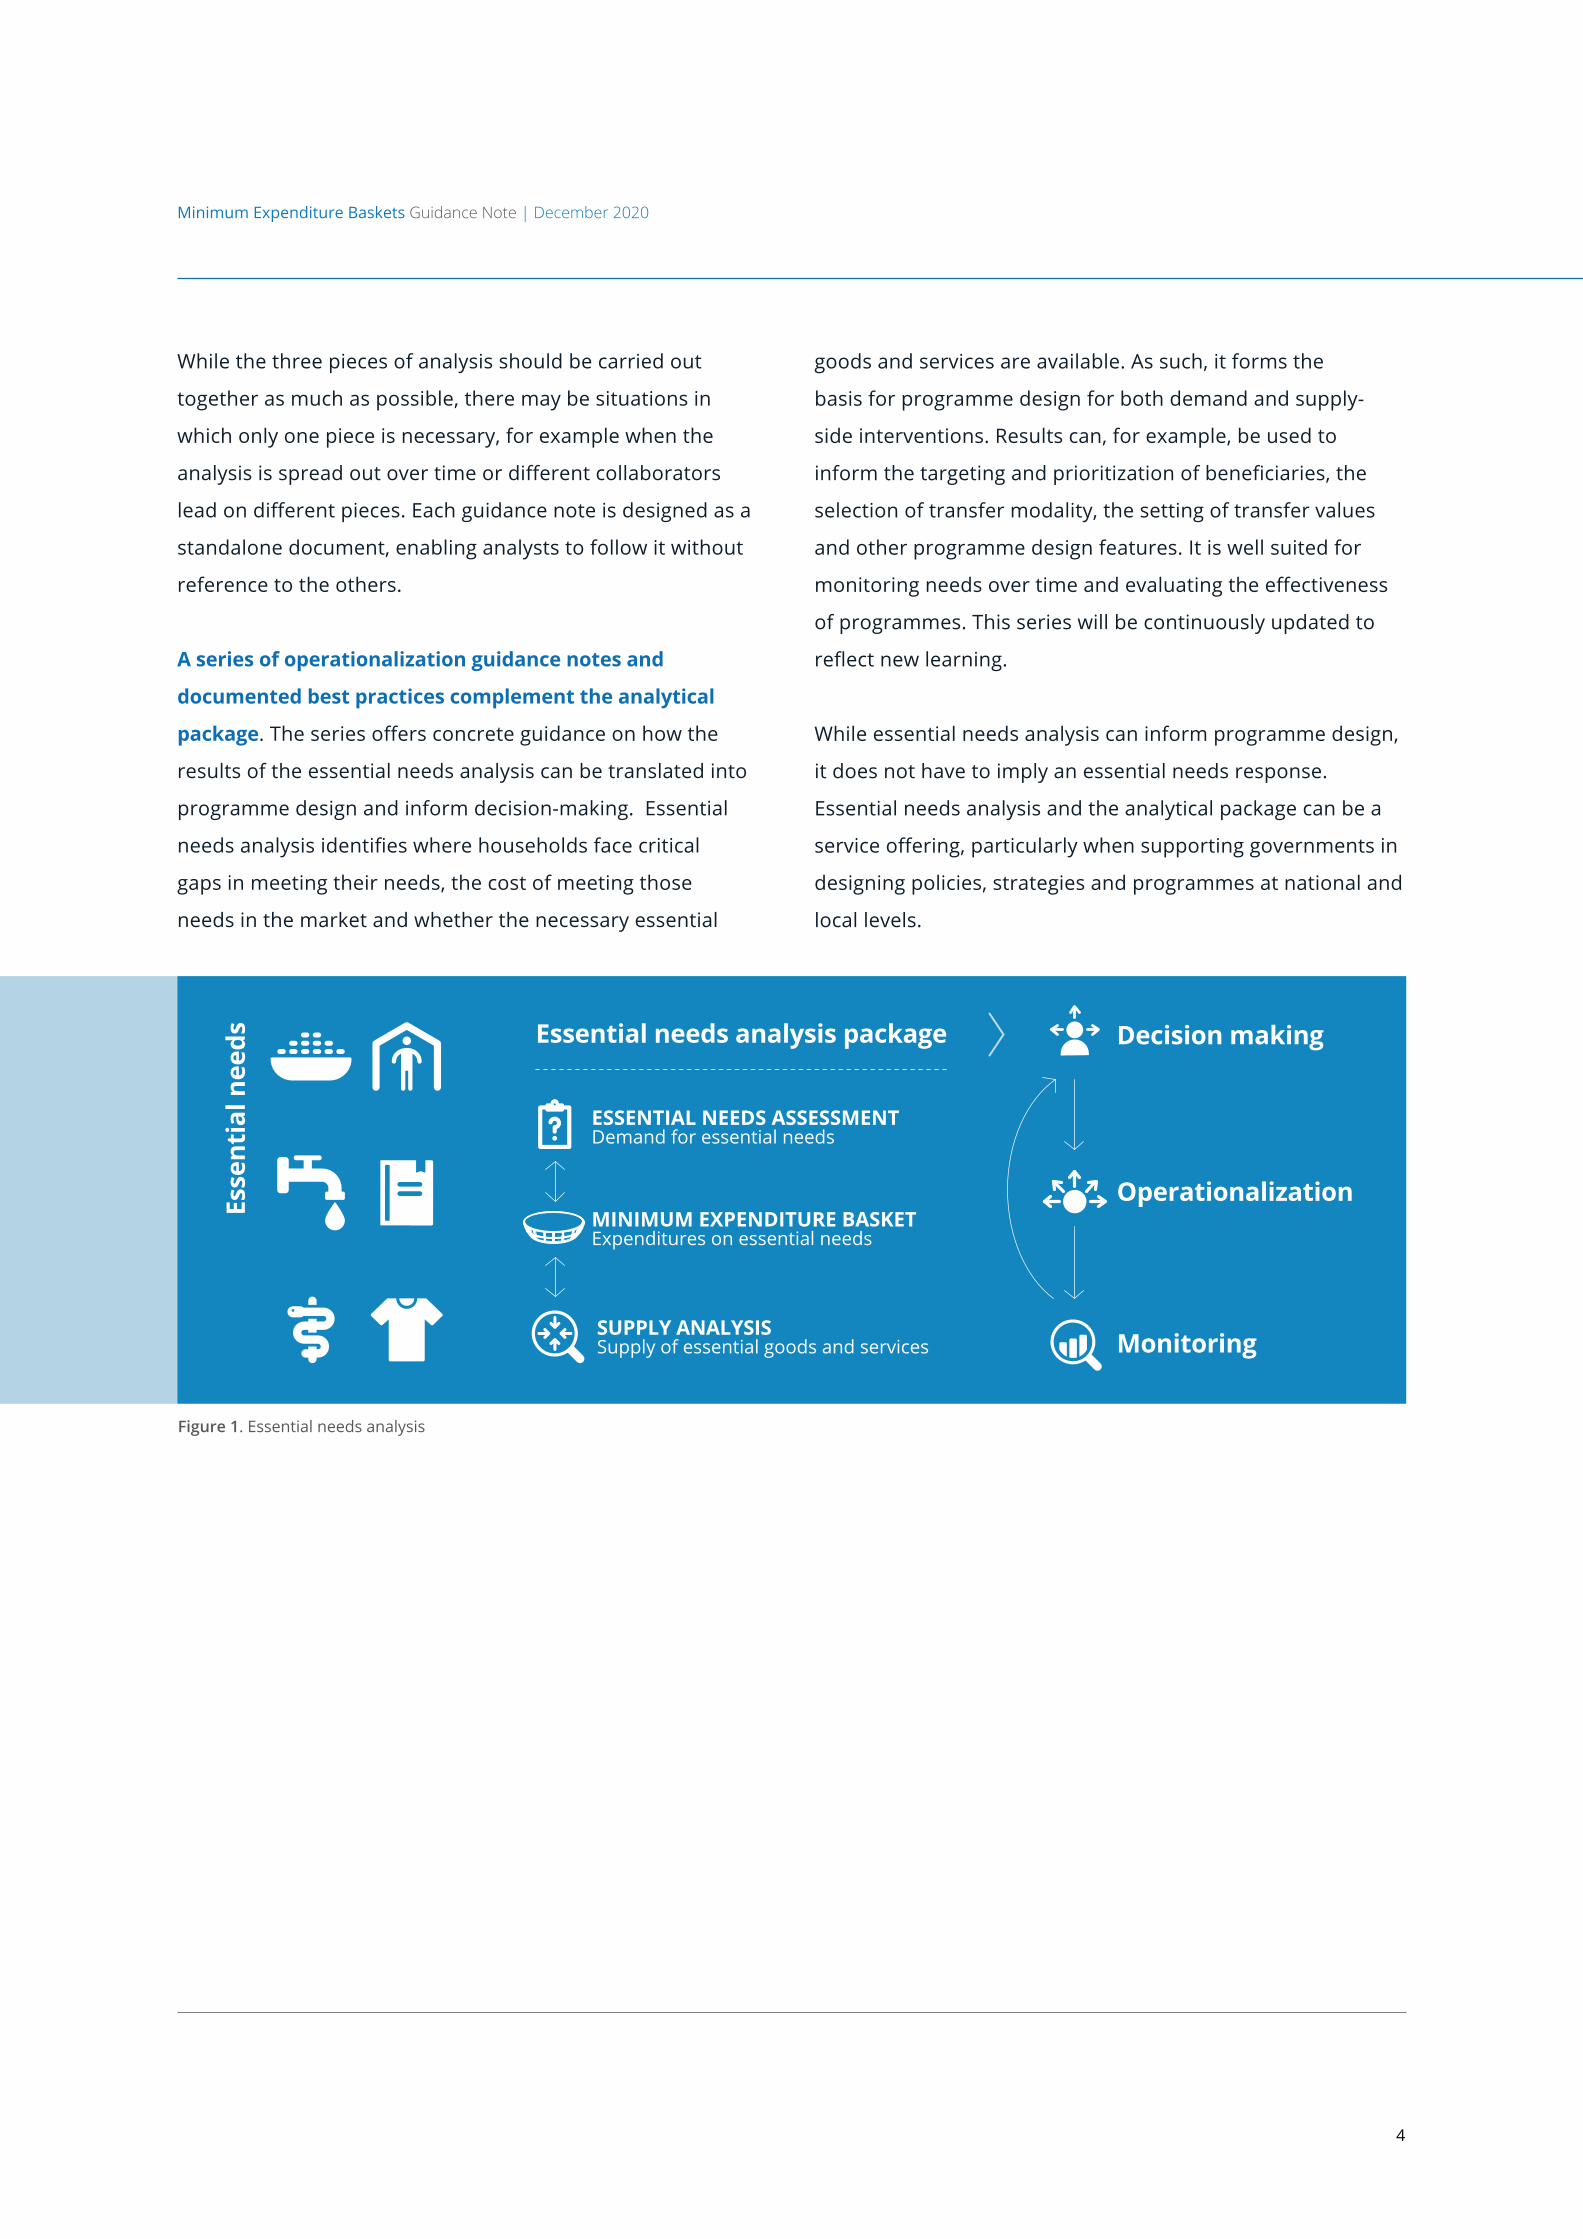
4
Minimum Expenditure Baskets Guidance Note | December 2020
Essential needs analysis package
Esse
ntia
l nee
ds
ESSENTIAL NEEDS ASSESSMENTDemand for essential needs
SUPPLY ANALYSISSupply of essential goods and services
MINIMUM EXPENDITURE BASKETExpenditures on essential needs
Decision making
Operationalization
Monitoring
While the three pieces of analysis should be carried out
together as much as possible there may be situations in
which only one piece is necessary for example when the
analysis is spread out over time or different collaborators
lead on different pieces Each guidance note is designed as a
standalone document enabling analysts to follow it without
reference to the others
A series of operationalization guidance notes and
documented best practices complement the analytical
package The series offers concrete guidance on how the
results of the essential needs analysis can be translated into
programme design and inform decision-making Essential
needs analysis identifies where households face critical
gaps in meeting their needs the cost of meeting those
needs in the market and whether the necessary essential
goods and services are available As such it forms the
basis for programme design for both demand and supply-
side interventions Results can for example be used to
inform the targeting and prioritization of beneficiaries the
selection of transfer modality the setting of transfer values
and other programme design features It is well suited for
monitoring needs over time and evaluating the effectiveness
of programmes This series will be continuously updated to
reflect new learning
While essential needs analysis can inform programme design
it does not have to imply an essential needs response
Essential needs analysis and the analytical package can be a
service offering particularly when supporting governments in
designing policies strategies and programmes at national and
local levels
Figure 1 Essential needs analysis
5
Minimum Expenditure Baskets Guidance Note | December 2020
This guidance note sets out the basic steps for constructing a
minimum expenditure basket (MEB) It is designed to provide
conceptual clarity and best practices built on experience from
the humanitarian and development fields The guidance is
designed to provide a series of options in order to facilitate
a context-specific application of the recommendations it
presents
The guidance note begins by introducing the concept of the
MEB and its different usages (sections 1 and 2) Sections 3 to
6 cover how to construct a MEB including important aspects
to consider before starting the analysis and the different MEB
approaches Section 7 examines how to deal with household
size and composition in MEB analysis while the concept of the
survival minimum expenditure basket (SMEB) is introduced
in section 8 Section 9 sets out additional considerations
such as regional or seasonal price adjustments and section
10 explains how to find MEB proxies when time or data is
insufficient In closing section 11 offers guidance on how to
update and monitor the MEB
A MEB is defined as what a household requires in order to
meet their essential needs on a regular or seasonal basis
and its cost3 Essential (or basic) needs are defined as ldquothe
essential goods and services required on a regular or seasonal
basis by households to ensure survival and minimum living
standards without resorting to negative coping mechanisms
or compromising their health dignity and essential livelihoods
assetsrdquo4 The MEB is a monetary threshold ndash the cost of these
goods utilities services and resources ndash and is conceptually
equivalent to a poverty line5 It typically describes the cost
of meeting one monthrsquos worth of essential needs Since the
MEB sets a monetary threshold for what is needed to cover
essential needs the households whose expenditures fall
below the MEB are defined as being unable to meet their
essential needs
i About this guidance note
3 This builds on the definition in UNHCR et al 2015 4 Definition of basic needs See CaLP glossary 5 Note that conceptually a MEB is equivalent to a poverty line in that it describes a monetary threshold for being able to cover essential needs This does not mean that the MEB is equivalent to the national poverty line6 Haughton and Khandker 2009
In poverty literature and research MEBs have long been
constructed primarily to set national poverty lines and
determine the percentage of households in the population
who are poor ie who cannot meet their essential needs
The ldquocost of basic needsrdquo approach which entails establishing
a MEB is fairly new in humanitarian contexts however it
has long been the most common way to construct national
poverty lines6 As a result there is often national experience to
draw on when setting out to construct a MEB
A MEB does not necessarily contain all the essential needs
of a household It only captures needs that the households
cover entirely or partly through the market It should not
be an attempt to monetize all the needs of a population
For example in contexts where electricity is considered an
essential need but not available for the population of interest
it should not be included in the MEB If shelter is provided free
of charge in a refugee camp or education is publicly provided for
free these needs and their costs are not captured in the MEB
Hence a need can be essential but not included in the MEB
A MEB does not necessarily contain all the essential needs
of a household It only captures needs that the households
cover entirely or partly through the market It should not
be an attempt to monetize all the needs of a population
For example in contexts where electricity is considered
an essential need but is not available for the population of
interest it should not be included in the MEB If shelter is
provided free of charge in a refugee camp or public education
is provided for free these needs and their costs are not
captured in the MEB A need can therefore be essential but
not included in the MEB
A MEB captures the cost of essential needs for average
households It does not typically capture ad-hoc or one-
off costs This can be challenging particularly in emergency
situations when needs are dynamic While this guidance
suggests keeping the MEB composition fixed as far as
possible in such situations it might be justified to create
an interim MEB (see section How to find a proxy for a MEB
when data or time is insufficient) and when the situation has
stabilized a final one A similar challenge is presented with
1 What is a minimum expenditure basket
6
Minimum Expenditure Baskets Guidance Note | December 2020
needs that are inherently irregular large and unpredictable
such as health needs This is also examined in the sections on
MEB construction
There are different approaches to establishing a MEB
As the World Bankrsquos Handbook for Poverty and Inequality
explains7 the typical starting point for establishing a MEB is
to estimate the cost of acquiring enough food to meet energy
requirements usually 2100 calories per person per day as
per the Sphere Standard Yet the cost of 2100 calories varies
with the diet of households which typically depends on their
economic status The cost of other essential non-food needs
is then added There are two approaches to establishing
which food and non-food items should be in the MEB an
expenditure-based approach that focuses on effective
demand and a rights-based approach based on assessed
needs While the expenditure-based approach is usually used
to construct national poverty lines the rights-based approach
is the principal method followed in the operational guidance
for multipurpose cash grants developed for humanitarian
purposes8 A combination of these approaches a hybrid
approach can also be used and is often recommended This
guidance describes each approach
The construction of a MEB is always somewhat arbitrary
However a MEB is constructed choices need to be made along
the way The objective of the MEB can influence how best to
approach its construction The choice of the group of people
whose effective demand will be examined ndash the ldquoaveragerdquo
households ndash is another important influencing factor This
guidance provides direction on how to make these choices but
analysts will always be required to exercise judgement
A MEB is not equivalent to a transfer value A transfer
value is understood as the monetary value transferred from
governments or organizations such as WFP to households
in order to support the latter in meeting their needs The
value of the MEB is not the same as the value that should
be transferred to households but the MEB can be a critical
component when determining transfer values Most
households can rely on their own resources to meet at least
some of their needs so the transfer value will usually be
less than the value of the MEB covering the gap between
householdsrsquo own resources other assistance received and
the MEB The distinction between the MEB and the transfer
value is also important because the MEB remains the same
regardless of assistance and funding constraints while the
transfer value could be impacted by these factors9
When using the MEB to monitor impacts of an
intervention or programme the MEB should not be
changed over time The threshold should only be adjusted
for price changes or when any major changes in context and
households needs occur that would require the construction
of a new MEB
2 Why have a MEBThe MEB has a range of applications In humanitarian
and development programming the MEB can support
household profiling by identifying characteristics of those
who cannot meet their essential needs10 and support
decisions on transfer value amounts for food and non-
food needs For partnerships the MEB can support multi-
sector coordination and programming with government
partner organisations and donors In market and supply
analysis the MEB can help inform which goods and services
to include in a Supply Analysis by showing which essential
needs households cover through the market Finally in
monitoring the MEB can assist monitoring of immediate
and longer-term outcomes through analysis of expenditure
trends against the MEB and help establish a basket against
which to monitor market prices and the cost of living
7 Ibid8 UNHCR et al 20159 For further discussion on considerations when setting a transfer value see WFP 2020c 10 For one possible application see WFP 2020a
A hybrid approach to constructing the MEB combines the expenditure-based approach and the rights-based approach and is often recommended
7
Minimum Expenditure Baskets Guidance Note | December 2020
THE MEB TO-DO LIST DEPENDING ON CONTEXTALSO CONSIDER
Identify key partners and stakeholders and decide on objectives and process
Construct the food basket
Construct the non-food basket
Reality check results and validate with stakeholders
Determine the analytical starting point (eg examine national poverty lines set the population of interest check what data is available) and decide on approach
Accounting for household size and composition
Adapting the MEB to different needs across regions or seasons
Adjusting the MEB for regional or urbanrural price differences if significant
HOW TO
Box 1MEB
3 How to construct a MEB generic steps
11 This is in line with the cost of basic needs approach widely used for poverty lines as described in previous sections
A MEB is constructed by estimating the cost of acquiring
adequate food and adding the cost of other essential non-
food expenditures11 The box below shows the steps that are
always part of constructing a MEB
The two principal methods for constructing MEBs are
the expenditure-based approach and the rights-based
approach Sections 5 and 6 describe these approaches
and how to combine elements of both to apply a hybrid
approach
Regardless of approach it is crucial to arrive at a realistic
relevant and operational MEB that is rooted in
consumption behaviour ndash section 6 also looks at how to
ensure this Before going into the details of construction the
next section outlines the key questions to ask before starting
the MEB analysis
8
Minimum Expenditure Baskets Guidance Note | December 2020
Before embarking on the construction of the MEB
components consider the following questions to decide how
best to approach the analysis
What is the objective and whowill be the partnersStart by setting the objective and consider what the MEB will
be used for once the analysis is finished If the MEB analysis
is a joint exercise identify potential partners possibly in
interagency working groups such as a cash working group find
out what kind of information various organizations can share
and decide on the division of labour In some cases it can be
helpful to write terms of reference for the MEB analysis in
order to clarify the envisioned process and methodology Even
if the MEB analysis will be conducted by just one agency it is
always a good idea to identify partners who will be interested in
the results and who can be consulted along the way12
Who is the MEB being constructed forIt is important to define the population of interest for the
MEB Is it intended to be valid for the entire country Or will it
only be used in a refugee camp for example or a particular
region where needs might differ from those in the rest of
the country It is vital to decide from the start where and for
whom the MEB should apply Since the MEB describes the
cost of essential needs the population for whom the MEB
is constructed should ideally have relatively homogenous
consumption patterns and needs If consumption patterns are
very different consider constructing different MEBs or varying
certain components of the MEB for sections of the population
Have any MEBs already been created for the population of interest If there are one or more MEBs already in use the analytical
exercise might be aimed at updating or even ldquoreality
checkingrdquo the existing baskets to see whether they still match
consumption behaviour and price levels If existing baskets
are found to be valid and relevant it might not be necessary
to start a new MEB analysis
4 Before starting the analysis What information and data is already available and is new data neededConsider what data or analysis is already available from
essential needs assessments or other household surveys
(undertaken by WFP or others) Does the data cover the area
and population of interest Also consider what qualitative
information might be available to shed light on certain
expenditure patterns and whether there is access to market
and price information If the data available is insufficient or
outdated plan to collect fresh data A MEB analysis is greatly
strengthened by being conducted as part of a comprehensive
essential needs assessment The assessment describes the
essential needs of the population of interest which is a
useful starting point for a MEB analysis and complements the
monetary perspective provided by a MEB
Can the national poverty line be usedBefore beginning the construction of a MEB it is useful to find
out if a national poverty line exists and how and when it was
constructed Many countries have their own national poverty
lines so why not use this poverty line (and the corresponding
basket) as the MEB Whenever possible the first choice
should be to align with government practices However this is
often not feasible for three main reasons
Practices vary widely when it comes to constructing
national poverty lines Although the most common
approach is the cost of basic needs using MEBs
sometimes poverty lines are set as a share of the
country mean or median income or expenditures or
as a fixed percentage of the income or expenditure
distribution (although this is mostly not the case in low
income countries) Furthermore even when a MEB has
been constructed to develop the poverty line different
methodologies exist For example sometimes countries
exclude non-food items from their poverty line MEB
Since the MEB describes the cost of essential needs the population for whom the MEB is constructed should ideally have relatively homogenous consumption patterns and needs
12 The Cash Learning Partnershiprsquos MEB Tip Sheet contains useful advice on the interagency processes around constructing a MEB Baizan and Klein 2019
9
Minimum Expenditure Baskets Guidance Note | December 2020
Countries can also have different poverty lines for
different purposes and regions13 These factors can all
limit the use of the national poverty line as the MEB
The population of interest for a MEB could differ from the
overall population of the country and hence the national
poverty line This group of people may have different
essential needs for instance if they live in refugee camps
or do not have access to the same services as the resident
population (eg public education)
The data that WFP typically collects through essential
needs assessments comprehensive food security
and vulnerability analyses emergency food security
assessments baseline assessments and post distribution
monitoring is often much less detailed than that gathered
through the household budget surveys or living standards
measurement surveys used to calculate national poverty
lines It is widely observed that the more detailed the
survey questions about expenditures the higher the
reported expenditures14 If the national poverty line is
constructed using detailed data but the assessment of
household needs or expenditures relative to the poverty
line is based on less detailed data errors in the analysis
are likely to occur Furthermore WFP expenditure
modules do not include asset depreciation which is often
accounted for when calculating national poverty lines
Even if the national poverty line cannot be used in most
cases and especially in humanitarian contexts elements of
the methodology can perhaps be replicated It is therefore
important to find out how the national poverty line is
constructed
How about using the methodology applied for consumer price indices The consumer price index (CPI) is used to measure changes
in price levels based on a weighted average consumer basket
of goods and services In most countries household budget
survey data is used to construct the baskets used to measure
consumer prices A weight that corresponds to average
household expenditure patterns is applied to each component
of the CPI17 This basket is not ideal for MEB calculations
because it corresponds to overall national average
consumption patterns MEBs are based on the consumption
levels and patterns of those households who are just able to
meet their essential needs within the population of interest
(this is further described in the following sections)
13 Jolliff and Prydz 2016 14 Haughton and Khandker 200915 Republic of Zambia Central Statistical Office 2016 16 See Turkish institute of statistics data portal httpsdatatuikgovtrKategoriGetKategorip=Income-Living-Consumption-and-Poverty-10717 The CPI weights are usually available through national statistical offices
COUNTRYEXAMPLE
EXAMPLES OF NATIONAL POVERTY LINESEG Box 2
In Zambia the national poverty line is constructed using the cost of basic needs MEB approach based on a simple food
basket that meets minimum food needs for a family of six15 Imagine this food basket costs USD 100 per month This is
defined as the food poverty line To construct the full poverty line the minimum non-food needs of households are
estimated based on the average share of expenditure that households just above the food poverty line dedicate to needs
other than food Let us say that this corresponds to USD 35 per month The total poverty line is then the sum of the food
and non-food lines which with these hypothetical figures would be USD 100 + USD 35 = USD 135
By contrast Turkey uses the standard European Union approach to measuring poverty which is 50 or 60 percent of
median income16 However eligibility for social assistance is based on the gap between household income and the national
minimum wage
10
Minimum Expenditure Baskets Guidance Note | December 2020
In developing country contexts consumption is generally considered a better metric of wellbeing than income and in turn consumption expenditures as captured in household data generally provide the most reliable measure for consumption
5 Constructing a MEB expenditure-based and rights-based approaches
51 The expenditure-based approachThe expenditure-based approach to constructing a MEB
relies on household-level expenditure data to examine the
consumption behaviour of households who are just able
to meet their essential needs The expenditure level and
consumption patterns for this group of households reveal the
minimum cost of covering essentail food and non-food needs
and therefore form the basis of the expenditure-based MEB
The expenditure-based approach builds on the theory
behind poverty measurement and poverty line construction
To measure poverty the first step is to define a measure
of wellbeing In developing country contexts consumption
is generally considered a better metric of wellbeing than
income and in turn consumption expenditures as captured in
household data generally provide the most reliable measure
for consumption18 Household survey data on expenditures
therefore provides the foundation for measuring wellbeing
and is used to set the MEB threshold
The steps for constructing a MEB using the expenditure-based
approach are explained below
1 Prepare the expenditure data The prerequisite for an expenditure-based MEB is a
good-quality household survey with a detailed expenditure
module with a sufficient sample size representative of the
population for whom the MEB is being constructed (the
ldquopopulation of interestrdquo)
The notion of a ldquodetailedrdquo expenditure module is a
relative one Constructing an expenditure-based MEB
requires more detailed data on different types and
groups of expenditures than is usually gathered by
household surveys conducted in humanitarian settings
However this guidance has been designed to cope
with less detailed expenditure data than that gathered
through extensive national expenditure surveys such
as the very granular expenditure modules typically used
when constructing poverty lines (eg national household
budget surveys household income and expenditure
surveys living standards measurement surveys or other
large-scale household surveys)
What is a sufficient sample size The survey should
always follow good practices for sampling19 Consider
that for MEBs the analysis focuses on the consumption
patterns of a subset of the sample the ldquoreference cohortrdquo
(see next below) The characteristics of the population
and the cohort selection criteria determine the size of
this subsample in relation to the overall sample but
experience shows that the cohort can comprise between
10 and 60 percent of the sample The sample will be
further disaggregated if analysis by household size or
group of household size is desired (see section 7 on
accounting for household sizes)
Using expenditures to understand consumption involves
calculating a ldquoconsumption aggregaterdquo This entails
combining household expenditures on food and non-
food paid in cash or through credit as well as the
imputed monetary values of consumed own production
and received assistance Expenditures are analysed in
per-capita values Box 3 describes this process in more
detail Annex 1 further outlines some best practices when
analysing expenditure data
In addition to the household survey data market price
data is needed in order to estimate the final cost of the
basket The price data should be collected around the
same time as the household survey data
18 Deaton and Zaidi 2002 and Haughton and Khandker 2009 19 For guidance see WFP 2004 Additional resources can be found in the online VAM Resource Centre httpsresourcesvamwfporg
11
Minimum Expenditure Baskets Guidance Note | December 2020
HOW TO
EXPENDITURE DATA IN MEB CALCULATIONS -CONSTRUCTING A LIGHT ldquoCONSUMPTION AGGREGATErdquo
Box 3
Using expenditures to calculate a MEB entails combining different household expenditures to arrive at a measure of house-
hold consumption This is typically referred to as a consumption aggregate although a lighter version is used than those
usually constructed for national poverty lines due to the less granular data typically available for MEB construction20
Expenditures considered in a MEB should reflect household consumption related to essential needs Therefore both
household expenditures made in cash and those on credit must be considered as the latter also reflect current consump-
tion even if payment occurs later If the population can be expected to consume food from their own production the value
of this food should be captured to avoid underestimating food expenditures Lastly if the surveyed households are receiv-
ing and consuming assistance it is advisable to estimate the implied value of this assistance and include it in the expendi-
tures (however care needs to be taken if the population of interest includes a large group of in-kind assistance beneficiar-
ies as this can significantly skew consumption choices see next section on selecting the reference cohort) In summary the
expenditure module should capture any expenditures made in the reference period through cash and credit purchases as
well as the monetary value of consumed own production and assistance Most standard expenditure modules include all
these types of expenditures
Expenditures should be collected for both food and non-food goods and services For food expenditures at the food group
level are required as a minimum If food expenditures are collected at the item level a more granular analysis can be per-
formed The same applies for non-food expenditures they must be available at the group level and item-level data will add
detail However whenever household data is collected a balance needs to be struck between the granularity of the data
and the time and resources available for its collection
The WFP standard expenditure module can be used as a reference for the minimum requirement for expenditure data
collection WFP standard modules can be found in the online VAM Resource Centre httpsresourcesvamwfporg
+ ndash=
2 Select the reference cohort The next step is to identify the households in the survey
data that are just able to meet their essential needs and
examine their expenditures Including households below
this level would generate a basket that does not satisfy
essential needs while including relatively wealthier
households would lead to the inclusion of non-essential
needs and therefore inflate the MEB But what is ldquojust
enoughrdquo
Identifying the cohort of households who are just able
to meet their needs can be challenging How to approach
it depends on the characteristics of the population
and the available data The key is to identify one or
more criteria that can be good proxies for whether
households are just able to meet their essential
needs and that can be observed in the data One
basic indicator would be a food consumption of 2100
kcal per person per day21 However since the available
expenditure data is often too crude to make accurate
calibrations of diet compositions around the 2100
kcal point the use of alternative indicators is highly
recommended These could be indicators such as food
consumption score (FCS) or food consumption score ndash
nutrition (FCS-N)22 which indicate whether households
eat sufficient and balanced diets quality of housing
indicators use of coping strategies (selecting households
who do not engage in severe strategies) or any other
indicator that reflects a householdrsquos ability to meet its
needs Combining several indicators is often useful
20 For thorough guidance on constructing consumption aggregates using data from living standard measurement surveys (LSMS) see Deaton and Zaidi 2002 In most WFP cases household data is less granular than the LSMS-type datasets This section therefore describes how to construct consumption aggregates with less detailed data21 Use of calorie consumption close to the Sphere Standard of 2100 kcalpersonday as the starting point for selecting the reference cohort originates in the cost of basic needs approach used in most national poverty line estimations 22 WFP 2008 and WFP 2015
12
Minimum Expenditure Baskets Guidance Note | December 2020
Figure 2 Selecting the MEB cohort
In simple terms it is useful to think of the green people in the figure as the basis for selecting the reference cohort they are not amongst the worst-off
nor the wealthiest ndash but rather are just able to meet their essential needs
DESTITUTE
WEALTHY
It is also recommended to examine the expenditure
distribution Excluding households in the extreme ends
of the expenditure distribution can help ensure that
the cohort is neither ldquotoo poorrdquo nor ldquotoo wealthyrdquo (eg
by removing households in expenditure quintiles 1 and
5 or similar exclusion criteria based on distribution
characteristics) This is in particular useful if there is a
relatively large spread in wealth across the sampled
population
Figure 2 provides a simplistic depiction of selecting the
reference cohort the aim is to identify households that
are just able to cover their needs and hence do not fall in
either extreme end of the spectrum
13
Minimum Expenditure Baskets Guidance Note | December 2020
Box 4 outlines some typical cases and presents suggestions
for how to select the cohort in a survey sampled on
the population of interest
There is a spread in the
population in terms of well-being
and a proportion is able to cover
their essential needs no
households receive assistance
A relatively large proportion of
households receive food
assistance
The vast majority of the
households are far from being
able to cover their essential
needs (prior to receiving
assistance)
Select households with an acceptable FCS23 or with adequate consumption in FCS-N
who do not use negative coping strategies (or have a high coping strategy index)
Combine or cross-check with other criteria such as dwelling quality or asset index
Exclude extreme expenditure quintiles
Exclude households receiving in-kind food assistance from the reference group (if
sample size allows) This is because any assistance that is not unrestricted cash
might influence the consumption choices of the beneficiary households (in-kind
food means a large portion of food consumption is determined by the assistance
provided not the households) However be aware that if the majority of
households receive some form of restricted assistance excluding them all from the
cohort can lead to sample size issues as well as selection bias
Alternatively to the extent possible avoid using criteria that are highly influenced
by assistance For example in the presence of food assistance the FCS of some
households might be acceptable even if they are not able to meet their essential
needs Furthermore if in-kind food is provided the consumption behaviour of such
households might be skewed as most of their food needs are already covered by
assistance
Consider using dwelling quality an asset index or other similar indicators instead
(or in combination with the FCS)
Consider using a rights-based approach since it will be very difficult to obtain a big
enough sample of households who can meet their essential needs making it
challenging to construct an expenditure-based MEB Carry out a reality check using
the survey data to understand household consumption patterns keeping in mind
that the sample represents a population not able to fulfill their essential needs
HOW TO
REFERENCE COHORT SELECTIONBox 4
Scenario Possible approach to selecting the cohortUse one or several of the below criteria
The use of sensitivity tests is highly recommended in the form
of repetitions of the expenditure analysis for different versions
of the reference cohort this will indicate the extent to which
the choice of cohort selection criteria is influencing the MEB
23 It is usually not advisable to use the FCS as a single criterion If it is used alone the indicator should be capped at a certain level above the acceptable threshold (the FCS builds on a continuous score from 0ndash112 and applies thresholds for poor borderline and acceptable consumption) This is because if all households with acceptable FCS are included this will likely also capture some households who are ldquotoo wealthyrdquo to be considered in the reference cohort
14
Minimum Expenditure Baskets Guidance Note | December 2020
See box 5 for examples of how sensitivity tests can be
conducted as well as how the reference cohort has been
COUNTRYEXAMPLE
SELECTING AND CHECKING THE REFERENCE COHORTCHAD SYRIAN REFUGEES IN LEBANON AND COXrsquoS BAZAR
EG Box 5
Reference cohort sensitivity analysis ndashCoxrsquos Bazar MEB
Table a
In Chad the calculation of an expenditure-based MEB relied on national data collected by the Government during their
annual national food security and nutrition survey The reference cohort for the MEB was selected on the basis of two
criteria FCS between 35 and 70 eg in an interval around the acceptable threshold and no adoption of crisis or emergency
livelihood coping strategies based on the livelihood coping strategies indicator These two criteria ensured that the
selected reference cohort had consumption levels that provided sufficient food security and sustainable livelihood
strategies
For Syrian refugees in Lebanon24 an expenditure-based MEB was calculated by WFP in order to review an existing MEB
Shelter plays an important role as most refugees live in an urban host community and face high rents The FCS reveals
whether people can cover their food needs but could be influenced by the presence of food assistance To ensure results
would be robust against the choice of the cohort two different approaches were compared both included households of 4
to 6 members (as the MEB under review was defined only for households of these sizes) and excluded households in
expenditure quintiles 1 and 5 In version 1 an additional criterion of acceptable FCS was included while in version 2 an
additional criterion of acceptable housing conditions was applied The results were similar for both cohort versions
A MEB was calculated in Coxrsquos Bazar Bangladesh as part of the 2019 Refugee Influx Emergency Vulnerability Analysis
(REVA-II)25 for Rohingya refugees An expenditure-based MEB was built using a large household survey that included
refugees and host community households the reference cohort also included refugees and host communities as the MEB
was meant to apply to both groups Households receiving in-kind food assistance were excluded to avoid possible bias in
consumption choices which would be reflected in the expenditure data The reference cohort was then selected based on
FCS and expenditure quintiles To ascertain that the appropriate cohort had been chosen a sensitivity analysis was
conducted which tested the effect of removing different expenditure quintiles (quintiles 1 and 5 versus quintiles 1 4 and 5)
and including different FCS ranges (FCS 42+ versus FCS 35ndash80) This showed that across different iterations of the reference
cohort total food expenditures were relatively stable while non-food expenditures went up when richer households (eg in
the higher expenditure quintiles) were included This allowed the analysts to select the cohort of households who were just
at the point where the share of food expenditures out of total expenditures began to decrease as a high share of
expenditure on food is often an indicator of vulnerability In other words the selected cohort was just at the point where
households started meeting more needs than just food and the most basic non-food requirements The consumption
patterns of this cohort -highlighted in table a below - therefore became the basis for the MEB
Indicator 1expenditurequintiles
Indicator 2FCS Sample
size Value in taka
Total MEB
Exclude quintiles 1 4 and 5
Exclude quintiles 1 4 and 5
Exclude quintiles 1 and 5
Exclude quintiles 1 and 5
FCS 35ndash80
FCS gt= 42
FCS 35ndash80
FCS gt= 42
403
296
610
474
5259
5324
5691
5740
2304
2299
2990
3082
070
070
066
065
030
030
034
035
7562
7623
8681
8822
Food MEBValue in taka Value in taka
Non-food MEB
identified in different contexts
24 Hohfeld et al 2020 25 WFP 2019
15
Minimum Expenditure Baskets Guidance Note | December 2020
3 Establish the food basketWith the reference cohort identified the food basket value
should be calculated in correspondence with the food
consumption patterns of the reference cohort
To calculate the food basket start by computing the mean
(or median) food expenditures for the chosen reference
cohort It is good practice to compute the overall food
expenditures and break the analysis down into the different
food groups or food items in order to understand how food
consumption is distributed across different foods
Next consider whether an explicit reference food basket
is needed in the MEB this is a list of the food items in the
basket and their quantities Having a reference basket
brings advantages in terms of monitoring of the cost
of the MEB (as new prices can easily be applied to the
quantities) it shows consumption patterns in quantities
and can hence help check if food consumption is adequate
at the given level of expenditures and it can help when
communicating about the MEB It can therefore be a useful
practice to establish one However in some instances
a simple monetary value for the food MEB is sufficient
This could be the case when the MEB is calculated to
review an existing MEB if reference basket is not needed
for operational purposes when time is limited or
where limited data means a reference basket cannot be
adequately calculated Wherever a food reference basket
is not needed the food MEB will simply be the mean (or
median) food expenditures by food groups or food items
as calculated above If a reference food basket is feasible
and desired the next steps depend on the level of detail in
the data available
With expenditure data and market prices a food
reference basket can be approximated using expenditures
by food group or food item and dividing these
expenditures by the relevant food prices This provides
estimates of consumed quantities Expenditures and prices
must be collected at the same time in order to arrive at
correct quantities If for example prices are collected six
months later than expenditures and prices have changed
significantly dividing expenditures by prices will produce
inaccurate estimates
Note that the level of detail and accuracy with which a
food refence basket can be established using expenditures
and prices also depends on whether expenditures
were collected at the food group or food item level Box 6
illustrates how to approximate a reference basket when
expenditures are collected at the food group level and
box 7 shows an example of a food basket estimation from
an assessment in Kinshasa Democratic Republic of the
Congo
If the expenditure module includes consumed quantities
of food in addition to expenditures a food basket can be
established directly based on the consumed quantities by
food group or food item Having data on quantities will
also enable analysts to estimate prices directly from the
survey data by dividing the household expenditure on a
particular food item by the quantity consumed This can be
advantageous as it provides a direct estimate of the prices
households actually paid (unlike a price survey which uses
typically consumed items and is often only conducted
at specific points of sale) On the other hand this may
introduce issues related to non-standard measurement
units that make prices hard to compute and aggregate26
Box 8 shows an example from Coxrsquos Bazar of how a food
reference basket can be established using item-level
expenditures and quantities from the survey data
Once the quantities consumed have been established using
one of the methods described above it is good practice to
check the calories these quantities provide and the balance in
terms of nutrients The basket should be close to the Sphere
Standard of 2100 kcal per person per day ndash if it is not one
option could be to scale the basket Use information on the
calorie content of the different food items in the basket to
calculate the total calorie content of the basket27 The quantities
in the basket can then be scaled up or down to reach 2100
kcal However bear in mind that if the reference cohort has
been well selected and the data is of sufficient quality and
detail the basket should already be close to 2100 kcal If large
rescaling is required investigate the reasons behind this For
the sake of simplification quantities can be rounded and the
basket can be streamlined by removing items with very low
consumption or nutritional value
26 Deaton and Grosh 2000 27 Calorie information of food items can be drawn from a variety of sources The Nutval tool (httpwwwnutvalnet) provides information on calories and other nutrients for a list of items Consider that the
specifications and quality of a product can influence its caloric value (eg whole fish vs fish fillet) ndash it might be necessary to adjust for this for certain items that vary widely Many food composition tables (available from FAO for different continents httpwwwfaoorginfoodsinfoodstables-and-databasesfaoinfoods-databasesen) contain a wastage factor or edible portion conversion factor to convert from edible portions into full products as they are bought on the market
16
Minimum Expenditure Baskets Guidance Note | December 2020
After establishing the reference basket and possibly rescaling
it the basket is priced This is done by multiplying the basket
quantities by the food prices The basket can be priced using
current food prices from a price survey or by estimating food
prices from the expenditure data as described earlier The
result should be close to the expenditures for the reference
cohort although differences could arise from any rescaling or
simplification of the basket
APPROXIMATING A FOOD BASKET WITHGROUP-LEVEL FOOD EXPENDITURES
Box 6
HOW TO
Data quality and granularity has a big impact on the calculation of a food reference basket If consumed quantities are not
directly available in the dataset they need to be calculated by dividing expenditures by prices However this will always
produce an approximation and the more aggregated the data on expenditures is the more approximate the results will be
In particular when the food expenditure data is available at the food group level care needs to be taken when converting
expenditures into quantities
For example to convert expenditures on the food group ldquocerealsrdquo into a reference quantity analysts need to divide cereal
expenditures by the price of cereals But how do they determine the price of cereals This is a food group not a specific item
so there is no exact price The recommended way to approach this is to determine which is the most commonly consumed
item or combination of items for each food group Then a price for the most commonly consumed item or a composite price
of a combination of items can be used to arrive at quantities So if the most commonly consumed cereals for the population
of interest are maize and rice and they are eaten in equal measure by the population the cereal quantities for the reference
basket can be calculated in the following way
Mean cereal expenditures for our reference cohort = 150 shilling
Price of rice = 18 shillingkg
Price of maize = 12 shillingkg
Composite price of rice and maize = (18 + 12) 2 = 15 shillingkg
Cereal quantity consumed = 150 shilling (15 shillingkg) = 10 kg (5 kg rice 5 kg maize)
Of course this is an approximation care needs to be taken when converting expenditures into quantities using
group-level data
Certain food groups may lend themselves more to this approximate conversion than others For example cereals
might be relatively easy to convert using this method as cereal consumption often is concentrated on a few key staples In
contrast vegetable consumption may be so diverse that conversion via prices is not helpful In this latter case one option
could be to obtain reference basket quantities for the groups that can be converted and leave other groups as expenditures
only so that the food MEB becomes a combination of quantities and expenditures
In summary to establish the food basket
i Calculate mean (median) food expenditures by food group
or item If an explicit reference basket with quantities is not
needed stop here and simply use the expenditures as the food
basket
ii Estimate consumed quantities (by dividing expenditures
by prices or directly from data if it contains consumed
quantities)
iii Check the resulting quantities and consider scaling to meet
Sphere Standards
iv Price the basket using market prices or prices derived
from the household data
17
Minimum Expenditure Baskets Guidance Note | December 2020
Table a Food reference basket ndash Kinshasa MEB
COUNTRYEXAMPLE
KINSHASA FOOD REFERENCE BASKET USINGFOOD GROUP EXPENDITURES
Box 7
In the Kinshasa urban essential needs assessment28 the food reference basket for the MEB was established as follows
Expenditure data was available at the food group level only The caloric importance of each food group (column A of the
table below) as a part of the overall food intake was determined For each of the calorie-relevant food groups the most
commonly consumed food item was then identified (eg maize in the case of cereals) (see column B) Using the average per
capita expenditure from the household survey (column C) and the market price for each food item (column D) the
quantities consumed per person per month were approximated (column E) Next the total calorie intake was calculated
(column G) For urban Kinshasa this amounts to 1967 kcal which is close to the Sphere Standard of 2100 kcalpersonday
and suggests that the expenditure data is likely to be reliable However a proportional rescaling to 2100 kcalpersonday
was done to ensure consistency with Sphere (column H) On the basis of the rescaled total calories all values were then
converted back to monthly figures to arrive at a monetary value for each food item (columns I and J) In addition to the
calorie-relevant food items the mean expenditures on other food categories that households regularly consume were
added (vegetables fruit etc) As these food items represent little overall share of peoplersquos calorie consumption (given the
quantities consumed or the type of the foods) they were not included when calories were calculated Furthermore it would
be difficult to select specific food items in each of these categories as they are quite diverse (eg vegetables) However as
most households still consume these food items as part of their usual diet and they provide important micronutrients their
costs need to be reflected in the food MEB The mean expenditure on these food categories was therefore used as a
good-enough approximation for householdsrsquo consumption of these food groups Meals consumed outside the household
were excluded from the MEB as they were not considered essential
Food
grou
p
Food
item
per
capi
ta a
vm
onth
ly e
xp
Pric
e(f
ranc
kg)
kg c
ons
per
mon
th =
CD
food
item
kca
lpe
r 10
0g
kcal
con
s p
er d
ay=(
EF
10)
30
kcal
per
day
res
cale
d=G
(21
001
967)
kg p
er m
onth
res
cale
d=(
H(
F10
))30
roun
ded
MEB
food
-bas
ket
(fra
nc)=
ID
6898
1808
2089
2341
4306
1817
2826
833
799
2509
2144
900
500
1300
2300
2500
2200
77
36
16
10
17
08
920
412
179
302
44
110
1967
360
342
335
890
76
400
TOTAL
982
440
192
322
47
118
2100
82
39
17
11
18
09
7400
1900
2200
2500
4600
1900
2800
800
800
2500
27400
A B C D E F G H I JCereals
Tubers
Pulses
Oilsfats
Meatfish
Sugars
Vegetables
Fruit
Dairy
Condiments
Meals out-
side home
Maize
Cassava
Beans
Veg Oil
Fish
White sugar
Vegetables
Fruit
Dairy
Condiment
Meals out-
side home
29 WFP 2019 Also see box 5
18
Minimum Expenditure Baskets Guidance Note | December 2020
COUNTRYEXAMPLE
COXrsquoS BAZAR FOOD REFERENCE BASKETWITH DETAILED EXPENDITURE AND QUANTITY
Box 8
In the MEB for Coxrsquos Bazar calculated as part of the REVA II assessment expenditures and consumed quantities were
available for 87 food items which formed the basis for the consumption aggregate While the expenditure data was used to
select the appropriate reference cohort the reported quantities were used to determine household calorie intake
Quantities were reported at the food item level and consumed calories were calculated for each item The items were then
categorized by food group (cereals pulses oilsfats vegetables etc) and the total calories from each group were
calculated To create an operationally relevant reference basket without very large numbers of food items the number of
items in each food group were reduced where possible For example 95 percent of the calories that households get from
the food group ldquocerealsrdquo come from rice The cereal food group was therefore simplified to rice only keeping the total
calories sourced from cereals constant and adjusting the quantity of rice in the basket slightly upwards For pulses the four
main consumed items were identified and calories and quantities proportionally adjusted For other food groups such as
vegetables the variety of items consumed within the group was too great to simplify items to a small number for this
group no items were assigned and instead total expenditures on vegetables for the reference cohort were used directly in
the food MEB The total calories of all items were taken into account The resulting basket was close to 2100 kcal so only
minor rescaling was undertaken to arrive at final reference basket of 2100 kcalpersonday
Once the final basket had been determined quantities were priced using median prices derived from the household data
(by dividing expenditures by purchased quantities for the relevant items)
For vegetables fruits meat dairy and condiments expenditures are used directly in the food MEB (converted into monthly per
household values) For all other items quantities per capita per day are multiplied by the item median price (as derived from
the household data) and converted into monthly per household values
The MEB uses household size 5
Note The MEB for Coxrsquos Bazar was calculated for analytical purposes for the REVA II assessment It is not the operational MEB used
for the district
Foodgroup
Fooditem
Consumedquantity(grammescapitaday)
Calories(kcalcapitaday)rescaled
Median prices(takakg)
Value in MEB(taka per HHmonth)
424
14
7
2
1
182
6
81
1
33
6
28
1527
48
27
8
4
78
5
85
1
294
24
0
2100
30
80
60
40
80
-
-
-
-
80
60
-
1909
168
67
14
13
1065
48
1600
15
392
57
345
5691
Cereals
Pulses
Pulses
Pulses
Pulses
Vegetables
Fruit
Meat
Dairy
Fats
Sugar
Condiments
TOTAL FOOD
Rice
Lentil
Chickpea
Anchor daal
Mung
none
none
none
none
Soybean oil
Sugar
none
Table a Food reference basket ndash Coxrsquos Bazar MEB
19
Minimum Expenditure Baskets Guidance Note | December 2020
4 Establish the non-food basketOnce the food component has been established a non-
food component is added There is no wholly satisfactory
way to add a non-food component as it can be difficult to
define an essential minimum Unlike food needs many
non-food needs are often more contextual and are not
easy to anchor in a specific universal threshold (like the
food Sphere Standard of 2100 kcal per person per day)
While Sphere Standards exist they often need to be
contextualized and may not cover all non-food essential
needs
The non-food basket can be established with different
levels of detail depending on the available data and the
level of granularity desired
As for the food expenditures start by calculating the
mean (andor median) non-food expenditures for the
reference cohort If the expenditure data is detailed it can
be used to identify specific non-food needs Expenditures
can be analysed by non-food group (eg shelter hygiene
or transport) to design a non-food basket composed
of group-specific expenditures The precise non-food
components can vary by context but would generally
include the components discussed in the section on
the rights-based MEB below Some non-food items that
expenditure data has been collected for might need to be
excluded for the purpose of constructing the MEB (eg
tobacco which is hard to consider an essential need)
In theory it would be possible to establish a non-food
reference basket with specific quantities using the same
method as for food ie by dividing expenditures by prices
to arrive at quantities However this is usually not feasible
for non-food goods and services simply because non-food
expenditure data is often much harder to break down into
specific items than food expenditure data For instance
even if expenditures on clothing or transportation
are known relating this to exact clothing items or
transportation services and then obtaining accurate
prices for those itemsservices will often prove difficult if
not impossible Therefore as a general recommendation
in the expenditure-based approach when non-food
expenditure data is not available at the item level it is
best to keep the non-food basket to expenditures and not
provide quantities If reliable market price information on
relevant non-food items is available total expenditures
could be checked against prices to obtain an approximate
idea of the adequacy of the non-food expenditures
Particular groups of non-food expenditures may require
special attention due to their nature Box 9 highlights a
few examples
TIP BOXNON-FOOD EXPENDITURES ndashEXPENDITURES OF PARTICULAR INTEREST
$$
$
Box 9
Shelter expenditures can be a tricky component to deal with especially for urban populations If the share of the
population who rent accommodation is significant rent will typically be included in the MEB as it is the cost of shelter an
essential need Indeed it can form quite a significant part of the MEB However if the resulting MEB is compared to actual
expenditures to determine whether households fall below the MEB those who own their dwelling and therefore do not pay
rent might be classified as unable to cover their needs just because they do not have any major shelter expenditures
Therefore large single expenditures such as rent should be included with care and context will determine how shelter
expenditures are handled in the MEB Generally speaking if no or very few households in the population of interest have
major shelter expenditures such as rent this component should be left out of the MEB and no attempt made to impute it
(as is sometimes the case in poverty line estimations) If the majority of households rent their dwellings it is advisable to
include mean rent expenditures in the MEB The trickier case is when the households in the population of interest are split
between a significant number of households living in owned or no-rent housing and a significant number paying rent ndash
here it is difficult to reflect shelter expenditures adequately in the MEB Simply using mean rent estimations in the MEB will
underestimate the need for the renters while overestimating it for those who own their housing or do not pay rent In this
case insofar as data allows one solution could be to impute rent expenditures for the non-renters by estimating the
would-be rental cost for the type of housing they live in Doing this typically requires a housing module in the household
survey that contains information on ownership and types and sizes of housing so rental equivalents can be computed and
imputed for the non-renters
20
Minimum Expenditure Baskets Guidance Note | December 2020
NON-FOOD EXPENDITURES ndashEXPENDITURES OF PARTICULAR INTEREST
$$
$
Box 9
Health expenditures can also be challenging to capture adequately in survey data as such expenditures are often irregular
in nature Bear in mind that health expenditures usually consist of payment for goods such as medicines and for services
such as visits to the doctor When analysing the expenditures and deciding how to include them in the MEB consider which
services may be provided free of charge and what households pay themselves and at what cost30
Care should be taken when it comes to the underreporting of expenditures and treatment of expenditures that are
irregular in nature Remember that the MEB should include all recurrent essential needs but it typically does not include
one-off expenditures ldquolumpy expendituresrdquo such as marriage expenditures or dowries or investments Expenditures
on durables (for instance the purchase of vehicles or large household appliances) are also not included (in national poverty
lines the rental value of the durables owned by households adjusted for depreciation is sometimes included31 however
this is not recommended for MEB calculations)
Household expenditures on savings taxes and debt repayment are not usually included in the MEB as these types of
expenditures do not reflect actual consumption
Tobacco and alcohol are often included in expenditure surveys While households may choose to spend money on these
items they can fairly be assumed to be non-essential and are generally not recommended for inclusion in the MEB
The ldquoquick fixrdquo if data is very limited If the expenditure
data has no or very insufficient data on non-food
expenditures a ldquoquick fixrdquo solution is to use the average
non-food expenditure share of total expenditures This can
often be obtained from external sources such as monitoring
reports or food security assessments This is then added
COUNTRYEXAMPLE
Table a Non-food basket ndash valuesCoxrsquos Bazar
Value in MEB (takaHHmonth)
Non-food group
Toiletries and cleaning
Clothes shoes and towels
Cooking equipment
Education
Fuel and electricity
Medical treatment
Household textiles and small repairs
Communication
Transport
Total non-food
461
521
25
134
775
447
57
274
295
2990
Figure a Non-food basket ndash distribution Coxrsquos Bazar
Note The MEB for Coxrsquos Bazar was calculated for
analytical purposes in the REVA II assessment
It is not the operational MEB for the district
9Communication
10Transport
2Householdtextiles and
small repairs
15Medical
treatment
26Fuel andelectricity
5Education
1Cooking
equipment
17Clothes shoes
and towels
15Toiletries
and cleaning
EXPENDITURE-BASED NON-FOOD REFERENCEBASKET EXAMPLE FROM COXrsquoS BAZAR
Box 10EG
to the cost of the food basket to arrive at the total MEB
However when using an additional data source analysts
should understand how the average share of non-food
expenditures has been calculated and what sample it has
been derived from as it may not reflect the consumption
patterns of the reference cohort
30 The WHO and Global Health Cluster guidance on health expenditures in the MEB has some useful insights into household health expenditures See WHO and Global Health Cluster ndash Cash Task Team 2020 31 Deaton and Zaidi 2002
21
Minimum Expenditure Baskets Guidance Note | December 2020
52 The rights-based approachIn humanitarian contexts ldquoessential needsrdquo have been
understood as referring to access to full rights as set out by
international humanitarian law and the Humanitarian Sphere
Standards The term ldquorights-based MEBrdquo is derived from
this understanding According to the operational guidance
on multipurpose cash grants32 international humanitarian
and human rights law protects the right of crisis-affected
persons to food33 drinking water soap clothing shelter and
lifesaving medical care Humanitarian Sphere Standards
builds on this definition and outlines minimum humanitarian
standards in the areas of food security and nutrition
shelter and settlement health and WASH (water supply
sanitation and hygiene)34 In some contexts residency or legal
documentation is also included Humanitarian standards
for education are outlined in the Education in Emergencies
Minimum Standards Handbook35
The rights-based approach entails defining a detailed list
of the food and non-food items that make up the MEB
reference basket and pricing them using current market
prices MEBs built by the Interagency Cash Working Group or
other interagency coordination forum are often constructed
following the rights-based approach with each sector or
cluster contributing to the needs in their respective sectors
In these cases WFP is usually responsible for defining the
food component of the MEB For both food and non-food
items the reference basket is typically produced or cross-
checked through focus group discussions with the population
of interest partners and key informants It is usually put
together based on the needs of an average-sized household
1 Establish the food basketTo construct the food basket for a rights-based MEB compile
a list of food items and their quantities The Sphere Standards
offer a useful starting point recommending a diet of 2100
kcal per person per day with 10ndash12 percent of daily energy
intake from protein and 17 percent from fats36 The food
basket should be adapted to local diets and preferences
2 Establish the non-food basketOnce the food basket has been established a non-food basket
should be added In the rights-based approach this is typically
done by quantifying needs by producing a list of items by
sector Some examples are found below
Shelter This is the cost of accommodation that meets
basic shelter needs and rights What this means in practice
will depend on the context driven for example by weather
conditions and what is realistically available to the population
Utilities These include the cost of basic utilities such as safe
drinking water and depending on the context electricity
Non-food items These reflect basic household needs
related to cooking clothing and hygiene plus other general
household items Cooking gasfuel or firewood is often
included In line with the definition of the MEB the list should
focus on recurrent needs In practice these non-food items
can look very different depending on the context 38
Services This includes the costs of accessing basic services
such as healthcare education transport and communication
Healthcare costs are often difficult to quantify since they
are inherently irregular large and unpredictable Typically
however only basic minimum needs are covered in the MEB
such as eg two visits per year to the doctor expenses for
critical events deliveries and medicines are sometimes also
included Note that even if a need is not covered by the MEB
it does not mean that these needs do not need to be met for
the population of interest Health can be an example of this
health needs are often better met through service provision
than purchased through the market and therefore may
be only partially reflected in the MEB However guidance
from WHO and the Global Health Cluster notes that people
tend to have some level of health expenditures even when
COUNTRYEXAMPLE
SHELTER IN THE MEBFOR SYRIAN REFUGEES
EG Box 11
For the Syrian refugee operation in Turkey the MEB
includes the costs of shelter that meets certain
standards such as a minimum of 35 m2 per
person access to a toilet and running water
32 UNHCR et al 2015 33 Defined as energy needs not considering full nutrient needs (protein vitamins minerals etc) 34 See the Sphere Standards Handbook 35 INEE 2010 36 Further recommendations on micronutrient requirements can be found in the Sphere Standards Handbook37 Hobbs 201638 For some refugee contexts the Office of the United Nations High Commissioner for Refugees (UNHCR) has lists of specific items which can be considered for the MEB
22
Minimum Expenditure Baskets Guidance Note | December 2020
policies are in place that require the free public provision of
health services39
Education costs usually cover school fees materials
uniforms and transport depending on what households
have to pay themselves and what is publicly available
Transport and communication needs are often defined as
the average transport and communication costs reported by
household surveys and then validated with the communities
COUNTRYEXAMPLE
EXAMPLE OF A RIGHTS-BASED MEBFOR NORTHEAST NIGERIA
Box 12EG
The northeast Nigeria cash working group designed a MEB for a household of seven people40 the resulting reference
basket is shown below
Sectorgroup
Item Quantity(7 pers HH)
Sectorgroup
Item Quantity(7 pers HH)
Cooking fuel
WASH
Cooking fuel
WASH
Transportation
Communication
Health
Education
Firewoodbriquette
charcoal
Water + vendor fee
Bathing soap
Laundry soap
Sanitary pads
Firewoodbriquette
charcoal
Water + vendor fee
Bathing soap
Laundry soap
Sanitary pads
Rides
Airtime 500 NGN
Average expense
Pen
Pencil
Notebook
1 bag
158 jerrycans
13 bars
3 bars
4 packs
1 bag
158 jerrycans
13 bars
3 bars
4 packs
10 rides
1
7 pers
3 pcs
3 pcs
3 pcs
Table a MEB example northeast Nigeria
27 kg
45 kg
135 kg
18 L
27 kg
18 kg
36 L
09 kg
144 kg
2 kg
2 kg
1 kg
05 kg
12pcs
1L
Food Rice
Maize
Beans
Palm oil
Groundnuts
Sugar
Vegetable oil
Salt
Onion
Non-leafy vegetables
Leafy vegetables
Fruits
Meats
Chicken eggs
Vinegar
communication needs can also be specified as the cost of a
SIM card with a certain amount of data or airtime
3 Price the reference basketWith the food and non-food reference baskets established
the list of items and quantities are now priced using updated
prices from markets relevant to the population of interest
The pricing should be done based on actual current market
prices This produces the final rights-based MEB
39 WHO and Global Health Cluster ndash Cash Task Team 2020 40 Cash Working Group Nigeria 2018
23
Minimum Expenditure Baskets Guidance Note | December 2020
MEB APPROACHES ndash CONSTRUCTION SUMMARYBox 13
HOW TO
Rights-based approach
Establish the food basket
Define a list of relevant and locally preferred and
available food items and their quantities The Sphere
Standards can be used as a reference
Establish the non-food basket
Define a list of essential non-food items relevant to the
population of interest and their quantities Services such
as education or transport can also be included The list is
usually put together sector by sector
Price the basket
Use current market prices for the food and non-food
items in the reference baskets to calculate the price of
the basket Use prices from markets relevant to the
population of interest
1
2
3
4
1
2
3
Expenditure-based approach
Prepare the expenditure data
Ensure the data is cleaned Compute expenditures by
combining cash and credit expenditures the value of
consumed own production and consumed assistance
for both food and non-food expenditures Compute
expenditures as per capita figures
Select the reference cohort
Identify households ldquojust able to meet their essential
needsrdquo using indicators such as FCS FCS-N housing or
others excluding households in extreme quantiles of
expenditure distribution or other criteria or
combination of criteria Check the sensitivity of the
results to the selection of reference cohort
Establish the food basket
Calculate mean (median) food expenditures by food
group or item Either stop here or ndash to obtain a refence
basket ndash estimate consumed quantities check the
calorie content of the resulting quantities and consider
scaling them to Sphere Standards Price the basket
using market prices or prices derived from the
household data
Establish the non-food basket
Calculate mean (median) non-food expenditures by
non-food group or item If item-level data and prices
are available it is possible to derive a non-food
reference basket using same methodology as for the
food basket otherwise the non-food basket will
comprise the expenditures at the group level If a
quick-fix solution is needed add the average household
non-food expenditure share to the food MEB
53 Summary and data needs for expenditurendashbased and rights-based approachesBox 13 summarizes the steps to follow in order to construct a
MEB using an expenditure-based or a rights-based approach
24
Minimum Expenditure Baskets Guidance Note | December 2020
Qualitative understanding
of essential needs for the
population of interest
Representative household
survey with detailed
expenditure module
List of ldquorights-basedrdquo needs
Price information
Focus group discussions with key informants or population
of interest
Literature review of existing information on the essential needs of
the population of interest
WFP essential needs assessment emergency food security
assessment or comprehensive food security and vulnerability
analysis or other representative pre-assistance baseline survey
National household budget surveys household income and
expenditure surveys living standard measurement surveys or
other large-scale household survey
Clusters Cash Working Group other interagency forum
Sectoral assessments other secondary information
Price data series covering the area of interest for relevant food
and non-food items and services from WFP (Dataviz41 has
up-to-date price information) or partners
Price indices from national statistical offices
Prices derived from household expenditure data where quantities
are also reported
Suggested sources Expe
ndit
urendash
base
d
Righ
tsndashb
ased
INFORMATION NEEDS AND SOURCESMEB APPROACHES
Box 14
HOW TO
Information need
TIP BOXWHAT IF DATA USINGA HOUSEHOLD ECONOMY APPROACH IS AVAILABLE
$Box 15
The household economy approach (HEA) developed by Save The Children is commonly used for analysing food security and
livelihoods It is based on understanding how households normally access income food and other itemsservices required
for survival established through a baseline analysis As part of the baseline the HEA defines livelihood zones where
households share similar strategies for obtaining food and income It also distinguishes households within these livelihood
zones in at least three (often four and sometimes more) wealth groups The HEA baseline quantifies the sources of food
and income and the expenditure patterns for each wealth group and livelihood zone
The information collected on expenditures can be used as a data source for calculating a MEB However due to the relative
nature of the wealth cut-off points used there is no set standard regarding which group should be the reference for the
MEB If HEA data is utilized it is important to understand how it was collected ndash the HEA is simply an analytical framework
not a set method of data collection Thus while HEAs are often conducted through qualitative methods (eg focus group
discussions) they may also be based on quantitative modules in household surveys The latter yields more rigorous
information however qualitative data can be used but should be cross-checked or triangulated with other sources
39 See VAM data portal at httpsdatavizvamwfporg
25
Minimum Expenditure Baskets Guidance Note | December 2020
54 Expenditure-based or rightsndashbased approach Pros and consThere are advantages and disadvantages to both types of
approach which should be kept in mind when constructing
the MEB
The expenditure-based approach has the advantage that it
directly reflects the actual demand of the population of interest
as it uses survey data to examine peoplersquos consumption
behaviour It is also fairly straightforward to carry out if good
survey data on the population is available One disadvantage is
that it can be difficult to put into practice when the population
of interest is generally poor (such as in a pre-assistance
refugee situation) because the number of households who can
constitute the reference cohort can be too small to analyse
Also care has to be taken when looking at expenditure patterns
only as the reference cohort may not always cover all of their
essential needs to a desired level (from a ldquorightsrdquo perspective)
For example the food patterns for those ldquojust able to meet
their essential needsrdquo may not always be very nutritionally
diverse as they are based purely on consumption behaviour42
In general the expenditure-based approach should not be applied
without good quality household expenditure data
TIP BOX ADVANTAGES AND DISADVANTAGES OFDIFFERENT APPROACHES TO ESTABLISHING MEBS
Box 16
Pros
Cons
Expenditure-based Rights-based
Straightforward to carry out if household data
is of good quality
Builds on actual consumption patterns of the
population of interest
Difficult to identify reference cohort if
everybody is poor
Survey data may not capture all essential needs
fully from a ldquorightsrdquo perspective
Survey data is not needed
Effective demand can be different from identified
needs leading to a MEB that does not reflect
actual demand and making comparison with
monitoring data tricky
Contains incentives to inflate sector-specific needs
The advantage of the rights-based approach is that
it can be used to construct a MEB without survey data
(although survey data is needed to monitor the MEB) One
disadvantage is that the effective demand of households
can look quite different from the basket that results from
this approach Another disadvantage is that particularly
when constructed in an interagency setting a rights-based
MEB can easily become an instrument for different partners
to compete for and secure funding There is a substantial
incentive to include excessively high sectoral needs if sector-
specific interventions are envisaged Finally if the MEB is
very detailed but the expenditure module in the household
surveys used to monitor peoplersquos expenditures against the
MEB is very crude comparison is difficult and therefore the
practical use of the MEB can be limited Many households
may fall below the MEB simply because of the discrepancy in
methods between the MEB and the monitoring data This is
similar to the issue previously discussed regarding the use of
national poverty lines
Box 16 summarizes the advantages and disadvantages of the
two approaches
42 A study conducted in Nepal showed that the food poverty line is well below the so-called ldquonutrient povertyrdquo line (see Geniez et al 2014)
26
Minimum Expenditure Baskets Guidance Note | December 2020
6 Arriving at a realistic and operationally relevant MEBRegardless of which processes and approaches are used to
construct the MEB it is crucial to arrive at a final result that
is a realistic picture of the cost of essential needs for the
population of interest rooted in actual consumption
behaviour This section looks at how approaches can be
combined to generate a hybrid MEB and how the result can be
ldquoreality checkedrdquo and validated
61 Combining approaches the hybrid MEBAs described in section 54 there are disadvantages to the
expenditure-based and the rights-based MEB approaches that
can affect the final MEB One way to overcome this challenge
may be to combine information from each approach in
a ldquohybridrdquo MEB This means making sure that the MEB is
consistent with the actual consumption behaviour of the
population of interest as found in expenditure data while
keeping the rights-based lens There is no one way to go about
this the method is subject to the availability of expenditure
data and other information on essential needs as well as the
objective of the MEB
When good quality expenditure data with a large enough
sample size is available for constructing the MEB it is good
practice to use the expenditure-based approach as a basis
for the analysis as far as possible If the expenditures of
the reference cohort are subsequently found not to reflect the
costs of covering certain essential needs for the population of
interest rights-based information should be used to reinforce
the MEB with a hybrid model If expenditure data is not
available and cannot be collected a rights-based MEB can be
constructed but should be cross-checked against any available
household-level information on consumption patterns
When starting with the construction ofan expenditure-based MEB
Did the household survey capture all essential needs or
are some not included in the data at all
If some needs are wholly overlooked consider using
rights-based information to capture them but ensure these
needs are actually in demand by the population of interest
and only missing because the survey did not capture them
Are the expenditures that are typically trickier to capture
well reflected and are the reference cohortrsquos expenditures
on them adequate from a rights-based perspective
For example if education expenditures are completely
inadequate for the reference cohort (and this is not because
the reference cohort selected is ldquotoo poorrdquo) consider using
rights-based information to capture them eg by using the
cost of school fees or school supplies like books or
uniforms
Be particularly careful with the inclusion of needs where the
supply of goods or services is far from adequate or may be
inexistent The MEB needs to ultimately reflect consumption
behaviour so adding goods or services that are not
available to the population of interest or not in demand
will lead to an unrealistic MEB
When starting with the construction ofrights-based MEB
Are the identified needs in line with the actual
consumption patterns of the population of interest
Check the reference baskets against any available
information on demand and consumption and adjust items
and quantities to reflect actual consumption patterns This
could be done using data on consumption shares by food
group and non-food group for example
Are there needs that people consider essential and choose
to spend resources on but are not captured by any sector
Check the reference baskets against any available
information on demand and consumption and adjust items
and quantities to reflect actual consumption patterns
The key to constructing a hybrid MEB lies in triangulating
information and asking the right questions during the
analysis When constructing a MEB consider the following
27
Minimum Expenditure Baskets Guidance Note | December 2020
Box 17 contains examples of hybrid MEBs constructed in different contexts
COUNTRYEXAMPLE
HYBRID MEBS IN URBAN SETTINGS IN KINSHASATHE DEMOCRATIC REPUBLIC OF THE CONGOAND FOR SYRIAN REFUGEES IN TURKEY
Box 17
For the MEB calculated as part of an urban assessment in Kinshasa43 a hybrid approach was chosen to deal with
hard-to-capture but essential expenditures such as health and education Health costs are often difficult to estimate as they
are not regular and when they do occur they often make up a large share of monthly expenditures The analysts decided to
estimate health costs through a rights-based approach instead of using expenditures from the survey Qualitative
information from key informants was used to define the cost of one doctorrsquos visit per year for each household member In
each commune the median cost was between CDF5000 and CDF6000 per visit this was represented in the MEB as
CDF500 per household member per month Over-the-counter medication was also included as part of health-related
expenditure through the addition of a per-capita expenditure of CDF1500 every two months sufficient for a course of
antimalarial drugs or antibiotics and simple medication such as painkillers or anti-inflammatory drugs
In Turkey expenditure and price data from different sources was used to assess update and adjust an existing
rights-based MEB44 for Syrian refugees living in the country A hybrid food basket was calculated using detailed information
on the consumption behaviour of Syrian refugees in Lebanon collected through itemized receipts from food assistance
e-cards The resulting food basket was triangulated with the less detailed information available from a household survey on
Syrian refugees in Turkey The results showed strong consistency between consumption behaviour of both groups
The resulting food reference basket for the MEB was then priced with official price statistics data and inserted into the
rights-based MEB Quantities of non-food items were kept as before but updated with current price data To ensure that
the MEB reflected consumption behaviour expenditure shares were triangulated with household data See table a
To value and update the MEB price data was required The official price statistics included higher quality items and brands
consumed more by the average Turkish population than by the poorer refugees To correct for this the difference between
the price of the MEB and the food expenditures of a non-poor cohort were assessed and a correction factor applied to
compensate for the overestimation of the updated MEB
Commodity
Table a Food reference basket ndash MEB for Syrian refugees in Turkey
Daily ration perperson in gram
Dailykilocalorie
Old referential food basketDaily ration perperson in gram
Dailykilocalorie
Revised Turkey food basket
150
200
50
20
30
40
20
8
30
30
5
0
0
0
0
540
684
186
29
65
137
0
28
116
265
0
0
0
0
0
100
50
0
70
0
50
30
50
50
25
5
250
50
30
5
Rice white medium grain
Bulghur wheat
Pasta
Egg whole chicken fresh
Poultry
Beans dried
Cucumber
Cheese canned
Sugar
Oil sunflower fortified
Salt iodised
Bread made from wheat
Yoghurt whole milk (leban)
Tomatoes red ripe
Tea black nutrients per 100ml of brewed tea
360
171
0
100
0
170
0
178
194
221
0
675
31
5
0
Total Kcal 2050 Total Kcal 2104
43 WFP et al 201844 WFP 2018
28
Minimum Expenditure Baskets Guidance Note | December 2020
62 Reality checks and validation with stakeholdersIn addition to asking the right questions of the data as
described in the previous section it is crucial to reality check
results when constructing the MEB This means understanding
whether the MEB provides a picture of the cost of living that
matches the reality on the ground
First of all it is important to check the MEB result with the
real circumstances of the population of interest Focus group
discussions andor key informant interviews can be held when
starting work on the MEB and after a result is obtained in
order to ensure that the MEB is a true reflection of needs and
priorities
The MEB figures can be compared with the national poverty
line ndash even if it is not advisable to use the poverty line directly
as the MEB it is good practice to check the MEB results against
it They can also be checked against any social assistance
transfer values provided in government programmes the
minimum wage or the casual labour rate or any other
information available about needs and cost of living For
instance if the MEB is much higher than what the wages
from one month of work for a typical household can buy
that could indicate that it needs adjustment and that some
of the analytical steps need to be revisited ndash as long as the
wage rate itself is reasonable The same goes for the poverty
line ndash if the two are very far apart it could be a sign that the
MEB analysis should be crosschecked Perhaps the reference
cohort was not adequately selected some sectoral needs were
overestimated or there is a large proportion of consumption of
own production has not been properly taken into account
Something that is often of particular interest is the nutritional
composition of the food part of the MEB As seen above MEB
construction typically starts from the Sphere requirement of
2100 kcalpersonday However since the MEB follows the
actual consumption behaviour of the population of interest
(especially when following an expenditure-based approach)
the resulting food basket reflects what households actually
eat which is not necessarily a nutrient adequate diet If the
basket is found to be very low in essential nutrients it could
be that the reference cohort was not well selected and a
wealthier cohort with a more balanced diet at the 2100 kcal
personday threshold might need to be identified45 However
selecting better-off households will not necessarily lead to a
more nutritionally balanced basket as food preferences are
influenced by a range of factors in addition to budget
Analytical tools to determine the cost of nutritious diets
include Cost of the Diet (CotD) developed by Save the Children
UK and used by WFP in the Fill the Nutrient Gap Analysis
CotD uses linear programming to establish the lowest cost
diet that can meet requirements for energy protein fat and
13 micronutrients for individuals in a population considering
age gender body weight physical activity level and whether
a woman is pregnant or breastfeeding CotD can be thought
of as the lowest cost of an optimal diet considering individual
requirements It is therefore useful in illustrating the needs
of vulnerable populations and their nutrient intake barriers
However it is important to keep in mind that a MEB food
basket may not deliver adequate nutrient intake when used
to set a transfer value for households even if aligned with
an optimal diet As noted above because of household
consumption choices and food allocation within households
having more money to spend may not necessarily lead
households to buy more nutritious food
MEBs should be first and foremost built on consumption
patterns that reflect actual behaviour A large difference in
cost between the MEB food basket and CoTD may hence
be driven by factors such as low availabilityhigh cost of
nutritious foods or household preferences The WFP technical
note on Fill the Nutrient Gap and minimum expenditure
baskets offers further insights into the complementarities
of the two analyses and how to use them on conjunction for
programming purposes46 When a MEB is operationalised
additional nutritional considerations could be necessary
It is important to check the MEB result with the real circumstances of the population of interest Focus group discussions andor key informant interviews can be held when starting work on the MEB and after a result is obtained in order to ensure that the MEB is a true reflection of needs and priorities
45 Note that the 2100 kcal Sphere Standard for daily diet is an estimate based on a population average Nutrient needs vary across the lifecycle It is also recommended that a food basket based on the 2100 kcal threshold should include a minimum of between four and five different food groups
46 Also see WFP 2020b
29
Minimum Expenditure Baskets Guidance Note | December 2020
COUNTRYEXAMPLE
TURKEY NON-FOODBASKET MEBCOMPOSITION VERSUSACTUAL CONSUMPTION
Box 18
In the original rights-based MEB constructed for the
Syrian refugee operation in Turkey 17 percent was
devoted to education expenditure The average
education expenditure share in the pre-assistance
expenditure data was under 2 percent with little
variation by household vulnerability status50 The
large expenditure share in the MEB reflects the
costs for transportation to schools in rural areas
where no buses are available and where the only
way for households to send children to school is to
hire private transport In order to provide for
childrenrsquos right to education the transport costs are
counted for in the MEB
Since the MEB was constructed to assure full access
to all rights the high education expenditure was
justified However a comparison of the theoretical
costs for basic needs as estimated by humanitarian
partners and the actual consumption choices of
households can reveal divergence Even if
households are assisted there is nothing to say that
they will actually start hiring private transport to get
their children to school ie the principal ldquoneedrdquo
identified by humanitarian actors will not necessary
translate into effective demand if the MEB is used as
a basis for transfer value calculations While an
important access problem has been identified other
complementary interventions will likely be needed
to address it
depending on the objective of a particular intervention and
the choices targeted households are likely to make regarding
food and nutrition once they receive a transfer Targeted
nutrition interventions may be needed such as providing
certain nutritious foods for specific groups (through in-kind
assistance or commodity vouchers) and social behavioural
change communication to nudge people towards making
better choices for health and nutrition47 Expenditure data can
be helpful to understand the consumption patterns of people
at different points of the wealth distribution Fill the Nutrient
Gap analysis also examines packages of blanket and targeted
household interventions to estimate the most cost-effective
way to address the nutrient requirements of different target
groups For further considerations including complementary
programming please consult the WFP interim guidance on
transfer values48
MEBs are often constructed in an interagency context such
as the Cash Working Group which helps facilitate dialogue
and validation from the beginning of the process However
sometimes not all clusters or key partners are engaged in such
forums which can limit the buy-in and understanding of the
MEB unless there is adequate consultation It is also essential
to consult government stakeholders and development
partners Endorsement by government counterparts could be
needed if there are existing government safety nets or policies
regarding minimum wages For example if the population of
interest for the MEB are refugees or IDPs and a transfer value
based on the MEB is higher than the social assistance provided
by the Government to the resident population this could be a
point of contention Development partners might also wonder
why a MEB is needed in addition to the national poverty line
Dialogue and validation of the final MEB with partners is
therefore vital49
47 The Fill the Nutrient Gap (FNG) analysis of which CotD is often part can help understand what programming might be needed and how interventions can be combined to improve dietary intake and reach food and nutrition objectives
48 WFP 2020c49 The Cash Learning Partnershiprsquos MEB Tip Sheet contains useful advice on the interagency processes around constructing a MEB Baizan and Klein 201950 Hobbs 2016 and WFP 2018
30
Minimum Expenditure Baskets Guidance Note | December 2020
Naturally the needs of a household increase with the size of
the household How can the different magnitude of needs
for households of different sizes be taken into account when
constructing the MEB
One simple approach is to calculate the per capita MEB
and simply scale it up for households of different sizes For
example if the MEB is constructed for a household of six and
equals USD 120 the per capita MEB would be USD 20 USD and
the MEB for a household of three people would be USD 60
However this proportional scaling ignores one important
factor while the needs of a household grow with each
additional member the increase may not be proportional
This is because some goods consumed within a household
such as food are ldquoprivateldquo in character ndash once a person has
consumed it no one else can consume the same ndash while other
goods such as housing are ldquocommonrdquo or ldquopublicrdquo meaning they
can be shared among household members Hence the needs
for housing space or electricity are not necessarily three times
higher for a household with three members than for a single-
person household This is called economies of scale Changes
in household composition can also influence how needs
grow with household size consider large households with
many children who do not have the same needs as adults
Economies of scale are particularly relevant in contexts where
shared goods constitute a major part of household essential
needs for example where rent payment is a large expense A
one-bedroom apartment may be necessary for a one-person
household but could also possibly house a family of three
who would then share the expenditure When in a context of
large economies of scale the MEB is adjusted to household
size by scaling up average per capita needs proportionally
to household size the resulting MEB will underestimate
the needs for small households and overestimate the
needs for large households by construction This is because
the per capita needs for small households are larger than
this simple scaling reflects This can have implications if the
per capita MEB is used to inform targeting or transfer value
calculations For instance if the needs of smaller households
are underestimated they are more likely to be miscategorized
as being able to meet their essential needs and might therefore
not receive the assistance they require
7 Accounting for household composition and economies of scale
Expenditures
Household sizeno economies of scale expenditures proportional to household sizeeconomies of scale expenditures non-proportional to household size
1 2 3 4 5 6 7 8 9 10
EXPENDITURES PER CAPITA
Figure 3 Economies of scale and expenditures per capita ndash illustration of the concept
31
Minimum Expenditure Baskets Guidance Note | December 2020
In other contexts economies of scale might be smaller
because of the higher relative importance of ldquoprivaterdquo goods
such as food and certain non-food items (for example soap)
or if shared costs such as shelter are not prominent How
household size is catered for in the MEB ultimately depends
on context and how needs are related to household size
Some suggested steps to account for economies of scale and
household composition are listed below
When examining how to account for different household
sizes in the MEB start by ascertaining whether economies
of scale exist and to which extent51 Figure 3 provides a
hypothetical illustration of two extreme cases no economies
of scale at all and strong economies of scale If there are no or
little economies of scale the per capita expenditures will be
very similar across household sizes while they will decrease
by household size if economies of scale are present52
Plotting per capita expenditures against household size
helps enable for this type of examinations It can be useful
to further disaggregate the analysis into different categories
(for instance food non-food or shelter expenditures per
capita) to understand which expenditures might be driving the
economies of scale if present
Box 19 illustrates two different country examples
expenditures by household size for Syrian refugees in
Lebanon and for vulnerable populations in Coxrsquos Bazar
Bangladesh In Lebanon where shelter plays an important
role household expenditures double only at a household size
of 5 and they triple at a household size of 11
COUNTRYEXAMPLE
ECONOMIES OF SCALE INLEBANON AND COXrsquoS BAZAR
Box 19
Figure a shows expenditures by household size compared to one-person households For Syrian refugees in Lebanon
average expenditure doubles only when the household size reaches five and it takes 11 members to triple the expenditures
of a one-person household The economies of scale are therefore large primarily due to the importance of shelter costs for
the refugees
In Coxrsquos Bazar in contrast total expenditures grow almost proportionally with household size (double at a two-person
household triple at a three-person household) Slight economies of scale can be seen for food For non-food expenditures
larger households even spent more per person From this data the economies of scale seem to be small
Figure a Increase in household expenditure by household size comparedto one-person households
Multiplicationfactor
Household sizeHousehold size
100
90
80
70
60
50
40
30
20
10
Coxrsquos Bazar (Bangladesh)Lebanon
1 2 3 4 5 6 7 8 9 10 11
Total Food Non-food
1 2 3 4 5 6 7 8 9 10 11
Note Figure based on authorsrsquo calculations Data from the Vulnerability Assessment of Syrian Refugees in Lebanon (VaSyr) 2017
and the Refugee influx Emergency Vulnerability Assessment (REVA II) 2019
51 Expenditure data is required to perform this analysis If no information on expenditure exists information on how needs change with household size can be collected through qualitative means such as focus group discussions or key informant interviews
52 Theoretically it is possible to also analyse expenditures by household composition but sample sizes rarely allow for such detailed disaggregation
32
Minimum Expenditure Baskets Guidance Note | December 2020
If the analysis reveals small economies of scale or none at all it is reasonable to use a per capita approach to scale up the MEB proportional to household size
Even for food strong economies of scale can be detected
which could be a result of large households being able to
buy food in bulk at a lower price However in Coxrsquos Bazar
where shelter and other shareable non-food goods are of less
importance household expenditures are close to proportional
to household size
If the analysis reveals small economies of scale or none at all
it is reasonable to use a per capita approach to scale up the
MEB proportional to household size If significant economies
of scale are present it is important to think about how to
take this into account when constructing the MEB Here are
some suggestions
One possible solution (in the expenditure-based
approach) is to disaggregate (or re-select see below)
the reference cohort for each household size sub-
sample and using the expenditures for each of these
cohorts construct specific MEBs for each household
size53 This approach takes into account economies of
scale by looking directly at the specific needs of different
size households but only reflects average differences
in household composition within each household size
The approach will most likely suffer from very small
sample sizes once analysis needs to be performed by
household size If this is the case household sizes could
be grouped into categories so that the analysis uses sub-
samples eg for household sizes 1ndash2 3ndash5 and 6ndash8 etc
or other groupings meaningful for the context When
following this approach bear in mind that if the reference
cohort is selected based on expenditure distribution
characteristics such as the removal of extreme deciles or
quintiles this procedure of removal of quintiles or deciles
needs to be repeated within each household size (or
household size group) Otherwise if there are economies
of scale for consumption there is a risk of skewing the
sample against the smallest and largest households
because their per-capita expenditures will be at the
extreme ends of the expenditure distribution
Another solution is to divide the MEB content into
ldquoprivaterdquo (non-shared) and ldquopublicrdquo (shared) consumption
For example food could be non-shared and rent and
fuel shared Examine the MEB expenditures for the
non-shared and shared goods for an average sized
household (or for household sizes around the average
for instance 4ndash6 members in order to leverage a larger
share of the sample) The non-shared value can then be
scaled proportionally to household size while the shared
value is held constant across household sizes This way
the resulting MEB consists of a lsquoflatrsquo and a proportional
element54 This is a relatively crude but intuitive way to
approximate economies of scale Figure 4 provides a
simple illustration of this approach
In the literature on poverty the most common solution
used to adjust for economies of scale and difference
in household composition is to use adult equivalents
instead of per capita numbers These equivalence scales
assign an ldquoadult equivalent numberrdquo to each household
depending on its size and composition taking into
account economies of scale as well as the different needs
of children and adults ie household composition For
example the first adult in the household is counted
as 1 and each additional adult as for example 07 A
child under 15 is counted as a fraction of an adult (eg
05) The effective adult equivalent household size is
then the sum of these adult-equivalent fractions55 Next
total household expenditures are divided by the adult
equivalent household size The MEB is then calculated
using these adjusted per-adult-equivalent expenditures
While this is not necessarily a complicated approach
from an analytical point of view equivalence scales can
53 See Lanjouw (1998) on the construction of poverty lines specific to household size (and composition)53 Alternatively the flat element can also be lsquosemi-flatrsquo and set according to household size groups ndashby examining shared costs and applying the same flat value within eg household size groups 1-2 3-5 6-8 or other
groupings as dictated by the context 53 One common equivalence scale is the OECD scale it assigns the weight 1 to the household head 07 to all additional adults and 05 to all children A household with five people say two adults and three children
consists of 32 adult equivalents (1+07+05+05+05) This is a common scale used in many developing and developed countries Another common scale is to give weight 1 to each adult and different weights to children depending on their age For the official poverty line in Zambia the following weights are given to children 0ndash3 years 036 4ndash6 years 062 7ndash9 years 076 and 10ndash12 years 078
33
Minimum Expenditure Baskets Guidance Note | December 2020
MEB - COMBINING FLAT ANDPROPORTIONAL ELEMENTS -ILLUSTRATION
MEB value
Household size
1 2 3 4 5 6 7 8 9
140
120
100
80
60
40
20
0
Proportional element - non-shared part of MEB
Flat element - shared part of MEB
MEB value per capita
Figure 4 Combining flat and proportional elements in the MEB
prove challenging when operationalising the MEB If
equivalence scales are used in constructing the MEB they
will also need to be applied when measuring household
expenditures compared with the MEB for gap analysis
against the MEB and in monitoring Translating the
concept of equivalence scaling into operational decision
making may therefore prove tricky Additionally results
can be quite sensitive to the choice of equivalence scales
so selecting appropriate scales is important yet often not
straightforward and a range of different scales exist56 In
some countries country-specific equivalence scales may
have been devised for the purpose of the calculation of
the national poverty line
No matter the approach the recommendation is always
to leverage data analysis as much as possible in order
to understand how needs evolve with household size
(and possibly composition) while keeping in mind that
the final MEB needs to be operationally relevant
Particularly in the (common) cases where MEBs are
used to calculate household transfer values it is worth
considering what level of analytical granularity can
feasibly be turned into programmatic action In some
cases it may not be operationally possible to handle
different per-capita size transfers for differently sized
households and the extra effort of achieving accurate
MEB figures by household size may not be worth it
The same general recommendation as for all aspects
of MEB construction also applies here the final result
should be realistic a fair depiction of needs and an
operationally relevant product
56 See for instance httpwwwoecdorgeconomygrowthOECD-Note-EquivalenceScalespdf
34
Minimum Expenditure Baskets Guidance Note | December 2020
A SMEB can be expenditure-based or rights-based or a hybrid of the two approaches depending on data availability and programmatic requirements
The SMEB is the absolute minimum amount required to maintain existence and cover lifesaving needs which could involve the deprivation of certain human rights
A survival minimum expenditure basket (SMEB) is often
constructed alongside a MEB While the MEB is defined as
what a household requires in order to meet their essential
needs on a regular or seasonal basis and its average cost the
SMEB is the absolute minimum amount required to maintain
existence and cover lifesaving needs which could involve the
deprivation of certain human rights However the concepts
of SMEB and MEB have not always been used consistently
by the humanitarian community and are sometimes used
interchangeably It is therefore important to be clear from the
outset of the analysis whether a MEB or a SMEB is the goal
A SMEB can serve at least two purposes First together with
the MEB it can be used to classify households into different
categories of economic capacity to meet their needs whereby
households whose expenditures fall below the SMEB have
highly insufficient economic capacity households between the
SMEB and the MEB have insufficient economic capacity and
households above the MEB have sufficient economic capacity
This information can then be used for profiling people in need
prioritizing beneficiaries or monitoring Second the SMEB
can inform programmatic decisions such as transfer values in
situations where immediate lifesaving assistance is required
The approaches presented here follow the MEB methods
adjusted to suit the different purpose of the SMEB
Accordingly a SMEB can be expenditure-based or rights-
based or a hybrid of the two approaches depending on data
availability and programmatic requirements
8 How to construct a SMEBExpenditure-based approach toconstructing a SMEBThe calculation of an expenditure-based SMEB is closely aligned
with the literature on how to estimate national poverty lines
While the MEB corresponds to an ldquoupperrdquo poverty line a ldquolowerrdquo
extreme or austere poverty line is often defined by taking the
food part of a MEB and adding this to the non-food needs
regarded as the essential minimum for household survival57
But how are survival non-food needs defined based on
expenditure data When people receive assistance it is
sometimes observed that households sell part of their food
rations to cover some non-food items These households forgo
some of the required food intake in order to cover what they
regard as survival non-food needs Using expenditure data to
construct a SMEB a similar idea is explored to calculate the
SMEB analysts identify those households whose total food AND
non-food expenditures are approximately equal to the MEB food
basket amount only In order to access non-food items these
households will compromise their food intake to some extent
because their total expenditures would only be enough to cover
their essential food requirements ie the food MEB anything
spent on non-food items means that they are not meeting their
essential food requirements It is therefore fair to assume that
the amount they choose to spend on non-food items must
be regarded by the households as absolutely necessary The
non-food expenditures of these households can therefore be
considered as the survival non-food needs The SMEB is then
calculated by adding these survival non-food expenditures
to the food MEB This SMEB allows households to meet their
essential food needs and their survival non-food consumption
Note that this approach requires a food MEB figure (either
already available or calculated as part of the SMEB analysis)
57 See Lanjouw 1998 and Haughton and Khandker 2009
35
Minimum Expenditure Baskets Guidance Note | December 2020
The steps for constructing an expenditure-based SMEB are
similar to those taken to construct a MEB with the following
additional considerations
1 Prepare expenditure data the expenditure data source can
be the same as that used for the MEB
2 Select the reference cohort this step is different The cohort
is selected by computing total household expenditures
and comparing them to the food MEB Households with
total expenditures equal to (or in an interval around) the
food MEB are selected as the SMEB reference cohort
3 Establish food basket and 4) Establish non-food basket
Using the SMEB reference cohort start by examining
how much these households spend on non-food items
Add this value to the MEB food value to arrive at the total
value of the SMEB To establish a food and non-food
basket there are two options i) use the MEB food basket
as the SMEB food basket and the non-food expenditures
of the SMEB reference cohort as the non-food basket
or ii) look at a third cohort of households namely those
whose total expenditures are around the just established
total SMEB level examine their food and non-food
expenditures and unpack those into food and non-food
baskets While both options will provide the same overall
value of the SMEB they will differ in composition and the
share of foodnon-food expenditures
Annex 2 provides an illustration of this method of constructing
a SMEB
Rights-based approach to constructing a SMEBThe rights-based approach to constructing a SMEB closely
follows the rights-based approach to constructing a MEB The
main difference is that needs and the items and quantities
included should be restricted to what is regarded as absolutely
necessary for survival ndash which can be challenging to define
This applies to both the food basket and the non-food
basket The MEB can be a starting point if there is one or
the Sphere Standards Sometimes rights-based SMEBs have
been constructed based on a MEB but with lower quantities
for certain items or by keeping some needs while removing
others
Hybrid SMEBs and reality checking resultsAs with MEBs it can be advantageous to combine the
expenditure-based and rights-based approaches to create
a hybrid SMEB The guiding principles are the same as for
the MEB with the difference that the resulting SMEB should
continue to contain nothing but the minimum required for
survival
The same logic applies to the ldquoreality checkrdquo of the SMEB
results as for the MEB it is crucial to ensure that the end
result is realistic and operationally relevant bearing in mind
the conceptual difference between the MEB and the SMEB It
is important to consult the population of interest as much as
possible to understand their views on what constitutes the
bare minimum needed by households to maintain existence
and cover lifesaving needs
COUNTRYEXAMPLE
RIGHTS-BASED SMEBS Box 20
In Lebanon health and education are excluded
from the rights-based SMEB while other needs are
covered with smaller amounts than in the MEB For
example the SMEB has a less diverse food basket
than the MEB58
In Syria the SMEB developed for the northern part
of the country includes food kerosene hygiene
products water and a small amount to cover other
survival goods Rent and utilities are not covered59
58 El Koury and Hajal 201659 Cash Based Responses Technical Working Group Syria 2014
36
Minimum Expenditure Baskets Guidance Note | December 2020
COUNTRYEXAMPLE
HYBRID SMEBs Box 21
For the MEB review in Lebanon for Syrian refugees60 a hybrid SMEB approach was chosen First an expenditure-based
SMEB was used calculating the non-food expenditures of households whose total expenditures equalled the food MEB
and adding this to the food MEB This resulted in very low expenditures on shelter (SMEB A) Due to the importance of
shelter in urban settings a second hybrid version was established calculating the non-food expenditures of households
whose total expenditures equalled the sum of the food MEB plus a rights-based value of a tent as survival shelter the cost
of which came from a rights-based SMEB (SMEB B)
Cohort HH size 4ndash6quint 2ndash4 acceptable FCS
n=923
Cohort total expenditure= food MEB
n=923210
Cohort total expenditure= food MEB + tent value
n=923210
SMEB Afood + survivalnon-food
Hybrid SMEB
437
83
40
93
20
16
29
19
314
1033
437
43
18
37
06
04
17
60
621
437
47
24
42
11
06
20
162
750
Food
Utilities (water gas fuel electricity)
Non-food items (hygiene clothing)
Health
Education
Transport
Communication
Other expenditures
Shelter
Total (USD)
Table a Hybrid SMEB for Syrian refugees
SMEB Bfood + survivalnon-food amp tent
In the Kinshasa urban assessment61 a SMEB was established in addition to the MEB comprising a basket of the most
essential items based on expenditure data used for the MEB For the food SMEB a less diverse diet was established by
excluding certain food items from the food MEB and rescaling the resulting basket to 2100 kcal For the non-food
component the only items included were those that were seen as critical to attaining the most basic standards for safety
food preparation water sanitation and hygiene These consisted of water cooking fuel hygiene products and lighting The
value for these items in the SMEB was derived from the median expenditures of the non-poor cohort
Expenditure-basedMEB
Expenditure-basedSMEB
60 Hohfeld et al 2020 61 WFP et al 2018
37
Minimum Expenditure Baskets Guidance Note | December 2020
91 Adjustment for seasonal or regional price differencesIf the MEB will only be used in one area where prices are
relatively homogenous it is often not necessary to adjust for
regional price differences However if the MEB is intended
for use across different urbanperi-urban andor rural
areas throughout the country it could be vital to adjust for
differences This means that the MEB can be priced differently
for different regions or rural or urbanperi-urban areas (or any
other division of areas that makes sense in relation to price
behaviour) There are a few approaches for this
Price the MEB based on available price data for different
regions or urbanrural areas For the food reference
basket this is most often possible using WFP food prices
or other similar price time series For non-food items
including housing utilities and services this can be more
challenging and may rely on price data collection by
different partners or require new data collection
For some countries price data provided by the national
statistical office is useful In the case of Turkey regional
purchasing power parity indices were used to provide
price estimates for components of the MEB for which
direct price information was not available
Use approximations from expenditure data If the
household survey has sufficient regional coverage the
expenditure levels in different regions can be explored
using the cohort of households just above the poverty
line Care should be taken in using this method
particularly if the sample size by region is very small
9 Additional considerations when constructing MEBs
92 Needs that vary by season or areaIn many countries where WFP works household needs change
with the seasons For instance in Turkey where winters are
cold households have additional needs for heating and warm
clothes to survive In other contexts there are significant
differences in needs between lean and rainy seasons These
changing needs could be a reason to construct different MEB
reference baskets to use at different times during the year or
to design seasonal top-ups In the case of items needed for cold
winters this is often referred to as ldquowinterizationrdquo
While this does not influence the approach used to construct
the MEB it does mean that analysts need to consider when
the data used in its construction was collected and whether
this influences the resulting MEB These considerations also
matter when using the MEB for monitoring if a monitoring
expenditure survey is used to analyse whether peoplersquos
expenditures are above or below the MEB threshold but
the survey is undertaken when prices are high or when
winters are cold if the MEB is not adjusted the results will
probably show a decrease in the percentage of people whose
expenditures are below the MEB as households have higher
needs andor are confronted with higher prices and thus
have higher expenditures without in reality being better off
In Turkey it was estimated that household needs during the
winter would result in a 48 percent increase in minimum
expenditures
In other cases different baskets might be necessary
for different areas of the country eg rural and urban
areas While the MEB should be constructed for a relatively
homogenous population it may sometimes be desirable to
construct a MEB covering all or most of a country where
consumption patterns vary substantially In this case it is
worth considering whether (some elements of) the MEB should
be different between areas Again the selected approach to
construct the MEB should not change but analysts need to
check where the data used in its construction was collected
and whether consumption patterns are very different between
different regionsareas For example in the case of Somalia
the main cereal consumed varies significantly between the
north and the south of the country so the MEB uses different
main cereals in the food reference basket according to region
While the MEB should be constructed for a relatively homogenous population it may sometimes be desirable to construct a MEB covering all or most of a country where consumption patterns vary substantially
38
Minimum Expenditure Baskets Guidance Note | December 2020
Constructing a MEB can be challenging in a sudden onset
emergency or if data is scarce or unavailable Below are some
ideas on how this can be resolved However from a ldquodo no
harmrdquo perspective it is important to emphasize that proxies
should only be used in the interim when no other solutions are
available
Use the national MEB or MEB reference basket If survey
data is not directly available and if the population of
interest is part of and similar to the overall population of
the country the national MEB or MEB reference basket
used for the national poverty line can be used if available
Bear in mind however that this basket should be used on
the condition that it corresponds to data that WFP collects
or has access to through partners or the Government to
ensure that monitoring can be conducted against the MEB
In its most basic form a MEB essentially only requires an
approximate value for the food basket and an estimate
of the average expenditure share that households use
on food Even if no relevant survey data is available this
information should be available to a country office or can
rapidly be collected or approximated
Consider using the minimum wage as a proxy Bear in
mind that while the MEB captures household-level needs
the minimum wage is individual-level income so an
assessment of how many minimum wages are needed per
household depending on the household size is required
It is also advisable to find out how the minimum wage has
been constructed
Ultimately a MEB is a good preparedness measure and should
be constructed before an emergency While both prices and
availability will be affected by an emergency it is still likely to
provide a useful starting point
11 Monitoring and updating the MEB111 Monitoring the cost of the MEBTo be operationally useful the MEB must be tracked and
updated over time to account for price changes If inflation is
high this might have to be done every month if it is low as
little as once a year could be sufficient This should be planned
for when the MEB is constructed to ensure that the costs of the
MEB components can be updated
There are different ways to update the MEB with price changes
If a reference basket is adequately defined (for food
and for non-food items) and prices are collected for the
individual items in the basket by WFP or its partners the
MEB can be priced anew using the updated prices for
each item and multiplying them by the quantities in the
reference basket
A simple solution is to adjust the MEB using the
nationalsub-national CPI or its components This
simply involves updating the cost of the MEB with
the increase (or decrease) in the CPI for the period
in question However in some contexts CPIs are not
updated or relevant for the target population Urban
areas are often over-represented in the national CPI on
the other hand prices and costs faced by for example
displaced populations can be very different from national
price levels In contexts of poverty where food constitutes
a large part of household expenditures the evolution of
food and fuel prices is central when it comes to capturing
price changes
If a CPI does not exist or is not considered applicable
a price index for key consumption items can be
constructed using price data collection for food items
and basic non-food items conducted by WFP andor
other agencies this can then be used to update the cost
of the MEB In contexts where shelter is a major part of
household expenditures changes in shelter costs should
also be captured
10 How to find a proxy for a MEB when data or time is insufficient
39
Minimum Expenditure Baskets Guidance Note | December 2020
112 When to construct a new MEBThe composition of MEB reflects consumption patterns
It is recommended as much as possible keeping the MEB
composition constant and only monitor how cost changes
over time However when there is reason to believe that
consumption patterns of the population for whom the MEB
is constructed has significantly changed it is time to review
its composition and possibly reconstruct the MEB to reflect
these changes
What could suggest such consumption changes have
occurred The figure to the right summarises some typical
events that could result in a significant change in household
consumption Shocks eg a natural disaster might create
additional needs if livelihoods are disrupted or living
conditions are altered Significant changes to the prices of
key consumption items can also alter consumption pattens
insofar it pushes households to substitute certain items
for other items (be aware however that reconstructing
the MEB would only be advisable if the substitution is not
just temporary) Population changes such as an influx of
displaced people or other events that changes the population Figure 5 Possible triggers for MEB composition review
Has a shock occured creating
different or additional needs
Have costs changed significantly
between key consumption items so
that households have substituted
consumption patterns
Has there been a change in
population - eg a displacement
Has the supply side or service
provision changed leading to a
change in household consumption
Shock
Substitution
Population
Supply
composition in the area that the MEB is constructed for
could also lead to a review Finally if supply of essential
goods and services changes this may also shift household
consumption eg if health services are made free of charge
and no longer require households to pay for them
40
Minimum Expenditure Baskets Guidance Note | December 2020
CaLP The Cash Learning Partnership
CBT cash-based transfers
CotD Cost of the Diet [approach]
CPI consumer price index
FCN-N food consumption score ndash nutrition
FCS food consumption score
FNG Fill the Nutrient Gap
HEA household economy approach
LSMS Living standard measurement survey
MEB minimum expenditure basket
OCHA United Nations Office for the Coordination of Humanitarian Affairs
REVA II 2019 Refugee Influx Emergency Vulnerability Analysis
SDG Sustainable Development Goal
SMEB survival minimum expenditure basket
UNHCR Office of the United Nations High Commissioner for Refugees
VAM Vulnerability Analysis and Mapping
WFP World Food Programme
WHO World Health Organization
Abbreviations
41
Minimum Expenditure Baskets Guidance Note | December 2020
Deaton and Grosh 2000 ldquoConsumptionrdquo in Designing Household Survey Questionnaires for Developing Countries Lessons from Ten
Year of LSMS Experience httpsscholarprincetonedudeatonpublicationsconsumption
Deaton and Zaidi 2002 Guidelines for Constructing Consumption Aggregates for Welfare Analysis LSMS Working Paper no 135
httpsopenknowledgeworldbankorghandle1098614101
The Cash Learning Partnership (CaLP) Glossary of terminology for cash and voucher assistance
httpswwwcalpnetworkorglearning-toolsglossary-of-terms
Cash Based Responses Technical Working Group Syria 2014 Northern Syria Survival Minimum Expenditure Basket Guidance
Document httpswwwhumanitarianresponseinfositeswwwhumanitarianresponseinfofilesdocumentsfilesnorthern_
syria_smeb_guidance_document_dec_2014pdf
Cash Working Group Nigeria 2018 Minimum Expenditure Basket for North East Nigeria ndash Justification and recommendations Draft
report httpswwwhumanitarianresponseinfositeswwwhumanitarianresponseinfofilesdocumentsfilesmeb_justification_
guidelinespdf
Baizan and Klein 2019 Minimum Expenditure Basket (MEB) Decision Making Tools The Cash Learning Partnership httpswww
calpnetworkorgpublicationminimum-expenditure-basket-meb-decision-making-tools-2
El Koury and Hajal 2016 MEB and SMEB revision Community Consultation Lebanon Cash Consortium httpsreliefwebintsites
reliefwebintfilesresourcessmeb-fgd-report-final-1pdf
Geniez Mathiassen de Pee Grede and Rose 2014 ldquoIntegrating food poverty and minimum cost diet methods into a single
framework A case study using a Nepalese household expenditure surveyrdquo in Food and Nutrition Bulletin vol 35 no 2 https
journalssagepubcomdoi101177156482651403500201
Haughton and Khandker 2009 Handbook on Inequality and Poverty The World Bank httpsopenknowledgeworldbankorg
handle1098611985
Hobbs 2016 MEBSMEB calculation for Syrians living in Turkey Report commissioned by the Cash-Based Interventions Technical
Working Group in Turkey httpsdata2unhcrorgendocumentsdownload57031
Hohfeld Papavero Sandstrom Dalbai and Renk 2020 Minimum Expenditure Basket for Syrian Refugees in Lebanon ndash Rights-based
versus Expenditure Based Approaches WFP httpsreliefwebintsitesreliefwebintfilesresources76229pdf
Inter-Agency Network for Education in Emergencies (INEE) Minimum Standards for Education Handbook Preparedness Response
Recovery httpsineeorgstandards
Jolliff and Prydz 2016 Estimating International Poverty Lines from Comparable National Thresholds World Bank Policy Research
Paper 7606 httpsopenknowledgeworldbankorgbitstreamhandle1098624148Estimating0int00national0thresholdspdf
Lanjouw 1998 Demystifying Poverty Lines World Bank
Ravallion 1994 ldquoPoverty Comparisonsrdquo in Fundamentals of Pure and Applied Economics 56
Republic of Zambia Central Statistical Office 2016 2015 Living Conditions Monitoring Survey (LCMS) Report httpswwwzamstats
govzmphocadownloadLiving_Conditions201520Living20Conditions20Monitoring20Survey20Reportpdf
Save the Children UK 2018 Basic Needs Assessment Guidance and Toolbox Part I Background and Concepts httpsreliefwebint
reportworldbasic-needs-assessment-guidance-and-toolbox
Sphere Standards Handbook Humanitarian Charter and Minimum Standards in Humanitarian Response 2018 edition httpswww
spherestandardsorghandbook
UNHCR CaLP Danish Refugee Council OCHA Oxfam Save the Children and WFP 2015 Operational Guidance and Toolkit for
Multipurpose Cash Grants httpswwwcalpnetworkorgwp-contentuploads202001operational-guidance-and-toolkit-for-
multipurpose-cash-grants-webpdf
References
42
Minimum Expenditure Baskets Guidance Note | December 2020
WFP 2004 Sampling Guidelines for Vulnerability Analysis Thematic guidance httpsdocumentswfporgstellentgroupspublic
documentsmanual_guide_procedwfp197270pdf
WFP 2008 Food Consumption Analysis Calculation and use of the Food Consumption Score in food security analysis https
documentswfporgstellentgroupspublicdocumentsmanual_guide_procedwfp197216pdf
WFP 2015 Food Consumption Score Nutritional Analysis (FCS-N) Guidelines httpswwwwfporgpublicationsfood-consumption-
score-nutritional-quality-analysis-fcs-n-technical-guidance-note
WFP 2018 Revising the Food Basket and Minimum Expenditure Basket Analysis to calculate a realistic cost of living for refugees in
Turkey httpsreliefwebintreportturkeyrevising-food-basket-minimum-expenditure-basket-analysis-calculate-realistic-cost
WFP 2019 Refugee influx Emergency Vulnerability Assessment ndash Coxrsquos Bazar Bangladesh httpsreliefwebintsitesreliefwebintfiles
resourcesWFP-0000106095pdf
WFP 2020a Essential Needs Assessment Guidance note httpswwwwfporgpublicationsessential-needs-guidelines-july-2018
WFP 2020b Technical Note Fill the Nutrient Gap and Minimum Expenditure Basket An explanation of approaches and identification of
synergies httpsdocswfporgapidocumentsWFP-0000116644download
WFP 2020c Setting the transfer value for CBT interventions Transfer Value Interim Guidance httpsdocswfporgapi
documentsWFP-0000117963download
WFP global Food Security Cluster and Food Security Cluster for the Democratic Republic of the Congo 2018 Adapting to an Urban
World Urban Essential Needs Assessment in the five communes of Kimbanseke Kinsenso Makala Nrsquosele and Selambao (Kinshasa)
httpswwwwfporgpublicationsdemocratic-republic-congo-urban-essential-needs-assessment-five-communes-kimbanseke-
kinsenso
World Health Organisation and Global Health Cluster ndash Cash Task Team 2020 Technical Note on the Inclusion of Health
Expenditures in the Minimum Expenditure Basket and Subsequent Multi-purpose Cash Transfer httpswwwcalpnetworkorg
publicationinclusion-of-health-expenditures-in-the-meb
43
Minimum Expenditure Baskets Guidance Note | December 2020
Survivalnon-foodexpenditure
TOTALEXPENDITURE
FOODEXPENDITURE
MEBnon-foodexpenditure
EXPE
ND
ITU
RE
CONSUMPTION
SMEBAusterepoverty line
Essential foodneeds (MEB)
Acceptable food consumption(based on FCS)
Food expenditure for HHwith tot exp at essential
food needs (MEB)
Analysts should always ensure that the expenditure data is properly cleaned and outliers removed and that it is converted into
the same recall period (food and non-food items usually have different recall periods)
Expenditures should be calculated into per capita figures (eg by dividing total household expenditures by household size) in
order to make them immediately comparable across households (or per adult equivalent see section 7 on how to account for
economies of scale and household composition)
Before starting the MEB analysis it is highly recommended to carry out some simple descriptive analysis of the expenditure
data in order to understand it Analyse the mean and median expenditures for the sample This will help understand the
distribution of the expenditures and detect possible issues While the median is more robust to outliers if a large part of the
sample has 0 expenditures on a particular item the median could be 0 and may therefore not be the best estimate of the need
In this case the mean may be preferable A frequency analysis of non-zero expenditures by groupitem can also be helpful in
understanding whether certain expenditures are infrequent or lumpy
Annex 1 - Good practice when analysing expenditure data
Figure based on Lanjouw 1998 Demystifying poverty lines and World Bank and Ravallion 1994 ldquoPoverty comparisonsrdquo in
Fundamentals of Pure and Applied Economics 56
Annex 2 - The expenditure-based SMEB ndash an illustration

5
Minimum Expenditure Baskets Guidance Note | December 2020
This guidance note sets out the basic steps for constructing a
minimum expenditure basket (MEB) It is designed to provide
conceptual clarity and best practices built on experience from
the humanitarian and development fields The guidance is
designed to provide a series of options in order to facilitate
a context-specific application of the recommendations it
presents
The guidance note begins by introducing the concept of the
MEB and its different usages (sections 1 and 2) Sections 3 to
6 cover how to construct a MEB including important aspects
to consider before starting the analysis and the different MEB
approaches Section 7 examines how to deal with household
size and composition in MEB analysis while the concept of the
survival minimum expenditure basket (SMEB) is introduced
in section 8 Section 9 sets out additional considerations
such as regional or seasonal price adjustments and section
10 explains how to find MEB proxies when time or data is
insufficient In closing section 11 offers guidance on how to
update and monitor the MEB
A MEB is defined as what a household requires in order to
meet their essential needs on a regular or seasonal basis
and its cost3 Essential (or basic) needs are defined as ldquothe
essential goods and services required on a regular or seasonal
basis by households to ensure survival and minimum living
standards without resorting to negative coping mechanisms
or compromising their health dignity and essential livelihoods
assetsrdquo4 The MEB is a monetary threshold ndash the cost of these
goods utilities services and resources ndash and is conceptually
equivalent to a poverty line5 It typically describes the cost
of meeting one monthrsquos worth of essential needs Since the
MEB sets a monetary threshold for what is needed to cover
essential needs the households whose expenditures fall
below the MEB are defined as being unable to meet their
essential needs
i About this guidance note
3 This builds on the definition in UNHCR et al 2015 4 Definition of basic needs See CaLP glossary 5 Note that conceptually a MEB is equivalent to a poverty line in that it describes a monetary threshold for being able to cover essential needs This does not mean that the MEB is equivalent to the national poverty line6 Haughton and Khandker 2009
In poverty literature and research MEBs have long been
constructed primarily to set national poverty lines and
determine the percentage of households in the population
who are poor ie who cannot meet their essential needs
The ldquocost of basic needsrdquo approach which entails establishing
a MEB is fairly new in humanitarian contexts however it
has long been the most common way to construct national
poverty lines6 As a result there is often national experience to
draw on when setting out to construct a MEB
A MEB does not necessarily contain all the essential needs
of a household It only captures needs that the households
cover entirely or partly through the market It should not
be an attempt to monetize all the needs of a population
For example in contexts where electricity is considered an
essential need but not available for the population of interest
it should not be included in the MEB If shelter is provided free
of charge in a refugee camp or education is publicly provided for
free these needs and their costs are not captured in the MEB
Hence a need can be essential but not included in the MEB
A MEB does not necessarily contain all the essential needs
of a household It only captures needs that the households
cover entirely or partly through the market It should not
be an attempt to monetize all the needs of a population
For example in contexts where electricity is considered
an essential need but is not available for the population of
interest it should not be included in the MEB If shelter is
provided free of charge in a refugee camp or public education
is provided for free these needs and their costs are not
captured in the MEB A need can therefore be essential but
not included in the MEB
A MEB captures the cost of essential needs for average
households It does not typically capture ad-hoc or one-
off costs This can be challenging particularly in emergency
situations when needs are dynamic While this guidance
suggests keeping the MEB composition fixed as far as
possible in such situations it might be justified to create
an interim MEB (see section How to find a proxy for a MEB
when data or time is insufficient) and when the situation has
stabilized a final one A similar challenge is presented with
1 What is a minimum expenditure basket
6
Minimum Expenditure Baskets Guidance Note | December 2020
needs that are inherently irregular large and unpredictable
such as health needs This is also examined in the sections on
MEB construction
There are different approaches to establishing a MEB
As the World Bankrsquos Handbook for Poverty and Inequality
explains7 the typical starting point for establishing a MEB is
to estimate the cost of acquiring enough food to meet energy
requirements usually 2100 calories per person per day as
per the Sphere Standard Yet the cost of 2100 calories varies
with the diet of households which typically depends on their
economic status The cost of other essential non-food needs
is then added There are two approaches to establishing
which food and non-food items should be in the MEB an
expenditure-based approach that focuses on effective
demand and a rights-based approach based on assessed
needs While the expenditure-based approach is usually used
to construct national poverty lines the rights-based approach
is the principal method followed in the operational guidance
for multipurpose cash grants developed for humanitarian
purposes8 A combination of these approaches a hybrid
approach can also be used and is often recommended This
guidance describes each approach
The construction of a MEB is always somewhat arbitrary
However a MEB is constructed choices need to be made along
the way The objective of the MEB can influence how best to
approach its construction The choice of the group of people
whose effective demand will be examined ndash the ldquoaveragerdquo
households ndash is another important influencing factor This
guidance provides direction on how to make these choices but
analysts will always be required to exercise judgement
A MEB is not equivalent to a transfer value A transfer
value is understood as the monetary value transferred from
governments or organizations such as WFP to households
in order to support the latter in meeting their needs The
value of the MEB is not the same as the value that should
be transferred to households but the MEB can be a critical
component when determining transfer values Most
households can rely on their own resources to meet at least
some of their needs so the transfer value will usually be
less than the value of the MEB covering the gap between
householdsrsquo own resources other assistance received and
the MEB The distinction between the MEB and the transfer
value is also important because the MEB remains the same
regardless of assistance and funding constraints while the
transfer value could be impacted by these factors9
When using the MEB to monitor impacts of an
intervention or programme the MEB should not be
changed over time The threshold should only be adjusted
for price changes or when any major changes in context and
households needs occur that would require the construction
of a new MEB
2 Why have a MEBThe MEB has a range of applications In humanitarian
and development programming the MEB can support
household profiling by identifying characteristics of those
who cannot meet their essential needs10 and support
decisions on transfer value amounts for food and non-
food needs For partnerships the MEB can support multi-
sector coordination and programming with government
partner organisations and donors In market and supply
analysis the MEB can help inform which goods and services
to include in a Supply Analysis by showing which essential
needs households cover through the market Finally in
monitoring the MEB can assist monitoring of immediate
and longer-term outcomes through analysis of expenditure
trends against the MEB and help establish a basket against
which to monitor market prices and the cost of living
7 Ibid8 UNHCR et al 20159 For further discussion on considerations when setting a transfer value see WFP 2020c 10 For one possible application see WFP 2020a
A hybrid approach to constructing the MEB combines the expenditure-based approach and the rights-based approach and is often recommended
7
Minimum Expenditure Baskets Guidance Note | December 2020
THE MEB TO-DO LIST DEPENDING ON CONTEXTALSO CONSIDER
Identify key partners and stakeholders and decide on objectives and process
Construct the food basket
Construct the non-food basket
Reality check results and validate with stakeholders
Determine the analytical starting point (eg examine national poverty lines set the population of interest check what data is available) and decide on approach
Accounting for household size and composition
Adapting the MEB to different needs across regions or seasons
Adjusting the MEB for regional or urbanrural price differences if significant
HOW TO
Box 1MEB
3 How to construct a MEB generic steps
11 This is in line with the cost of basic needs approach widely used for poverty lines as described in previous sections
A MEB is constructed by estimating the cost of acquiring
adequate food and adding the cost of other essential non-
food expenditures11 The box below shows the steps that are
always part of constructing a MEB
The two principal methods for constructing MEBs are
the expenditure-based approach and the rights-based
approach Sections 5 and 6 describe these approaches
and how to combine elements of both to apply a hybrid
approach
Regardless of approach it is crucial to arrive at a realistic
relevant and operational MEB that is rooted in
consumption behaviour ndash section 6 also looks at how to
ensure this Before going into the details of construction the
next section outlines the key questions to ask before starting
the MEB analysis
8
Minimum Expenditure Baskets Guidance Note | December 2020
Before embarking on the construction of the MEB
components consider the following questions to decide how
best to approach the analysis
What is the objective and whowill be the partnersStart by setting the objective and consider what the MEB will
be used for once the analysis is finished If the MEB analysis
is a joint exercise identify potential partners possibly in
interagency working groups such as a cash working group find
out what kind of information various organizations can share
and decide on the division of labour In some cases it can be
helpful to write terms of reference for the MEB analysis in
order to clarify the envisioned process and methodology Even
if the MEB analysis will be conducted by just one agency it is
always a good idea to identify partners who will be interested in
the results and who can be consulted along the way12
Who is the MEB being constructed forIt is important to define the population of interest for the
MEB Is it intended to be valid for the entire country Or will it
only be used in a refugee camp for example or a particular
region where needs might differ from those in the rest of
the country It is vital to decide from the start where and for
whom the MEB should apply Since the MEB describes the
cost of essential needs the population for whom the MEB
is constructed should ideally have relatively homogenous
consumption patterns and needs If consumption patterns are
very different consider constructing different MEBs or varying
certain components of the MEB for sections of the population
Have any MEBs already been created for the population of interest If there are one or more MEBs already in use the analytical
exercise might be aimed at updating or even ldquoreality
checkingrdquo the existing baskets to see whether they still match
consumption behaviour and price levels If existing baskets
are found to be valid and relevant it might not be necessary
to start a new MEB analysis
4 Before starting the analysis What information and data is already available and is new data neededConsider what data or analysis is already available from
essential needs assessments or other household surveys
(undertaken by WFP or others) Does the data cover the area
and population of interest Also consider what qualitative
information might be available to shed light on certain
expenditure patterns and whether there is access to market
and price information If the data available is insufficient or
outdated plan to collect fresh data A MEB analysis is greatly
strengthened by being conducted as part of a comprehensive
essential needs assessment The assessment describes the
essential needs of the population of interest which is a
useful starting point for a MEB analysis and complements the
monetary perspective provided by a MEB
Can the national poverty line be usedBefore beginning the construction of a MEB it is useful to find
out if a national poverty line exists and how and when it was
constructed Many countries have their own national poverty
lines so why not use this poverty line (and the corresponding
basket) as the MEB Whenever possible the first choice
should be to align with government practices However this is
often not feasible for three main reasons
Practices vary widely when it comes to constructing
national poverty lines Although the most common
approach is the cost of basic needs using MEBs
sometimes poverty lines are set as a share of the
country mean or median income or expenditures or
as a fixed percentage of the income or expenditure
distribution (although this is mostly not the case in low
income countries) Furthermore even when a MEB has
been constructed to develop the poverty line different
methodologies exist For example sometimes countries
exclude non-food items from their poverty line MEB
Since the MEB describes the cost of essential needs the population for whom the MEB is constructed should ideally have relatively homogenous consumption patterns and needs
12 The Cash Learning Partnershiprsquos MEB Tip Sheet contains useful advice on the interagency processes around constructing a MEB Baizan and Klein 2019
9
Minimum Expenditure Baskets Guidance Note | December 2020
Countries can also have different poverty lines for
different purposes and regions13 These factors can all
limit the use of the national poverty line as the MEB
The population of interest for a MEB could differ from the
overall population of the country and hence the national
poverty line This group of people may have different
essential needs for instance if they live in refugee camps
or do not have access to the same services as the resident
population (eg public education)
The data that WFP typically collects through essential
needs assessments comprehensive food security
and vulnerability analyses emergency food security
assessments baseline assessments and post distribution
monitoring is often much less detailed than that gathered
through the household budget surveys or living standards
measurement surveys used to calculate national poverty
lines It is widely observed that the more detailed the
survey questions about expenditures the higher the
reported expenditures14 If the national poverty line is
constructed using detailed data but the assessment of
household needs or expenditures relative to the poverty
line is based on less detailed data errors in the analysis
are likely to occur Furthermore WFP expenditure
modules do not include asset depreciation which is often
accounted for when calculating national poverty lines
Even if the national poverty line cannot be used in most
cases and especially in humanitarian contexts elements of
the methodology can perhaps be replicated It is therefore
important to find out how the national poverty line is
constructed
How about using the methodology applied for consumer price indices The consumer price index (CPI) is used to measure changes
in price levels based on a weighted average consumer basket
of goods and services In most countries household budget
survey data is used to construct the baskets used to measure
consumer prices A weight that corresponds to average
household expenditure patterns is applied to each component
of the CPI17 This basket is not ideal for MEB calculations
because it corresponds to overall national average
consumption patterns MEBs are based on the consumption
levels and patterns of those households who are just able to
meet their essential needs within the population of interest
(this is further described in the following sections)
13 Jolliff and Prydz 2016 14 Haughton and Khandker 200915 Republic of Zambia Central Statistical Office 2016 16 See Turkish institute of statistics data portal httpsdatatuikgovtrKategoriGetKategorip=Income-Living-Consumption-and-Poverty-10717 The CPI weights are usually available through national statistical offices
COUNTRYEXAMPLE
EXAMPLES OF NATIONAL POVERTY LINESEG Box 2
In Zambia the national poverty line is constructed using the cost of basic needs MEB approach based on a simple food
basket that meets minimum food needs for a family of six15 Imagine this food basket costs USD 100 per month This is
defined as the food poverty line To construct the full poverty line the minimum non-food needs of households are
estimated based on the average share of expenditure that households just above the food poverty line dedicate to needs
other than food Let us say that this corresponds to USD 35 per month The total poverty line is then the sum of the food
and non-food lines which with these hypothetical figures would be USD 100 + USD 35 = USD 135
By contrast Turkey uses the standard European Union approach to measuring poverty which is 50 or 60 percent of
median income16 However eligibility for social assistance is based on the gap between household income and the national
minimum wage
10
Minimum Expenditure Baskets Guidance Note | December 2020
In developing country contexts consumption is generally considered a better metric of wellbeing than income and in turn consumption expenditures as captured in household data generally provide the most reliable measure for consumption
5 Constructing a MEB expenditure-based and rights-based approaches
51 The expenditure-based approachThe expenditure-based approach to constructing a MEB
relies on household-level expenditure data to examine the
consumption behaviour of households who are just able
to meet their essential needs The expenditure level and
consumption patterns for this group of households reveal the
minimum cost of covering essentail food and non-food needs
and therefore form the basis of the expenditure-based MEB
The expenditure-based approach builds on the theory
behind poverty measurement and poverty line construction
To measure poverty the first step is to define a measure
of wellbeing In developing country contexts consumption
is generally considered a better metric of wellbeing than
income and in turn consumption expenditures as captured in
household data generally provide the most reliable measure
for consumption18 Household survey data on expenditures
therefore provides the foundation for measuring wellbeing
and is used to set the MEB threshold
The steps for constructing a MEB using the expenditure-based
approach are explained below
1 Prepare the expenditure data The prerequisite for an expenditure-based MEB is a
good-quality household survey with a detailed expenditure
module with a sufficient sample size representative of the
population for whom the MEB is being constructed (the
ldquopopulation of interestrdquo)
The notion of a ldquodetailedrdquo expenditure module is a
relative one Constructing an expenditure-based MEB
requires more detailed data on different types and
groups of expenditures than is usually gathered by
household surveys conducted in humanitarian settings
However this guidance has been designed to cope
with less detailed expenditure data than that gathered
through extensive national expenditure surveys such
as the very granular expenditure modules typically used
when constructing poverty lines (eg national household
budget surveys household income and expenditure
surveys living standards measurement surveys or other
large-scale household surveys)
What is a sufficient sample size The survey should
always follow good practices for sampling19 Consider
that for MEBs the analysis focuses on the consumption
patterns of a subset of the sample the ldquoreference cohortrdquo
(see next below) The characteristics of the population
and the cohort selection criteria determine the size of
this subsample in relation to the overall sample but
experience shows that the cohort can comprise between
10 and 60 percent of the sample The sample will be
further disaggregated if analysis by household size or
group of household size is desired (see section 7 on
accounting for household sizes)
Using expenditures to understand consumption involves
calculating a ldquoconsumption aggregaterdquo This entails
combining household expenditures on food and non-
food paid in cash or through credit as well as the
imputed monetary values of consumed own production
and received assistance Expenditures are analysed in
per-capita values Box 3 describes this process in more
detail Annex 1 further outlines some best practices when
analysing expenditure data
In addition to the household survey data market price
data is needed in order to estimate the final cost of the
basket The price data should be collected around the
same time as the household survey data
18 Deaton and Zaidi 2002 and Haughton and Khandker 2009 19 For guidance see WFP 2004 Additional resources can be found in the online VAM Resource Centre httpsresourcesvamwfporg
11
Minimum Expenditure Baskets Guidance Note | December 2020
HOW TO
EXPENDITURE DATA IN MEB CALCULATIONS -CONSTRUCTING A LIGHT ldquoCONSUMPTION AGGREGATErdquo
Box 3
Using expenditures to calculate a MEB entails combining different household expenditures to arrive at a measure of house-
hold consumption This is typically referred to as a consumption aggregate although a lighter version is used than those
usually constructed for national poverty lines due to the less granular data typically available for MEB construction20
Expenditures considered in a MEB should reflect household consumption related to essential needs Therefore both
household expenditures made in cash and those on credit must be considered as the latter also reflect current consump-
tion even if payment occurs later If the population can be expected to consume food from their own production the value
of this food should be captured to avoid underestimating food expenditures Lastly if the surveyed households are receiv-
ing and consuming assistance it is advisable to estimate the implied value of this assistance and include it in the expendi-
tures (however care needs to be taken if the population of interest includes a large group of in-kind assistance beneficiar-
ies as this can significantly skew consumption choices see next section on selecting the reference cohort) In summary the
expenditure module should capture any expenditures made in the reference period through cash and credit purchases as
well as the monetary value of consumed own production and assistance Most standard expenditure modules include all
these types of expenditures
Expenditures should be collected for both food and non-food goods and services For food expenditures at the food group
level are required as a minimum If food expenditures are collected at the item level a more granular analysis can be per-
formed The same applies for non-food expenditures they must be available at the group level and item-level data will add
detail However whenever household data is collected a balance needs to be struck between the granularity of the data
and the time and resources available for its collection
The WFP standard expenditure module can be used as a reference for the minimum requirement for expenditure data
collection WFP standard modules can be found in the online VAM Resource Centre httpsresourcesvamwfporg
+ ndash=
2 Select the reference cohort The next step is to identify the households in the survey
data that are just able to meet their essential needs and
examine their expenditures Including households below
this level would generate a basket that does not satisfy
essential needs while including relatively wealthier
households would lead to the inclusion of non-essential
needs and therefore inflate the MEB But what is ldquojust
enoughrdquo
Identifying the cohort of households who are just able
to meet their needs can be challenging How to approach
it depends on the characteristics of the population
and the available data The key is to identify one or
more criteria that can be good proxies for whether
households are just able to meet their essential
needs and that can be observed in the data One
basic indicator would be a food consumption of 2100
kcal per person per day21 However since the available
expenditure data is often too crude to make accurate
calibrations of diet compositions around the 2100
kcal point the use of alternative indicators is highly
recommended These could be indicators such as food
consumption score (FCS) or food consumption score ndash
nutrition (FCS-N)22 which indicate whether households
eat sufficient and balanced diets quality of housing
indicators use of coping strategies (selecting households
who do not engage in severe strategies) or any other
indicator that reflects a householdrsquos ability to meet its
needs Combining several indicators is often useful
20 For thorough guidance on constructing consumption aggregates using data from living standard measurement surveys (LSMS) see Deaton and Zaidi 2002 In most WFP cases household data is less granular than the LSMS-type datasets This section therefore describes how to construct consumption aggregates with less detailed data21 Use of calorie consumption close to the Sphere Standard of 2100 kcalpersonday as the starting point for selecting the reference cohort originates in the cost of basic needs approach used in most national poverty line estimations 22 WFP 2008 and WFP 2015
12
Minimum Expenditure Baskets Guidance Note | December 2020
Figure 2 Selecting the MEB cohort
In simple terms it is useful to think of the green people in the figure as the basis for selecting the reference cohort they are not amongst the worst-off
nor the wealthiest ndash but rather are just able to meet their essential needs
DESTITUTE
WEALTHY
It is also recommended to examine the expenditure
distribution Excluding households in the extreme ends
of the expenditure distribution can help ensure that
the cohort is neither ldquotoo poorrdquo nor ldquotoo wealthyrdquo (eg
by removing households in expenditure quintiles 1 and
5 or similar exclusion criteria based on distribution
characteristics) This is in particular useful if there is a
relatively large spread in wealth across the sampled
population
Figure 2 provides a simplistic depiction of selecting the
reference cohort the aim is to identify households that
are just able to cover their needs and hence do not fall in
either extreme end of the spectrum
13
Minimum Expenditure Baskets Guidance Note | December 2020
Box 4 outlines some typical cases and presents suggestions
for how to select the cohort in a survey sampled on
the population of interest
There is a spread in the
population in terms of well-being
and a proportion is able to cover
their essential needs no
households receive assistance
A relatively large proportion of
households receive food
assistance
The vast majority of the
households are far from being
able to cover their essential
needs (prior to receiving
assistance)
Select households with an acceptable FCS23 or with adequate consumption in FCS-N
who do not use negative coping strategies (or have a high coping strategy index)
Combine or cross-check with other criteria such as dwelling quality or asset index
Exclude extreme expenditure quintiles
Exclude households receiving in-kind food assistance from the reference group (if
sample size allows) This is because any assistance that is not unrestricted cash
might influence the consumption choices of the beneficiary households (in-kind
food means a large portion of food consumption is determined by the assistance
provided not the households) However be aware that if the majority of
households receive some form of restricted assistance excluding them all from the
cohort can lead to sample size issues as well as selection bias
Alternatively to the extent possible avoid using criteria that are highly influenced
by assistance For example in the presence of food assistance the FCS of some
households might be acceptable even if they are not able to meet their essential
needs Furthermore if in-kind food is provided the consumption behaviour of such
households might be skewed as most of their food needs are already covered by
assistance
Consider using dwelling quality an asset index or other similar indicators instead
(or in combination with the FCS)
Consider using a rights-based approach since it will be very difficult to obtain a big
enough sample of households who can meet their essential needs making it
challenging to construct an expenditure-based MEB Carry out a reality check using
the survey data to understand household consumption patterns keeping in mind
that the sample represents a population not able to fulfill their essential needs
HOW TO
REFERENCE COHORT SELECTIONBox 4
Scenario Possible approach to selecting the cohortUse one or several of the below criteria
The use of sensitivity tests is highly recommended in the form
of repetitions of the expenditure analysis for different versions
of the reference cohort this will indicate the extent to which
the choice of cohort selection criteria is influencing the MEB
23 It is usually not advisable to use the FCS as a single criterion If it is used alone the indicator should be capped at a certain level above the acceptable threshold (the FCS builds on a continuous score from 0ndash112 and applies thresholds for poor borderline and acceptable consumption) This is because if all households with acceptable FCS are included this will likely also capture some households who are ldquotoo wealthyrdquo to be considered in the reference cohort
14
Minimum Expenditure Baskets Guidance Note | December 2020
See box 5 for examples of how sensitivity tests can be
conducted as well as how the reference cohort has been
COUNTRYEXAMPLE
SELECTING AND CHECKING THE REFERENCE COHORTCHAD SYRIAN REFUGEES IN LEBANON AND COXrsquoS BAZAR
EG Box 5
Reference cohort sensitivity analysis ndashCoxrsquos Bazar MEB
Table a
In Chad the calculation of an expenditure-based MEB relied on national data collected by the Government during their
annual national food security and nutrition survey The reference cohort for the MEB was selected on the basis of two
criteria FCS between 35 and 70 eg in an interval around the acceptable threshold and no adoption of crisis or emergency
livelihood coping strategies based on the livelihood coping strategies indicator These two criteria ensured that the
selected reference cohort had consumption levels that provided sufficient food security and sustainable livelihood
strategies
For Syrian refugees in Lebanon24 an expenditure-based MEB was calculated by WFP in order to review an existing MEB
Shelter plays an important role as most refugees live in an urban host community and face high rents The FCS reveals
whether people can cover their food needs but could be influenced by the presence of food assistance To ensure results
would be robust against the choice of the cohort two different approaches were compared both included households of 4
to 6 members (as the MEB under review was defined only for households of these sizes) and excluded households in
expenditure quintiles 1 and 5 In version 1 an additional criterion of acceptable FCS was included while in version 2 an
additional criterion of acceptable housing conditions was applied The results were similar for both cohort versions
A MEB was calculated in Coxrsquos Bazar Bangladesh as part of the 2019 Refugee Influx Emergency Vulnerability Analysis
(REVA-II)25 for Rohingya refugees An expenditure-based MEB was built using a large household survey that included
refugees and host community households the reference cohort also included refugees and host communities as the MEB
was meant to apply to both groups Households receiving in-kind food assistance were excluded to avoid possible bias in
consumption choices which would be reflected in the expenditure data The reference cohort was then selected based on
FCS and expenditure quintiles To ascertain that the appropriate cohort had been chosen a sensitivity analysis was
conducted which tested the effect of removing different expenditure quintiles (quintiles 1 and 5 versus quintiles 1 4 and 5)
and including different FCS ranges (FCS 42+ versus FCS 35ndash80) This showed that across different iterations of the reference
cohort total food expenditures were relatively stable while non-food expenditures went up when richer households (eg in
the higher expenditure quintiles) were included This allowed the analysts to select the cohort of households who were just
at the point where the share of food expenditures out of total expenditures began to decrease as a high share of
expenditure on food is often an indicator of vulnerability In other words the selected cohort was just at the point where
households started meeting more needs than just food and the most basic non-food requirements The consumption
patterns of this cohort -highlighted in table a below - therefore became the basis for the MEB
Indicator 1expenditurequintiles
Indicator 2FCS Sample
size Value in taka
Total MEB
Exclude quintiles 1 4 and 5
Exclude quintiles 1 4 and 5
Exclude quintiles 1 and 5
Exclude quintiles 1 and 5
FCS 35ndash80
FCS gt= 42
FCS 35ndash80
FCS gt= 42
403
296
610
474
5259
5324
5691
5740
2304
2299
2990
3082
070
070
066
065
030
030
034
035
7562
7623
8681
8822
Food MEBValue in taka Value in taka
Non-food MEB
identified in different contexts
24 Hohfeld et al 2020 25 WFP 2019
15
Minimum Expenditure Baskets Guidance Note | December 2020
3 Establish the food basketWith the reference cohort identified the food basket value
should be calculated in correspondence with the food
consumption patterns of the reference cohort
To calculate the food basket start by computing the mean
(or median) food expenditures for the chosen reference
cohort It is good practice to compute the overall food
expenditures and break the analysis down into the different
food groups or food items in order to understand how food
consumption is distributed across different foods
Next consider whether an explicit reference food basket
is needed in the MEB this is a list of the food items in the
basket and their quantities Having a reference basket
brings advantages in terms of monitoring of the cost
of the MEB (as new prices can easily be applied to the
quantities) it shows consumption patterns in quantities
and can hence help check if food consumption is adequate
at the given level of expenditures and it can help when
communicating about the MEB It can therefore be a useful
practice to establish one However in some instances
a simple monetary value for the food MEB is sufficient
This could be the case when the MEB is calculated to
review an existing MEB if reference basket is not needed
for operational purposes when time is limited or
where limited data means a reference basket cannot be
adequately calculated Wherever a food reference basket
is not needed the food MEB will simply be the mean (or
median) food expenditures by food groups or food items
as calculated above If a reference food basket is feasible
and desired the next steps depend on the level of detail in
the data available
With expenditure data and market prices a food
reference basket can be approximated using expenditures
by food group or food item and dividing these
expenditures by the relevant food prices This provides
estimates of consumed quantities Expenditures and prices
must be collected at the same time in order to arrive at
correct quantities If for example prices are collected six
months later than expenditures and prices have changed
significantly dividing expenditures by prices will produce
inaccurate estimates
Note that the level of detail and accuracy with which a
food refence basket can be established using expenditures
and prices also depends on whether expenditures
were collected at the food group or food item level Box 6
illustrates how to approximate a reference basket when
expenditures are collected at the food group level and
box 7 shows an example of a food basket estimation from
an assessment in Kinshasa Democratic Republic of the
Congo
If the expenditure module includes consumed quantities
of food in addition to expenditures a food basket can be
established directly based on the consumed quantities by
food group or food item Having data on quantities will
also enable analysts to estimate prices directly from the
survey data by dividing the household expenditure on a
particular food item by the quantity consumed This can be
advantageous as it provides a direct estimate of the prices
households actually paid (unlike a price survey which uses
typically consumed items and is often only conducted
at specific points of sale) On the other hand this may
introduce issues related to non-standard measurement
units that make prices hard to compute and aggregate26
Box 8 shows an example from Coxrsquos Bazar of how a food
reference basket can be established using item-level
expenditures and quantities from the survey data
Once the quantities consumed have been established using
one of the methods described above it is good practice to
check the calories these quantities provide and the balance in
terms of nutrients The basket should be close to the Sphere
Standard of 2100 kcal per person per day ndash if it is not one
option could be to scale the basket Use information on the
calorie content of the different food items in the basket to
calculate the total calorie content of the basket27 The quantities
in the basket can then be scaled up or down to reach 2100
kcal However bear in mind that if the reference cohort has
been well selected and the data is of sufficient quality and
detail the basket should already be close to 2100 kcal If large
rescaling is required investigate the reasons behind this For
the sake of simplification quantities can be rounded and the
basket can be streamlined by removing items with very low
consumption or nutritional value
26 Deaton and Grosh 2000 27 Calorie information of food items can be drawn from a variety of sources The Nutval tool (httpwwwnutvalnet) provides information on calories and other nutrients for a list of items Consider that the
specifications and quality of a product can influence its caloric value (eg whole fish vs fish fillet) ndash it might be necessary to adjust for this for certain items that vary widely Many food composition tables (available from FAO for different continents httpwwwfaoorginfoodsinfoodstables-and-databasesfaoinfoods-databasesen) contain a wastage factor or edible portion conversion factor to convert from edible portions into full products as they are bought on the market
16
Minimum Expenditure Baskets Guidance Note | December 2020
After establishing the reference basket and possibly rescaling
it the basket is priced This is done by multiplying the basket
quantities by the food prices The basket can be priced using
current food prices from a price survey or by estimating food
prices from the expenditure data as described earlier The
result should be close to the expenditures for the reference
cohort although differences could arise from any rescaling or
simplification of the basket
APPROXIMATING A FOOD BASKET WITHGROUP-LEVEL FOOD EXPENDITURES
Box 6
HOW TO
Data quality and granularity has a big impact on the calculation of a food reference basket If consumed quantities are not
directly available in the dataset they need to be calculated by dividing expenditures by prices However this will always
produce an approximation and the more aggregated the data on expenditures is the more approximate the results will be
In particular when the food expenditure data is available at the food group level care needs to be taken when converting
expenditures into quantities
For example to convert expenditures on the food group ldquocerealsrdquo into a reference quantity analysts need to divide cereal
expenditures by the price of cereals But how do they determine the price of cereals This is a food group not a specific item
so there is no exact price The recommended way to approach this is to determine which is the most commonly consumed
item or combination of items for each food group Then a price for the most commonly consumed item or a composite price
of a combination of items can be used to arrive at quantities So if the most commonly consumed cereals for the population
of interest are maize and rice and they are eaten in equal measure by the population the cereal quantities for the reference
basket can be calculated in the following way
Mean cereal expenditures for our reference cohort = 150 shilling
Price of rice = 18 shillingkg
Price of maize = 12 shillingkg
Composite price of rice and maize = (18 + 12) 2 = 15 shillingkg
Cereal quantity consumed = 150 shilling (15 shillingkg) = 10 kg (5 kg rice 5 kg maize)
Of course this is an approximation care needs to be taken when converting expenditures into quantities using
group-level data
Certain food groups may lend themselves more to this approximate conversion than others For example cereals
might be relatively easy to convert using this method as cereal consumption often is concentrated on a few key staples In
contrast vegetable consumption may be so diverse that conversion via prices is not helpful In this latter case one option
could be to obtain reference basket quantities for the groups that can be converted and leave other groups as expenditures
only so that the food MEB becomes a combination of quantities and expenditures
In summary to establish the food basket
i Calculate mean (median) food expenditures by food group
or item If an explicit reference basket with quantities is not
needed stop here and simply use the expenditures as the food
basket
ii Estimate consumed quantities (by dividing expenditures
by prices or directly from data if it contains consumed
quantities)
iii Check the resulting quantities and consider scaling to meet
Sphere Standards
iv Price the basket using market prices or prices derived
from the household data
17
Minimum Expenditure Baskets Guidance Note | December 2020
Table a Food reference basket ndash Kinshasa MEB
COUNTRYEXAMPLE
KINSHASA FOOD REFERENCE BASKET USINGFOOD GROUP EXPENDITURES
Box 7
In the Kinshasa urban essential needs assessment28 the food reference basket for the MEB was established as follows
Expenditure data was available at the food group level only The caloric importance of each food group (column A of the
table below) as a part of the overall food intake was determined For each of the calorie-relevant food groups the most
commonly consumed food item was then identified (eg maize in the case of cereals) (see column B) Using the average per
capita expenditure from the household survey (column C) and the market price for each food item (column D) the
quantities consumed per person per month were approximated (column E) Next the total calorie intake was calculated
(column G) For urban Kinshasa this amounts to 1967 kcal which is close to the Sphere Standard of 2100 kcalpersonday
and suggests that the expenditure data is likely to be reliable However a proportional rescaling to 2100 kcalpersonday
was done to ensure consistency with Sphere (column H) On the basis of the rescaled total calories all values were then
converted back to monthly figures to arrive at a monetary value for each food item (columns I and J) In addition to the
calorie-relevant food items the mean expenditures on other food categories that households regularly consume were
added (vegetables fruit etc) As these food items represent little overall share of peoplersquos calorie consumption (given the
quantities consumed or the type of the foods) they were not included when calories were calculated Furthermore it would
be difficult to select specific food items in each of these categories as they are quite diverse (eg vegetables) However as
most households still consume these food items as part of their usual diet and they provide important micronutrients their
costs need to be reflected in the food MEB The mean expenditure on these food categories was therefore used as a
good-enough approximation for householdsrsquo consumption of these food groups Meals consumed outside the household
were excluded from the MEB as they were not considered essential
Food
grou
p
Food
item
per
capi
ta a
vm
onth
ly e
xp
Pric
e(f
ranc
kg)
kg c
ons
per
mon
th =
CD
food
item
kca
lpe
r 10
0g
kcal
con
s p
er d
ay=(
EF
10)
30
kcal
per
day
res
cale
d=G
(21
001
967)
kg p
er m
onth
res
cale
d=(
H(
F10
))30
roun
ded
MEB
food
-bas
ket
(fra
nc)=
ID
6898
1808
2089
2341
4306
1817
2826
833
799
2509
2144
900
500
1300
2300
2500
2200
77
36
16
10
17
08
920
412
179
302
44
110
1967
360
342
335
890
76
400
TOTAL
982
440
192
322
47
118
2100
82
39
17
11
18
09
7400
1900
2200
2500
4600
1900
2800
800
800
2500
27400
A B C D E F G H I JCereals
Tubers
Pulses
Oilsfats
Meatfish
Sugars
Vegetables
Fruit
Dairy
Condiments
Meals out-
side home
Maize
Cassava
Beans
Veg Oil
Fish
White sugar
Vegetables
Fruit
Dairy
Condiment
Meals out-
side home
29 WFP 2019 Also see box 5
18
Minimum Expenditure Baskets Guidance Note | December 2020
COUNTRYEXAMPLE
COXrsquoS BAZAR FOOD REFERENCE BASKETWITH DETAILED EXPENDITURE AND QUANTITY
Box 8
In the MEB for Coxrsquos Bazar calculated as part of the REVA II assessment expenditures and consumed quantities were
available for 87 food items which formed the basis for the consumption aggregate While the expenditure data was used to
select the appropriate reference cohort the reported quantities were used to determine household calorie intake
Quantities were reported at the food item level and consumed calories were calculated for each item The items were then
categorized by food group (cereals pulses oilsfats vegetables etc) and the total calories from each group were
calculated To create an operationally relevant reference basket without very large numbers of food items the number of
items in each food group were reduced where possible For example 95 percent of the calories that households get from
the food group ldquocerealsrdquo come from rice The cereal food group was therefore simplified to rice only keeping the total
calories sourced from cereals constant and adjusting the quantity of rice in the basket slightly upwards For pulses the four
main consumed items were identified and calories and quantities proportionally adjusted For other food groups such as
vegetables the variety of items consumed within the group was too great to simplify items to a small number for this
group no items were assigned and instead total expenditures on vegetables for the reference cohort were used directly in
the food MEB The total calories of all items were taken into account The resulting basket was close to 2100 kcal so only
minor rescaling was undertaken to arrive at final reference basket of 2100 kcalpersonday
Once the final basket had been determined quantities were priced using median prices derived from the household data
(by dividing expenditures by purchased quantities for the relevant items)
For vegetables fruits meat dairy and condiments expenditures are used directly in the food MEB (converted into monthly per
household values) For all other items quantities per capita per day are multiplied by the item median price (as derived from
the household data) and converted into monthly per household values
The MEB uses household size 5
Note The MEB for Coxrsquos Bazar was calculated for analytical purposes for the REVA II assessment It is not the operational MEB used
for the district
Foodgroup
Fooditem
Consumedquantity(grammescapitaday)
Calories(kcalcapitaday)rescaled
Median prices(takakg)
Value in MEB(taka per HHmonth)
424
14
7
2
1
182
6
81
1
33
6
28
1527
48
27
8
4
78
5
85
1
294
24
0
2100
30
80
60
40
80
-
-
-
-
80
60
-
1909
168
67
14
13
1065
48
1600
15
392
57
345
5691
Cereals
Pulses
Pulses
Pulses
Pulses
Vegetables
Fruit
Meat
Dairy
Fats
Sugar
Condiments
TOTAL FOOD
Rice
Lentil
Chickpea
Anchor daal
Mung
none
none
none
none
Soybean oil
Sugar
none
Table a Food reference basket ndash Coxrsquos Bazar MEB
19
Minimum Expenditure Baskets Guidance Note | December 2020
4 Establish the non-food basketOnce the food component has been established a non-
food component is added There is no wholly satisfactory
way to add a non-food component as it can be difficult to
define an essential minimum Unlike food needs many
non-food needs are often more contextual and are not
easy to anchor in a specific universal threshold (like the
food Sphere Standard of 2100 kcal per person per day)
While Sphere Standards exist they often need to be
contextualized and may not cover all non-food essential
needs
The non-food basket can be established with different
levels of detail depending on the available data and the
level of granularity desired
As for the food expenditures start by calculating the
mean (andor median) non-food expenditures for the
reference cohort If the expenditure data is detailed it can
be used to identify specific non-food needs Expenditures
can be analysed by non-food group (eg shelter hygiene
or transport) to design a non-food basket composed
of group-specific expenditures The precise non-food
components can vary by context but would generally
include the components discussed in the section on
the rights-based MEB below Some non-food items that
expenditure data has been collected for might need to be
excluded for the purpose of constructing the MEB (eg
tobacco which is hard to consider an essential need)
In theory it would be possible to establish a non-food
reference basket with specific quantities using the same
method as for food ie by dividing expenditures by prices
to arrive at quantities However this is usually not feasible
for non-food goods and services simply because non-food
expenditure data is often much harder to break down into
specific items than food expenditure data For instance
even if expenditures on clothing or transportation
are known relating this to exact clothing items or
transportation services and then obtaining accurate
prices for those itemsservices will often prove difficult if
not impossible Therefore as a general recommendation
in the expenditure-based approach when non-food
expenditure data is not available at the item level it is
best to keep the non-food basket to expenditures and not
provide quantities If reliable market price information on
relevant non-food items is available total expenditures
could be checked against prices to obtain an approximate
idea of the adequacy of the non-food expenditures
Particular groups of non-food expenditures may require
special attention due to their nature Box 9 highlights a
few examples
TIP BOXNON-FOOD EXPENDITURES ndashEXPENDITURES OF PARTICULAR INTEREST
$$
$
Box 9
Shelter expenditures can be a tricky component to deal with especially for urban populations If the share of the
population who rent accommodation is significant rent will typically be included in the MEB as it is the cost of shelter an
essential need Indeed it can form quite a significant part of the MEB However if the resulting MEB is compared to actual
expenditures to determine whether households fall below the MEB those who own their dwelling and therefore do not pay
rent might be classified as unable to cover their needs just because they do not have any major shelter expenditures
Therefore large single expenditures such as rent should be included with care and context will determine how shelter
expenditures are handled in the MEB Generally speaking if no or very few households in the population of interest have
major shelter expenditures such as rent this component should be left out of the MEB and no attempt made to impute it
(as is sometimes the case in poverty line estimations) If the majority of households rent their dwellings it is advisable to
include mean rent expenditures in the MEB The trickier case is when the households in the population of interest are split
between a significant number of households living in owned or no-rent housing and a significant number paying rent ndash
here it is difficult to reflect shelter expenditures adequately in the MEB Simply using mean rent estimations in the MEB will
underestimate the need for the renters while overestimating it for those who own their housing or do not pay rent In this
case insofar as data allows one solution could be to impute rent expenditures for the non-renters by estimating the
would-be rental cost for the type of housing they live in Doing this typically requires a housing module in the household
survey that contains information on ownership and types and sizes of housing so rental equivalents can be computed and
imputed for the non-renters
20
Minimum Expenditure Baskets Guidance Note | December 2020
NON-FOOD EXPENDITURES ndashEXPENDITURES OF PARTICULAR INTEREST
$$
$
Box 9
Health expenditures can also be challenging to capture adequately in survey data as such expenditures are often irregular
in nature Bear in mind that health expenditures usually consist of payment for goods such as medicines and for services
such as visits to the doctor When analysing the expenditures and deciding how to include them in the MEB consider which
services may be provided free of charge and what households pay themselves and at what cost30
Care should be taken when it comes to the underreporting of expenditures and treatment of expenditures that are
irregular in nature Remember that the MEB should include all recurrent essential needs but it typically does not include
one-off expenditures ldquolumpy expendituresrdquo such as marriage expenditures or dowries or investments Expenditures
on durables (for instance the purchase of vehicles or large household appliances) are also not included (in national poverty
lines the rental value of the durables owned by households adjusted for depreciation is sometimes included31 however
this is not recommended for MEB calculations)
Household expenditures on savings taxes and debt repayment are not usually included in the MEB as these types of
expenditures do not reflect actual consumption
Tobacco and alcohol are often included in expenditure surveys While households may choose to spend money on these
items they can fairly be assumed to be non-essential and are generally not recommended for inclusion in the MEB
The ldquoquick fixrdquo if data is very limited If the expenditure
data has no or very insufficient data on non-food
expenditures a ldquoquick fixrdquo solution is to use the average
non-food expenditure share of total expenditures This can
often be obtained from external sources such as monitoring
reports or food security assessments This is then added
COUNTRYEXAMPLE
Table a Non-food basket ndash valuesCoxrsquos Bazar
Value in MEB (takaHHmonth)
Non-food group
Toiletries and cleaning
Clothes shoes and towels
Cooking equipment
Education
Fuel and electricity
Medical treatment
Household textiles and small repairs
Communication
Transport
Total non-food
461
521
25
134
775
447
57
274
295
2990
Figure a Non-food basket ndash distribution Coxrsquos Bazar
Note The MEB for Coxrsquos Bazar was calculated for
analytical purposes in the REVA II assessment
It is not the operational MEB for the district
9Communication
10Transport
2Householdtextiles and
small repairs
15Medical
treatment
26Fuel andelectricity
5Education
1Cooking
equipment
17Clothes shoes
and towels
15Toiletries
and cleaning
EXPENDITURE-BASED NON-FOOD REFERENCEBASKET EXAMPLE FROM COXrsquoS BAZAR
Box 10EG
to the cost of the food basket to arrive at the total MEB
However when using an additional data source analysts
should understand how the average share of non-food
expenditures has been calculated and what sample it has
been derived from as it may not reflect the consumption
patterns of the reference cohort
30 The WHO and Global Health Cluster guidance on health expenditures in the MEB has some useful insights into household health expenditures See WHO and Global Health Cluster ndash Cash Task Team 2020 31 Deaton and Zaidi 2002
21
Minimum Expenditure Baskets Guidance Note | December 2020
52 The rights-based approachIn humanitarian contexts ldquoessential needsrdquo have been
understood as referring to access to full rights as set out by
international humanitarian law and the Humanitarian Sphere
Standards The term ldquorights-based MEBrdquo is derived from
this understanding According to the operational guidance
on multipurpose cash grants32 international humanitarian
and human rights law protects the right of crisis-affected
persons to food33 drinking water soap clothing shelter and
lifesaving medical care Humanitarian Sphere Standards
builds on this definition and outlines minimum humanitarian
standards in the areas of food security and nutrition
shelter and settlement health and WASH (water supply
sanitation and hygiene)34 In some contexts residency or legal
documentation is also included Humanitarian standards
for education are outlined in the Education in Emergencies
Minimum Standards Handbook35
The rights-based approach entails defining a detailed list
of the food and non-food items that make up the MEB
reference basket and pricing them using current market
prices MEBs built by the Interagency Cash Working Group or
other interagency coordination forum are often constructed
following the rights-based approach with each sector or
cluster contributing to the needs in their respective sectors
In these cases WFP is usually responsible for defining the
food component of the MEB For both food and non-food
items the reference basket is typically produced or cross-
checked through focus group discussions with the population
of interest partners and key informants It is usually put
together based on the needs of an average-sized household
1 Establish the food basketTo construct the food basket for a rights-based MEB compile
a list of food items and their quantities The Sphere Standards
offer a useful starting point recommending a diet of 2100
kcal per person per day with 10ndash12 percent of daily energy
intake from protein and 17 percent from fats36 The food
basket should be adapted to local diets and preferences
2 Establish the non-food basketOnce the food basket has been established a non-food basket
should be added In the rights-based approach this is typically
done by quantifying needs by producing a list of items by
sector Some examples are found below
Shelter This is the cost of accommodation that meets
basic shelter needs and rights What this means in practice
will depend on the context driven for example by weather
conditions and what is realistically available to the population
Utilities These include the cost of basic utilities such as safe
drinking water and depending on the context electricity
Non-food items These reflect basic household needs
related to cooking clothing and hygiene plus other general
household items Cooking gasfuel or firewood is often
included In line with the definition of the MEB the list should
focus on recurrent needs In practice these non-food items
can look very different depending on the context 38
Services This includes the costs of accessing basic services
such as healthcare education transport and communication
Healthcare costs are often difficult to quantify since they
are inherently irregular large and unpredictable Typically
however only basic minimum needs are covered in the MEB
such as eg two visits per year to the doctor expenses for
critical events deliveries and medicines are sometimes also
included Note that even if a need is not covered by the MEB
it does not mean that these needs do not need to be met for
the population of interest Health can be an example of this
health needs are often better met through service provision
than purchased through the market and therefore may
be only partially reflected in the MEB However guidance
from WHO and the Global Health Cluster notes that people
tend to have some level of health expenditures even when
COUNTRYEXAMPLE
SHELTER IN THE MEBFOR SYRIAN REFUGEES
EG Box 11
For the Syrian refugee operation in Turkey the MEB
includes the costs of shelter that meets certain
standards such as a minimum of 35 m2 per
person access to a toilet and running water
32 UNHCR et al 2015 33 Defined as energy needs not considering full nutrient needs (protein vitamins minerals etc) 34 See the Sphere Standards Handbook 35 INEE 2010 36 Further recommendations on micronutrient requirements can be found in the Sphere Standards Handbook37 Hobbs 201638 For some refugee contexts the Office of the United Nations High Commissioner for Refugees (UNHCR) has lists of specific items which can be considered for the MEB
22
Minimum Expenditure Baskets Guidance Note | December 2020
policies are in place that require the free public provision of
health services39
Education costs usually cover school fees materials
uniforms and transport depending on what households
have to pay themselves and what is publicly available
Transport and communication needs are often defined as
the average transport and communication costs reported by
household surveys and then validated with the communities
COUNTRYEXAMPLE
EXAMPLE OF A RIGHTS-BASED MEBFOR NORTHEAST NIGERIA
Box 12EG
The northeast Nigeria cash working group designed a MEB for a household of seven people40 the resulting reference
basket is shown below
Sectorgroup
Item Quantity(7 pers HH)
Sectorgroup
Item Quantity(7 pers HH)
Cooking fuel
WASH
Cooking fuel
WASH
Transportation
Communication
Health
Education
Firewoodbriquette
charcoal
Water + vendor fee
Bathing soap
Laundry soap
Sanitary pads
Firewoodbriquette
charcoal
Water + vendor fee
Bathing soap
Laundry soap
Sanitary pads
Rides
Airtime 500 NGN
Average expense
Pen
Pencil
Notebook
1 bag
158 jerrycans
13 bars
3 bars
4 packs
1 bag
158 jerrycans
13 bars
3 bars
4 packs
10 rides
1
7 pers
3 pcs
3 pcs
3 pcs
Table a MEB example northeast Nigeria
27 kg
45 kg
135 kg
18 L
27 kg
18 kg
36 L
09 kg
144 kg
2 kg
2 kg
1 kg
05 kg
12pcs
1L
Food Rice
Maize
Beans
Palm oil
Groundnuts
Sugar
Vegetable oil
Salt
Onion
Non-leafy vegetables
Leafy vegetables
Fruits
Meats
Chicken eggs
Vinegar
communication needs can also be specified as the cost of a
SIM card with a certain amount of data or airtime
3 Price the reference basketWith the food and non-food reference baskets established
the list of items and quantities are now priced using updated
prices from markets relevant to the population of interest
The pricing should be done based on actual current market
prices This produces the final rights-based MEB
39 WHO and Global Health Cluster ndash Cash Task Team 2020 40 Cash Working Group Nigeria 2018
23
Minimum Expenditure Baskets Guidance Note | December 2020
MEB APPROACHES ndash CONSTRUCTION SUMMARYBox 13
HOW TO
Rights-based approach
Establish the food basket
Define a list of relevant and locally preferred and
available food items and their quantities The Sphere
Standards can be used as a reference
Establish the non-food basket
Define a list of essential non-food items relevant to the
population of interest and their quantities Services such
as education or transport can also be included The list is
usually put together sector by sector
Price the basket
Use current market prices for the food and non-food
items in the reference baskets to calculate the price of
the basket Use prices from markets relevant to the
population of interest
1
2
3
4
1
2
3
Expenditure-based approach
Prepare the expenditure data
Ensure the data is cleaned Compute expenditures by
combining cash and credit expenditures the value of
consumed own production and consumed assistance
for both food and non-food expenditures Compute
expenditures as per capita figures
Select the reference cohort
Identify households ldquojust able to meet their essential
needsrdquo using indicators such as FCS FCS-N housing or
others excluding households in extreme quantiles of
expenditure distribution or other criteria or
combination of criteria Check the sensitivity of the
results to the selection of reference cohort
Establish the food basket
Calculate mean (median) food expenditures by food
group or item Either stop here or ndash to obtain a refence
basket ndash estimate consumed quantities check the
calorie content of the resulting quantities and consider
scaling them to Sphere Standards Price the basket
using market prices or prices derived from the
household data
Establish the non-food basket
Calculate mean (median) non-food expenditures by
non-food group or item If item-level data and prices
are available it is possible to derive a non-food
reference basket using same methodology as for the
food basket otherwise the non-food basket will
comprise the expenditures at the group level If a
quick-fix solution is needed add the average household
non-food expenditure share to the food MEB
53 Summary and data needs for expenditurendashbased and rights-based approachesBox 13 summarizes the steps to follow in order to construct a
MEB using an expenditure-based or a rights-based approach
24
Minimum Expenditure Baskets Guidance Note | December 2020
Qualitative understanding
of essential needs for the
population of interest
Representative household
survey with detailed
expenditure module
List of ldquorights-basedrdquo needs
Price information
Focus group discussions with key informants or population
of interest
Literature review of existing information on the essential needs of
the population of interest
WFP essential needs assessment emergency food security
assessment or comprehensive food security and vulnerability
analysis or other representative pre-assistance baseline survey
National household budget surveys household income and
expenditure surveys living standard measurement surveys or
other large-scale household survey
Clusters Cash Working Group other interagency forum
Sectoral assessments other secondary information
Price data series covering the area of interest for relevant food
and non-food items and services from WFP (Dataviz41 has
up-to-date price information) or partners
Price indices from national statistical offices
Prices derived from household expenditure data where quantities
are also reported
Suggested sources Expe
ndit
urendash
base
d
Righ
tsndashb
ased
INFORMATION NEEDS AND SOURCESMEB APPROACHES
Box 14
HOW TO
Information need
TIP BOXWHAT IF DATA USINGA HOUSEHOLD ECONOMY APPROACH IS AVAILABLE
$Box 15
The household economy approach (HEA) developed by Save The Children is commonly used for analysing food security and
livelihoods It is based on understanding how households normally access income food and other itemsservices required
for survival established through a baseline analysis As part of the baseline the HEA defines livelihood zones where
households share similar strategies for obtaining food and income It also distinguishes households within these livelihood
zones in at least three (often four and sometimes more) wealth groups The HEA baseline quantifies the sources of food
and income and the expenditure patterns for each wealth group and livelihood zone
The information collected on expenditures can be used as a data source for calculating a MEB However due to the relative
nature of the wealth cut-off points used there is no set standard regarding which group should be the reference for the
MEB If HEA data is utilized it is important to understand how it was collected ndash the HEA is simply an analytical framework
not a set method of data collection Thus while HEAs are often conducted through qualitative methods (eg focus group
discussions) they may also be based on quantitative modules in household surveys The latter yields more rigorous
information however qualitative data can be used but should be cross-checked or triangulated with other sources
39 See VAM data portal at httpsdatavizvamwfporg
25
Minimum Expenditure Baskets Guidance Note | December 2020
54 Expenditure-based or rightsndashbased approach Pros and consThere are advantages and disadvantages to both types of
approach which should be kept in mind when constructing
the MEB
The expenditure-based approach has the advantage that it
directly reflects the actual demand of the population of interest
as it uses survey data to examine peoplersquos consumption
behaviour It is also fairly straightforward to carry out if good
survey data on the population is available One disadvantage is
that it can be difficult to put into practice when the population
of interest is generally poor (such as in a pre-assistance
refugee situation) because the number of households who can
constitute the reference cohort can be too small to analyse
Also care has to be taken when looking at expenditure patterns
only as the reference cohort may not always cover all of their
essential needs to a desired level (from a ldquorightsrdquo perspective)
For example the food patterns for those ldquojust able to meet
their essential needsrdquo may not always be very nutritionally
diverse as they are based purely on consumption behaviour42
In general the expenditure-based approach should not be applied
without good quality household expenditure data
TIP BOX ADVANTAGES AND DISADVANTAGES OFDIFFERENT APPROACHES TO ESTABLISHING MEBS
Box 16
Pros
Cons
Expenditure-based Rights-based
Straightforward to carry out if household data
is of good quality
Builds on actual consumption patterns of the
population of interest
Difficult to identify reference cohort if
everybody is poor
Survey data may not capture all essential needs
fully from a ldquorightsrdquo perspective
Survey data is not needed
Effective demand can be different from identified
needs leading to a MEB that does not reflect
actual demand and making comparison with
monitoring data tricky
Contains incentives to inflate sector-specific needs
The advantage of the rights-based approach is that
it can be used to construct a MEB without survey data
(although survey data is needed to monitor the MEB) One
disadvantage is that the effective demand of households
can look quite different from the basket that results from
this approach Another disadvantage is that particularly
when constructed in an interagency setting a rights-based
MEB can easily become an instrument for different partners
to compete for and secure funding There is a substantial
incentive to include excessively high sectoral needs if sector-
specific interventions are envisaged Finally if the MEB is
very detailed but the expenditure module in the household
surveys used to monitor peoplersquos expenditures against the
MEB is very crude comparison is difficult and therefore the
practical use of the MEB can be limited Many households
may fall below the MEB simply because of the discrepancy in
methods between the MEB and the monitoring data This is
similar to the issue previously discussed regarding the use of
national poverty lines
Box 16 summarizes the advantages and disadvantages of the
two approaches
42 A study conducted in Nepal showed that the food poverty line is well below the so-called ldquonutrient povertyrdquo line (see Geniez et al 2014)
26
Minimum Expenditure Baskets Guidance Note | December 2020
6 Arriving at a realistic and operationally relevant MEBRegardless of which processes and approaches are used to
construct the MEB it is crucial to arrive at a final result that
is a realistic picture of the cost of essential needs for the
population of interest rooted in actual consumption
behaviour This section looks at how approaches can be
combined to generate a hybrid MEB and how the result can be
ldquoreality checkedrdquo and validated
61 Combining approaches the hybrid MEBAs described in section 54 there are disadvantages to the
expenditure-based and the rights-based MEB approaches that
can affect the final MEB One way to overcome this challenge
may be to combine information from each approach in
a ldquohybridrdquo MEB This means making sure that the MEB is
consistent with the actual consumption behaviour of the
population of interest as found in expenditure data while
keeping the rights-based lens There is no one way to go about
this the method is subject to the availability of expenditure
data and other information on essential needs as well as the
objective of the MEB
When good quality expenditure data with a large enough
sample size is available for constructing the MEB it is good
practice to use the expenditure-based approach as a basis
for the analysis as far as possible If the expenditures of
the reference cohort are subsequently found not to reflect the
costs of covering certain essential needs for the population of
interest rights-based information should be used to reinforce
the MEB with a hybrid model If expenditure data is not
available and cannot be collected a rights-based MEB can be
constructed but should be cross-checked against any available
household-level information on consumption patterns
When starting with the construction ofan expenditure-based MEB
Did the household survey capture all essential needs or
are some not included in the data at all
If some needs are wholly overlooked consider using
rights-based information to capture them but ensure these
needs are actually in demand by the population of interest
and only missing because the survey did not capture them
Are the expenditures that are typically trickier to capture
well reflected and are the reference cohortrsquos expenditures
on them adequate from a rights-based perspective
For example if education expenditures are completely
inadequate for the reference cohort (and this is not because
the reference cohort selected is ldquotoo poorrdquo) consider using
rights-based information to capture them eg by using the
cost of school fees or school supplies like books or
uniforms
Be particularly careful with the inclusion of needs where the
supply of goods or services is far from adequate or may be
inexistent The MEB needs to ultimately reflect consumption
behaviour so adding goods or services that are not
available to the population of interest or not in demand
will lead to an unrealistic MEB
When starting with the construction ofrights-based MEB
Are the identified needs in line with the actual
consumption patterns of the population of interest
Check the reference baskets against any available
information on demand and consumption and adjust items
and quantities to reflect actual consumption patterns This
could be done using data on consumption shares by food
group and non-food group for example
Are there needs that people consider essential and choose
to spend resources on but are not captured by any sector
Check the reference baskets against any available
information on demand and consumption and adjust items
and quantities to reflect actual consumption patterns
The key to constructing a hybrid MEB lies in triangulating
information and asking the right questions during the
analysis When constructing a MEB consider the following
27
Minimum Expenditure Baskets Guidance Note | December 2020
Box 17 contains examples of hybrid MEBs constructed in different contexts
COUNTRYEXAMPLE
HYBRID MEBS IN URBAN SETTINGS IN KINSHASATHE DEMOCRATIC REPUBLIC OF THE CONGOAND FOR SYRIAN REFUGEES IN TURKEY
Box 17
For the MEB calculated as part of an urban assessment in Kinshasa43 a hybrid approach was chosen to deal with
hard-to-capture but essential expenditures such as health and education Health costs are often difficult to estimate as they
are not regular and when they do occur they often make up a large share of monthly expenditures The analysts decided to
estimate health costs through a rights-based approach instead of using expenditures from the survey Qualitative
information from key informants was used to define the cost of one doctorrsquos visit per year for each household member In
each commune the median cost was between CDF5000 and CDF6000 per visit this was represented in the MEB as
CDF500 per household member per month Over-the-counter medication was also included as part of health-related
expenditure through the addition of a per-capita expenditure of CDF1500 every two months sufficient for a course of
antimalarial drugs or antibiotics and simple medication such as painkillers or anti-inflammatory drugs
In Turkey expenditure and price data from different sources was used to assess update and adjust an existing
rights-based MEB44 for Syrian refugees living in the country A hybrid food basket was calculated using detailed information
on the consumption behaviour of Syrian refugees in Lebanon collected through itemized receipts from food assistance
e-cards The resulting food basket was triangulated with the less detailed information available from a household survey on
Syrian refugees in Turkey The results showed strong consistency between consumption behaviour of both groups
The resulting food reference basket for the MEB was then priced with official price statistics data and inserted into the
rights-based MEB Quantities of non-food items were kept as before but updated with current price data To ensure that
the MEB reflected consumption behaviour expenditure shares were triangulated with household data See table a
To value and update the MEB price data was required The official price statistics included higher quality items and brands
consumed more by the average Turkish population than by the poorer refugees To correct for this the difference between
the price of the MEB and the food expenditures of a non-poor cohort were assessed and a correction factor applied to
compensate for the overestimation of the updated MEB
Commodity
Table a Food reference basket ndash MEB for Syrian refugees in Turkey
Daily ration perperson in gram
Dailykilocalorie
Old referential food basketDaily ration perperson in gram
Dailykilocalorie
Revised Turkey food basket
150
200
50
20
30
40
20
8
30
30
5
0
0
0
0
540
684
186
29
65
137
0
28
116
265
0
0
0
0
0
100
50
0
70
0
50
30
50
50
25
5
250
50
30
5
Rice white medium grain
Bulghur wheat
Pasta
Egg whole chicken fresh
Poultry
Beans dried
Cucumber
Cheese canned
Sugar
Oil sunflower fortified
Salt iodised
Bread made from wheat
Yoghurt whole milk (leban)
Tomatoes red ripe
Tea black nutrients per 100ml of brewed tea
360
171
0
100
0
170
0
178
194
221
0
675
31
5
0
Total Kcal 2050 Total Kcal 2104
43 WFP et al 201844 WFP 2018
28
Minimum Expenditure Baskets Guidance Note | December 2020
62 Reality checks and validation with stakeholdersIn addition to asking the right questions of the data as
described in the previous section it is crucial to reality check
results when constructing the MEB This means understanding
whether the MEB provides a picture of the cost of living that
matches the reality on the ground
First of all it is important to check the MEB result with the
real circumstances of the population of interest Focus group
discussions andor key informant interviews can be held when
starting work on the MEB and after a result is obtained in
order to ensure that the MEB is a true reflection of needs and
priorities
The MEB figures can be compared with the national poverty
line ndash even if it is not advisable to use the poverty line directly
as the MEB it is good practice to check the MEB results against
it They can also be checked against any social assistance
transfer values provided in government programmes the
minimum wage or the casual labour rate or any other
information available about needs and cost of living For
instance if the MEB is much higher than what the wages
from one month of work for a typical household can buy
that could indicate that it needs adjustment and that some
of the analytical steps need to be revisited ndash as long as the
wage rate itself is reasonable The same goes for the poverty
line ndash if the two are very far apart it could be a sign that the
MEB analysis should be crosschecked Perhaps the reference
cohort was not adequately selected some sectoral needs were
overestimated or there is a large proportion of consumption of
own production has not been properly taken into account
Something that is often of particular interest is the nutritional
composition of the food part of the MEB As seen above MEB
construction typically starts from the Sphere requirement of
2100 kcalpersonday However since the MEB follows the
actual consumption behaviour of the population of interest
(especially when following an expenditure-based approach)
the resulting food basket reflects what households actually
eat which is not necessarily a nutrient adequate diet If the
basket is found to be very low in essential nutrients it could
be that the reference cohort was not well selected and a
wealthier cohort with a more balanced diet at the 2100 kcal
personday threshold might need to be identified45 However
selecting better-off households will not necessarily lead to a
more nutritionally balanced basket as food preferences are
influenced by a range of factors in addition to budget
Analytical tools to determine the cost of nutritious diets
include Cost of the Diet (CotD) developed by Save the Children
UK and used by WFP in the Fill the Nutrient Gap Analysis
CotD uses linear programming to establish the lowest cost
diet that can meet requirements for energy protein fat and
13 micronutrients for individuals in a population considering
age gender body weight physical activity level and whether
a woman is pregnant or breastfeeding CotD can be thought
of as the lowest cost of an optimal diet considering individual
requirements It is therefore useful in illustrating the needs
of vulnerable populations and their nutrient intake barriers
However it is important to keep in mind that a MEB food
basket may not deliver adequate nutrient intake when used
to set a transfer value for households even if aligned with
an optimal diet As noted above because of household
consumption choices and food allocation within households
having more money to spend may not necessarily lead
households to buy more nutritious food
MEBs should be first and foremost built on consumption
patterns that reflect actual behaviour A large difference in
cost between the MEB food basket and CoTD may hence
be driven by factors such as low availabilityhigh cost of
nutritious foods or household preferences The WFP technical
note on Fill the Nutrient Gap and minimum expenditure
baskets offers further insights into the complementarities
of the two analyses and how to use them on conjunction for
programming purposes46 When a MEB is operationalised
additional nutritional considerations could be necessary
It is important to check the MEB result with the real circumstances of the population of interest Focus group discussions andor key informant interviews can be held when starting work on the MEB and after a result is obtained in order to ensure that the MEB is a true reflection of needs and priorities
45 Note that the 2100 kcal Sphere Standard for daily diet is an estimate based on a population average Nutrient needs vary across the lifecycle It is also recommended that a food basket based on the 2100 kcal threshold should include a minimum of between four and five different food groups
46 Also see WFP 2020b
29
Minimum Expenditure Baskets Guidance Note | December 2020
COUNTRYEXAMPLE
TURKEY NON-FOODBASKET MEBCOMPOSITION VERSUSACTUAL CONSUMPTION
Box 18
In the original rights-based MEB constructed for the
Syrian refugee operation in Turkey 17 percent was
devoted to education expenditure The average
education expenditure share in the pre-assistance
expenditure data was under 2 percent with little
variation by household vulnerability status50 The
large expenditure share in the MEB reflects the
costs for transportation to schools in rural areas
where no buses are available and where the only
way for households to send children to school is to
hire private transport In order to provide for
childrenrsquos right to education the transport costs are
counted for in the MEB
Since the MEB was constructed to assure full access
to all rights the high education expenditure was
justified However a comparison of the theoretical
costs for basic needs as estimated by humanitarian
partners and the actual consumption choices of
households can reveal divergence Even if
households are assisted there is nothing to say that
they will actually start hiring private transport to get
their children to school ie the principal ldquoneedrdquo
identified by humanitarian actors will not necessary
translate into effective demand if the MEB is used as
a basis for transfer value calculations While an
important access problem has been identified other
complementary interventions will likely be needed
to address it
depending on the objective of a particular intervention and
the choices targeted households are likely to make regarding
food and nutrition once they receive a transfer Targeted
nutrition interventions may be needed such as providing
certain nutritious foods for specific groups (through in-kind
assistance or commodity vouchers) and social behavioural
change communication to nudge people towards making
better choices for health and nutrition47 Expenditure data can
be helpful to understand the consumption patterns of people
at different points of the wealth distribution Fill the Nutrient
Gap analysis also examines packages of blanket and targeted
household interventions to estimate the most cost-effective
way to address the nutrient requirements of different target
groups For further considerations including complementary
programming please consult the WFP interim guidance on
transfer values48
MEBs are often constructed in an interagency context such
as the Cash Working Group which helps facilitate dialogue
and validation from the beginning of the process However
sometimes not all clusters or key partners are engaged in such
forums which can limit the buy-in and understanding of the
MEB unless there is adequate consultation It is also essential
to consult government stakeholders and development
partners Endorsement by government counterparts could be
needed if there are existing government safety nets or policies
regarding minimum wages For example if the population of
interest for the MEB are refugees or IDPs and a transfer value
based on the MEB is higher than the social assistance provided
by the Government to the resident population this could be a
point of contention Development partners might also wonder
why a MEB is needed in addition to the national poverty line
Dialogue and validation of the final MEB with partners is
therefore vital49
47 The Fill the Nutrient Gap (FNG) analysis of which CotD is often part can help understand what programming might be needed and how interventions can be combined to improve dietary intake and reach food and nutrition objectives
48 WFP 2020c49 The Cash Learning Partnershiprsquos MEB Tip Sheet contains useful advice on the interagency processes around constructing a MEB Baizan and Klein 201950 Hobbs 2016 and WFP 2018
30
Minimum Expenditure Baskets Guidance Note | December 2020
Naturally the needs of a household increase with the size of
the household How can the different magnitude of needs
for households of different sizes be taken into account when
constructing the MEB
One simple approach is to calculate the per capita MEB
and simply scale it up for households of different sizes For
example if the MEB is constructed for a household of six and
equals USD 120 the per capita MEB would be USD 20 USD and
the MEB for a household of three people would be USD 60
However this proportional scaling ignores one important
factor while the needs of a household grow with each
additional member the increase may not be proportional
This is because some goods consumed within a household
such as food are ldquoprivateldquo in character ndash once a person has
consumed it no one else can consume the same ndash while other
goods such as housing are ldquocommonrdquo or ldquopublicrdquo meaning they
can be shared among household members Hence the needs
for housing space or electricity are not necessarily three times
higher for a household with three members than for a single-
person household This is called economies of scale Changes
in household composition can also influence how needs
grow with household size consider large households with
many children who do not have the same needs as adults
Economies of scale are particularly relevant in contexts where
shared goods constitute a major part of household essential
needs for example where rent payment is a large expense A
one-bedroom apartment may be necessary for a one-person
household but could also possibly house a family of three
who would then share the expenditure When in a context of
large economies of scale the MEB is adjusted to household
size by scaling up average per capita needs proportionally
to household size the resulting MEB will underestimate
the needs for small households and overestimate the
needs for large households by construction This is because
the per capita needs for small households are larger than
this simple scaling reflects This can have implications if the
per capita MEB is used to inform targeting or transfer value
calculations For instance if the needs of smaller households
are underestimated they are more likely to be miscategorized
as being able to meet their essential needs and might therefore
not receive the assistance they require
7 Accounting for household composition and economies of scale
Expenditures
Household sizeno economies of scale expenditures proportional to household sizeeconomies of scale expenditures non-proportional to household size
1 2 3 4 5 6 7 8 9 10
EXPENDITURES PER CAPITA
Figure 3 Economies of scale and expenditures per capita ndash illustration of the concept
31
Minimum Expenditure Baskets Guidance Note | December 2020
In other contexts economies of scale might be smaller
because of the higher relative importance of ldquoprivaterdquo goods
such as food and certain non-food items (for example soap)
or if shared costs such as shelter are not prominent How
household size is catered for in the MEB ultimately depends
on context and how needs are related to household size
Some suggested steps to account for economies of scale and
household composition are listed below
When examining how to account for different household
sizes in the MEB start by ascertaining whether economies
of scale exist and to which extent51 Figure 3 provides a
hypothetical illustration of two extreme cases no economies
of scale at all and strong economies of scale If there are no or
little economies of scale the per capita expenditures will be
very similar across household sizes while they will decrease
by household size if economies of scale are present52
Plotting per capita expenditures against household size
helps enable for this type of examinations It can be useful
to further disaggregate the analysis into different categories
(for instance food non-food or shelter expenditures per
capita) to understand which expenditures might be driving the
economies of scale if present
Box 19 illustrates two different country examples
expenditures by household size for Syrian refugees in
Lebanon and for vulnerable populations in Coxrsquos Bazar
Bangladesh In Lebanon where shelter plays an important
role household expenditures double only at a household size
of 5 and they triple at a household size of 11
COUNTRYEXAMPLE
ECONOMIES OF SCALE INLEBANON AND COXrsquoS BAZAR
Box 19
Figure a shows expenditures by household size compared to one-person households For Syrian refugees in Lebanon
average expenditure doubles only when the household size reaches five and it takes 11 members to triple the expenditures
of a one-person household The economies of scale are therefore large primarily due to the importance of shelter costs for
the refugees
In Coxrsquos Bazar in contrast total expenditures grow almost proportionally with household size (double at a two-person
household triple at a three-person household) Slight economies of scale can be seen for food For non-food expenditures
larger households even spent more per person From this data the economies of scale seem to be small
Figure a Increase in household expenditure by household size comparedto one-person households
Multiplicationfactor
Household sizeHousehold size
100
90
80
70
60
50
40
30
20
10
Coxrsquos Bazar (Bangladesh)Lebanon
1 2 3 4 5 6 7 8 9 10 11
Total Food Non-food
1 2 3 4 5 6 7 8 9 10 11
Note Figure based on authorsrsquo calculations Data from the Vulnerability Assessment of Syrian Refugees in Lebanon (VaSyr) 2017
and the Refugee influx Emergency Vulnerability Assessment (REVA II) 2019
51 Expenditure data is required to perform this analysis If no information on expenditure exists information on how needs change with household size can be collected through qualitative means such as focus group discussions or key informant interviews
52 Theoretically it is possible to also analyse expenditures by household composition but sample sizes rarely allow for such detailed disaggregation
32
Minimum Expenditure Baskets Guidance Note | December 2020
If the analysis reveals small economies of scale or none at all it is reasonable to use a per capita approach to scale up the MEB proportional to household size
Even for food strong economies of scale can be detected
which could be a result of large households being able to
buy food in bulk at a lower price However in Coxrsquos Bazar
where shelter and other shareable non-food goods are of less
importance household expenditures are close to proportional
to household size
If the analysis reveals small economies of scale or none at all
it is reasonable to use a per capita approach to scale up the
MEB proportional to household size If significant economies
of scale are present it is important to think about how to
take this into account when constructing the MEB Here are
some suggestions
One possible solution (in the expenditure-based
approach) is to disaggregate (or re-select see below)
the reference cohort for each household size sub-
sample and using the expenditures for each of these
cohorts construct specific MEBs for each household
size53 This approach takes into account economies of
scale by looking directly at the specific needs of different
size households but only reflects average differences
in household composition within each household size
The approach will most likely suffer from very small
sample sizes once analysis needs to be performed by
household size If this is the case household sizes could
be grouped into categories so that the analysis uses sub-
samples eg for household sizes 1ndash2 3ndash5 and 6ndash8 etc
or other groupings meaningful for the context When
following this approach bear in mind that if the reference
cohort is selected based on expenditure distribution
characteristics such as the removal of extreme deciles or
quintiles this procedure of removal of quintiles or deciles
needs to be repeated within each household size (or
household size group) Otherwise if there are economies
of scale for consumption there is a risk of skewing the
sample against the smallest and largest households
because their per-capita expenditures will be at the
extreme ends of the expenditure distribution
Another solution is to divide the MEB content into
ldquoprivaterdquo (non-shared) and ldquopublicrdquo (shared) consumption
For example food could be non-shared and rent and
fuel shared Examine the MEB expenditures for the
non-shared and shared goods for an average sized
household (or for household sizes around the average
for instance 4ndash6 members in order to leverage a larger
share of the sample) The non-shared value can then be
scaled proportionally to household size while the shared
value is held constant across household sizes This way
the resulting MEB consists of a lsquoflatrsquo and a proportional
element54 This is a relatively crude but intuitive way to
approximate economies of scale Figure 4 provides a
simple illustration of this approach
In the literature on poverty the most common solution
used to adjust for economies of scale and difference
in household composition is to use adult equivalents
instead of per capita numbers These equivalence scales
assign an ldquoadult equivalent numberrdquo to each household
depending on its size and composition taking into
account economies of scale as well as the different needs
of children and adults ie household composition For
example the first adult in the household is counted
as 1 and each additional adult as for example 07 A
child under 15 is counted as a fraction of an adult (eg
05) The effective adult equivalent household size is
then the sum of these adult-equivalent fractions55 Next
total household expenditures are divided by the adult
equivalent household size The MEB is then calculated
using these adjusted per-adult-equivalent expenditures
While this is not necessarily a complicated approach
from an analytical point of view equivalence scales can
53 See Lanjouw (1998) on the construction of poverty lines specific to household size (and composition)53 Alternatively the flat element can also be lsquosemi-flatrsquo and set according to household size groups ndashby examining shared costs and applying the same flat value within eg household size groups 1-2 3-5 6-8 or other
groupings as dictated by the context 53 One common equivalence scale is the OECD scale it assigns the weight 1 to the household head 07 to all additional adults and 05 to all children A household with five people say two adults and three children
consists of 32 adult equivalents (1+07+05+05+05) This is a common scale used in many developing and developed countries Another common scale is to give weight 1 to each adult and different weights to children depending on their age For the official poverty line in Zambia the following weights are given to children 0ndash3 years 036 4ndash6 years 062 7ndash9 years 076 and 10ndash12 years 078
33
Minimum Expenditure Baskets Guidance Note | December 2020
MEB - COMBINING FLAT ANDPROPORTIONAL ELEMENTS -ILLUSTRATION
MEB value
Household size
1 2 3 4 5 6 7 8 9
140
120
100
80
60
40
20
0
Proportional element - non-shared part of MEB
Flat element - shared part of MEB
MEB value per capita
Figure 4 Combining flat and proportional elements in the MEB
prove challenging when operationalising the MEB If
equivalence scales are used in constructing the MEB they
will also need to be applied when measuring household
expenditures compared with the MEB for gap analysis
against the MEB and in monitoring Translating the
concept of equivalence scaling into operational decision
making may therefore prove tricky Additionally results
can be quite sensitive to the choice of equivalence scales
so selecting appropriate scales is important yet often not
straightforward and a range of different scales exist56 In
some countries country-specific equivalence scales may
have been devised for the purpose of the calculation of
the national poverty line
No matter the approach the recommendation is always
to leverage data analysis as much as possible in order
to understand how needs evolve with household size
(and possibly composition) while keeping in mind that
the final MEB needs to be operationally relevant
Particularly in the (common) cases where MEBs are
used to calculate household transfer values it is worth
considering what level of analytical granularity can
feasibly be turned into programmatic action In some
cases it may not be operationally possible to handle
different per-capita size transfers for differently sized
households and the extra effort of achieving accurate
MEB figures by household size may not be worth it
The same general recommendation as for all aspects
of MEB construction also applies here the final result
should be realistic a fair depiction of needs and an
operationally relevant product
56 See for instance httpwwwoecdorgeconomygrowthOECD-Note-EquivalenceScalespdf
34
Minimum Expenditure Baskets Guidance Note | December 2020
A SMEB can be expenditure-based or rights-based or a hybrid of the two approaches depending on data availability and programmatic requirements
The SMEB is the absolute minimum amount required to maintain existence and cover lifesaving needs which could involve the deprivation of certain human rights
A survival minimum expenditure basket (SMEB) is often
constructed alongside a MEB While the MEB is defined as
what a household requires in order to meet their essential
needs on a regular or seasonal basis and its average cost the
SMEB is the absolute minimum amount required to maintain
existence and cover lifesaving needs which could involve the
deprivation of certain human rights However the concepts
of SMEB and MEB have not always been used consistently
by the humanitarian community and are sometimes used
interchangeably It is therefore important to be clear from the
outset of the analysis whether a MEB or a SMEB is the goal
A SMEB can serve at least two purposes First together with
the MEB it can be used to classify households into different
categories of economic capacity to meet their needs whereby
households whose expenditures fall below the SMEB have
highly insufficient economic capacity households between the
SMEB and the MEB have insufficient economic capacity and
households above the MEB have sufficient economic capacity
This information can then be used for profiling people in need
prioritizing beneficiaries or monitoring Second the SMEB
can inform programmatic decisions such as transfer values in
situations where immediate lifesaving assistance is required
The approaches presented here follow the MEB methods
adjusted to suit the different purpose of the SMEB
Accordingly a SMEB can be expenditure-based or rights-
based or a hybrid of the two approaches depending on data
availability and programmatic requirements
8 How to construct a SMEBExpenditure-based approach toconstructing a SMEBThe calculation of an expenditure-based SMEB is closely aligned
with the literature on how to estimate national poverty lines
While the MEB corresponds to an ldquoupperrdquo poverty line a ldquolowerrdquo
extreme or austere poverty line is often defined by taking the
food part of a MEB and adding this to the non-food needs
regarded as the essential minimum for household survival57
But how are survival non-food needs defined based on
expenditure data When people receive assistance it is
sometimes observed that households sell part of their food
rations to cover some non-food items These households forgo
some of the required food intake in order to cover what they
regard as survival non-food needs Using expenditure data to
construct a SMEB a similar idea is explored to calculate the
SMEB analysts identify those households whose total food AND
non-food expenditures are approximately equal to the MEB food
basket amount only In order to access non-food items these
households will compromise their food intake to some extent
because their total expenditures would only be enough to cover
their essential food requirements ie the food MEB anything
spent on non-food items means that they are not meeting their
essential food requirements It is therefore fair to assume that
the amount they choose to spend on non-food items must
be regarded by the households as absolutely necessary The
non-food expenditures of these households can therefore be
considered as the survival non-food needs The SMEB is then
calculated by adding these survival non-food expenditures
to the food MEB This SMEB allows households to meet their
essential food needs and their survival non-food consumption
Note that this approach requires a food MEB figure (either
already available or calculated as part of the SMEB analysis)
57 See Lanjouw 1998 and Haughton and Khandker 2009
35
Minimum Expenditure Baskets Guidance Note | December 2020
The steps for constructing an expenditure-based SMEB are
similar to those taken to construct a MEB with the following
additional considerations
1 Prepare expenditure data the expenditure data source can
be the same as that used for the MEB
2 Select the reference cohort this step is different The cohort
is selected by computing total household expenditures
and comparing them to the food MEB Households with
total expenditures equal to (or in an interval around) the
food MEB are selected as the SMEB reference cohort
3 Establish food basket and 4) Establish non-food basket
Using the SMEB reference cohort start by examining
how much these households spend on non-food items
Add this value to the MEB food value to arrive at the total
value of the SMEB To establish a food and non-food
basket there are two options i) use the MEB food basket
as the SMEB food basket and the non-food expenditures
of the SMEB reference cohort as the non-food basket
or ii) look at a third cohort of households namely those
whose total expenditures are around the just established
total SMEB level examine their food and non-food
expenditures and unpack those into food and non-food
baskets While both options will provide the same overall
value of the SMEB they will differ in composition and the
share of foodnon-food expenditures
Annex 2 provides an illustration of this method of constructing
a SMEB
Rights-based approach to constructing a SMEBThe rights-based approach to constructing a SMEB closely
follows the rights-based approach to constructing a MEB The
main difference is that needs and the items and quantities
included should be restricted to what is regarded as absolutely
necessary for survival ndash which can be challenging to define
This applies to both the food basket and the non-food
basket The MEB can be a starting point if there is one or
the Sphere Standards Sometimes rights-based SMEBs have
been constructed based on a MEB but with lower quantities
for certain items or by keeping some needs while removing
others
Hybrid SMEBs and reality checking resultsAs with MEBs it can be advantageous to combine the
expenditure-based and rights-based approaches to create
a hybrid SMEB The guiding principles are the same as for
the MEB with the difference that the resulting SMEB should
continue to contain nothing but the minimum required for
survival
The same logic applies to the ldquoreality checkrdquo of the SMEB
results as for the MEB it is crucial to ensure that the end
result is realistic and operationally relevant bearing in mind
the conceptual difference between the MEB and the SMEB It
is important to consult the population of interest as much as
possible to understand their views on what constitutes the
bare minimum needed by households to maintain existence
and cover lifesaving needs
COUNTRYEXAMPLE
RIGHTS-BASED SMEBS Box 20
In Lebanon health and education are excluded
from the rights-based SMEB while other needs are
covered with smaller amounts than in the MEB For
example the SMEB has a less diverse food basket
than the MEB58
In Syria the SMEB developed for the northern part
of the country includes food kerosene hygiene
products water and a small amount to cover other
survival goods Rent and utilities are not covered59
58 El Koury and Hajal 201659 Cash Based Responses Technical Working Group Syria 2014
36
Minimum Expenditure Baskets Guidance Note | December 2020
COUNTRYEXAMPLE
HYBRID SMEBs Box 21
For the MEB review in Lebanon for Syrian refugees60 a hybrid SMEB approach was chosen First an expenditure-based
SMEB was used calculating the non-food expenditures of households whose total expenditures equalled the food MEB
and adding this to the food MEB This resulted in very low expenditures on shelter (SMEB A) Due to the importance of
shelter in urban settings a second hybrid version was established calculating the non-food expenditures of households
whose total expenditures equalled the sum of the food MEB plus a rights-based value of a tent as survival shelter the cost
of which came from a rights-based SMEB (SMEB B)
Cohort HH size 4ndash6quint 2ndash4 acceptable FCS
n=923
Cohort total expenditure= food MEB
n=923210
Cohort total expenditure= food MEB + tent value
n=923210
SMEB Afood + survivalnon-food
Hybrid SMEB
437
83
40
93
20
16
29
19
314
1033
437
43
18
37
06
04
17
60
621
437
47
24
42
11
06
20
162
750
Food
Utilities (water gas fuel electricity)
Non-food items (hygiene clothing)
Health
Education
Transport
Communication
Other expenditures
Shelter
Total (USD)
Table a Hybrid SMEB for Syrian refugees
SMEB Bfood + survivalnon-food amp tent
In the Kinshasa urban assessment61 a SMEB was established in addition to the MEB comprising a basket of the most
essential items based on expenditure data used for the MEB For the food SMEB a less diverse diet was established by
excluding certain food items from the food MEB and rescaling the resulting basket to 2100 kcal For the non-food
component the only items included were those that were seen as critical to attaining the most basic standards for safety
food preparation water sanitation and hygiene These consisted of water cooking fuel hygiene products and lighting The
value for these items in the SMEB was derived from the median expenditures of the non-poor cohort
Expenditure-basedMEB
Expenditure-basedSMEB
60 Hohfeld et al 2020 61 WFP et al 2018
37
Minimum Expenditure Baskets Guidance Note | December 2020
91 Adjustment for seasonal or regional price differencesIf the MEB will only be used in one area where prices are
relatively homogenous it is often not necessary to adjust for
regional price differences However if the MEB is intended
for use across different urbanperi-urban andor rural
areas throughout the country it could be vital to adjust for
differences This means that the MEB can be priced differently
for different regions or rural or urbanperi-urban areas (or any
other division of areas that makes sense in relation to price
behaviour) There are a few approaches for this
Price the MEB based on available price data for different
regions or urbanrural areas For the food reference
basket this is most often possible using WFP food prices
or other similar price time series For non-food items
including housing utilities and services this can be more
challenging and may rely on price data collection by
different partners or require new data collection
For some countries price data provided by the national
statistical office is useful In the case of Turkey regional
purchasing power parity indices were used to provide
price estimates for components of the MEB for which
direct price information was not available
Use approximations from expenditure data If the
household survey has sufficient regional coverage the
expenditure levels in different regions can be explored
using the cohort of households just above the poverty
line Care should be taken in using this method
particularly if the sample size by region is very small
9 Additional considerations when constructing MEBs
92 Needs that vary by season or areaIn many countries where WFP works household needs change
with the seasons For instance in Turkey where winters are
cold households have additional needs for heating and warm
clothes to survive In other contexts there are significant
differences in needs between lean and rainy seasons These
changing needs could be a reason to construct different MEB
reference baskets to use at different times during the year or
to design seasonal top-ups In the case of items needed for cold
winters this is often referred to as ldquowinterizationrdquo
While this does not influence the approach used to construct
the MEB it does mean that analysts need to consider when
the data used in its construction was collected and whether
this influences the resulting MEB These considerations also
matter when using the MEB for monitoring if a monitoring
expenditure survey is used to analyse whether peoplersquos
expenditures are above or below the MEB threshold but
the survey is undertaken when prices are high or when
winters are cold if the MEB is not adjusted the results will
probably show a decrease in the percentage of people whose
expenditures are below the MEB as households have higher
needs andor are confronted with higher prices and thus
have higher expenditures without in reality being better off
In Turkey it was estimated that household needs during the
winter would result in a 48 percent increase in minimum
expenditures
In other cases different baskets might be necessary
for different areas of the country eg rural and urban
areas While the MEB should be constructed for a relatively
homogenous population it may sometimes be desirable to
construct a MEB covering all or most of a country where
consumption patterns vary substantially In this case it is
worth considering whether (some elements of) the MEB should
be different between areas Again the selected approach to
construct the MEB should not change but analysts need to
check where the data used in its construction was collected
and whether consumption patterns are very different between
different regionsareas For example in the case of Somalia
the main cereal consumed varies significantly between the
north and the south of the country so the MEB uses different
main cereals in the food reference basket according to region
While the MEB should be constructed for a relatively homogenous population it may sometimes be desirable to construct a MEB covering all or most of a country where consumption patterns vary substantially
38
Minimum Expenditure Baskets Guidance Note | December 2020
Constructing a MEB can be challenging in a sudden onset
emergency or if data is scarce or unavailable Below are some
ideas on how this can be resolved However from a ldquodo no
harmrdquo perspective it is important to emphasize that proxies
should only be used in the interim when no other solutions are
available
Use the national MEB or MEB reference basket If survey
data is not directly available and if the population of
interest is part of and similar to the overall population of
the country the national MEB or MEB reference basket
used for the national poverty line can be used if available
Bear in mind however that this basket should be used on
the condition that it corresponds to data that WFP collects
or has access to through partners or the Government to
ensure that monitoring can be conducted against the MEB
In its most basic form a MEB essentially only requires an
approximate value for the food basket and an estimate
of the average expenditure share that households use
on food Even if no relevant survey data is available this
information should be available to a country office or can
rapidly be collected or approximated
Consider using the minimum wage as a proxy Bear in
mind that while the MEB captures household-level needs
the minimum wage is individual-level income so an
assessment of how many minimum wages are needed per
household depending on the household size is required
It is also advisable to find out how the minimum wage has
been constructed
Ultimately a MEB is a good preparedness measure and should
be constructed before an emergency While both prices and
availability will be affected by an emergency it is still likely to
provide a useful starting point
11 Monitoring and updating the MEB111 Monitoring the cost of the MEBTo be operationally useful the MEB must be tracked and
updated over time to account for price changes If inflation is
high this might have to be done every month if it is low as
little as once a year could be sufficient This should be planned
for when the MEB is constructed to ensure that the costs of the
MEB components can be updated
There are different ways to update the MEB with price changes
If a reference basket is adequately defined (for food
and for non-food items) and prices are collected for the
individual items in the basket by WFP or its partners the
MEB can be priced anew using the updated prices for
each item and multiplying them by the quantities in the
reference basket
A simple solution is to adjust the MEB using the
nationalsub-national CPI or its components This
simply involves updating the cost of the MEB with
the increase (or decrease) in the CPI for the period
in question However in some contexts CPIs are not
updated or relevant for the target population Urban
areas are often over-represented in the national CPI on
the other hand prices and costs faced by for example
displaced populations can be very different from national
price levels In contexts of poverty where food constitutes
a large part of household expenditures the evolution of
food and fuel prices is central when it comes to capturing
price changes
If a CPI does not exist or is not considered applicable
a price index for key consumption items can be
constructed using price data collection for food items
and basic non-food items conducted by WFP andor
other agencies this can then be used to update the cost
of the MEB In contexts where shelter is a major part of
household expenditures changes in shelter costs should
also be captured
10 How to find a proxy for a MEB when data or time is insufficient
39
Minimum Expenditure Baskets Guidance Note | December 2020
112 When to construct a new MEBThe composition of MEB reflects consumption patterns
It is recommended as much as possible keeping the MEB
composition constant and only monitor how cost changes
over time However when there is reason to believe that
consumption patterns of the population for whom the MEB
is constructed has significantly changed it is time to review
its composition and possibly reconstruct the MEB to reflect
these changes
What could suggest such consumption changes have
occurred The figure to the right summarises some typical
events that could result in a significant change in household
consumption Shocks eg a natural disaster might create
additional needs if livelihoods are disrupted or living
conditions are altered Significant changes to the prices of
key consumption items can also alter consumption pattens
insofar it pushes households to substitute certain items
for other items (be aware however that reconstructing
the MEB would only be advisable if the substitution is not
just temporary) Population changes such as an influx of
displaced people or other events that changes the population Figure 5 Possible triggers for MEB composition review
Has a shock occured creating
different or additional needs
Have costs changed significantly
between key consumption items so
that households have substituted
consumption patterns
Has there been a change in
population - eg a displacement
Has the supply side or service
provision changed leading to a
change in household consumption
Shock
Substitution
Population
Supply
composition in the area that the MEB is constructed for
could also lead to a review Finally if supply of essential
goods and services changes this may also shift household
consumption eg if health services are made free of charge
and no longer require households to pay for them
40
Minimum Expenditure Baskets Guidance Note | December 2020
CaLP The Cash Learning Partnership
CBT cash-based transfers
CotD Cost of the Diet [approach]
CPI consumer price index
FCN-N food consumption score ndash nutrition
FCS food consumption score
FNG Fill the Nutrient Gap
HEA household economy approach
LSMS Living standard measurement survey
MEB minimum expenditure basket
OCHA United Nations Office for the Coordination of Humanitarian Affairs
REVA II 2019 Refugee Influx Emergency Vulnerability Analysis
SDG Sustainable Development Goal
SMEB survival minimum expenditure basket
UNHCR Office of the United Nations High Commissioner for Refugees
VAM Vulnerability Analysis and Mapping
WFP World Food Programme
WHO World Health Organization
Abbreviations
41
Minimum Expenditure Baskets Guidance Note | December 2020
Deaton and Grosh 2000 ldquoConsumptionrdquo in Designing Household Survey Questionnaires for Developing Countries Lessons from Ten
Year of LSMS Experience httpsscholarprincetonedudeatonpublicationsconsumption
Deaton and Zaidi 2002 Guidelines for Constructing Consumption Aggregates for Welfare Analysis LSMS Working Paper no 135
httpsopenknowledgeworldbankorghandle1098614101
The Cash Learning Partnership (CaLP) Glossary of terminology for cash and voucher assistance
httpswwwcalpnetworkorglearning-toolsglossary-of-terms
Cash Based Responses Technical Working Group Syria 2014 Northern Syria Survival Minimum Expenditure Basket Guidance
Document httpswwwhumanitarianresponseinfositeswwwhumanitarianresponseinfofilesdocumentsfilesnorthern_
syria_smeb_guidance_document_dec_2014pdf
Cash Working Group Nigeria 2018 Minimum Expenditure Basket for North East Nigeria ndash Justification and recommendations Draft
report httpswwwhumanitarianresponseinfositeswwwhumanitarianresponseinfofilesdocumentsfilesmeb_justification_
guidelinespdf
Baizan and Klein 2019 Minimum Expenditure Basket (MEB) Decision Making Tools The Cash Learning Partnership httpswww
calpnetworkorgpublicationminimum-expenditure-basket-meb-decision-making-tools-2
El Koury and Hajal 2016 MEB and SMEB revision Community Consultation Lebanon Cash Consortium httpsreliefwebintsites
reliefwebintfilesresourcessmeb-fgd-report-final-1pdf
Geniez Mathiassen de Pee Grede and Rose 2014 ldquoIntegrating food poverty and minimum cost diet methods into a single
framework A case study using a Nepalese household expenditure surveyrdquo in Food and Nutrition Bulletin vol 35 no 2 https
journalssagepubcomdoi101177156482651403500201
Haughton and Khandker 2009 Handbook on Inequality and Poverty The World Bank httpsopenknowledgeworldbankorg
handle1098611985
Hobbs 2016 MEBSMEB calculation for Syrians living in Turkey Report commissioned by the Cash-Based Interventions Technical
Working Group in Turkey httpsdata2unhcrorgendocumentsdownload57031
Hohfeld Papavero Sandstrom Dalbai and Renk 2020 Minimum Expenditure Basket for Syrian Refugees in Lebanon ndash Rights-based
versus Expenditure Based Approaches WFP httpsreliefwebintsitesreliefwebintfilesresources76229pdf
Inter-Agency Network for Education in Emergencies (INEE) Minimum Standards for Education Handbook Preparedness Response
Recovery httpsineeorgstandards
Jolliff and Prydz 2016 Estimating International Poverty Lines from Comparable National Thresholds World Bank Policy Research
Paper 7606 httpsopenknowledgeworldbankorgbitstreamhandle1098624148Estimating0int00national0thresholdspdf
Lanjouw 1998 Demystifying Poverty Lines World Bank
Ravallion 1994 ldquoPoverty Comparisonsrdquo in Fundamentals of Pure and Applied Economics 56
Republic of Zambia Central Statistical Office 2016 2015 Living Conditions Monitoring Survey (LCMS) Report httpswwwzamstats
govzmphocadownloadLiving_Conditions201520Living20Conditions20Monitoring20Survey20Reportpdf
Save the Children UK 2018 Basic Needs Assessment Guidance and Toolbox Part I Background and Concepts httpsreliefwebint
reportworldbasic-needs-assessment-guidance-and-toolbox
Sphere Standards Handbook Humanitarian Charter and Minimum Standards in Humanitarian Response 2018 edition httpswww
spherestandardsorghandbook
UNHCR CaLP Danish Refugee Council OCHA Oxfam Save the Children and WFP 2015 Operational Guidance and Toolkit for
Multipurpose Cash Grants httpswwwcalpnetworkorgwp-contentuploads202001operational-guidance-and-toolkit-for-
multipurpose-cash-grants-webpdf
References
42
Minimum Expenditure Baskets Guidance Note | December 2020
WFP 2004 Sampling Guidelines for Vulnerability Analysis Thematic guidance httpsdocumentswfporgstellentgroupspublic
documentsmanual_guide_procedwfp197270pdf
WFP 2008 Food Consumption Analysis Calculation and use of the Food Consumption Score in food security analysis https
documentswfporgstellentgroupspublicdocumentsmanual_guide_procedwfp197216pdf
WFP 2015 Food Consumption Score Nutritional Analysis (FCS-N) Guidelines httpswwwwfporgpublicationsfood-consumption-
score-nutritional-quality-analysis-fcs-n-technical-guidance-note
WFP 2018 Revising the Food Basket and Minimum Expenditure Basket Analysis to calculate a realistic cost of living for refugees in
Turkey httpsreliefwebintreportturkeyrevising-food-basket-minimum-expenditure-basket-analysis-calculate-realistic-cost
WFP 2019 Refugee influx Emergency Vulnerability Assessment ndash Coxrsquos Bazar Bangladesh httpsreliefwebintsitesreliefwebintfiles
resourcesWFP-0000106095pdf
WFP 2020a Essential Needs Assessment Guidance note httpswwwwfporgpublicationsessential-needs-guidelines-july-2018
WFP 2020b Technical Note Fill the Nutrient Gap and Minimum Expenditure Basket An explanation of approaches and identification of
synergies httpsdocswfporgapidocumentsWFP-0000116644download
WFP 2020c Setting the transfer value for CBT interventions Transfer Value Interim Guidance httpsdocswfporgapi
documentsWFP-0000117963download
WFP global Food Security Cluster and Food Security Cluster for the Democratic Republic of the Congo 2018 Adapting to an Urban
World Urban Essential Needs Assessment in the five communes of Kimbanseke Kinsenso Makala Nrsquosele and Selambao (Kinshasa)
httpswwwwfporgpublicationsdemocratic-republic-congo-urban-essential-needs-assessment-five-communes-kimbanseke-
kinsenso
World Health Organisation and Global Health Cluster ndash Cash Task Team 2020 Technical Note on the Inclusion of Health
Expenditures in the Minimum Expenditure Basket and Subsequent Multi-purpose Cash Transfer httpswwwcalpnetworkorg
publicationinclusion-of-health-expenditures-in-the-meb
43
Minimum Expenditure Baskets Guidance Note | December 2020
Survivalnon-foodexpenditure
TOTALEXPENDITURE
FOODEXPENDITURE
MEBnon-foodexpenditure
EXPE
ND
ITU
RE
CONSUMPTION
SMEBAusterepoverty line
Essential foodneeds (MEB)
Acceptable food consumption(based on FCS)
Food expenditure for HHwith tot exp at essential
food needs (MEB)
Analysts should always ensure that the expenditure data is properly cleaned and outliers removed and that it is converted into
the same recall period (food and non-food items usually have different recall periods)
Expenditures should be calculated into per capita figures (eg by dividing total household expenditures by household size) in
order to make them immediately comparable across households (or per adult equivalent see section 7 on how to account for
economies of scale and household composition)
Before starting the MEB analysis it is highly recommended to carry out some simple descriptive analysis of the expenditure
data in order to understand it Analyse the mean and median expenditures for the sample This will help understand the
distribution of the expenditures and detect possible issues While the median is more robust to outliers if a large part of the
sample has 0 expenditures on a particular item the median could be 0 and may therefore not be the best estimate of the need
In this case the mean may be preferable A frequency analysis of non-zero expenditures by groupitem can also be helpful in
understanding whether certain expenditures are infrequent or lumpy
Annex 1 - Good practice when analysing expenditure data
Figure based on Lanjouw 1998 Demystifying poverty lines and World Bank and Ravallion 1994 ldquoPoverty comparisonsrdquo in
Fundamentals of Pure and Applied Economics 56
Annex 2 - The expenditure-based SMEB ndash an illustration

6
Minimum Expenditure Baskets Guidance Note | December 2020
needs that are inherently irregular large and unpredictable
such as health needs This is also examined in the sections on
MEB construction
There are different approaches to establishing a MEB
As the World Bankrsquos Handbook for Poverty and Inequality
explains7 the typical starting point for establishing a MEB is
to estimate the cost of acquiring enough food to meet energy
requirements usually 2100 calories per person per day as
per the Sphere Standard Yet the cost of 2100 calories varies
with the diet of households which typically depends on their
economic status The cost of other essential non-food needs
is then added There are two approaches to establishing
which food and non-food items should be in the MEB an
expenditure-based approach that focuses on effective
demand and a rights-based approach based on assessed
needs While the expenditure-based approach is usually used
to construct national poverty lines the rights-based approach
is the principal method followed in the operational guidance
for multipurpose cash grants developed for humanitarian
purposes8 A combination of these approaches a hybrid
approach can also be used and is often recommended This
guidance describes each approach
The construction of a MEB is always somewhat arbitrary
However a MEB is constructed choices need to be made along
the way The objective of the MEB can influence how best to
approach its construction The choice of the group of people
whose effective demand will be examined ndash the ldquoaveragerdquo
households ndash is another important influencing factor This
guidance provides direction on how to make these choices but
analysts will always be required to exercise judgement
A MEB is not equivalent to a transfer value A transfer
value is understood as the monetary value transferred from
governments or organizations such as WFP to households
in order to support the latter in meeting their needs The
value of the MEB is not the same as the value that should
be transferred to households but the MEB can be a critical
component when determining transfer values Most
households can rely on their own resources to meet at least
some of their needs so the transfer value will usually be
less than the value of the MEB covering the gap between
householdsrsquo own resources other assistance received and
the MEB The distinction between the MEB and the transfer
value is also important because the MEB remains the same
regardless of assistance and funding constraints while the
transfer value could be impacted by these factors9
When using the MEB to monitor impacts of an
intervention or programme the MEB should not be
changed over time The threshold should only be adjusted
for price changes or when any major changes in context and
households needs occur that would require the construction
of a new MEB
2 Why have a MEBThe MEB has a range of applications In humanitarian
and development programming the MEB can support
household profiling by identifying characteristics of those
who cannot meet their essential needs10 and support
decisions on transfer value amounts for food and non-
food needs For partnerships the MEB can support multi-
sector coordination and programming with government
partner organisations and donors In market and supply
analysis the MEB can help inform which goods and services
to include in a Supply Analysis by showing which essential
needs households cover through the market Finally in
monitoring the MEB can assist monitoring of immediate
and longer-term outcomes through analysis of expenditure
trends against the MEB and help establish a basket against
which to monitor market prices and the cost of living
7 Ibid8 UNHCR et al 20159 For further discussion on considerations when setting a transfer value see WFP 2020c 10 For one possible application see WFP 2020a
A hybrid approach to constructing the MEB combines the expenditure-based approach and the rights-based approach and is often recommended
7
Minimum Expenditure Baskets Guidance Note | December 2020
THE MEB TO-DO LIST DEPENDING ON CONTEXTALSO CONSIDER
Identify key partners and stakeholders and decide on objectives and process
Construct the food basket
Construct the non-food basket
Reality check results and validate with stakeholders
Determine the analytical starting point (eg examine national poverty lines set the population of interest check what data is available) and decide on approach
Accounting for household size and composition
Adapting the MEB to different needs across regions or seasons
Adjusting the MEB for regional or urbanrural price differences if significant
HOW TO
Box 1MEB
3 How to construct a MEB generic steps
11 This is in line with the cost of basic needs approach widely used for poverty lines as described in previous sections
A MEB is constructed by estimating the cost of acquiring
adequate food and adding the cost of other essential non-
food expenditures11 The box below shows the steps that are
always part of constructing a MEB
The two principal methods for constructing MEBs are
the expenditure-based approach and the rights-based
approach Sections 5 and 6 describe these approaches
and how to combine elements of both to apply a hybrid
approach
Regardless of approach it is crucial to arrive at a realistic
relevant and operational MEB that is rooted in
consumption behaviour ndash section 6 also looks at how to
ensure this Before going into the details of construction the
next section outlines the key questions to ask before starting
the MEB analysis
8
Minimum Expenditure Baskets Guidance Note | December 2020
Before embarking on the construction of the MEB
components consider the following questions to decide how
best to approach the analysis
What is the objective and whowill be the partnersStart by setting the objective and consider what the MEB will
be used for once the analysis is finished If the MEB analysis
is a joint exercise identify potential partners possibly in
interagency working groups such as a cash working group find
out what kind of information various organizations can share
and decide on the division of labour In some cases it can be
helpful to write terms of reference for the MEB analysis in
order to clarify the envisioned process and methodology Even
if the MEB analysis will be conducted by just one agency it is
always a good idea to identify partners who will be interested in
the results and who can be consulted along the way12
Who is the MEB being constructed forIt is important to define the population of interest for the
MEB Is it intended to be valid for the entire country Or will it
only be used in a refugee camp for example or a particular
region where needs might differ from those in the rest of
the country It is vital to decide from the start where and for
whom the MEB should apply Since the MEB describes the
cost of essential needs the population for whom the MEB
is constructed should ideally have relatively homogenous
consumption patterns and needs If consumption patterns are
very different consider constructing different MEBs or varying
certain components of the MEB for sections of the population
Have any MEBs already been created for the population of interest If there are one or more MEBs already in use the analytical
exercise might be aimed at updating or even ldquoreality
checkingrdquo the existing baskets to see whether they still match
consumption behaviour and price levels If existing baskets
are found to be valid and relevant it might not be necessary
to start a new MEB analysis
4 Before starting the analysis What information and data is already available and is new data neededConsider what data or analysis is already available from
essential needs assessments or other household surveys
(undertaken by WFP or others) Does the data cover the area
and population of interest Also consider what qualitative
information might be available to shed light on certain
expenditure patterns and whether there is access to market
and price information If the data available is insufficient or
outdated plan to collect fresh data A MEB analysis is greatly
strengthened by being conducted as part of a comprehensive
essential needs assessment The assessment describes the
essential needs of the population of interest which is a
useful starting point for a MEB analysis and complements the
monetary perspective provided by a MEB
Can the national poverty line be usedBefore beginning the construction of a MEB it is useful to find
out if a national poverty line exists and how and when it was
constructed Many countries have their own national poverty
lines so why not use this poverty line (and the corresponding
basket) as the MEB Whenever possible the first choice
should be to align with government practices However this is
often not feasible for three main reasons
Practices vary widely when it comes to constructing
national poverty lines Although the most common
approach is the cost of basic needs using MEBs
sometimes poverty lines are set as a share of the
country mean or median income or expenditures or
as a fixed percentage of the income or expenditure
distribution (although this is mostly not the case in low
income countries) Furthermore even when a MEB has
been constructed to develop the poverty line different
methodologies exist For example sometimes countries
exclude non-food items from their poverty line MEB
Since the MEB describes the cost of essential needs the population for whom the MEB is constructed should ideally have relatively homogenous consumption patterns and needs
12 The Cash Learning Partnershiprsquos MEB Tip Sheet contains useful advice on the interagency processes around constructing a MEB Baizan and Klein 2019
9
Minimum Expenditure Baskets Guidance Note | December 2020
Countries can also have different poverty lines for
different purposes and regions13 These factors can all
limit the use of the national poverty line as the MEB
The population of interest for a MEB could differ from the
overall population of the country and hence the national
poverty line This group of people may have different
essential needs for instance if they live in refugee camps
or do not have access to the same services as the resident
population (eg public education)
The data that WFP typically collects through essential
needs assessments comprehensive food security
and vulnerability analyses emergency food security
assessments baseline assessments and post distribution
monitoring is often much less detailed than that gathered
through the household budget surveys or living standards
measurement surveys used to calculate national poverty
lines It is widely observed that the more detailed the
survey questions about expenditures the higher the
reported expenditures14 If the national poverty line is
constructed using detailed data but the assessment of
household needs or expenditures relative to the poverty
line is based on less detailed data errors in the analysis
are likely to occur Furthermore WFP expenditure
modules do not include asset depreciation which is often
accounted for when calculating national poverty lines
Even if the national poverty line cannot be used in most
cases and especially in humanitarian contexts elements of
the methodology can perhaps be replicated It is therefore
important to find out how the national poverty line is
constructed
How about using the methodology applied for consumer price indices The consumer price index (CPI) is used to measure changes
in price levels based on a weighted average consumer basket
of goods and services In most countries household budget
survey data is used to construct the baskets used to measure
consumer prices A weight that corresponds to average
household expenditure patterns is applied to each component
of the CPI17 This basket is not ideal for MEB calculations
because it corresponds to overall national average
consumption patterns MEBs are based on the consumption
levels and patterns of those households who are just able to
meet their essential needs within the population of interest
(this is further described in the following sections)
13 Jolliff and Prydz 2016 14 Haughton and Khandker 200915 Republic of Zambia Central Statistical Office 2016 16 See Turkish institute of statistics data portal httpsdatatuikgovtrKategoriGetKategorip=Income-Living-Consumption-and-Poverty-10717 The CPI weights are usually available through national statistical offices
COUNTRYEXAMPLE
EXAMPLES OF NATIONAL POVERTY LINESEG Box 2
In Zambia the national poverty line is constructed using the cost of basic needs MEB approach based on a simple food
basket that meets minimum food needs for a family of six15 Imagine this food basket costs USD 100 per month This is
defined as the food poverty line To construct the full poverty line the minimum non-food needs of households are
estimated based on the average share of expenditure that households just above the food poverty line dedicate to needs
other than food Let us say that this corresponds to USD 35 per month The total poverty line is then the sum of the food
and non-food lines which with these hypothetical figures would be USD 100 + USD 35 = USD 135
By contrast Turkey uses the standard European Union approach to measuring poverty which is 50 or 60 percent of
median income16 However eligibility for social assistance is based on the gap between household income and the national
minimum wage
10
Minimum Expenditure Baskets Guidance Note | December 2020
In developing country contexts consumption is generally considered a better metric of wellbeing than income and in turn consumption expenditures as captured in household data generally provide the most reliable measure for consumption
5 Constructing a MEB expenditure-based and rights-based approaches
51 The expenditure-based approachThe expenditure-based approach to constructing a MEB
relies on household-level expenditure data to examine the
consumption behaviour of households who are just able
to meet their essential needs The expenditure level and
consumption patterns for this group of households reveal the
minimum cost of covering essentail food and non-food needs
and therefore form the basis of the expenditure-based MEB
The expenditure-based approach builds on the theory
behind poverty measurement and poverty line construction
To measure poverty the first step is to define a measure
of wellbeing In developing country contexts consumption
is generally considered a better metric of wellbeing than
income and in turn consumption expenditures as captured in
household data generally provide the most reliable measure
for consumption18 Household survey data on expenditures
therefore provides the foundation for measuring wellbeing
and is used to set the MEB threshold
The steps for constructing a MEB using the expenditure-based
approach are explained below
1 Prepare the expenditure data The prerequisite for an expenditure-based MEB is a
good-quality household survey with a detailed expenditure
module with a sufficient sample size representative of the
population for whom the MEB is being constructed (the
ldquopopulation of interestrdquo)
The notion of a ldquodetailedrdquo expenditure module is a
relative one Constructing an expenditure-based MEB
requires more detailed data on different types and
groups of expenditures than is usually gathered by
household surveys conducted in humanitarian settings
However this guidance has been designed to cope
with less detailed expenditure data than that gathered
through extensive national expenditure surveys such
as the very granular expenditure modules typically used
when constructing poverty lines (eg national household
budget surveys household income and expenditure
surveys living standards measurement surveys or other
large-scale household surveys)
What is a sufficient sample size The survey should
always follow good practices for sampling19 Consider
that for MEBs the analysis focuses on the consumption
patterns of a subset of the sample the ldquoreference cohortrdquo
(see next below) The characteristics of the population
and the cohort selection criteria determine the size of
this subsample in relation to the overall sample but
experience shows that the cohort can comprise between
10 and 60 percent of the sample The sample will be
further disaggregated if analysis by household size or
group of household size is desired (see section 7 on
accounting for household sizes)
Using expenditures to understand consumption involves
calculating a ldquoconsumption aggregaterdquo This entails
combining household expenditures on food and non-
food paid in cash or through credit as well as the
imputed monetary values of consumed own production
and received assistance Expenditures are analysed in
per-capita values Box 3 describes this process in more
detail Annex 1 further outlines some best practices when
analysing expenditure data
In addition to the household survey data market price
data is needed in order to estimate the final cost of the
basket The price data should be collected around the
same time as the household survey data
18 Deaton and Zaidi 2002 and Haughton and Khandker 2009 19 For guidance see WFP 2004 Additional resources can be found in the online VAM Resource Centre httpsresourcesvamwfporg
11
Minimum Expenditure Baskets Guidance Note | December 2020
HOW TO
EXPENDITURE DATA IN MEB CALCULATIONS -CONSTRUCTING A LIGHT ldquoCONSUMPTION AGGREGATErdquo
Box 3
Using expenditures to calculate a MEB entails combining different household expenditures to arrive at a measure of house-
hold consumption This is typically referred to as a consumption aggregate although a lighter version is used than those
usually constructed for national poverty lines due to the less granular data typically available for MEB construction20
Expenditures considered in a MEB should reflect household consumption related to essential needs Therefore both
household expenditures made in cash and those on credit must be considered as the latter also reflect current consump-
tion even if payment occurs later If the population can be expected to consume food from their own production the value
of this food should be captured to avoid underestimating food expenditures Lastly if the surveyed households are receiv-
ing and consuming assistance it is advisable to estimate the implied value of this assistance and include it in the expendi-
tures (however care needs to be taken if the population of interest includes a large group of in-kind assistance beneficiar-
ies as this can significantly skew consumption choices see next section on selecting the reference cohort) In summary the
expenditure module should capture any expenditures made in the reference period through cash and credit purchases as
well as the monetary value of consumed own production and assistance Most standard expenditure modules include all
these types of expenditures
Expenditures should be collected for both food and non-food goods and services For food expenditures at the food group
level are required as a minimum If food expenditures are collected at the item level a more granular analysis can be per-
formed The same applies for non-food expenditures they must be available at the group level and item-level data will add
detail However whenever household data is collected a balance needs to be struck between the granularity of the data
and the time and resources available for its collection
The WFP standard expenditure module can be used as a reference for the minimum requirement for expenditure data
collection WFP standard modules can be found in the online VAM Resource Centre httpsresourcesvamwfporg
+ ndash=
2 Select the reference cohort The next step is to identify the households in the survey
data that are just able to meet their essential needs and
examine their expenditures Including households below
this level would generate a basket that does not satisfy
essential needs while including relatively wealthier
households would lead to the inclusion of non-essential
needs and therefore inflate the MEB But what is ldquojust
enoughrdquo
Identifying the cohort of households who are just able
to meet their needs can be challenging How to approach
it depends on the characteristics of the population
and the available data The key is to identify one or
more criteria that can be good proxies for whether
households are just able to meet their essential
needs and that can be observed in the data One
basic indicator would be a food consumption of 2100
kcal per person per day21 However since the available
expenditure data is often too crude to make accurate
calibrations of diet compositions around the 2100
kcal point the use of alternative indicators is highly
recommended These could be indicators such as food
consumption score (FCS) or food consumption score ndash
nutrition (FCS-N)22 which indicate whether households
eat sufficient and balanced diets quality of housing
indicators use of coping strategies (selecting households
who do not engage in severe strategies) or any other
indicator that reflects a householdrsquos ability to meet its
needs Combining several indicators is often useful
20 For thorough guidance on constructing consumption aggregates using data from living standard measurement surveys (LSMS) see Deaton and Zaidi 2002 In most WFP cases household data is less granular than the LSMS-type datasets This section therefore describes how to construct consumption aggregates with less detailed data21 Use of calorie consumption close to the Sphere Standard of 2100 kcalpersonday as the starting point for selecting the reference cohort originates in the cost of basic needs approach used in most national poverty line estimations 22 WFP 2008 and WFP 2015
12
Minimum Expenditure Baskets Guidance Note | December 2020
Figure 2 Selecting the MEB cohort
In simple terms it is useful to think of the green people in the figure as the basis for selecting the reference cohort they are not amongst the worst-off
nor the wealthiest ndash but rather are just able to meet their essential needs
DESTITUTE
WEALTHY
It is also recommended to examine the expenditure
distribution Excluding households in the extreme ends
of the expenditure distribution can help ensure that
the cohort is neither ldquotoo poorrdquo nor ldquotoo wealthyrdquo (eg
by removing households in expenditure quintiles 1 and
5 or similar exclusion criteria based on distribution
characteristics) This is in particular useful if there is a
relatively large spread in wealth across the sampled
population
Figure 2 provides a simplistic depiction of selecting the
reference cohort the aim is to identify households that
are just able to cover their needs and hence do not fall in
either extreme end of the spectrum
13
Minimum Expenditure Baskets Guidance Note | December 2020
Box 4 outlines some typical cases and presents suggestions
for how to select the cohort in a survey sampled on
the population of interest
There is a spread in the
population in terms of well-being
and a proportion is able to cover
their essential needs no
households receive assistance
A relatively large proportion of
households receive food
assistance
The vast majority of the
households are far from being
able to cover their essential
needs (prior to receiving
assistance)
Select households with an acceptable FCS23 or with adequate consumption in FCS-N
who do not use negative coping strategies (or have a high coping strategy index)
Combine or cross-check with other criteria such as dwelling quality or asset index
Exclude extreme expenditure quintiles
Exclude households receiving in-kind food assistance from the reference group (if
sample size allows) This is because any assistance that is not unrestricted cash
might influence the consumption choices of the beneficiary households (in-kind
food means a large portion of food consumption is determined by the assistance
provided not the households) However be aware that if the majority of
households receive some form of restricted assistance excluding them all from the
cohort can lead to sample size issues as well as selection bias
Alternatively to the extent possible avoid using criteria that are highly influenced
by assistance For example in the presence of food assistance the FCS of some
households might be acceptable even if they are not able to meet their essential
needs Furthermore if in-kind food is provided the consumption behaviour of such
households might be skewed as most of their food needs are already covered by
assistance
Consider using dwelling quality an asset index or other similar indicators instead
(or in combination with the FCS)
Consider using a rights-based approach since it will be very difficult to obtain a big
enough sample of households who can meet their essential needs making it
challenging to construct an expenditure-based MEB Carry out a reality check using
the survey data to understand household consumption patterns keeping in mind
that the sample represents a population not able to fulfill their essential needs
HOW TO
REFERENCE COHORT SELECTIONBox 4
Scenario Possible approach to selecting the cohortUse one or several of the below criteria
The use of sensitivity tests is highly recommended in the form
of repetitions of the expenditure analysis for different versions
of the reference cohort this will indicate the extent to which
the choice of cohort selection criteria is influencing the MEB
23 It is usually not advisable to use the FCS as a single criterion If it is used alone the indicator should be capped at a certain level above the acceptable threshold (the FCS builds on a continuous score from 0ndash112 and applies thresholds for poor borderline and acceptable consumption) This is because if all households with acceptable FCS are included this will likely also capture some households who are ldquotoo wealthyrdquo to be considered in the reference cohort
14
Minimum Expenditure Baskets Guidance Note | December 2020
See box 5 for examples of how sensitivity tests can be
conducted as well as how the reference cohort has been
COUNTRYEXAMPLE
SELECTING AND CHECKING THE REFERENCE COHORTCHAD SYRIAN REFUGEES IN LEBANON AND COXrsquoS BAZAR
EG Box 5
Reference cohort sensitivity analysis ndashCoxrsquos Bazar MEB
Table a
In Chad the calculation of an expenditure-based MEB relied on national data collected by the Government during their
annual national food security and nutrition survey The reference cohort for the MEB was selected on the basis of two
criteria FCS between 35 and 70 eg in an interval around the acceptable threshold and no adoption of crisis or emergency
livelihood coping strategies based on the livelihood coping strategies indicator These two criteria ensured that the
selected reference cohort had consumption levels that provided sufficient food security and sustainable livelihood
strategies
For Syrian refugees in Lebanon24 an expenditure-based MEB was calculated by WFP in order to review an existing MEB
Shelter plays an important role as most refugees live in an urban host community and face high rents The FCS reveals
whether people can cover their food needs but could be influenced by the presence of food assistance To ensure results
would be robust against the choice of the cohort two different approaches were compared both included households of 4
to 6 members (as the MEB under review was defined only for households of these sizes) and excluded households in
expenditure quintiles 1 and 5 In version 1 an additional criterion of acceptable FCS was included while in version 2 an
additional criterion of acceptable housing conditions was applied The results were similar for both cohort versions
A MEB was calculated in Coxrsquos Bazar Bangladesh as part of the 2019 Refugee Influx Emergency Vulnerability Analysis
(REVA-II)25 for Rohingya refugees An expenditure-based MEB was built using a large household survey that included
refugees and host community households the reference cohort also included refugees and host communities as the MEB
was meant to apply to both groups Households receiving in-kind food assistance were excluded to avoid possible bias in
consumption choices which would be reflected in the expenditure data The reference cohort was then selected based on
FCS and expenditure quintiles To ascertain that the appropriate cohort had been chosen a sensitivity analysis was
conducted which tested the effect of removing different expenditure quintiles (quintiles 1 and 5 versus quintiles 1 4 and 5)
and including different FCS ranges (FCS 42+ versus FCS 35ndash80) This showed that across different iterations of the reference
cohort total food expenditures were relatively stable while non-food expenditures went up when richer households (eg in
the higher expenditure quintiles) were included This allowed the analysts to select the cohort of households who were just
at the point where the share of food expenditures out of total expenditures began to decrease as a high share of
expenditure on food is often an indicator of vulnerability In other words the selected cohort was just at the point where
households started meeting more needs than just food and the most basic non-food requirements The consumption
patterns of this cohort -highlighted in table a below - therefore became the basis for the MEB
Indicator 1expenditurequintiles
Indicator 2FCS Sample
size Value in taka
Total MEB
Exclude quintiles 1 4 and 5
Exclude quintiles 1 4 and 5
Exclude quintiles 1 and 5
Exclude quintiles 1 and 5
FCS 35ndash80
FCS gt= 42
FCS 35ndash80
FCS gt= 42
403
296
610
474
5259
5324
5691
5740
2304
2299
2990
3082
070
070
066
065
030
030
034
035
7562
7623
8681
8822
Food MEBValue in taka Value in taka
Non-food MEB
identified in different contexts
24 Hohfeld et al 2020 25 WFP 2019
15
Minimum Expenditure Baskets Guidance Note | December 2020
3 Establish the food basketWith the reference cohort identified the food basket value
should be calculated in correspondence with the food
consumption patterns of the reference cohort
To calculate the food basket start by computing the mean
(or median) food expenditures for the chosen reference
cohort It is good practice to compute the overall food
expenditures and break the analysis down into the different
food groups or food items in order to understand how food
consumption is distributed across different foods
Next consider whether an explicit reference food basket
is needed in the MEB this is a list of the food items in the
basket and their quantities Having a reference basket
brings advantages in terms of monitoring of the cost
of the MEB (as new prices can easily be applied to the
quantities) it shows consumption patterns in quantities
and can hence help check if food consumption is adequate
at the given level of expenditures and it can help when
communicating about the MEB It can therefore be a useful
practice to establish one However in some instances
a simple monetary value for the food MEB is sufficient
This could be the case when the MEB is calculated to
review an existing MEB if reference basket is not needed
for operational purposes when time is limited or
where limited data means a reference basket cannot be
adequately calculated Wherever a food reference basket
is not needed the food MEB will simply be the mean (or
median) food expenditures by food groups or food items
as calculated above If a reference food basket is feasible
and desired the next steps depend on the level of detail in
the data available
With expenditure data and market prices a food
reference basket can be approximated using expenditures
by food group or food item and dividing these
expenditures by the relevant food prices This provides
estimates of consumed quantities Expenditures and prices
must be collected at the same time in order to arrive at
correct quantities If for example prices are collected six
months later than expenditures and prices have changed
significantly dividing expenditures by prices will produce
inaccurate estimates
Note that the level of detail and accuracy with which a
food refence basket can be established using expenditures
and prices also depends on whether expenditures
were collected at the food group or food item level Box 6
illustrates how to approximate a reference basket when
expenditures are collected at the food group level and
box 7 shows an example of a food basket estimation from
an assessment in Kinshasa Democratic Republic of the
Congo
If the expenditure module includes consumed quantities
of food in addition to expenditures a food basket can be
established directly based on the consumed quantities by
food group or food item Having data on quantities will
also enable analysts to estimate prices directly from the
survey data by dividing the household expenditure on a
particular food item by the quantity consumed This can be
advantageous as it provides a direct estimate of the prices
households actually paid (unlike a price survey which uses
typically consumed items and is often only conducted
at specific points of sale) On the other hand this may
introduce issues related to non-standard measurement
units that make prices hard to compute and aggregate26
Box 8 shows an example from Coxrsquos Bazar of how a food
reference basket can be established using item-level
expenditures and quantities from the survey data
Once the quantities consumed have been established using
one of the methods described above it is good practice to
check the calories these quantities provide and the balance in
terms of nutrients The basket should be close to the Sphere
Standard of 2100 kcal per person per day ndash if it is not one
option could be to scale the basket Use information on the
calorie content of the different food items in the basket to
calculate the total calorie content of the basket27 The quantities
in the basket can then be scaled up or down to reach 2100
kcal However bear in mind that if the reference cohort has
been well selected and the data is of sufficient quality and
detail the basket should already be close to 2100 kcal If large
rescaling is required investigate the reasons behind this For
the sake of simplification quantities can be rounded and the
basket can be streamlined by removing items with very low
consumption or nutritional value
26 Deaton and Grosh 2000 27 Calorie information of food items can be drawn from a variety of sources The Nutval tool (httpwwwnutvalnet) provides information on calories and other nutrients for a list of items Consider that the
specifications and quality of a product can influence its caloric value (eg whole fish vs fish fillet) ndash it might be necessary to adjust for this for certain items that vary widely Many food composition tables (available from FAO for different continents httpwwwfaoorginfoodsinfoodstables-and-databasesfaoinfoods-databasesen) contain a wastage factor or edible portion conversion factor to convert from edible portions into full products as they are bought on the market
16
Minimum Expenditure Baskets Guidance Note | December 2020
After establishing the reference basket and possibly rescaling
it the basket is priced This is done by multiplying the basket
quantities by the food prices The basket can be priced using
current food prices from a price survey or by estimating food
prices from the expenditure data as described earlier The
result should be close to the expenditures for the reference
cohort although differences could arise from any rescaling or
simplification of the basket
APPROXIMATING A FOOD BASKET WITHGROUP-LEVEL FOOD EXPENDITURES
Box 6
HOW TO
Data quality and granularity has a big impact on the calculation of a food reference basket If consumed quantities are not
directly available in the dataset they need to be calculated by dividing expenditures by prices However this will always
produce an approximation and the more aggregated the data on expenditures is the more approximate the results will be
In particular when the food expenditure data is available at the food group level care needs to be taken when converting
expenditures into quantities
For example to convert expenditures on the food group ldquocerealsrdquo into a reference quantity analysts need to divide cereal
expenditures by the price of cereals But how do they determine the price of cereals This is a food group not a specific item
so there is no exact price The recommended way to approach this is to determine which is the most commonly consumed
item or combination of items for each food group Then a price for the most commonly consumed item or a composite price
of a combination of items can be used to arrive at quantities So if the most commonly consumed cereals for the population
of interest are maize and rice and they are eaten in equal measure by the population the cereal quantities for the reference
basket can be calculated in the following way
Mean cereal expenditures for our reference cohort = 150 shilling
Price of rice = 18 shillingkg
Price of maize = 12 shillingkg
Composite price of rice and maize = (18 + 12) 2 = 15 shillingkg
Cereal quantity consumed = 150 shilling (15 shillingkg) = 10 kg (5 kg rice 5 kg maize)
Of course this is an approximation care needs to be taken when converting expenditures into quantities using
group-level data
Certain food groups may lend themselves more to this approximate conversion than others For example cereals
might be relatively easy to convert using this method as cereal consumption often is concentrated on a few key staples In
contrast vegetable consumption may be so diverse that conversion via prices is not helpful In this latter case one option
could be to obtain reference basket quantities for the groups that can be converted and leave other groups as expenditures
only so that the food MEB becomes a combination of quantities and expenditures
In summary to establish the food basket
i Calculate mean (median) food expenditures by food group
or item If an explicit reference basket with quantities is not
needed stop here and simply use the expenditures as the food
basket
ii Estimate consumed quantities (by dividing expenditures
by prices or directly from data if it contains consumed
quantities)
iii Check the resulting quantities and consider scaling to meet
Sphere Standards
iv Price the basket using market prices or prices derived
from the household data
17
Minimum Expenditure Baskets Guidance Note | December 2020
Table a Food reference basket ndash Kinshasa MEB
COUNTRYEXAMPLE
KINSHASA FOOD REFERENCE BASKET USINGFOOD GROUP EXPENDITURES
Box 7
In the Kinshasa urban essential needs assessment28 the food reference basket for the MEB was established as follows
Expenditure data was available at the food group level only The caloric importance of each food group (column A of the
table below) as a part of the overall food intake was determined For each of the calorie-relevant food groups the most
commonly consumed food item was then identified (eg maize in the case of cereals) (see column B) Using the average per
capita expenditure from the household survey (column C) and the market price for each food item (column D) the
quantities consumed per person per month were approximated (column E) Next the total calorie intake was calculated
(column G) For urban Kinshasa this amounts to 1967 kcal which is close to the Sphere Standard of 2100 kcalpersonday
and suggests that the expenditure data is likely to be reliable However a proportional rescaling to 2100 kcalpersonday
was done to ensure consistency with Sphere (column H) On the basis of the rescaled total calories all values were then
converted back to monthly figures to arrive at a monetary value for each food item (columns I and J) In addition to the
calorie-relevant food items the mean expenditures on other food categories that households regularly consume were
added (vegetables fruit etc) As these food items represent little overall share of peoplersquos calorie consumption (given the
quantities consumed or the type of the foods) they were not included when calories were calculated Furthermore it would
be difficult to select specific food items in each of these categories as they are quite diverse (eg vegetables) However as
most households still consume these food items as part of their usual diet and they provide important micronutrients their
costs need to be reflected in the food MEB The mean expenditure on these food categories was therefore used as a
good-enough approximation for householdsrsquo consumption of these food groups Meals consumed outside the household
were excluded from the MEB as they were not considered essential
Food
grou
p
Food
item
per
capi
ta a
vm
onth
ly e
xp
Pric
e(f
ranc
kg)
kg c
ons
per
mon
th =
CD
food
item
kca
lpe
r 10
0g
kcal
con
s p
er d
ay=(
EF
10)
30
kcal
per
day
res
cale
d=G
(21
001
967)
kg p
er m
onth
res
cale
d=(
H(
F10
))30
roun
ded
MEB
food
-bas
ket
(fra
nc)=
ID
6898
1808
2089
2341
4306
1817
2826
833
799
2509
2144
900
500
1300
2300
2500
2200
77
36
16
10
17
08
920
412
179
302
44
110
1967
360
342
335
890
76
400
TOTAL
982
440
192
322
47
118
2100
82
39
17
11
18
09
7400
1900
2200
2500
4600
1900
2800
800
800
2500
27400
A B C D E F G H I JCereals
Tubers
Pulses
Oilsfats
Meatfish
Sugars
Vegetables
Fruit
Dairy
Condiments
Meals out-
side home
Maize
Cassava
Beans
Veg Oil
Fish
White sugar
Vegetables
Fruit
Dairy
Condiment
Meals out-
side home
29 WFP 2019 Also see box 5
18
Minimum Expenditure Baskets Guidance Note | December 2020
COUNTRYEXAMPLE
COXrsquoS BAZAR FOOD REFERENCE BASKETWITH DETAILED EXPENDITURE AND QUANTITY
Box 8
In the MEB for Coxrsquos Bazar calculated as part of the REVA II assessment expenditures and consumed quantities were
available for 87 food items which formed the basis for the consumption aggregate While the expenditure data was used to
select the appropriate reference cohort the reported quantities were used to determine household calorie intake
Quantities were reported at the food item level and consumed calories were calculated for each item The items were then
categorized by food group (cereals pulses oilsfats vegetables etc) and the total calories from each group were
calculated To create an operationally relevant reference basket without very large numbers of food items the number of
items in each food group were reduced where possible For example 95 percent of the calories that households get from
the food group ldquocerealsrdquo come from rice The cereal food group was therefore simplified to rice only keeping the total
calories sourced from cereals constant and adjusting the quantity of rice in the basket slightly upwards For pulses the four
main consumed items were identified and calories and quantities proportionally adjusted For other food groups such as
vegetables the variety of items consumed within the group was too great to simplify items to a small number for this
group no items were assigned and instead total expenditures on vegetables for the reference cohort were used directly in
the food MEB The total calories of all items were taken into account The resulting basket was close to 2100 kcal so only
minor rescaling was undertaken to arrive at final reference basket of 2100 kcalpersonday
Once the final basket had been determined quantities were priced using median prices derived from the household data
(by dividing expenditures by purchased quantities for the relevant items)
For vegetables fruits meat dairy and condiments expenditures are used directly in the food MEB (converted into monthly per
household values) For all other items quantities per capita per day are multiplied by the item median price (as derived from
the household data) and converted into monthly per household values
The MEB uses household size 5
Note The MEB for Coxrsquos Bazar was calculated for analytical purposes for the REVA II assessment It is not the operational MEB used
for the district
Foodgroup
Fooditem
Consumedquantity(grammescapitaday)
Calories(kcalcapitaday)rescaled
Median prices(takakg)
Value in MEB(taka per HHmonth)
424
14
7
2
1
182
6
81
1
33
6
28
1527
48
27
8
4
78
5
85
1
294
24
0
2100
30
80
60
40
80
-
-
-
-
80
60
-
1909
168
67
14
13
1065
48
1600
15
392
57
345
5691
Cereals
Pulses
Pulses
Pulses
Pulses
Vegetables
Fruit
Meat
Dairy
Fats
Sugar
Condiments
TOTAL FOOD
Rice
Lentil
Chickpea
Anchor daal
Mung
none
none
none
none
Soybean oil
Sugar
none
Table a Food reference basket ndash Coxrsquos Bazar MEB
19
Minimum Expenditure Baskets Guidance Note | December 2020
4 Establish the non-food basketOnce the food component has been established a non-
food component is added There is no wholly satisfactory
way to add a non-food component as it can be difficult to
define an essential minimum Unlike food needs many
non-food needs are often more contextual and are not
easy to anchor in a specific universal threshold (like the
food Sphere Standard of 2100 kcal per person per day)
While Sphere Standards exist they often need to be
contextualized and may not cover all non-food essential
needs
The non-food basket can be established with different
levels of detail depending on the available data and the
level of granularity desired
As for the food expenditures start by calculating the
mean (andor median) non-food expenditures for the
reference cohort If the expenditure data is detailed it can
be used to identify specific non-food needs Expenditures
can be analysed by non-food group (eg shelter hygiene
or transport) to design a non-food basket composed
of group-specific expenditures The precise non-food
components can vary by context but would generally
include the components discussed in the section on
the rights-based MEB below Some non-food items that
expenditure data has been collected for might need to be
excluded for the purpose of constructing the MEB (eg
tobacco which is hard to consider an essential need)
In theory it would be possible to establish a non-food
reference basket with specific quantities using the same
method as for food ie by dividing expenditures by prices
to arrive at quantities However this is usually not feasible
for non-food goods and services simply because non-food
expenditure data is often much harder to break down into
specific items than food expenditure data For instance
even if expenditures on clothing or transportation
are known relating this to exact clothing items or
transportation services and then obtaining accurate
prices for those itemsservices will often prove difficult if
not impossible Therefore as a general recommendation
in the expenditure-based approach when non-food
expenditure data is not available at the item level it is
best to keep the non-food basket to expenditures and not
provide quantities If reliable market price information on
relevant non-food items is available total expenditures
could be checked against prices to obtain an approximate
idea of the adequacy of the non-food expenditures
Particular groups of non-food expenditures may require
special attention due to their nature Box 9 highlights a
few examples
TIP BOXNON-FOOD EXPENDITURES ndashEXPENDITURES OF PARTICULAR INTEREST
$$
$
Box 9
Shelter expenditures can be a tricky component to deal with especially for urban populations If the share of the
population who rent accommodation is significant rent will typically be included in the MEB as it is the cost of shelter an
essential need Indeed it can form quite a significant part of the MEB However if the resulting MEB is compared to actual
expenditures to determine whether households fall below the MEB those who own their dwelling and therefore do not pay
rent might be classified as unable to cover their needs just because they do not have any major shelter expenditures
Therefore large single expenditures such as rent should be included with care and context will determine how shelter
expenditures are handled in the MEB Generally speaking if no or very few households in the population of interest have
major shelter expenditures such as rent this component should be left out of the MEB and no attempt made to impute it
(as is sometimes the case in poverty line estimations) If the majority of households rent their dwellings it is advisable to
include mean rent expenditures in the MEB The trickier case is when the households in the population of interest are split
between a significant number of households living in owned or no-rent housing and a significant number paying rent ndash
here it is difficult to reflect shelter expenditures adequately in the MEB Simply using mean rent estimations in the MEB will
underestimate the need for the renters while overestimating it for those who own their housing or do not pay rent In this
case insofar as data allows one solution could be to impute rent expenditures for the non-renters by estimating the
would-be rental cost for the type of housing they live in Doing this typically requires a housing module in the household
survey that contains information on ownership and types and sizes of housing so rental equivalents can be computed and
imputed for the non-renters
20
Minimum Expenditure Baskets Guidance Note | December 2020
NON-FOOD EXPENDITURES ndashEXPENDITURES OF PARTICULAR INTEREST
$$
$
Box 9
Health expenditures can also be challenging to capture adequately in survey data as such expenditures are often irregular
in nature Bear in mind that health expenditures usually consist of payment for goods such as medicines and for services
such as visits to the doctor When analysing the expenditures and deciding how to include them in the MEB consider which
services may be provided free of charge and what households pay themselves and at what cost30
Care should be taken when it comes to the underreporting of expenditures and treatment of expenditures that are
irregular in nature Remember that the MEB should include all recurrent essential needs but it typically does not include
one-off expenditures ldquolumpy expendituresrdquo such as marriage expenditures or dowries or investments Expenditures
on durables (for instance the purchase of vehicles or large household appliances) are also not included (in national poverty
lines the rental value of the durables owned by households adjusted for depreciation is sometimes included31 however
this is not recommended for MEB calculations)
Household expenditures on savings taxes and debt repayment are not usually included in the MEB as these types of
expenditures do not reflect actual consumption
Tobacco and alcohol are often included in expenditure surveys While households may choose to spend money on these
items they can fairly be assumed to be non-essential and are generally not recommended for inclusion in the MEB
The ldquoquick fixrdquo if data is very limited If the expenditure
data has no or very insufficient data on non-food
expenditures a ldquoquick fixrdquo solution is to use the average
non-food expenditure share of total expenditures This can
often be obtained from external sources such as monitoring
reports or food security assessments This is then added
COUNTRYEXAMPLE
Table a Non-food basket ndash valuesCoxrsquos Bazar
Value in MEB (takaHHmonth)
Non-food group
Toiletries and cleaning
Clothes shoes and towels
Cooking equipment
Education
Fuel and electricity
Medical treatment
Household textiles and small repairs
Communication
Transport
Total non-food
461
521
25
134
775
447
57
274
295
2990
Figure a Non-food basket ndash distribution Coxrsquos Bazar
Note The MEB for Coxrsquos Bazar was calculated for
analytical purposes in the REVA II assessment
It is not the operational MEB for the district
9Communication
10Transport
2Householdtextiles and
small repairs
15Medical
treatment
26Fuel andelectricity
5Education
1Cooking
equipment
17Clothes shoes
and towels
15Toiletries
and cleaning
EXPENDITURE-BASED NON-FOOD REFERENCEBASKET EXAMPLE FROM COXrsquoS BAZAR
Box 10EG
to the cost of the food basket to arrive at the total MEB
However when using an additional data source analysts
should understand how the average share of non-food
expenditures has been calculated and what sample it has
been derived from as it may not reflect the consumption
patterns of the reference cohort
30 The WHO and Global Health Cluster guidance on health expenditures in the MEB has some useful insights into household health expenditures See WHO and Global Health Cluster ndash Cash Task Team 2020 31 Deaton and Zaidi 2002
21
Minimum Expenditure Baskets Guidance Note | December 2020
52 The rights-based approachIn humanitarian contexts ldquoessential needsrdquo have been
understood as referring to access to full rights as set out by
international humanitarian law and the Humanitarian Sphere
Standards The term ldquorights-based MEBrdquo is derived from
this understanding According to the operational guidance
on multipurpose cash grants32 international humanitarian
and human rights law protects the right of crisis-affected
persons to food33 drinking water soap clothing shelter and
lifesaving medical care Humanitarian Sphere Standards
builds on this definition and outlines minimum humanitarian
standards in the areas of food security and nutrition
shelter and settlement health and WASH (water supply
sanitation and hygiene)34 In some contexts residency or legal
documentation is also included Humanitarian standards
for education are outlined in the Education in Emergencies
Minimum Standards Handbook35
The rights-based approach entails defining a detailed list
of the food and non-food items that make up the MEB
reference basket and pricing them using current market
prices MEBs built by the Interagency Cash Working Group or
other interagency coordination forum are often constructed
following the rights-based approach with each sector or
cluster contributing to the needs in their respective sectors
In these cases WFP is usually responsible for defining the
food component of the MEB For both food and non-food
items the reference basket is typically produced or cross-
checked through focus group discussions with the population
of interest partners and key informants It is usually put
together based on the needs of an average-sized household
1 Establish the food basketTo construct the food basket for a rights-based MEB compile
a list of food items and their quantities The Sphere Standards
offer a useful starting point recommending a diet of 2100
kcal per person per day with 10ndash12 percent of daily energy
intake from protein and 17 percent from fats36 The food
basket should be adapted to local diets and preferences
2 Establish the non-food basketOnce the food basket has been established a non-food basket
should be added In the rights-based approach this is typically
done by quantifying needs by producing a list of items by
sector Some examples are found below
Shelter This is the cost of accommodation that meets
basic shelter needs and rights What this means in practice
will depend on the context driven for example by weather
conditions and what is realistically available to the population
Utilities These include the cost of basic utilities such as safe
drinking water and depending on the context electricity
Non-food items These reflect basic household needs
related to cooking clothing and hygiene plus other general
household items Cooking gasfuel or firewood is often
included In line with the definition of the MEB the list should
focus on recurrent needs In practice these non-food items
can look very different depending on the context 38
Services This includes the costs of accessing basic services
such as healthcare education transport and communication
Healthcare costs are often difficult to quantify since they
are inherently irregular large and unpredictable Typically
however only basic minimum needs are covered in the MEB
such as eg two visits per year to the doctor expenses for
critical events deliveries and medicines are sometimes also
included Note that even if a need is not covered by the MEB
it does not mean that these needs do not need to be met for
the population of interest Health can be an example of this
health needs are often better met through service provision
than purchased through the market and therefore may
be only partially reflected in the MEB However guidance
from WHO and the Global Health Cluster notes that people
tend to have some level of health expenditures even when
COUNTRYEXAMPLE
SHELTER IN THE MEBFOR SYRIAN REFUGEES
EG Box 11
For the Syrian refugee operation in Turkey the MEB
includes the costs of shelter that meets certain
standards such as a minimum of 35 m2 per
person access to a toilet and running water
32 UNHCR et al 2015 33 Defined as energy needs not considering full nutrient needs (protein vitamins minerals etc) 34 See the Sphere Standards Handbook 35 INEE 2010 36 Further recommendations on micronutrient requirements can be found in the Sphere Standards Handbook37 Hobbs 201638 For some refugee contexts the Office of the United Nations High Commissioner for Refugees (UNHCR) has lists of specific items which can be considered for the MEB
22
Minimum Expenditure Baskets Guidance Note | December 2020
policies are in place that require the free public provision of
health services39
Education costs usually cover school fees materials
uniforms and transport depending on what households
have to pay themselves and what is publicly available
Transport and communication needs are often defined as
the average transport and communication costs reported by
household surveys and then validated with the communities
COUNTRYEXAMPLE
EXAMPLE OF A RIGHTS-BASED MEBFOR NORTHEAST NIGERIA
Box 12EG
The northeast Nigeria cash working group designed a MEB for a household of seven people40 the resulting reference
basket is shown below
Sectorgroup
Item Quantity(7 pers HH)
Sectorgroup
Item Quantity(7 pers HH)
Cooking fuel
WASH
Cooking fuel
WASH
Transportation
Communication
Health
Education
Firewoodbriquette
charcoal
Water + vendor fee
Bathing soap
Laundry soap
Sanitary pads
Firewoodbriquette
charcoal
Water + vendor fee
Bathing soap
Laundry soap
Sanitary pads
Rides
Airtime 500 NGN
Average expense
Pen
Pencil
Notebook
1 bag
158 jerrycans
13 bars
3 bars
4 packs
1 bag
158 jerrycans
13 bars
3 bars
4 packs
10 rides
1
7 pers
3 pcs
3 pcs
3 pcs
Table a MEB example northeast Nigeria
27 kg
45 kg
135 kg
18 L
27 kg
18 kg
36 L
09 kg
144 kg
2 kg
2 kg
1 kg
05 kg
12pcs
1L
Food Rice
Maize
Beans
Palm oil
Groundnuts
Sugar
Vegetable oil
Salt
Onion
Non-leafy vegetables
Leafy vegetables
Fruits
Meats
Chicken eggs
Vinegar
communication needs can also be specified as the cost of a
SIM card with a certain amount of data or airtime
3 Price the reference basketWith the food and non-food reference baskets established
the list of items and quantities are now priced using updated
prices from markets relevant to the population of interest
The pricing should be done based on actual current market
prices This produces the final rights-based MEB
39 WHO and Global Health Cluster ndash Cash Task Team 2020 40 Cash Working Group Nigeria 2018
23
Minimum Expenditure Baskets Guidance Note | December 2020
MEB APPROACHES ndash CONSTRUCTION SUMMARYBox 13
HOW TO
Rights-based approach
Establish the food basket
Define a list of relevant and locally preferred and
available food items and their quantities The Sphere
Standards can be used as a reference
Establish the non-food basket
Define a list of essential non-food items relevant to the
population of interest and their quantities Services such
as education or transport can also be included The list is
usually put together sector by sector
Price the basket
Use current market prices for the food and non-food
items in the reference baskets to calculate the price of
the basket Use prices from markets relevant to the
population of interest
1
2
3
4
1
2
3
Expenditure-based approach
Prepare the expenditure data
Ensure the data is cleaned Compute expenditures by
combining cash and credit expenditures the value of
consumed own production and consumed assistance
for both food and non-food expenditures Compute
expenditures as per capita figures
Select the reference cohort
Identify households ldquojust able to meet their essential
needsrdquo using indicators such as FCS FCS-N housing or
others excluding households in extreme quantiles of
expenditure distribution or other criteria or
combination of criteria Check the sensitivity of the
results to the selection of reference cohort
Establish the food basket
Calculate mean (median) food expenditures by food
group or item Either stop here or ndash to obtain a refence
basket ndash estimate consumed quantities check the
calorie content of the resulting quantities and consider
scaling them to Sphere Standards Price the basket
using market prices or prices derived from the
household data
Establish the non-food basket
Calculate mean (median) non-food expenditures by
non-food group or item If item-level data and prices
are available it is possible to derive a non-food
reference basket using same methodology as for the
food basket otherwise the non-food basket will
comprise the expenditures at the group level If a
quick-fix solution is needed add the average household
non-food expenditure share to the food MEB
53 Summary and data needs for expenditurendashbased and rights-based approachesBox 13 summarizes the steps to follow in order to construct a
MEB using an expenditure-based or a rights-based approach
24
Minimum Expenditure Baskets Guidance Note | December 2020
Qualitative understanding
of essential needs for the
population of interest
Representative household
survey with detailed
expenditure module
List of ldquorights-basedrdquo needs
Price information
Focus group discussions with key informants or population
of interest
Literature review of existing information on the essential needs of
the population of interest
WFP essential needs assessment emergency food security
assessment or comprehensive food security and vulnerability
analysis or other representative pre-assistance baseline survey
National household budget surveys household income and
expenditure surveys living standard measurement surveys or
other large-scale household survey
Clusters Cash Working Group other interagency forum
Sectoral assessments other secondary information
Price data series covering the area of interest for relevant food
and non-food items and services from WFP (Dataviz41 has
up-to-date price information) or partners
Price indices from national statistical offices
Prices derived from household expenditure data where quantities
are also reported
Suggested sources Expe
ndit
urendash
base
d
Righ
tsndashb
ased
INFORMATION NEEDS AND SOURCESMEB APPROACHES
Box 14
HOW TO
Information need
TIP BOXWHAT IF DATA USINGA HOUSEHOLD ECONOMY APPROACH IS AVAILABLE
$Box 15
The household economy approach (HEA) developed by Save The Children is commonly used for analysing food security and
livelihoods It is based on understanding how households normally access income food and other itemsservices required
for survival established through a baseline analysis As part of the baseline the HEA defines livelihood zones where
households share similar strategies for obtaining food and income It also distinguishes households within these livelihood
zones in at least three (often four and sometimes more) wealth groups The HEA baseline quantifies the sources of food
and income and the expenditure patterns for each wealth group and livelihood zone
The information collected on expenditures can be used as a data source for calculating a MEB However due to the relative
nature of the wealth cut-off points used there is no set standard regarding which group should be the reference for the
MEB If HEA data is utilized it is important to understand how it was collected ndash the HEA is simply an analytical framework
not a set method of data collection Thus while HEAs are often conducted through qualitative methods (eg focus group
discussions) they may also be based on quantitative modules in household surveys The latter yields more rigorous
information however qualitative data can be used but should be cross-checked or triangulated with other sources
39 See VAM data portal at httpsdatavizvamwfporg
25
Minimum Expenditure Baskets Guidance Note | December 2020
54 Expenditure-based or rightsndashbased approach Pros and consThere are advantages and disadvantages to both types of
approach which should be kept in mind when constructing
the MEB
The expenditure-based approach has the advantage that it
directly reflects the actual demand of the population of interest
as it uses survey data to examine peoplersquos consumption
behaviour It is also fairly straightforward to carry out if good
survey data on the population is available One disadvantage is
that it can be difficult to put into practice when the population
of interest is generally poor (such as in a pre-assistance
refugee situation) because the number of households who can
constitute the reference cohort can be too small to analyse
Also care has to be taken when looking at expenditure patterns
only as the reference cohort may not always cover all of their
essential needs to a desired level (from a ldquorightsrdquo perspective)
For example the food patterns for those ldquojust able to meet
their essential needsrdquo may not always be very nutritionally
diverse as they are based purely on consumption behaviour42
In general the expenditure-based approach should not be applied
without good quality household expenditure data
TIP BOX ADVANTAGES AND DISADVANTAGES OFDIFFERENT APPROACHES TO ESTABLISHING MEBS
Box 16
Pros
Cons
Expenditure-based Rights-based
Straightforward to carry out if household data
is of good quality
Builds on actual consumption patterns of the
population of interest
Difficult to identify reference cohort if
everybody is poor
Survey data may not capture all essential needs
fully from a ldquorightsrdquo perspective
Survey data is not needed
Effective demand can be different from identified
needs leading to a MEB that does not reflect
actual demand and making comparison with
monitoring data tricky
Contains incentives to inflate sector-specific needs
The advantage of the rights-based approach is that
it can be used to construct a MEB without survey data
(although survey data is needed to monitor the MEB) One
disadvantage is that the effective demand of households
can look quite different from the basket that results from
this approach Another disadvantage is that particularly
when constructed in an interagency setting a rights-based
MEB can easily become an instrument for different partners
to compete for and secure funding There is a substantial
incentive to include excessively high sectoral needs if sector-
specific interventions are envisaged Finally if the MEB is
very detailed but the expenditure module in the household
surveys used to monitor peoplersquos expenditures against the
MEB is very crude comparison is difficult and therefore the
practical use of the MEB can be limited Many households
may fall below the MEB simply because of the discrepancy in
methods between the MEB and the monitoring data This is
similar to the issue previously discussed regarding the use of
national poverty lines
Box 16 summarizes the advantages and disadvantages of the
two approaches
42 A study conducted in Nepal showed that the food poverty line is well below the so-called ldquonutrient povertyrdquo line (see Geniez et al 2014)
26
Minimum Expenditure Baskets Guidance Note | December 2020
6 Arriving at a realistic and operationally relevant MEBRegardless of which processes and approaches are used to
construct the MEB it is crucial to arrive at a final result that
is a realistic picture of the cost of essential needs for the
population of interest rooted in actual consumption
behaviour This section looks at how approaches can be
combined to generate a hybrid MEB and how the result can be
ldquoreality checkedrdquo and validated
61 Combining approaches the hybrid MEBAs described in section 54 there are disadvantages to the
expenditure-based and the rights-based MEB approaches that
can affect the final MEB One way to overcome this challenge
may be to combine information from each approach in
a ldquohybridrdquo MEB This means making sure that the MEB is
consistent with the actual consumption behaviour of the
population of interest as found in expenditure data while
keeping the rights-based lens There is no one way to go about
this the method is subject to the availability of expenditure
data and other information on essential needs as well as the
objective of the MEB
When good quality expenditure data with a large enough
sample size is available for constructing the MEB it is good
practice to use the expenditure-based approach as a basis
for the analysis as far as possible If the expenditures of
the reference cohort are subsequently found not to reflect the
costs of covering certain essential needs for the population of
interest rights-based information should be used to reinforce
the MEB with a hybrid model If expenditure data is not
available and cannot be collected a rights-based MEB can be
constructed but should be cross-checked against any available
household-level information on consumption patterns
When starting with the construction ofan expenditure-based MEB
Did the household survey capture all essential needs or
are some not included in the data at all
If some needs are wholly overlooked consider using
rights-based information to capture them but ensure these
needs are actually in demand by the population of interest
and only missing because the survey did not capture them
Are the expenditures that are typically trickier to capture
well reflected and are the reference cohortrsquos expenditures
on them adequate from a rights-based perspective
For example if education expenditures are completely
inadequate for the reference cohort (and this is not because
the reference cohort selected is ldquotoo poorrdquo) consider using
rights-based information to capture them eg by using the
cost of school fees or school supplies like books or
uniforms
Be particularly careful with the inclusion of needs where the
supply of goods or services is far from adequate or may be
inexistent The MEB needs to ultimately reflect consumption
behaviour so adding goods or services that are not
available to the population of interest or not in demand
will lead to an unrealistic MEB
When starting with the construction ofrights-based MEB
Are the identified needs in line with the actual
consumption patterns of the population of interest
Check the reference baskets against any available
information on demand and consumption and adjust items
and quantities to reflect actual consumption patterns This
could be done using data on consumption shares by food
group and non-food group for example
Are there needs that people consider essential and choose
to spend resources on but are not captured by any sector
Check the reference baskets against any available
information on demand and consumption and adjust items
and quantities to reflect actual consumption patterns
The key to constructing a hybrid MEB lies in triangulating
information and asking the right questions during the
analysis When constructing a MEB consider the following
27
Minimum Expenditure Baskets Guidance Note | December 2020
Box 17 contains examples of hybrid MEBs constructed in different contexts
COUNTRYEXAMPLE
HYBRID MEBS IN URBAN SETTINGS IN KINSHASATHE DEMOCRATIC REPUBLIC OF THE CONGOAND FOR SYRIAN REFUGEES IN TURKEY
Box 17
For the MEB calculated as part of an urban assessment in Kinshasa43 a hybrid approach was chosen to deal with
hard-to-capture but essential expenditures such as health and education Health costs are often difficult to estimate as they
are not regular and when they do occur they often make up a large share of monthly expenditures The analysts decided to
estimate health costs through a rights-based approach instead of using expenditures from the survey Qualitative
information from key informants was used to define the cost of one doctorrsquos visit per year for each household member In
each commune the median cost was between CDF5000 and CDF6000 per visit this was represented in the MEB as
CDF500 per household member per month Over-the-counter medication was also included as part of health-related
expenditure through the addition of a per-capita expenditure of CDF1500 every two months sufficient for a course of
antimalarial drugs or antibiotics and simple medication such as painkillers or anti-inflammatory drugs
In Turkey expenditure and price data from different sources was used to assess update and adjust an existing
rights-based MEB44 for Syrian refugees living in the country A hybrid food basket was calculated using detailed information
on the consumption behaviour of Syrian refugees in Lebanon collected through itemized receipts from food assistance
e-cards The resulting food basket was triangulated with the less detailed information available from a household survey on
Syrian refugees in Turkey The results showed strong consistency between consumption behaviour of both groups
The resulting food reference basket for the MEB was then priced with official price statistics data and inserted into the
rights-based MEB Quantities of non-food items were kept as before but updated with current price data To ensure that
the MEB reflected consumption behaviour expenditure shares were triangulated with household data See table a
To value and update the MEB price data was required The official price statistics included higher quality items and brands
consumed more by the average Turkish population than by the poorer refugees To correct for this the difference between
the price of the MEB and the food expenditures of a non-poor cohort were assessed and a correction factor applied to
compensate for the overestimation of the updated MEB
Commodity
Table a Food reference basket ndash MEB for Syrian refugees in Turkey
Daily ration perperson in gram
Dailykilocalorie
Old referential food basketDaily ration perperson in gram
Dailykilocalorie
Revised Turkey food basket
150
200
50
20
30
40
20
8
30
30
5
0
0
0
0
540
684
186
29
65
137
0
28
116
265
0
0
0
0
0
100
50
0
70
0
50
30
50
50
25
5
250
50
30
5
Rice white medium grain
Bulghur wheat
Pasta
Egg whole chicken fresh
Poultry
Beans dried
Cucumber
Cheese canned
Sugar
Oil sunflower fortified
Salt iodised
Bread made from wheat
Yoghurt whole milk (leban)
Tomatoes red ripe
Tea black nutrients per 100ml of brewed tea
360
171
0
100
0
170
0
178
194
221
0
675
31
5
0
Total Kcal 2050 Total Kcal 2104
43 WFP et al 201844 WFP 2018
28
Minimum Expenditure Baskets Guidance Note | December 2020
62 Reality checks and validation with stakeholdersIn addition to asking the right questions of the data as
described in the previous section it is crucial to reality check
results when constructing the MEB This means understanding
whether the MEB provides a picture of the cost of living that
matches the reality on the ground
First of all it is important to check the MEB result with the
real circumstances of the population of interest Focus group
discussions andor key informant interviews can be held when
starting work on the MEB and after a result is obtained in
order to ensure that the MEB is a true reflection of needs and
priorities
The MEB figures can be compared with the national poverty
line ndash even if it is not advisable to use the poverty line directly
as the MEB it is good practice to check the MEB results against
it They can also be checked against any social assistance
transfer values provided in government programmes the
minimum wage or the casual labour rate or any other
information available about needs and cost of living For
instance if the MEB is much higher than what the wages
from one month of work for a typical household can buy
that could indicate that it needs adjustment and that some
of the analytical steps need to be revisited ndash as long as the
wage rate itself is reasonable The same goes for the poverty
line ndash if the two are very far apart it could be a sign that the
MEB analysis should be crosschecked Perhaps the reference
cohort was not adequately selected some sectoral needs were
overestimated or there is a large proportion of consumption of
own production has not been properly taken into account
Something that is often of particular interest is the nutritional
composition of the food part of the MEB As seen above MEB
construction typically starts from the Sphere requirement of
2100 kcalpersonday However since the MEB follows the
actual consumption behaviour of the population of interest
(especially when following an expenditure-based approach)
the resulting food basket reflects what households actually
eat which is not necessarily a nutrient adequate diet If the
basket is found to be very low in essential nutrients it could
be that the reference cohort was not well selected and a
wealthier cohort with a more balanced diet at the 2100 kcal
personday threshold might need to be identified45 However
selecting better-off households will not necessarily lead to a
more nutritionally balanced basket as food preferences are
influenced by a range of factors in addition to budget
Analytical tools to determine the cost of nutritious diets
include Cost of the Diet (CotD) developed by Save the Children
UK and used by WFP in the Fill the Nutrient Gap Analysis
CotD uses linear programming to establish the lowest cost
diet that can meet requirements for energy protein fat and
13 micronutrients for individuals in a population considering
age gender body weight physical activity level and whether
a woman is pregnant or breastfeeding CotD can be thought
of as the lowest cost of an optimal diet considering individual
requirements It is therefore useful in illustrating the needs
of vulnerable populations and their nutrient intake barriers
However it is important to keep in mind that a MEB food
basket may not deliver adequate nutrient intake when used
to set a transfer value for households even if aligned with
an optimal diet As noted above because of household
consumption choices and food allocation within households
having more money to spend may not necessarily lead
households to buy more nutritious food
MEBs should be first and foremost built on consumption
patterns that reflect actual behaviour A large difference in
cost between the MEB food basket and CoTD may hence
be driven by factors such as low availabilityhigh cost of
nutritious foods or household preferences The WFP technical
note on Fill the Nutrient Gap and minimum expenditure
baskets offers further insights into the complementarities
of the two analyses and how to use them on conjunction for
programming purposes46 When a MEB is operationalised
additional nutritional considerations could be necessary
It is important to check the MEB result with the real circumstances of the population of interest Focus group discussions andor key informant interviews can be held when starting work on the MEB and after a result is obtained in order to ensure that the MEB is a true reflection of needs and priorities
45 Note that the 2100 kcal Sphere Standard for daily diet is an estimate based on a population average Nutrient needs vary across the lifecycle It is also recommended that a food basket based on the 2100 kcal threshold should include a minimum of between four and five different food groups
46 Also see WFP 2020b
29
Minimum Expenditure Baskets Guidance Note | December 2020
COUNTRYEXAMPLE
TURKEY NON-FOODBASKET MEBCOMPOSITION VERSUSACTUAL CONSUMPTION
Box 18
In the original rights-based MEB constructed for the
Syrian refugee operation in Turkey 17 percent was
devoted to education expenditure The average
education expenditure share in the pre-assistance
expenditure data was under 2 percent with little
variation by household vulnerability status50 The
large expenditure share in the MEB reflects the
costs for transportation to schools in rural areas
where no buses are available and where the only
way for households to send children to school is to
hire private transport In order to provide for
childrenrsquos right to education the transport costs are
counted for in the MEB
Since the MEB was constructed to assure full access
to all rights the high education expenditure was
justified However a comparison of the theoretical
costs for basic needs as estimated by humanitarian
partners and the actual consumption choices of
households can reveal divergence Even if
households are assisted there is nothing to say that
they will actually start hiring private transport to get
their children to school ie the principal ldquoneedrdquo
identified by humanitarian actors will not necessary
translate into effective demand if the MEB is used as
a basis for transfer value calculations While an
important access problem has been identified other
complementary interventions will likely be needed
to address it
depending on the objective of a particular intervention and
the choices targeted households are likely to make regarding
food and nutrition once they receive a transfer Targeted
nutrition interventions may be needed such as providing
certain nutritious foods for specific groups (through in-kind
assistance or commodity vouchers) and social behavioural
change communication to nudge people towards making
better choices for health and nutrition47 Expenditure data can
be helpful to understand the consumption patterns of people
at different points of the wealth distribution Fill the Nutrient
Gap analysis also examines packages of blanket and targeted
household interventions to estimate the most cost-effective
way to address the nutrient requirements of different target
groups For further considerations including complementary
programming please consult the WFP interim guidance on
transfer values48
MEBs are often constructed in an interagency context such
as the Cash Working Group which helps facilitate dialogue
and validation from the beginning of the process However
sometimes not all clusters or key partners are engaged in such
forums which can limit the buy-in and understanding of the
MEB unless there is adequate consultation It is also essential
to consult government stakeholders and development
partners Endorsement by government counterparts could be
needed if there are existing government safety nets or policies
regarding minimum wages For example if the population of
interest for the MEB are refugees or IDPs and a transfer value
based on the MEB is higher than the social assistance provided
by the Government to the resident population this could be a
point of contention Development partners might also wonder
why a MEB is needed in addition to the national poverty line
Dialogue and validation of the final MEB with partners is
therefore vital49
47 The Fill the Nutrient Gap (FNG) analysis of which CotD is often part can help understand what programming might be needed and how interventions can be combined to improve dietary intake and reach food and nutrition objectives
48 WFP 2020c49 The Cash Learning Partnershiprsquos MEB Tip Sheet contains useful advice on the interagency processes around constructing a MEB Baizan and Klein 201950 Hobbs 2016 and WFP 2018
30
Minimum Expenditure Baskets Guidance Note | December 2020
Naturally the needs of a household increase with the size of
the household How can the different magnitude of needs
for households of different sizes be taken into account when
constructing the MEB
One simple approach is to calculate the per capita MEB
and simply scale it up for households of different sizes For
example if the MEB is constructed for a household of six and
equals USD 120 the per capita MEB would be USD 20 USD and
the MEB for a household of three people would be USD 60
However this proportional scaling ignores one important
factor while the needs of a household grow with each
additional member the increase may not be proportional
This is because some goods consumed within a household
such as food are ldquoprivateldquo in character ndash once a person has
consumed it no one else can consume the same ndash while other
goods such as housing are ldquocommonrdquo or ldquopublicrdquo meaning they
can be shared among household members Hence the needs
for housing space or electricity are not necessarily three times
higher for a household with three members than for a single-
person household This is called economies of scale Changes
in household composition can also influence how needs
grow with household size consider large households with
many children who do not have the same needs as adults
Economies of scale are particularly relevant in contexts where
shared goods constitute a major part of household essential
needs for example where rent payment is a large expense A
one-bedroom apartment may be necessary for a one-person
household but could also possibly house a family of three
who would then share the expenditure When in a context of
large economies of scale the MEB is adjusted to household
size by scaling up average per capita needs proportionally
to household size the resulting MEB will underestimate
the needs for small households and overestimate the
needs for large households by construction This is because
the per capita needs for small households are larger than
this simple scaling reflects This can have implications if the
per capita MEB is used to inform targeting or transfer value
calculations For instance if the needs of smaller households
are underestimated they are more likely to be miscategorized
as being able to meet their essential needs and might therefore
not receive the assistance they require
7 Accounting for household composition and economies of scale
Expenditures
Household sizeno economies of scale expenditures proportional to household sizeeconomies of scale expenditures non-proportional to household size
1 2 3 4 5 6 7 8 9 10
EXPENDITURES PER CAPITA
Figure 3 Economies of scale and expenditures per capita ndash illustration of the concept
31
Minimum Expenditure Baskets Guidance Note | December 2020
In other contexts economies of scale might be smaller
because of the higher relative importance of ldquoprivaterdquo goods
such as food and certain non-food items (for example soap)
or if shared costs such as shelter are not prominent How
household size is catered for in the MEB ultimately depends
on context and how needs are related to household size
Some suggested steps to account for economies of scale and
household composition are listed below
When examining how to account for different household
sizes in the MEB start by ascertaining whether economies
of scale exist and to which extent51 Figure 3 provides a
hypothetical illustration of two extreme cases no economies
of scale at all and strong economies of scale If there are no or
little economies of scale the per capita expenditures will be
very similar across household sizes while they will decrease
by household size if economies of scale are present52
Plotting per capita expenditures against household size
helps enable for this type of examinations It can be useful
to further disaggregate the analysis into different categories
(for instance food non-food or shelter expenditures per
capita) to understand which expenditures might be driving the
economies of scale if present
Box 19 illustrates two different country examples
expenditures by household size for Syrian refugees in
Lebanon and for vulnerable populations in Coxrsquos Bazar
Bangladesh In Lebanon where shelter plays an important
role household expenditures double only at a household size
of 5 and they triple at a household size of 11
COUNTRYEXAMPLE
ECONOMIES OF SCALE INLEBANON AND COXrsquoS BAZAR
Box 19
Figure a shows expenditures by household size compared to one-person households For Syrian refugees in Lebanon
average expenditure doubles only when the household size reaches five and it takes 11 members to triple the expenditures
of a one-person household The economies of scale are therefore large primarily due to the importance of shelter costs for
the refugees
In Coxrsquos Bazar in contrast total expenditures grow almost proportionally with household size (double at a two-person
household triple at a three-person household) Slight economies of scale can be seen for food For non-food expenditures
larger households even spent more per person From this data the economies of scale seem to be small
Figure a Increase in household expenditure by household size comparedto one-person households
Multiplicationfactor
Household sizeHousehold size
100
90
80
70
60
50
40
30
20
10
Coxrsquos Bazar (Bangladesh)Lebanon
1 2 3 4 5 6 7 8 9 10 11
Total Food Non-food
1 2 3 4 5 6 7 8 9 10 11
Note Figure based on authorsrsquo calculations Data from the Vulnerability Assessment of Syrian Refugees in Lebanon (VaSyr) 2017
and the Refugee influx Emergency Vulnerability Assessment (REVA II) 2019
51 Expenditure data is required to perform this analysis If no information on expenditure exists information on how needs change with household size can be collected through qualitative means such as focus group discussions or key informant interviews
52 Theoretically it is possible to also analyse expenditures by household composition but sample sizes rarely allow for such detailed disaggregation
32
Minimum Expenditure Baskets Guidance Note | December 2020
If the analysis reveals small economies of scale or none at all it is reasonable to use a per capita approach to scale up the MEB proportional to household size
Even for food strong economies of scale can be detected
which could be a result of large households being able to
buy food in bulk at a lower price However in Coxrsquos Bazar
where shelter and other shareable non-food goods are of less
importance household expenditures are close to proportional
to household size
If the analysis reveals small economies of scale or none at all
it is reasonable to use a per capita approach to scale up the
MEB proportional to household size If significant economies
of scale are present it is important to think about how to
take this into account when constructing the MEB Here are
some suggestions
One possible solution (in the expenditure-based
approach) is to disaggregate (or re-select see below)
the reference cohort for each household size sub-
sample and using the expenditures for each of these
cohorts construct specific MEBs for each household
size53 This approach takes into account economies of
scale by looking directly at the specific needs of different
size households but only reflects average differences
in household composition within each household size
The approach will most likely suffer from very small
sample sizes once analysis needs to be performed by
household size If this is the case household sizes could
be grouped into categories so that the analysis uses sub-
samples eg for household sizes 1ndash2 3ndash5 and 6ndash8 etc
or other groupings meaningful for the context When
following this approach bear in mind that if the reference
cohort is selected based on expenditure distribution
characteristics such as the removal of extreme deciles or
quintiles this procedure of removal of quintiles or deciles
needs to be repeated within each household size (or
household size group) Otherwise if there are economies
of scale for consumption there is a risk of skewing the
sample against the smallest and largest households
because their per-capita expenditures will be at the
extreme ends of the expenditure distribution
Another solution is to divide the MEB content into
ldquoprivaterdquo (non-shared) and ldquopublicrdquo (shared) consumption
For example food could be non-shared and rent and
fuel shared Examine the MEB expenditures for the
non-shared and shared goods for an average sized
household (or for household sizes around the average
for instance 4ndash6 members in order to leverage a larger
share of the sample) The non-shared value can then be
scaled proportionally to household size while the shared
value is held constant across household sizes This way
the resulting MEB consists of a lsquoflatrsquo and a proportional
element54 This is a relatively crude but intuitive way to
approximate economies of scale Figure 4 provides a
simple illustration of this approach
In the literature on poverty the most common solution
used to adjust for economies of scale and difference
in household composition is to use adult equivalents
instead of per capita numbers These equivalence scales
assign an ldquoadult equivalent numberrdquo to each household
depending on its size and composition taking into
account economies of scale as well as the different needs
of children and adults ie household composition For
example the first adult in the household is counted
as 1 and each additional adult as for example 07 A
child under 15 is counted as a fraction of an adult (eg
05) The effective adult equivalent household size is
then the sum of these adult-equivalent fractions55 Next
total household expenditures are divided by the adult
equivalent household size The MEB is then calculated
using these adjusted per-adult-equivalent expenditures
While this is not necessarily a complicated approach
from an analytical point of view equivalence scales can
53 See Lanjouw (1998) on the construction of poverty lines specific to household size (and composition)53 Alternatively the flat element can also be lsquosemi-flatrsquo and set according to household size groups ndashby examining shared costs and applying the same flat value within eg household size groups 1-2 3-5 6-8 or other
groupings as dictated by the context 53 One common equivalence scale is the OECD scale it assigns the weight 1 to the household head 07 to all additional adults and 05 to all children A household with five people say two adults and three children
consists of 32 adult equivalents (1+07+05+05+05) This is a common scale used in many developing and developed countries Another common scale is to give weight 1 to each adult and different weights to children depending on their age For the official poverty line in Zambia the following weights are given to children 0ndash3 years 036 4ndash6 years 062 7ndash9 years 076 and 10ndash12 years 078
33
Minimum Expenditure Baskets Guidance Note | December 2020
MEB - COMBINING FLAT ANDPROPORTIONAL ELEMENTS -ILLUSTRATION
MEB value
Household size
1 2 3 4 5 6 7 8 9
140
120
100
80
60
40
20
0
Proportional element - non-shared part of MEB
Flat element - shared part of MEB
MEB value per capita
Figure 4 Combining flat and proportional elements in the MEB
prove challenging when operationalising the MEB If
equivalence scales are used in constructing the MEB they
will also need to be applied when measuring household
expenditures compared with the MEB for gap analysis
against the MEB and in monitoring Translating the
concept of equivalence scaling into operational decision
making may therefore prove tricky Additionally results
can be quite sensitive to the choice of equivalence scales
so selecting appropriate scales is important yet often not
straightforward and a range of different scales exist56 In
some countries country-specific equivalence scales may
have been devised for the purpose of the calculation of
the national poverty line
No matter the approach the recommendation is always
to leverage data analysis as much as possible in order
to understand how needs evolve with household size
(and possibly composition) while keeping in mind that
the final MEB needs to be operationally relevant
Particularly in the (common) cases where MEBs are
used to calculate household transfer values it is worth
considering what level of analytical granularity can
feasibly be turned into programmatic action In some
cases it may not be operationally possible to handle
different per-capita size transfers for differently sized
households and the extra effort of achieving accurate
MEB figures by household size may not be worth it
The same general recommendation as for all aspects
of MEB construction also applies here the final result
should be realistic a fair depiction of needs and an
operationally relevant product
56 See for instance httpwwwoecdorgeconomygrowthOECD-Note-EquivalenceScalespdf
34
Minimum Expenditure Baskets Guidance Note | December 2020
A SMEB can be expenditure-based or rights-based or a hybrid of the two approaches depending on data availability and programmatic requirements
The SMEB is the absolute minimum amount required to maintain existence and cover lifesaving needs which could involve the deprivation of certain human rights
A survival minimum expenditure basket (SMEB) is often
constructed alongside a MEB While the MEB is defined as
what a household requires in order to meet their essential
needs on a regular or seasonal basis and its average cost the
SMEB is the absolute minimum amount required to maintain
existence and cover lifesaving needs which could involve the
deprivation of certain human rights However the concepts
of SMEB and MEB have not always been used consistently
by the humanitarian community and are sometimes used
interchangeably It is therefore important to be clear from the
outset of the analysis whether a MEB or a SMEB is the goal
A SMEB can serve at least two purposes First together with
the MEB it can be used to classify households into different
categories of economic capacity to meet their needs whereby
households whose expenditures fall below the SMEB have
highly insufficient economic capacity households between the
SMEB and the MEB have insufficient economic capacity and
households above the MEB have sufficient economic capacity
This information can then be used for profiling people in need
prioritizing beneficiaries or monitoring Second the SMEB
can inform programmatic decisions such as transfer values in
situations where immediate lifesaving assistance is required
The approaches presented here follow the MEB methods
adjusted to suit the different purpose of the SMEB
Accordingly a SMEB can be expenditure-based or rights-
based or a hybrid of the two approaches depending on data
availability and programmatic requirements
8 How to construct a SMEBExpenditure-based approach toconstructing a SMEBThe calculation of an expenditure-based SMEB is closely aligned
with the literature on how to estimate national poverty lines
While the MEB corresponds to an ldquoupperrdquo poverty line a ldquolowerrdquo
extreme or austere poverty line is often defined by taking the
food part of a MEB and adding this to the non-food needs
regarded as the essential minimum for household survival57
But how are survival non-food needs defined based on
expenditure data When people receive assistance it is
sometimes observed that households sell part of their food
rations to cover some non-food items These households forgo
some of the required food intake in order to cover what they
regard as survival non-food needs Using expenditure data to
construct a SMEB a similar idea is explored to calculate the
SMEB analysts identify those households whose total food AND
non-food expenditures are approximately equal to the MEB food
basket amount only In order to access non-food items these
households will compromise their food intake to some extent
because their total expenditures would only be enough to cover
their essential food requirements ie the food MEB anything
spent on non-food items means that they are not meeting their
essential food requirements It is therefore fair to assume that
the amount they choose to spend on non-food items must
be regarded by the households as absolutely necessary The
non-food expenditures of these households can therefore be
considered as the survival non-food needs The SMEB is then
calculated by adding these survival non-food expenditures
to the food MEB This SMEB allows households to meet their
essential food needs and their survival non-food consumption
Note that this approach requires a food MEB figure (either
already available or calculated as part of the SMEB analysis)
57 See Lanjouw 1998 and Haughton and Khandker 2009
35
Minimum Expenditure Baskets Guidance Note | December 2020
The steps for constructing an expenditure-based SMEB are
similar to those taken to construct a MEB with the following
additional considerations
1 Prepare expenditure data the expenditure data source can
be the same as that used for the MEB
2 Select the reference cohort this step is different The cohort
is selected by computing total household expenditures
and comparing them to the food MEB Households with
total expenditures equal to (or in an interval around) the
food MEB are selected as the SMEB reference cohort
3 Establish food basket and 4) Establish non-food basket
Using the SMEB reference cohort start by examining
how much these households spend on non-food items
Add this value to the MEB food value to arrive at the total
value of the SMEB To establish a food and non-food
basket there are two options i) use the MEB food basket
as the SMEB food basket and the non-food expenditures
of the SMEB reference cohort as the non-food basket
or ii) look at a third cohort of households namely those
whose total expenditures are around the just established
total SMEB level examine their food and non-food
expenditures and unpack those into food and non-food
baskets While both options will provide the same overall
value of the SMEB they will differ in composition and the
share of foodnon-food expenditures
Annex 2 provides an illustration of this method of constructing
a SMEB
Rights-based approach to constructing a SMEBThe rights-based approach to constructing a SMEB closely
follows the rights-based approach to constructing a MEB The
main difference is that needs and the items and quantities
included should be restricted to what is regarded as absolutely
necessary for survival ndash which can be challenging to define
This applies to both the food basket and the non-food
basket The MEB can be a starting point if there is one or
the Sphere Standards Sometimes rights-based SMEBs have
been constructed based on a MEB but with lower quantities
for certain items or by keeping some needs while removing
others
Hybrid SMEBs and reality checking resultsAs with MEBs it can be advantageous to combine the
expenditure-based and rights-based approaches to create
a hybrid SMEB The guiding principles are the same as for
the MEB with the difference that the resulting SMEB should
continue to contain nothing but the minimum required for
survival
The same logic applies to the ldquoreality checkrdquo of the SMEB
results as for the MEB it is crucial to ensure that the end
result is realistic and operationally relevant bearing in mind
the conceptual difference between the MEB and the SMEB It
is important to consult the population of interest as much as
possible to understand their views on what constitutes the
bare minimum needed by households to maintain existence
and cover lifesaving needs
COUNTRYEXAMPLE
RIGHTS-BASED SMEBS Box 20
In Lebanon health and education are excluded
from the rights-based SMEB while other needs are
covered with smaller amounts than in the MEB For
example the SMEB has a less diverse food basket
than the MEB58
In Syria the SMEB developed for the northern part
of the country includes food kerosene hygiene
products water and a small amount to cover other
survival goods Rent and utilities are not covered59
58 El Koury and Hajal 201659 Cash Based Responses Technical Working Group Syria 2014
36
Minimum Expenditure Baskets Guidance Note | December 2020
COUNTRYEXAMPLE
HYBRID SMEBs Box 21
For the MEB review in Lebanon for Syrian refugees60 a hybrid SMEB approach was chosen First an expenditure-based
SMEB was used calculating the non-food expenditures of households whose total expenditures equalled the food MEB
and adding this to the food MEB This resulted in very low expenditures on shelter (SMEB A) Due to the importance of
shelter in urban settings a second hybrid version was established calculating the non-food expenditures of households
whose total expenditures equalled the sum of the food MEB plus a rights-based value of a tent as survival shelter the cost
of which came from a rights-based SMEB (SMEB B)
Cohort HH size 4ndash6quint 2ndash4 acceptable FCS
n=923
Cohort total expenditure= food MEB
n=923210
Cohort total expenditure= food MEB + tent value
n=923210
SMEB Afood + survivalnon-food
Hybrid SMEB
437
83
40
93
20
16
29
19
314
1033
437
43
18
37
06
04
17
60
621
437
47
24
42
11
06
20
162
750
Food
Utilities (water gas fuel electricity)
Non-food items (hygiene clothing)
Health
Education
Transport
Communication
Other expenditures
Shelter
Total (USD)
Table a Hybrid SMEB for Syrian refugees
SMEB Bfood + survivalnon-food amp tent
In the Kinshasa urban assessment61 a SMEB was established in addition to the MEB comprising a basket of the most
essential items based on expenditure data used for the MEB For the food SMEB a less diverse diet was established by
excluding certain food items from the food MEB and rescaling the resulting basket to 2100 kcal For the non-food
component the only items included were those that were seen as critical to attaining the most basic standards for safety
food preparation water sanitation and hygiene These consisted of water cooking fuel hygiene products and lighting The
value for these items in the SMEB was derived from the median expenditures of the non-poor cohort
Expenditure-basedMEB
Expenditure-basedSMEB
60 Hohfeld et al 2020 61 WFP et al 2018
37
Minimum Expenditure Baskets Guidance Note | December 2020
91 Adjustment for seasonal or regional price differencesIf the MEB will only be used in one area where prices are
relatively homogenous it is often not necessary to adjust for
regional price differences However if the MEB is intended
for use across different urbanperi-urban andor rural
areas throughout the country it could be vital to adjust for
differences This means that the MEB can be priced differently
for different regions or rural or urbanperi-urban areas (or any
other division of areas that makes sense in relation to price
behaviour) There are a few approaches for this
Price the MEB based on available price data for different
regions or urbanrural areas For the food reference
basket this is most often possible using WFP food prices
or other similar price time series For non-food items
including housing utilities and services this can be more
challenging and may rely on price data collection by
different partners or require new data collection
For some countries price data provided by the national
statistical office is useful In the case of Turkey regional
purchasing power parity indices were used to provide
price estimates for components of the MEB for which
direct price information was not available
Use approximations from expenditure data If the
household survey has sufficient regional coverage the
expenditure levels in different regions can be explored
using the cohort of households just above the poverty
line Care should be taken in using this method
particularly if the sample size by region is very small
9 Additional considerations when constructing MEBs
92 Needs that vary by season or areaIn many countries where WFP works household needs change
with the seasons For instance in Turkey where winters are
cold households have additional needs for heating and warm
clothes to survive In other contexts there are significant
differences in needs between lean and rainy seasons These
changing needs could be a reason to construct different MEB
reference baskets to use at different times during the year or
to design seasonal top-ups In the case of items needed for cold
winters this is often referred to as ldquowinterizationrdquo
While this does not influence the approach used to construct
the MEB it does mean that analysts need to consider when
the data used in its construction was collected and whether
this influences the resulting MEB These considerations also
matter when using the MEB for monitoring if a monitoring
expenditure survey is used to analyse whether peoplersquos
expenditures are above or below the MEB threshold but
the survey is undertaken when prices are high or when
winters are cold if the MEB is not adjusted the results will
probably show a decrease in the percentage of people whose
expenditures are below the MEB as households have higher
needs andor are confronted with higher prices and thus
have higher expenditures without in reality being better off
In Turkey it was estimated that household needs during the
winter would result in a 48 percent increase in minimum
expenditures
In other cases different baskets might be necessary
for different areas of the country eg rural and urban
areas While the MEB should be constructed for a relatively
homogenous population it may sometimes be desirable to
construct a MEB covering all or most of a country where
consumption patterns vary substantially In this case it is
worth considering whether (some elements of) the MEB should
be different between areas Again the selected approach to
construct the MEB should not change but analysts need to
check where the data used in its construction was collected
and whether consumption patterns are very different between
different regionsareas For example in the case of Somalia
the main cereal consumed varies significantly between the
north and the south of the country so the MEB uses different
main cereals in the food reference basket according to region
While the MEB should be constructed for a relatively homogenous population it may sometimes be desirable to construct a MEB covering all or most of a country where consumption patterns vary substantially
38
Minimum Expenditure Baskets Guidance Note | December 2020
Constructing a MEB can be challenging in a sudden onset
emergency or if data is scarce or unavailable Below are some
ideas on how this can be resolved However from a ldquodo no
harmrdquo perspective it is important to emphasize that proxies
should only be used in the interim when no other solutions are
available
Use the national MEB or MEB reference basket If survey
data is not directly available and if the population of
interest is part of and similar to the overall population of
the country the national MEB or MEB reference basket
used for the national poverty line can be used if available
Bear in mind however that this basket should be used on
the condition that it corresponds to data that WFP collects
or has access to through partners or the Government to
ensure that monitoring can be conducted against the MEB
In its most basic form a MEB essentially only requires an
approximate value for the food basket and an estimate
of the average expenditure share that households use
on food Even if no relevant survey data is available this
information should be available to a country office or can
rapidly be collected or approximated
Consider using the minimum wage as a proxy Bear in
mind that while the MEB captures household-level needs
the minimum wage is individual-level income so an
assessment of how many minimum wages are needed per
household depending on the household size is required
It is also advisable to find out how the minimum wage has
been constructed
Ultimately a MEB is a good preparedness measure and should
be constructed before an emergency While both prices and
availability will be affected by an emergency it is still likely to
provide a useful starting point
11 Monitoring and updating the MEB111 Monitoring the cost of the MEBTo be operationally useful the MEB must be tracked and
updated over time to account for price changes If inflation is
high this might have to be done every month if it is low as
little as once a year could be sufficient This should be planned
for when the MEB is constructed to ensure that the costs of the
MEB components can be updated
There are different ways to update the MEB with price changes
If a reference basket is adequately defined (for food
and for non-food items) and prices are collected for the
individual items in the basket by WFP or its partners the
MEB can be priced anew using the updated prices for
each item and multiplying them by the quantities in the
reference basket
A simple solution is to adjust the MEB using the
nationalsub-national CPI or its components This
simply involves updating the cost of the MEB with
the increase (or decrease) in the CPI for the period
in question However in some contexts CPIs are not
updated or relevant for the target population Urban
areas are often over-represented in the national CPI on
the other hand prices and costs faced by for example
displaced populations can be very different from national
price levels In contexts of poverty where food constitutes
a large part of household expenditures the evolution of
food and fuel prices is central when it comes to capturing
price changes
If a CPI does not exist or is not considered applicable
a price index for key consumption items can be
constructed using price data collection for food items
and basic non-food items conducted by WFP andor
other agencies this can then be used to update the cost
of the MEB In contexts where shelter is a major part of
household expenditures changes in shelter costs should
also be captured
10 How to find a proxy for a MEB when data or time is insufficient
39
Minimum Expenditure Baskets Guidance Note | December 2020
112 When to construct a new MEBThe composition of MEB reflects consumption patterns
It is recommended as much as possible keeping the MEB
composition constant and only monitor how cost changes
over time However when there is reason to believe that
consumption patterns of the population for whom the MEB
is constructed has significantly changed it is time to review
its composition and possibly reconstruct the MEB to reflect
these changes
What could suggest such consumption changes have
occurred The figure to the right summarises some typical
events that could result in a significant change in household
consumption Shocks eg a natural disaster might create
additional needs if livelihoods are disrupted or living
conditions are altered Significant changes to the prices of
key consumption items can also alter consumption pattens
insofar it pushes households to substitute certain items
for other items (be aware however that reconstructing
the MEB would only be advisable if the substitution is not
just temporary) Population changes such as an influx of
displaced people or other events that changes the population Figure 5 Possible triggers for MEB composition review
Has a shock occured creating
different or additional needs
Have costs changed significantly
between key consumption items so
that households have substituted
consumption patterns
Has there been a change in
population - eg a displacement
Has the supply side or service
provision changed leading to a
change in household consumption
Shock
Substitution
Population
Supply
composition in the area that the MEB is constructed for
could also lead to a review Finally if supply of essential
goods and services changes this may also shift household
consumption eg if health services are made free of charge
and no longer require households to pay for them
40
Minimum Expenditure Baskets Guidance Note | December 2020
CaLP The Cash Learning Partnership
CBT cash-based transfers
CotD Cost of the Diet [approach]
CPI consumer price index
FCN-N food consumption score ndash nutrition
FCS food consumption score
FNG Fill the Nutrient Gap
HEA household economy approach
LSMS Living standard measurement survey
MEB minimum expenditure basket
OCHA United Nations Office for the Coordination of Humanitarian Affairs
REVA II 2019 Refugee Influx Emergency Vulnerability Analysis
SDG Sustainable Development Goal
SMEB survival minimum expenditure basket
UNHCR Office of the United Nations High Commissioner for Refugees
VAM Vulnerability Analysis and Mapping
WFP World Food Programme
WHO World Health Organization
Abbreviations
41
Minimum Expenditure Baskets Guidance Note | December 2020
Deaton and Grosh 2000 ldquoConsumptionrdquo in Designing Household Survey Questionnaires for Developing Countries Lessons from Ten
Year of LSMS Experience httpsscholarprincetonedudeatonpublicationsconsumption
Deaton and Zaidi 2002 Guidelines for Constructing Consumption Aggregates for Welfare Analysis LSMS Working Paper no 135
httpsopenknowledgeworldbankorghandle1098614101
The Cash Learning Partnership (CaLP) Glossary of terminology for cash and voucher assistance
httpswwwcalpnetworkorglearning-toolsglossary-of-terms
Cash Based Responses Technical Working Group Syria 2014 Northern Syria Survival Minimum Expenditure Basket Guidance
Document httpswwwhumanitarianresponseinfositeswwwhumanitarianresponseinfofilesdocumentsfilesnorthern_
syria_smeb_guidance_document_dec_2014pdf
Cash Working Group Nigeria 2018 Minimum Expenditure Basket for North East Nigeria ndash Justification and recommendations Draft
report httpswwwhumanitarianresponseinfositeswwwhumanitarianresponseinfofilesdocumentsfilesmeb_justification_
guidelinespdf
Baizan and Klein 2019 Minimum Expenditure Basket (MEB) Decision Making Tools The Cash Learning Partnership httpswww
calpnetworkorgpublicationminimum-expenditure-basket-meb-decision-making-tools-2
El Koury and Hajal 2016 MEB and SMEB revision Community Consultation Lebanon Cash Consortium httpsreliefwebintsites
reliefwebintfilesresourcessmeb-fgd-report-final-1pdf
Geniez Mathiassen de Pee Grede and Rose 2014 ldquoIntegrating food poverty and minimum cost diet methods into a single
framework A case study using a Nepalese household expenditure surveyrdquo in Food and Nutrition Bulletin vol 35 no 2 https
journalssagepubcomdoi101177156482651403500201
Haughton and Khandker 2009 Handbook on Inequality and Poverty The World Bank httpsopenknowledgeworldbankorg
handle1098611985
Hobbs 2016 MEBSMEB calculation for Syrians living in Turkey Report commissioned by the Cash-Based Interventions Technical
Working Group in Turkey httpsdata2unhcrorgendocumentsdownload57031
Hohfeld Papavero Sandstrom Dalbai and Renk 2020 Minimum Expenditure Basket for Syrian Refugees in Lebanon ndash Rights-based
versus Expenditure Based Approaches WFP httpsreliefwebintsitesreliefwebintfilesresources76229pdf
Inter-Agency Network for Education in Emergencies (INEE) Minimum Standards for Education Handbook Preparedness Response
Recovery httpsineeorgstandards
Jolliff and Prydz 2016 Estimating International Poverty Lines from Comparable National Thresholds World Bank Policy Research
Paper 7606 httpsopenknowledgeworldbankorgbitstreamhandle1098624148Estimating0int00national0thresholdspdf
Lanjouw 1998 Demystifying Poverty Lines World Bank
Ravallion 1994 ldquoPoverty Comparisonsrdquo in Fundamentals of Pure and Applied Economics 56
Republic of Zambia Central Statistical Office 2016 2015 Living Conditions Monitoring Survey (LCMS) Report httpswwwzamstats
govzmphocadownloadLiving_Conditions201520Living20Conditions20Monitoring20Survey20Reportpdf
Save the Children UK 2018 Basic Needs Assessment Guidance and Toolbox Part I Background and Concepts httpsreliefwebint
reportworldbasic-needs-assessment-guidance-and-toolbox
Sphere Standards Handbook Humanitarian Charter and Minimum Standards in Humanitarian Response 2018 edition httpswww
spherestandardsorghandbook
UNHCR CaLP Danish Refugee Council OCHA Oxfam Save the Children and WFP 2015 Operational Guidance and Toolkit for
Multipurpose Cash Grants httpswwwcalpnetworkorgwp-contentuploads202001operational-guidance-and-toolkit-for-
multipurpose-cash-grants-webpdf
References
42
Minimum Expenditure Baskets Guidance Note | December 2020
WFP 2004 Sampling Guidelines for Vulnerability Analysis Thematic guidance httpsdocumentswfporgstellentgroupspublic
documentsmanual_guide_procedwfp197270pdf
WFP 2008 Food Consumption Analysis Calculation and use of the Food Consumption Score in food security analysis https
documentswfporgstellentgroupspublicdocumentsmanual_guide_procedwfp197216pdf
WFP 2015 Food Consumption Score Nutritional Analysis (FCS-N) Guidelines httpswwwwfporgpublicationsfood-consumption-
score-nutritional-quality-analysis-fcs-n-technical-guidance-note
WFP 2018 Revising the Food Basket and Minimum Expenditure Basket Analysis to calculate a realistic cost of living for refugees in
Turkey httpsreliefwebintreportturkeyrevising-food-basket-minimum-expenditure-basket-analysis-calculate-realistic-cost
WFP 2019 Refugee influx Emergency Vulnerability Assessment ndash Coxrsquos Bazar Bangladesh httpsreliefwebintsitesreliefwebintfiles
resourcesWFP-0000106095pdf
WFP 2020a Essential Needs Assessment Guidance note httpswwwwfporgpublicationsessential-needs-guidelines-july-2018
WFP 2020b Technical Note Fill the Nutrient Gap and Minimum Expenditure Basket An explanation of approaches and identification of
synergies httpsdocswfporgapidocumentsWFP-0000116644download
WFP 2020c Setting the transfer value for CBT interventions Transfer Value Interim Guidance httpsdocswfporgapi
documentsWFP-0000117963download
WFP global Food Security Cluster and Food Security Cluster for the Democratic Republic of the Congo 2018 Adapting to an Urban
World Urban Essential Needs Assessment in the five communes of Kimbanseke Kinsenso Makala Nrsquosele and Selambao (Kinshasa)
httpswwwwfporgpublicationsdemocratic-republic-congo-urban-essential-needs-assessment-five-communes-kimbanseke-
kinsenso
World Health Organisation and Global Health Cluster ndash Cash Task Team 2020 Technical Note on the Inclusion of Health
Expenditures in the Minimum Expenditure Basket and Subsequent Multi-purpose Cash Transfer httpswwwcalpnetworkorg
publicationinclusion-of-health-expenditures-in-the-meb
43
Minimum Expenditure Baskets Guidance Note | December 2020
Survivalnon-foodexpenditure
TOTALEXPENDITURE
FOODEXPENDITURE
MEBnon-foodexpenditure
EXPE
ND
ITU
RE
CONSUMPTION
SMEBAusterepoverty line
Essential foodneeds (MEB)
Acceptable food consumption(based on FCS)
Food expenditure for HHwith tot exp at essential
food needs (MEB)
Analysts should always ensure that the expenditure data is properly cleaned and outliers removed and that it is converted into
the same recall period (food and non-food items usually have different recall periods)
Expenditures should be calculated into per capita figures (eg by dividing total household expenditures by household size) in
order to make them immediately comparable across households (or per adult equivalent see section 7 on how to account for
economies of scale and household composition)
Before starting the MEB analysis it is highly recommended to carry out some simple descriptive analysis of the expenditure
data in order to understand it Analyse the mean and median expenditures for the sample This will help understand the
distribution of the expenditures and detect possible issues While the median is more robust to outliers if a large part of the
sample has 0 expenditures on a particular item the median could be 0 and may therefore not be the best estimate of the need
In this case the mean may be preferable A frequency analysis of non-zero expenditures by groupitem can also be helpful in
understanding whether certain expenditures are infrequent or lumpy
Annex 1 - Good practice when analysing expenditure data
Figure based on Lanjouw 1998 Demystifying poverty lines and World Bank and Ravallion 1994 ldquoPoverty comparisonsrdquo in
Fundamentals of Pure and Applied Economics 56
Annex 2 - The expenditure-based SMEB ndash an illustration

7
Minimum Expenditure Baskets Guidance Note | December 2020
THE MEB TO-DO LIST DEPENDING ON CONTEXTALSO CONSIDER
Identify key partners and stakeholders and decide on objectives and process
Construct the food basket
Construct the non-food basket
Reality check results and validate with stakeholders
Determine the analytical starting point (eg examine national poverty lines set the population of interest check what data is available) and decide on approach
Accounting for household size and composition
Adapting the MEB to different needs across regions or seasons
Adjusting the MEB for regional or urbanrural price differences if significant
HOW TO
Box 1MEB
3 How to construct a MEB generic steps
11 This is in line with the cost of basic needs approach widely used for poverty lines as described in previous sections
A MEB is constructed by estimating the cost of acquiring
adequate food and adding the cost of other essential non-
food expenditures11 The box below shows the steps that are
always part of constructing a MEB
The two principal methods for constructing MEBs are
the expenditure-based approach and the rights-based
approach Sections 5 and 6 describe these approaches
and how to combine elements of both to apply a hybrid
approach
Regardless of approach it is crucial to arrive at a realistic
relevant and operational MEB that is rooted in
consumption behaviour ndash section 6 also looks at how to
ensure this Before going into the details of construction the
next section outlines the key questions to ask before starting
the MEB analysis
8
Minimum Expenditure Baskets Guidance Note | December 2020
Before embarking on the construction of the MEB
components consider the following questions to decide how
best to approach the analysis
What is the objective and whowill be the partnersStart by setting the objective and consider what the MEB will
be used for once the analysis is finished If the MEB analysis
is a joint exercise identify potential partners possibly in
interagency working groups such as a cash working group find
out what kind of information various organizations can share
and decide on the division of labour In some cases it can be
helpful to write terms of reference for the MEB analysis in
order to clarify the envisioned process and methodology Even
if the MEB analysis will be conducted by just one agency it is
always a good idea to identify partners who will be interested in
the results and who can be consulted along the way12
Who is the MEB being constructed forIt is important to define the population of interest for the
MEB Is it intended to be valid for the entire country Or will it
only be used in a refugee camp for example or a particular
region where needs might differ from those in the rest of
the country It is vital to decide from the start where and for
whom the MEB should apply Since the MEB describes the
cost of essential needs the population for whom the MEB
is constructed should ideally have relatively homogenous
consumption patterns and needs If consumption patterns are
very different consider constructing different MEBs or varying
certain components of the MEB for sections of the population
Have any MEBs already been created for the population of interest If there are one or more MEBs already in use the analytical
exercise might be aimed at updating or even ldquoreality
checkingrdquo the existing baskets to see whether they still match
consumption behaviour and price levels If existing baskets
are found to be valid and relevant it might not be necessary
to start a new MEB analysis
4 Before starting the analysis What information and data is already available and is new data neededConsider what data or analysis is already available from
essential needs assessments or other household surveys
(undertaken by WFP or others) Does the data cover the area
and population of interest Also consider what qualitative
information might be available to shed light on certain
expenditure patterns and whether there is access to market
and price information If the data available is insufficient or
outdated plan to collect fresh data A MEB analysis is greatly
strengthened by being conducted as part of a comprehensive
essential needs assessment The assessment describes the
essential needs of the population of interest which is a
useful starting point for a MEB analysis and complements the
monetary perspective provided by a MEB
Can the national poverty line be usedBefore beginning the construction of a MEB it is useful to find
out if a national poverty line exists and how and when it was
constructed Many countries have their own national poverty
lines so why not use this poverty line (and the corresponding
basket) as the MEB Whenever possible the first choice
should be to align with government practices However this is
often not feasible for three main reasons
Practices vary widely when it comes to constructing
national poverty lines Although the most common
approach is the cost of basic needs using MEBs
sometimes poverty lines are set as a share of the
country mean or median income or expenditures or
as a fixed percentage of the income or expenditure
distribution (although this is mostly not the case in low
income countries) Furthermore even when a MEB has
been constructed to develop the poverty line different
methodologies exist For example sometimes countries
exclude non-food items from their poverty line MEB
Since the MEB describes the cost of essential needs the population for whom the MEB is constructed should ideally have relatively homogenous consumption patterns and needs
12 The Cash Learning Partnershiprsquos MEB Tip Sheet contains useful advice on the interagency processes around constructing a MEB Baizan and Klein 2019
9
Minimum Expenditure Baskets Guidance Note | December 2020
Countries can also have different poverty lines for
different purposes and regions13 These factors can all
limit the use of the national poverty line as the MEB
The population of interest for a MEB could differ from the
overall population of the country and hence the national
poverty line This group of people may have different
essential needs for instance if they live in refugee camps
or do not have access to the same services as the resident
population (eg public education)
The data that WFP typically collects through essential
needs assessments comprehensive food security
and vulnerability analyses emergency food security
assessments baseline assessments and post distribution
monitoring is often much less detailed than that gathered
through the household budget surveys or living standards
measurement surveys used to calculate national poverty
lines It is widely observed that the more detailed the
survey questions about expenditures the higher the
reported expenditures14 If the national poverty line is
constructed using detailed data but the assessment of
household needs or expenditures relative to the poverty
line is based on less detailed data errors in the analysis
are likely to occur Furthermore WFP expenditure
modules do not include asset depreciation which is often
accounted for when calculating national poverty lines
Even if the national poverty line cannot be used in most
cases and especially in humanitarian contexts elements of
the methodology can perhaps be replicated It is therefore
important to find out how the national poverty line is
constructed
How about using the methodology applied for consumer price indices The consumer price index (CPI) is used to measure changes
in price levels based on a weighted average consumer basket
of goods and services In most countries household budget
survey data is used to construct the baskets used to measure
consumer prices A weight that corresponds to average
household expenditure patterns is applied to each component
of the CPI17 This basket is not ideal for MEB calculations
because it corresponds to overall national average
consumption patterns MEBs are based on the consumption
levels and patterns of those households who are just able to
meet their essential needs within the population of interest
(this is further described in the following sections)
13 Jolliff and Prydz 2016 14 Haughton and Khandker 200915 Republic of Zambia Central Statistical Office 2016 16 See Turkish institute of statistics data portal httpsdatatuikgovtrKategoriGetKategorip=Income-Living-Consumption-and-Poverty-10717 The CPI weights are usually available through national statistical offices
COUNTRYEXAMPLE
EXAMPLES OF NATIONAL POVERTY LINESEG Box 2
In Zambia the national poverty line is constructed using the cost of basic needs MEB approach based on a simple food
basket that meets minimum food needs for a family of six15 Imagine this food basket costs USD 100 per month This is
defined as the food poverty line To construct the full poverty line the minimum non-food needs of households are
estimated based on the average share of expenditure that households just above the food poverty line dedicate to needs
other than food Let us say that this corresponds to USD 35 per month The total poverty line is then the sum of the food
and non-food lines which with these hypothetical figures would be USD 100 + USD 35 = USD 135
By contrast Turkey uses the standard European Union approach to measuring poverty which is 50 or 60 percent of
median income16 However eligibility for social assistance is based on the gap between household income and the national
minimum wage
10
Minimum Expenditure Baskets Guidance Note | December 2020
In developing country contexts consumption is generally considered a better metric of wellbeing than income and in turn consumption expenditures as captured in household data generally provide the most reliable measure for consumption
5 Constructing a MEB expenditure-based and rights-based approaches
51 The expenditure-based approachThe expenditure-based approach to constructing a MEB
relies on household-level expenditure data to examine the
consumption behaviour of households who are just able
to meet their essential needs The expenditure level and
consumption patterns for this group of households reveal the
minimum cost of covering essentail food and non-food needs
and therefore form the basis of the expenditure-based MEB
The expenditure-based approach builds on the theory
behind poverty measurement and poverty line construction
To measure poverty the first step is to define a measure
of wellbeing In developing country contexts consumption
is generally considered a better metric of wellbeing than
income and in turn consumption expenditures as captured in
household data generally provide the most reliable measure
for consumption18 Household survey data on expenditures
therefore provides the foundation for measuring wellbeing
and is used to set the MEB threshold
The steps for constructing a MEB using the expenditure-based
approach are explained below
1 Prepare the expenditure data The prerequisite for an expenditure-based MEB is a
good-quality household survey with a detailed expenditure
module with a sufficient sample size representative of the
population for whom the MEB is being constructed (the
ldquopopulation of interestrdquo)
The notion of a ldquodetailedrdquo expenditure module is a
relative one Constructing an expenditure-based MEB
requires more detailed data on different types and
groups of expenditures than is usually gathered by
household surveys conducted in humanitarian settings
However this guidance has been designed to cope
with less detailed expenditure data than that gathered
through extensive national expenditure surveys such
as the very granular expenditure modules typically used
when constructing poverty lines (eg national household
budget surveys household income and expenditure
surveys living standards measurement surveys or other
large-scale household surveys)
What is a sufficient sample size The survey should
always follow good practices for sampling19 Consider
that for MEBs the analysis focuses on the consumption
patterns of a subset of the sample the ldquoreference cohortrdquo
(see next below) The characteristics of the population
and the cohort selection criteria determine the size of
this subsample in relation to the overall sample but
experience shows that the cohort can comprise between
10 and 60 percent of the sample The sample will be
further disaggregated if analysis by household size or
group of household size is desired (see section 7 on
accounting for household sizes)
Using expenditures to understand consumption involves
calculating a ldquoconsumption aggregaterdquo This entails
combining household expenditures on food and non-
food paid in cash or through credit as well as the
imputed monetary values of consumed own production
and received assistance Expenditures are analysed in
per-capita values Box 3 describes this process in more
detail Annex 1 further outlines some best practices when
analysing expenditure data
In addition to the household survey data market price
data is needed in order to estimate the final cost of the
basket The price data should be collected around the
same time as the household survey data
18 Deaton and Zaidi 2002 and Haughton and Khandker 2009 19 For guidance see WFP 2004 Additional resources can be found in the online VAM Resource Centre httpsresourcesvamwfporg
11
Minimum Expenditure Baskets Guidance Note | December 2020
HOW TO
EXPENDITURE DATA IN MEB CALCULATIONS -CONSTRUCTING A LIGHT ldquoCONSUMPTION AGGREGATErdquo
Box 3
Using expenditures to calculate a MEB entails combining different household expenditures to arrive at a measure of house-
hold consumption This is typically referred to as a consumption aggregate although a lighter version is used than those
usually constructed for national poverty lines due to the less granular data typically available for MEB construction20
Expenditures considered in a MEB should reflect household consumption related to essential needs Therefore both
household expenditures made in cash and those on credit must be considered as the latter also reflect current consump-
tion even if payment occurs later If the population can be expected to consume food from their own production the value
of this food should be captured to avoid underestimating food expenditures Lastly if the surveyed households are receiv-
ing and consuming assistance it is advisable to estimate the implied value of this assistance and include it in the expendi-
tures (however care needs to be taken if the population of interest includes a large group of in-kind assistance beneficiar-
ies as this can significantly skew consumption choices see next section on selecting the reference cohort) In summary the
expenditure module should capture any expenditures made in the reference period through cash and credit purchases as
well as the monetary value of consumed own production and assistance Most standard expenditure modules include all
these types of expenditures
Expenditures should be collected for both food and non-food goods and services For food expenditures at the food group
level are required as a minimum If food expenditures are collected at the item level a more granular analysis can be per-
formed The same applies for non-food expenditures they must be available at the group level and item-level data will add
detail However whenever household data is collected a balance needs to be struck between the granularity of the data
and the time and resources available for its collection
The WFP standard expenditure module can be used as a reference for the minimum requirement for expenditure data
collection WFP standard modules can be found in the online VAM Resource Centre httpsresourcesvamwfporg
+ ndash=
2 Select the reference cohort The next step is to identify the households in the survey
data that are just able to meet their essential needs and
examine their expenditures Including households below
this level would generate a basket that does not satisfy
essential needs while including relatively wealthier
households would lead to the inclusion of non-essential
needs and therefore inflate the MEB But what is ldquojust
enoughrdquo
Identifying the cohort of households who are just able
to meet their needs can be challenging How to approach
it depends on the characteristics of the population
and the available data The key is to identify one or
more criteria that can be good proxies for whether
households are just able to meet their essential
needs and that can be observed in the data One
basic indicator would be a food consumption of 2100
kcal per person per day21 However since the available
expenditure data is often too crude to make accurate
calibrations of diet compositions around the 2100
kcal point the use of alternative indicators is highly
recommended These could be indicators such as food
consumption score (FCS) or food consumption score ndash
nutrition (FCS-N)22 which indicate whether households
eat sufficient and balanced diets quality of housing
indicators use of coping strategies (selecting households
who do not engage in severe strategies) or any other
indicator that reflects a householdrsquos ability to meet its
needs Combining several indicators is often useful
20 For thorough guidance on constructing consumption aggregates using data from living standard measurement surveys (LSMS) see Deaton and Zaidi 2002 In most WFP cases household data is less granular than the LSMS-type datasets This section therefore describes how to construct consumption aggregates with less detailed data21 Use of calorie consumption close to the Sphere Standard of 2100 kcalpersonday as the starting point for selecting the reference cohort originates in the cost of basic needs approach used in most national poverty line estimations 22 WFP 2008 and WFP 2015
12
Minimum Expenditure Baskets Guidance Note | December 2020
Figure 2 Selecting the MEB cohort
In simple terms it is useful to think of the green people in the figure as the basis for selecting the reference cohort they are not amongst the worst-off
nor the wealthiest ndash but rather are just able to meet their essential needs
DESTITUTE
WEALTHY
It is also recommended to examine the expenditure
distribution Excluding households in the extreme ends
of the expenditure distribution can help ensure that
the cohort is neither ldquotoo poorrdquo nor ldquotoo wealthyrdquo (eg
by removing households in expenditure quintiles 1 and
5 or similar exclusion criteria based on distribution
characteristics) This is in particular useful if there is a
relatively large spread in wealth across the sampled
population
Figure 2 provides a simplistic depiction of selecting the
reference cohort the aim is to identify households that
are just able to cover their needs and hence do not fall in
either extreme end of the spectrum
13
Minimum Expenditure Baskets Guidance Note | December 2020
Box 4 outlines some typical cases and presents suggestions
for how to select the cohort in a survey sampled on
the population of interest
There is a spread in the
population in terms of well-being
and a proportion is able to cover
their essential needs no
households receive assistance
A relatively large proportion of
households receive food
assistance
The vast majority of the
households are far from being
able to cover their essential
needs (prior to receiving
assistance)
Select households with an acceptable FCS23 or with adequate consumption in FCS-N
who do not use negative coping strategies (or have a high coping strategy index)
Combine or cross-check with other criteria such as dwelling quality or asset index
Exclude extreme expenditure quintiles
Exclude households receiving in-kind food assistance from the reference group (if
sample size allows) This is because any assistance that is not unrestricted cash
might influence the consumption choices of the beneficiary households (in-kind
food means a large portion of food consumption is determined by the assistance
provided not the households) However be aware that if the majority of
households receive some form of restricted assistance excluding them all from the
cohort can lead to sample size issues as well as selection bias
Alternatively to the extent possible avoid using criteria that are highly influenced
by assistance For example in the presence of food assistance the FCS of some
households might be acceptable even if they are not able to meet their essential
needs Furthermore if in-kind food is provided the consumption behaviour of such
households might be skewed as most of their food needs are already covered by
assistance
Consider using dwelling quality an asset index or other similar indicators instead
(or in combination with the FCS)
Consider using a rights-based approach since it will be very difficult to obtain a big
enough sample of households who can meet their essential needs making it
challenging to construct an expenditure-based MEB Carry out a reality check using
the survey data to understand household consumption patterns keeping in mind
that the sample represents a population not able to fulfill their essential needs
HOW TO
REFERENCE COHORT SELECTIONBox 4
Scenario Possible approach to selecting the cohortUse one or several of the below criteria
The use of sensitivity tests is highly recommended in the form
of repetitions of the expenditure analysis for different versions
of the reference cohort this will indicate the extent to which
the choice of cohort selection criteria is influencing the MEB
23 It is usually not advisable to use the FCS as a single criterion If it is used alone the indicator should be capped at a certain level above the acceptable threshold (the FCS builds on a continuous score from 0ndash112 and applies thresholds for poor borderline and acceptable consumption) This is because if all households with acceptable FCS are included this will likely also capture some households who are ldquotoo wealthyrdquo to be considered in the reference cohort
14
Minimum Expenditure Baskets Guidance Note | December 2020
See box 5 for examples of how sensitivity tests can be
conducted as well as how the reference cohort has been
COUNTRYEXAMPLE
SELECTING AND CHECKING THE REFERENCE COHORTCHAD SYRIAN REFUGEES IN LEBANON AND COXrsquoS BAZAR
EG Box 5
Reference cohort sensitivity analysis ndashCoxrsquos Bazar MEB
Table a
In Chad the calculation of an expenditure-based MEB relied on national data collected by the Government during their
annual national food security and nutrition survey The reference cohort for the MEB was selected on the basis of two
criteria FCS between 35 and 70 eg in an interval around the acceptable threshold and no adoption of crisis or emergency
livelihood coping strategies based on the livelihood coping strategies indicator These two criteria ensured that the
selected reference cohort had consumption levels that provided sufficient food security and sustainable livelihood
strategies
For Syrian refugees in Lebanon24 an expenditure-based MEB was calculated by WFP in order to review an existing MEB
Shelter plays an important role as most refugees live in an urban host community and face high rents The FCS reveals
whether people can cover their food needs but could be influenced by the presence of food assistance To ensure results
would be robust against the choice of the cohort two different approaches were compared both included households of 4
to 6 members (as the MEB under review was defined only for households of these sizes) and excluded households in
expenditure quintiles 1 and 5 In version 1 an additional criterion of acceptable FCS was included while in version 2 an
additional criterion of acceptable housing conditions was applied The results were similar for both cohort versions
A MEB was calculated in Coxrsquos Bazar Bangladesh as part of the 2019 Refugee Influx Emergency Vulnerability Analysis
(REVA-II)25 for Rohingya refugees An expenditure-based MEB was built using a large household survey that included
refugees and host community households the reference cohort also included refugees and host communities as the MEB
was meant to apply to both groups Households receiving in-kind food assistance were excluded to avoid possible bias in
consumption choices which would be reflected in the expenditure data The reference cohort was then selected based on
FCS and expenditure quintiles To ascertain that the appropriate cohort had been chosen a sensitivity analysis was
conducted which tested the effect of removing different expenditure quintiles (quintiles 1 and 5 versus quintiles 1 4 and 5)
and including different FCS ranges (FCS 42+ versus FCS 35ndash80) This showed that across different iterations of the reference
cohort total food expenditures were relatively stable while non-food expenditures went up when richer households (eg in
the higher expenditure quintiles) were included This allowed the analysts to select the cohort of households who were just
at the point where the share of food expenditures out of total expenditures began to decrease as a high share of
expenditure on food is often an indicator of vulnerability In other words the selected cohort was just at the point where
households started meeting more needs than just food and the most basic non-food requirements The consumption
patterns of this cohort -highlighted in table a below - therefore became the basis for the MEB
Indicator 1expenditurequintiles
Indicator 2FCS Sample
size Value in taka
Total MEB
Exclude quintiles 1 4 and 5
Exclude quintiles 1 4 and 5
Exclude quintiles 1 and 5
Exclude quintiles 1 and 5
FCS 35ndash80
FCS gt= 42
FCS 35ndash80
FCS gt= 42
403
296
610
474
5259
5324
5691
5740
2304
2299
2990
3082
070
070
066
065
030
030
034
035
7562
7623
8681
8822
Food MEBValue in taka Value in taka
Non-food MEB
identified in different contexts
24 Hohfeld et al 2020 25 WFP 2019
15
Minimum Expenditure Baskets Guidance Note | December 2020
3 Establish the food basketWith the reference cohort identified the food basket value
should be calculated in correspondence with the food
consumption patterns of the reference cohort
To calculate the food basket start by computing the mean
(or median) food expenditures for the chosen reference
cohort It is good practice to compute the overall food
expenditures and break the analysis down into the different
food groups or food items in order to understand how food
consumption is distributed across different foods
Next consider whether an explicit reference food basket
is needed in the MEB this is a list of the food items in the
basket and their quantities Having a reference basket
brings advantages in terms of monitoring of the cost
of the MEB (as new prices can easily be applied to the
quantities) it shows consumption patterns in quantities
and can hence help check if food consumption is adequate
at the given level of expenditures and it can help when
communicating about the MEB It can therefore be a useful
practice to establish one However in some instances
a simple monetary value for the food MEB is sufficient
This could be the case when the MEB is calculated to
review an existing MEB if reference basket is not needed
for operational purposes when time is limited or
where limited data means a reference basket cannot be
adequately calculated Wherever a food reference basket
is not needed the food MEB will simply be the mean (or
median) food expenditures by food groups or food items
as calculated above If a reference food basket is feasible
and desired the next steps depend on the level of detail in
the data available
With expenditure data and market prices a food
reference basket can be approximated using expenditures
by food group or food item and dividing these
expenditures by the relevant food prices This provides
estimates of consumed quantities Expenditures and prices
must be collected at the same time in order to arrive at
correct quantities If for example prices are collected six
months later than expenditures and prices have changed
significantly dividing expenditures by prices will produce
inaccurate estimates
Note that the level of detail and accuracy with which a
food refence basket can be established using expenditures
and prices also depends on whether expenditures
were collected at the food group or food item level Box 6
illustrates how to approximate a reference basket when
expenditures are collected at the food group level and
box 7 shows an example of a food basket estimation from
an assessment in Kinshasa Democratic Republic of the
Congo
If the expenditure module includes consumed quantities
of food in addition to expenditures a food basket can be
established directly based on the consumed quantities by
food group or food item Having data on quantities will
also enable analysts to estimate prices directly from the
survey data by dividing the household expenditure on a
particular food item by the quantity consumed This can be
advantageous as it provides a direct estimate of the prices
households actually paid (unlike a price survey which uses
typically consumed items and is often only conducted
at specific points of sale) On the other hand this may
introduce issues related to non-standard measurement
units that make prices hard to compute and aggregate26
Box 8 shows an example from Coxrsquos Bazar of how a food
reference basket can be established using item-level
expenditures and quantities from the survey data
Once the quantities consumed have been established using
one of the methods described above it is good practice to
check the calories these quantities provide and the balance in
terms of nutrients The basket should be close to the Sphere
Standard of 2100 kcal per person per day ndash if it is not one
option could be to scale the basket Use information on the
calorie content of the different food items in the basket to
calculate the total calorie content of the basket27 The quantities
in the basket can then be scaled up or down to reach 2100
kcal However bear in mind that if the reference cohort has
been well selected and the data is of sufficient quality and
detail the basket should already be close to 2100 kcal If large
rescaling is required investigate the reasons behind this For
the sake of simplification quantities can be rounded and the
basket can be streamlined by removing items with very low
consumption or nutritional value
26 Deaton and Grosh 2000 27 Calorie information of food items can be drawn from a variety of sources The Nutval tool (httpwwwnutvalnet) provides information on calories and other nutrients for a list of items Consider that the
specifications and quality of a product can influence its caloric value (eg whole fish vs fish fillet) ndash it might be necessary to adjust for this for certain items that vary widely Many food composition tables (available from FAO for different continents httpwwwfaoorginfoodsinfoodstables-and-databasesfaoinfoods-databasesen) contain a wastage factor or edible portion conversion factor to convert from edible portions into full products as they are bought on the market
16
Minimum Expenditure Baskets Guidance Note | December 2020
After establishing the reference basket and possibly rescaling
it the basket is priced This is done by multiplying the basket
quantities by the food prices The basket can be priced using
current food prices from a price survey or by estimating food
prices from the expenditure data as described earlier The
result should be close to the expenditures for the reference
cohort although differences could arise from any rescaling or
simplification of the basket
APPROXIMATING A FOOD BASKET WITHGROUP-LEVEL FOOD EXPENDITURES
Box 6
HOW TO
Data quality and granularity has a big impact on the calculation of a food reference basket If consumed quantities are not
directly available in the dataset they need to be calculated by dividing expenditures by prices However this will always
produce an approximation and the more aggregated the data on expenditures is the more approximate the results will be
In particular when the food expenditure data is available at the food group level care needs to be taken when converting
expenditures into quantities
For example to convert expenditures on the food group ldquocerealsrdquo into a reference quantity analysts need to divide cereal
expenditures by the price of cereals But how do they determine the price of cereals This is a food group not a specific item
so there is no exact price The recommended way to approach this is to determine which is the most commonly consumed
item or combination of items for each food group Then a price for the most commonly consumed item or a composite price
of a combination of items can be used to arrive at quantities So if the most commonly consumed cereals for the population
of interest are maize and rice and they are eaten in equal measure by the population the cereal quantities for the reference
basket can be calculated in the following way
Mean cereal expenditures for our reference cohort = 150 shilling
Price of rice = 18 shillingkg
Price of maize = 12 shillingkg
Composite price of rice and maize = (18 + 12) 2 = 15 shillingkg
Cereal quantity consumed = 150 shilling (15 shillingkg) = 10 kg (5 kg rice 5 kg maize)
Of course this is an approximation care needs to be taken when converting expenditures into quantities using
group-level data
Certain food groups may lend themselves more to this approximate conversion than others For example cereals
might be relatively easy to convert using this method as cereal consumption often is concentrated on a few key staples In
contrast vegetable consumption may be so diverse that conversion via prices is not helpful In this latter case one option
could be to obtain reference basket quantities for the groups that can be converted and leave other groups as expenditures
only so that the food MEB becomes a combination of quantities and expenditures
In summary to establish the food basket
i Calculate mean (median) food expenditures by food group
or item If an explicit reference basket with quantities is not
needed stop here and simply use the expenditures as the food
basket
ii Estimate consumed quantities (by dividing expenditures
by prices or directly from data if it contains consumed
quantities)
iii Check the resulting quantities and consider scaling to meet
Sphere Standards
iv Price the basket using market prices or prices derived
from the household data
17
Minimum Expenditure Baskets Guidance Note | December 2020
Table a Food reference basket ndash Kinshasa MEB
COUNTRYEXAMPLE
KINSHASA FOOD REFERENCE BASKET USINGFOOD GROUP EXPENDITURES
Box 7
In the Kinshasa urban essential needs assessment28 the food reference basket for the MEB was established as follows
Expenditure data was available at the food group level only The caloric importance of each food group (column A of the
table below) as a part of the overall food intake was determined For each of the calorie-relevant food groups the most
commonly consumed food item was then identified (eg maize in the case of cereals) (see column B) Using the average per
capita expenditure from the household survey (column C) and the market price for each food item (column D) the
quantities consumed per person per month were approximated (column E) Next the total calorie intake was calculated
(column G) For urban Kinshasa this amounts to 1967 kcal which is close to the Sphere Standard of 2100 kcalpersonday
and suggests that the expenditure data is likely to be reliable However a proportional rescaling to 2100 kcalpersonday
was done to ensure consistency with Sphere (column H) On the basis of the rescaled total calories all values were then
converted back to monthly figures to arrive at a monetary value for each food item (columns I and J) In addition to the
calorie-relevant food items the mean expenditures on other food categories that households regularly consume were
added (vegetables fruit etc) As these food items represent little overall share of peoplersquos calorie consumption (given the
quantities consumed or the type of the foods) they were not included when calories were calculated Furthermore it would
be difficult to select specific food items in each of these categories as they are quite diverse (eg vegetables) However as
most households still consume these food items as part of their usual diet and they provide important micronutrients their
costs need to be reflected in the food MEB The mean expenditure on these food categories was therefore used as a
good-enough approximation for householdsrsquo consumption of these food groups Meals consumed outside the household
were excluded from the MEB as they were not considered essential
Food
grou
p
Food
item
per
capi
ta a
vm
onth
ly e
xp
Pric
e(f
ranc
kg)
kg c
ons
per
mon
th =
CD
food
item
kca
lpe
r 10
0g
kcal
con
s p
er d
ay=(
EF
10)
30
kcal
per
day
res
cale
d=G
(21
001
967)
kg p
er m
onth
res
cale
d=(
H(
F10
))30
roun
ded
MEB
food
-bas
ket
(fra
nc)=
ID
6898
1808
2089
2341
4306
1817
2826
833
799
2509
2144
900
500
1300
2300
2500
2200
77
36
16
10
17
08
920
412
179
302
44
110
1967
360
342
335
890
76
400
TOTAL
982
440
192
322
47
118
2100
82
39
17
11
18
09
7400
1900
2200
2500
4600
1900
2800
800
800
2500
27400
A B C D E F G H I JCereals
Tubers
Pulses
Oilsfats
Meatfish
Sugars
Vegetables
Fruit
Dairy
Condiments
Meals out-
side home
Maize
Cassava
Beans
Veg Oil
Fish
White sugar
Vegetables
Fruit
Dairy
Condiment
Meals out-
side home
29 WFP 2019 Also see box 5
18
Minimum Expenditure Baskets Guidance Note | December 2020
COUNTRYEXAMPLE
COXrsquoS BAZAR FOOD REFERENCE BASKETWITH DETAILED EXPENDITURE AND QUANTITY
Box 8
In the MEB for Coxrsquos Bazar calculated as part of the REVA II assessment expenditures and consumed quantities were
available for 87 food items which formed the basis for the consumption aggregate While the expenditure data was used to
select the appropriate reference cohort the reported quantities were used to determine household calorie intake
Quantities were reported at the food item level and consumed calories were calculated for each item The items were then
categorized by food group (cereals pulses oilsfats vegetables etc) and the total calories from each group were
calculated To create an operationally relevant reference basket without very large numbers of food items the number of
items in each food group were reduced where possible For example 95 percent of the calories that households get from
the food group ldquocerealsrdquo come from rice The cereal food group was therefore simplified to rice only keeping the total
calories sourced from cereals constant and adjusting the quantity of rice in the basket slightly upwards For pulses the four
main consumed items were identified and calories and quantities proportionally adjusted For other food groups such as
vegetables the variety of items consumed within the group was too great to simplify items to a small number for this
group no items were assigned and instead total expenditures on vegetables for the reference cohort were used directly in
the food MEB The total calories of all items were taken into account The resulting basket was close to 2100 kcal so only
minor rescaling was undertaken to arrive at final reference basket of 2100 kcalpersonday
Once the final basket had been determined quantities were priced using median prices derived from the household data
(by dividing expenditures by purchased quantities for the relevant items)
For vegetables fruits meat dairy and condiments expenditures are used directly in the food MEB (converted into monthly per
household values) For all other items quantities per capita per day are multiplied by the item median price (as derived from
the household data) and converted into monthly per household values
The MEB uses household size 5
Note The MEB for Coxrsquos Bazar was calculated for analytical purposes for the REVA II assessment It is not the operational MEB used
for the district
Foodgroup
Fooditem
Consumedquantity(grammescapitaday)
Calories(kcalcapitaday)rescaled
Median prices(takakg)
Value in MEB(taka per HHmonth)
424
14
7
2
1
182
6
81
1
33
6
28
1527
48
27
8
4
78
5
85
1
294
24
0
2100
30
80
60
40
80
-
-
-
-
80
60
-
1909
168
67
14
13
1065
48
1600
15
392
57
345
5691
Cereals
Pulses
Pulses
Pulses
Pulses
Vegetables
Fruit
Meat
Dairy
Fats
Sugar
Condiments
TOTAL FOOD
Rice
Lentil
Chickpea
Anchor daal
Mung
none
none
none
none
Soybean oil
Sugar
none
Table a Food reference basket ndash Coxrsquos Bazar MEB
19
Minimum Expenditure Baskets Guidance Note | December 2020
4 Establish the non-food basketOnce the food component has been established a non-
food component is added There is no wholly satisfactory
way to add a non-food component as it can be difficult to
define an essential minimum Unlike food needs many
non-food needs are often more contextual and are not
easy to anchor in a specific universal threshold (like the
food Sphere Standard of 2100 kcal per person per day)
While Sphere Standards exist they often need to be
contextualized and may not cover all non-food essential
needs
The non-food basket can be established with different
levels of detail depending on the available data and the
level of granularity desired
As for the food expenditures start by calculating the
mean (andor median) non-food expenditures for the
reference cohort If the expenditure data is detailed it can
be used to identify specific non-food needs Expenditures
can be analysed by non-food group (eg shelter hygiene
or transport) to design a non-food basket composed
of group-specific expenditures The precise non-food
components can vary by context but would generally
include the components discussed in the section on
the rights-based MEB below Some non-food items that
expenditure data has been collected for might need to be
excluded for the purpose of constructing the MEB (eg
tobacco which is hard to consider an essential need)
In theory it would be possible to establish a non-food
reference basket with specific quantities using the same
method as for food ie by dividing expenditures by prices
to arrive at quantities However this is usually not feasible
for non-food goods and services simply because non-food
expenditure data is often much harder to break down into
specific items than food expenditure data For instance
even if expenditures on clothing or transportation
are known relating this to exact clothing items or
transportation services and then obtaining accurate
prices for those itemsservices will often prove difficult if
not impossible Therefore as a general recommendation
in the expenditure-based approach when non-food
expenditure data is not available at the item level it is
best to keep the non-food basket to expenditures and not
provide quantities If reliable market price information on
relevant non-food items is available total expenditures
could be checked against prices to obtain an approximate
idea of the adequacy of the non-food expenditures
Particular groups of non-food expenditures may require
special attention due to their nature Box 9 highlights a
few examples
TIP BOXNON-FOOD EXPENDITURES ndashEXPENDITURES OF PARTICULAR INTEREST
$$
$
Box 9
Shelter expenditures can be a tricky component to deal with especially for urban populations If the share of the
population who rent accommodation is significant rent will typically be included in the MEB as it is the cost of shelter an
essential need Indeed it can form quite a significant part of the MEB However if the resulting MEB is compared to actual
expenditures to determine whether households fall below the MEB those who own their dwelling and therefore do not pay
rent might be classified as unable to cover their needs just because they do not have any major shelter expenditures
Therefore large single expenditures such as rent should be included with care and context will determine how shelter
expenditures are handled in the MEB Generally speaking if no or very few households in the population of interest have
major shelter expenditures such as rent this component should be left out of the MEB and no attempt made to impute it
(as is sometimes the case in poverty line estimations) If the majority of households rent their dwellings it is advisable to
include mean rent expenditures in the MEB The trickier case is when the households in the population of interest are split
between a significant number of households living in owned or no-rent housing and a significant number paying rent ndash
here it is difficult to reflect shelter expenditures adequately in the MEB Simply using mean rent estimations in the MEB will
underestimate the need for the renters while overestimating it for those who own their housing or do not pay rent In this
case insofar as data allows one solution could be to impute rent expenditures for the non-renters by estimating the
would-be rental cost for the type of housing they live in Doing this typically requires a housing module in the household
survey that contains information on ownership and types and sizes of housing so rental equivalents can be computed and
imputed for the non-renters
20
Minimum Expenditure Baskets Guidance Note | December 2020
NON-FOOD EXPENDITURES ndashEXPENDITURES OF PARTICULAR INTEREST
$$
$
Box 9
Health expenditures can also be challenging to capture adequately in survey data as such expenditures are often irregular
in nature Bear in mind that health expenditures usually consist of payment for goods such as medicines and for services
such as visits to the doctor When analysing the expenditures and deciding how to include them in the MEB consider which
services may be provided free of charge and what households pay themselves and at what cost30
Care should be taken when it comes to the underreporting of expenditures and treatment of expenditures that are
irregular in nature Remember that the MEB should include all recurrent essential needs but it typically does not include
one-off expenditures ldquolumpy expendituresrdquo such as marriage expenditures or dowries or investments Expenditures
on durables (for instance the purchase of vehicles or large household appliances) are also not included (in national poverty
lines the rental value of the durables owned by households adjusted for depreciation is sometimes included31 however
this is not recommended for MEB calculations)
Household expenditures on savings taxes and debt repayment are not usually included in the MEB as these types of
expenditures do not reflect actual consumption
Tobacco and alcohol are often included in expenditure surveys While households may choose to spend money on these
items they can fairly be assumed to be non-essential and are generally not recommended for inclusion in the MEB
The ldquoquick fixrdquo if data is very limited If the expenditure
data has no or very insufficient data on non-food
expenditures a ldquoquick fixrdquo solution is to use the average
non-food expenditure share of total expenditures This can
often be obtained from external sources such as monitoring
reports or food security assessments This is then added
COUNTRYEXAMPLE
Table a Non-food basket ndash valuesCoxrsquos Bazar
Value in MEB (takaHHmonth)
Non-food group
Toiletries and cleaning
Clothes shoes and towels
Cooking equipment
Education
Fuel and electricity
Medical treatment
Household textiles and small repairs
Communication
Transport
Total non-food
461
521
25
134
775
447
57
274
295
2990
Figure a Non-food basket ndash distribution Coxrsquos Bazar
Note The MEB for Coxrsquos Bazar was calculated for
analytical purposes in the REVA II assessment
It is not the operational MEB for the district
9Communication
10Transport
2Householdtextiles and
small repairs
15Medical
treatment
26Fuel andelectricity
5Education
1Cooking
equipment
17Clothes shoes
and towels
15Toiletries
and cleaning
EXPENDITURE-BASED NON-FOOD REFERENCEBASKET EXAMPLE FROM COXrsquoS BAZAR
Box 10EG
to the cost of the food basket to arrive at the total MEB
However when using an additional data source analysts
should understand how the average share of non-food
expenditures has been calculated and what sample it has
been derived from as it may not reflect the consumption
patterns of the reference cohort
30 The WHO and Global Health Cluster guidance on health expenditures in the MEB has some useful insights into household health expenditures See WHO and Global Health Cluster ndash Cash Task Team 2020 31 Deaton and Zaidi 2002
21
Minimum Expenditure Baskets Guidance Note | December 2020
52 The rights-based approachIn humanitarian contexts ldquoessential needsrdquo have been
understood as referring to access to full rights as set out by
international humanitarian law and the Humanitarian Sphere
Standards The term ldquorights-based MEBrdquo is derived from
this understanding According to the operational guidance
on multipurpose cash grants32 international humanitarian
and human rights law protects the right of crisis-affected
persons to food33 drinking water soap clothing shelter and
lifesaving medical care Humanitarian Sphere Standards
builds on this definition and outlines minimum humanitarian
standards in the areas of food security and nutrition
shelter and settlement health and WASH (water supply
sanitation and hygiene)34 In some contexts residency or legal
documentation is also included Humanitarian standards
for education are outlined in the Education in Emergencies
Minimum Standards Handbook35
The rights-based approach entails defining a detailed list
of the food and non-food items that make up the MEB
reference basket and pricing them using current market
prices MEBs built by the Interagency Cash Working Group or
other interagency coordination forum are often constructed
following the rights-based approach with each sector or
cluster contributing to the needs in their respective sectors
In these cases WFP is usually responsible for defining the
food component of the MEB For both food and non-food
items the reference basket is typically produced or cross-
checked through focus group discussions with the population
of interest partners and key informants It is usually put
together based on the needs of an average-sized household
1 Establish the food basketTo construct the food basket for a rights-based MEB compile
a list of food items and their quantities The Sphere Standards
offer a useful starting point recommending a diet of 2100
kcal per person per day with 10ndash12 percent of daily energy
intake from protein and 17 percent from fats36 The food
basket should be adapted to local diets and preferences
2 Establish the non-food basketOnce the food basket has been established a non-food basket
should be added In the rights-based approach this is typically
done by quantifying needs by producing a list of items by
sector Some examples are found below
Shelter This is the cost of accommodation that meets
basic shelter needs and rights What this means in practice
will depend on the context driven for example by weather
conditions and what is realistically available to the population
Utilities These include the cost of basic utilities such as safe
drinking water and depending on the context electricity
Non-food items These reflect basic household needs
related to cooking clothing and hygiene plus other general
household items Cooking gasfuel or firewood is often
included In line with the definition of the MEB the list should
focus on recurrent needs In practice these non-food items
can look very different depending on the context 38
Services This includes the costs of accessing basic services
such as healthcare education transport and communication
Healthcare costs are often difficult to quantify since they
are inherently irregular large and unpredictable Typically
however only basic minimum needs are covered in the MEB
such as eg two visits per year to the doctor expenses for
critical events deliveries and medicines are sometimes also
included Note that even if a need is not covered by the MEB
it does not mean that these needs do not need to be met for
the population of interest Health can be an example of this
health needs are often better met through service provision
than purchased through the market and therefore may
be only partially reflected in the MEB However guidance
from WHO and the Global Health Cluster notes that people
tend to have some level of health expenditures even when
COUNTRYEXAMPLE
SHELTER IN THE MEBFOR SYRIAN REFUGEES
EG Box 11
For the Syrian refugee operation in Turkey the MEB
includes the costs of shelter that meets certain
standards such as a minimum of 35 m2 per
person access to a toilet and running water
32 UNHCR et al 2015 33 Defined as energy needs not considering full nutrient needs (protein vitamins minerals etc) 34 See the Sphere Standards Handbook 35 INEE 2010 36 Further recommendations on micronutrient requirements can be found in the Sphere Standards Handbook37 Hobbs 201638 For some refugee contexts the Office of the United Nations High Commissioner for Refugees (UNHCR) has lists of specific items which can be considered for the MEB
22
Minimum Expenditure Baskets Guidance Note | December 2020
policies are in place that require the free public provision of
health services39
Education costs usually cover school fees materials
uniforms and transport depending on what households
have to pay themselves and what is publicly available
Transport and communication needs are often defined as
the average transport and communication costs reported by
household surveys and then validated with the communities
COUNTRYEXAMPLE
EXAMPLE OF A RIGHTS-BASED MEBFOR NORTHEAST NIGERIA
Box 12EG
The northeast Nigeria cash working group designed a MEB for a household of seven people40 the resulting reference
basket is shown below
Sectorgroup
Item Quantity(7 pers HH)
Sectorgroup
Item Quantity(7 pers HH)
Cooking fuel
WASH
Cooking fuel
WASH
Transportation
Communication
Health
Education
Firewoodbriquette
charcoal
Water + vendor fee
Bathing soap
Laundry soap
Sanitary pads
Firewoodbriquette
charcoal
Water + vendor fee
Bathing soap
Laundry soap
Sanitary pads
Rides
Airtime 500 NGN
Average expense
Pen
Pencil
Notebook
1 bag
158 jerrycans
13 bars
3 bars
4 packs
1 bag
158 jerrycans
13 bars
3 bars
4 packs
10 rides
1
7 pers
3 pcs
3 pcs
3 pcs
Table a MEB example northeast Nigeria
27 kg
45 kg
135 kg
18 L
27 kg
18 kg
36 L
09 kg
144 kg
2 kg
2 kg
1 kg
05 kg
12pcs
1L
Food Rice
Maize
Beans
Palm oil
Groundnuts
Sugar
Vegetable oil
Salt
Onion
Non-leafy vegetables
Leafy vegetables
Fruits
Meats
Chicken eggs
Vinegar
communication needs can also be specified as the cost of a
SIM card with a certain amount of data or airtime
3 Price the reference basketWith the food and non-food reference baskets established
the list of items and quantities are now priced using updated
prices from markets relevant to the population of interest
The pricing should be done based on actual current market
prices This produces the final rights-based MEB
39 WHO and Global Health Cluster ndash Cash Task Team 2020 40 Cash Working Group Nigeria 2018
23
Minimum Expenditure Baskets Guidance Note | December 2020
MEB APPROACHES ndash CONSTRUCTION SUMMARYBox 13
HOW TO
Rights-based approach
Establish the food basket
Define a list of relevant and locally preferred and
available food items and their quantities The Sphere
Standards can be used as a reference
Establish the non-food basket
Define a list of essential non-food items relevant to the
population of interest and their quantities Services such
as education or transport can also be included The list is
usually put together sector by sector
Price the basket
Use current market prices for the food and non-food
items in the reference baskets to calculate the price of
the basket Use prices from markets relevant to the
population of interest
1
2
3
4
1
2
3
Expenditure-based approach
Prepare the expenditure data
Ensure the data is cleaned Compute expenditures by
combining cash and credit expenditures the value of
consumed own production and consumed assistance
for both food and non-food expenditures Compute
expenditures as per capita figures
Select the reference cohort
Identify households ldquojust able to meet their essential
needsrdquo using indicators such as FCS FCS-N housing or
others excluding households in extreme quantiles of
expenditure distribution or other criteria or
combination of criteria Check the sensitivity of the
results to the selection of reference cohort
Establish the food basket
Calculate mean (median) food expenditures by food
group or item Either stop here or ndash to obtain a refence
basket ndash estimate consumed quantities check the
calorie content of the resulting quantities and consider
scaling them to Sphere Standards Price the basket
using market prices or prices derived from the
household data
Establish the non-food basket
Calculate mean (median) non-food expenditures by
non-food group or item If item-level data and prices
are available it is possible to derive a non-food
reference basket using same methodology as for the
food basket otherwise the non-food basket will
comprise the expenditures at the group level If a
quick-fix solution is needed add the average household
non-food expenditure share to the food MEB
53 Summary and data needs for expenditurendashbased and rights-based approachesBox 13 summarizes the steps to follow in order to construct a
MEB using an expenditure-based or a rights-based approach
24
Minimum Expenditure Baskets Guidance Note | December 2020
Qualitative understanding
of essential needs for the
population of interest
Representative household
survey with detailed
expenditure module
List of ldquorights-basedrdquo needs
Price information
Focus group discussions with key informants or population
of interest
Literature review of existing information on the essential needs of
the population of interest
WFP essential needs assessment emergency food security
assessment or comprehensive food security and vulnerability
analysis or other representative pre-assistance baseline survey
National household budget surveys household income and
expenditure surveys living standard measurement surveys or
other large-scale household survey
Clusters Cash Working Group other interagency forum
Sectoral assessments other secondary information
Price data series covering the area of interest for relevant food
and non-food items and services from WFP (Dataviz41 has
up-to-date price information) or partners
Price indices from national statistical offices
Prices derived from household expenditure data where quantities
are also reported
Suggested sources Expe
ndit
urendash
base
d
Righ
tsndashb
ased
INFORMATION NEEDS AND SOURCESMEB APPROACHES
Box 14
HOW TO
Information need
TIP BOXWHAT IF DATA USINGA HOUSEHOLD ECONOMY APPROACH IS AVAILABLE
$Box 15
The household economy approach (HEA) developed by Save The Children is commonly used for analysing food security and
livelihoods It is based on understanding how households normally access income food and other itemsservices required
for survival established through a baseline analysis As part of the baseline the HEA defines livelihood zones where
households share similar strategies for obtaining food and income It also distinguishes households within these livelihood
zones in at least three (often four and sometimes more) wealth groups The HEA baseline quantifies the sources of food
and income and the expenditure patterns for each wealth group and livelihood zone
The information collected on expenditures can be used as a data source for calculating a MEB However due to the relative
nature of the wealth cut-off points used there is no set standard regarding which group should be the reference for the
MEB If HEA data is utilized it is important to understand how it was collected ndash the HEA is simply an analytical framework
not a set method of data collection Thus while HEAs are often conducted through qualitative methods (eg focus group
discussions) they may also be based on quantitative modules in household surveys The latter yields more rigorous
information however qualitative data can be used but should be cross-checked or triangulated with other sources
39 See VAM data portal at httpsdatavizvamwfporg
25
Minimum Expenditure Baskets Guidance Note | December 2020
54 Expenditure-based or rightsndashbased approach Pros and consThere are advantages and disadvantages to both types of
approach which should be kept in mind when constructing
the MEB
The expenditure-based approach has the advantage that it
directly reflects the actual demand of the population of interest
as it uses survey data to examine peoplersquos consumption
behaviour It is also fairly straightforward to carry out if good
survey data on the population is available One disadvantage is
that it can be difficult to put into practice when the population
of interest is generally poor (such as in a pre-assistance
refugee situation) because the number of households who can
constitute the reference cohort can be too small to analyse
Also care has to be taken when looking at expenditure patterns
only as the reference cohort may not always cover all of their
essential needs to a desired level (from a ldquorightsrdquo perspective)
For example the food patterns for those ldquojust able to meet
their essential needsrdquo may not always be very nutritionally
diverse as they are based purely on consumption behaviour42
In general the expenditure-based approach should not be applied
without good quality household expenditure data
TIP BOX ADVANTAGES AND DISADVANTAGES OFDIFFERENT APPROACHES TO ESTABLISHING MEBS
Box 16
Pros
Cons
Expenditure-based Rights-based
Straightforward to carry out if household data
is of good quality
Builds on actual consumption patterns of the
population of interest
Difficult to identify reference cohort if
everybody is poor
Survey data may not capture all essential needs
fully from a ldquorightsrdquo perspective
Survey data is not needed
Effective demand can be different from identified
needs leading to a MEB that does not reflect
actual demand and making comparison with
monitoring data tricky
Contains incentives to inflate sector-specific needs
The advantage of the rights-based approach is that
it can be used to construct a MEB without survey data
(although survey data is needed to monitor the MEB) One
disadvantage is that the effective demand of households
can look quite different from the basket that results from
this approach Another disadvantage is that particularly
when constructed in an interagency setting a rights-based
MEB can easily become an instrument for different partners
to compete for and secure funding There is a substantial
incentive to include excessively high sectoral needs if sector-
specific interventions are envisaged Finally if the MEB is
very detailed but the expenditure module in the household
surveys used to monitor peoplersquos expenditures against the
MEB is very crude comparison is difficult and therefore the
practical use of the MEB can be limited Many households
may fall below the MEB simply because of the discrepancy in
methods between the MEB and the monitoring data This is
similar to the issue previously discussed regarding the use of
national poverty lines
Box 16 summarizes the advantages and disadvantages of the
two approaches
42 A study conducted in Nepal showed that the food poverty line is well below the so-called ldquonutrient povertyrdquo line (see Geniez et al 2014)
26
Minimum Expenditure Baskets Guidance Note | December 2020
6 Arriving at a realistic and operationally relevant MEBRegardless of which processes and approaches are used to
construct the MEB it is crucial to arrive at a final result that
is a realistic picture of the cost of essential needs for the
population of interest rooted in actual consumption
behaviour This section looks at how approaches can be
combined to generate a hybrid MEB and how the result can be
ldquoreality checkedrdquo and validated
61 Combining approaches the hybrid MEBAs described in section 54 there are disadvantages to the
expenditure-based and the rights-based MEB approaches that
can affect the final MEB One way to overcome this challenge
may be to combine information from each approach in
a ldquohybridrdquo MEB This means making sure that the MEB is
consistent with the actual consumption behaviour of the
population of interest as found in expenditure data while
keeping the rights-based lens There is no one way to go about
this the method is subject to the availability of expenditure
data and other information on essential needs as well as the
objective of the MEB
When good quality expenditure data with a large enough
sample size is available for constructing the MEB it is good
practice to use the expenditure-based approach as a basis
for the analysis as far as possible If the expenditures of
the reference cohort are subsequently found not to reflect the
costs of covering certain essential needs for the population of
interest rights-based information should be used to reinforce
the MEB with a hybrid model If expenditure data is not
available and cannot be collected a rights-based MEB can be
constructed but should be cross-checked against any available
household-level information on consumption patterns
When starting with the construction ofan expenditure-based MEB
Did the household survey capture all essential needs or
are some not included in the data at all
If some needs are wholly overlooked consider using
rights-based information to capture them but ensure these
needs are actually in demand by the population of interest
and only missing because the survey did not capture them
Are the expenditures that are typically trickier to capture
well reflected and are the reference cohortrsquos expenditures
on them adequate from a rights-based perspective
For example if education expenditures are completely
inadequate for the reference cohort (and this is not because
the reference cohort selected is ldquotoo poorrdquo) consider using
rights-based information to capture them eg by using the
cost of school fees or school supplies like books or
uniforms
Be particularly careful with the inclusion of needs where the
supply of goods or services is far from adequate or may be
inexistent The MEB needs to ultimately reflect consumption
behaviour so adding goods or services that are not
available to the population of interest or not in demand
will lead to an unrealistic MEB
When starting with the construction ofrights-based MEB
Are the identified needs in line with the actual
consumption patterns of the population of interest
Check the reference baskets against any available
information on demand and consumption and adjust items
and quantities to reflect actual consumption patterns This
could be done using data on consumption shares by food
group and non-food group for example
Are there needs that people consider essential and choose
to spend resources on but are not captured by any sector
Check the reference baskets against any available
information on demand and consumption and adjust items
and quantities to reflect actual consumption patterns
The key to constructing a hybrid MEB lies in triangulating
information and asking the right questions during the
analysis When constructing a MEB consider the following
27
Minimum Expenditure Baskets Guidance Note | December 2020
Box 17 contains examples of hybrid MEBs constructed in different contexts
COUNTRYEXAMPLE
HYBRID MEBS IN URBAN SETTINGS IN KINSHASATHE DEMOCRATIC REPUBLIC OF THE CONGOAND FOR SYRIAN REFUGEES IN TURKEY
Box 17
For the MEB calculated as part of an urban assessment in Kinshasa43 a hybrid approach was chosen to deal with
hard-to-capture but essential expenditures such as health and education Health costs are often difficult to estimate as they
are not regular and when they do occur they often make up a large share of monthly expenditures The analysts decided to
estimate health costs through a rights-based approach instead of using expenditures from the survey Qualitative
information from key informants was used to define the cost of one doctorrsquos visit per year for each household member In
each commune the median cost was between CDF5000 and CDF6000 per visit this was represented in the MEB as
CDF500 per household member per month Over-the-counter medication was also included as part of health-related
expenditure through the addition of a per-capita expenditure of CDF1500 every two months sufficient for a course of
antimalarial drugs or antibiotics and simple medication such as painkillers or anti-inflammatory drugs
In Turkey expenditure and price data from different sources was used to assess update and adjust an existing
rights-based MEB44 for Syrian refugees living in the country A hybrid food basket was calculated using detailed information
on the consumption behaviour of Syrian refugees in Lebanon collected through itemized receipts from food assistance
e-cards The resulting food basket was triangulated with the less detailed information available from a household survey on
Syrian refugees in Turkey The results showed strong consistency between consumption behaviour of both groups
The resulting food reference basket for the MEB was then priced with official price statistics data and inserted into the
rights-based MEB Quantities of non-food items were kept as before but updated with current price data To ensure that
the MEB reflected consumption behaviour expenditure shares were triangulated with household data See table a
To value and update the MEB price data was required The official price statistics included higher quality items and brands
consumed more by the average Turkish population than by the poorer refugees To correct for this the difference between
the price of the MEB and the food expenditures of a non-poor cohort were assessed and a correction factor applied to
compensate for the overestimation of the updated MEB
Commodity
Table a Food reference basket ndash MEB for Syrian refugees in Turkey
Daily ration perperson in gram
Dailykilocalorie
Old referential food basketDaily ration perperson in gram
Dailykilocalorie
Revised Turkey food basket
150
200
50
20
30
40
20
8
30
30
5
0
0
0
0
540
684
186
29
65
137
0
28
116
265
0
0
0
0
0
100
50
0
70
0
50
30
50
50
25
5
250
50
30
5
Rice white medium grain
Bulghur wheat
Pasta
Egg whole chicken fresh
Poultry
Beans dried
Cucumber
Cheese canned
Sugar
Oil sunflower fortified
Salt iodised
Bread made from wheat
Yoghurt whole milk (leban)
Tomatoes red ripe
Tea black nutrients per 100ml of brewed tea
360
171
0
100
0
170
0
178
194
221
0
675
31
5
0
Total Kcal 2050 Total Kcal 2104
43 WFP et al 201844 WFP 2018
28
Minimum Expenditure Baskets Guidance Note | December 2020
62 Reality checks and validation with stakeholdersIn addition to asking the right questions of the data as
described in the previous section it is crucial to reality check
results when constructing the MEB This means understanding
whether the MEB provides a picture of the cost of living that
matches the reality on the ground
First of all it is important to check the MEB result with the
real circumstances of the population of interest Focus group
discussions andor key informant interviews can be held when
starting work on the MEB and after a result is obtained in
order to ensure that the MEB is a true reflection of needs and
priorities
The MEB figures can be compared with the national poverty
line ndash even if it is not advisable to use the poverty line directly
as the MEB it is good practice to check the MEB results against
it They can also be checked against any social assistance
transfer values provided in government programmes the
minimum wage or the casual labour rate or any other
information available about needs and cost of living For
instance if the MEB is much higher than what the wages
from one month of work for a typical household can buy
that could indicate that it needs adjustment and that some
of the analytical steps need to be revisited ndash as long as the
wage rate itself is reasonable The same goes for the poverty
line ndash if the two are very far apart it could be a sign that the
MEB analysis should be crosschecked Perhaps the reference
cohort was not adequately selected some sectoral needs were
overestimated or there is a large proportion of consumption of
own production has not been properly taken into account
Something that is often of particular interest is the nutritional
composition of the food part of the MEB As seen above MEB
construction typically starts from the Sphere requirement of
2100 kcalpersonday However since the MEB follows the
actual consumption behaviour of the population of interest
(especially when following an expenditure-based approach)
the resulting food basket reflects what households actually
eat which is not necessarily a nutrient adequate diet If the
basket is found to be very low in essential nutrients it could
be that the reference cohort was not well selected and a
wealthier cohort with a more balanced diet at the 2100 kcal
personday threshold might need to be identified45 However
selecting better-off households will not necessarily lead to a
more nutritionally balanced basket as food preferences are
influenced by a range of factors in addition to budget
Analytical tools to determine the cost of nutritious diets
include Cost of the Diet (CotD) developed by Save the Children
UK and used by WFP in the Fill the Nutrient Gap Analysis
CotD uses linear programming to establish the lowest cost
diet that can meet requirements for energy protein fat and
13 micronutrients for individuals in a population considering
age gender body weight physical activity level and whether
a woman is pregnant or breastfeeding CotD can be thought
of as the lowest cost of an optimal diet considering individual
requirements It is therefore useful in illustrating the needs
of vulnerable populations and their nutrient intake barriers
However it is important to keep in mind that a MEB food
basket may not deliver adequate nutrient intake when used
to set a transfer value for households even if aligned with
an optimal diet As noted above because of household
consumption choices and food allocation within households
having more money to spend may not necessarily lead
households to buy more nutritious food
MEBs should be first and foremost built on consumption
patterns that reflect actual behaviour A large difference in
cost between the MEB food basket and CoTD may hence
be driven by factors such as low availabilityhigh cost of
nutritious foods or household preferences The WFP technical
note on Fill the Nutrient Gap and minimum expenditure
baskets offers further insights into the complementarities
of the two analyses and how to use them on conjunction for
programming purposes46 When a MEB is operationalised
additional nutritional considerations could be necessary
It is important to check the MEB result with the real circumstances of the population of interest Focus group discussions andor key informant interviews can be held when starting work on the MEB and after a result is obtained in order to ensure that the MEB is a true reflection of needs and priorities
45 Note that the 2100 kcal Sphere Standard for daily diet is an estimate based on a population average Nutrient needs vary across the lifecycle It is also recommended that a food basket based on the 2100 kcal threshold should include a minimum of between four and five different food groups
46 Also see WFP 2020b
29
Minimum Expenditure Baskets Guidance Note | December 2020
COUNTRYEXAMPLE
TURKEY NON-FOODBASKET MEBCOMPOSITION VERSUSACTUAL CONSUMPTION
Box 18
In the original rights-based MEB constructed for the
Syrian refugee operation in Turkey 17 percent was
devoted to education expenditure The average
education expenditure share in the pre-assistance
expenditure data was under 2 percent with little
variation by household vulnerability status50 The
large expenditure share in the MEB reflects the
costs for transportation to schools in rural areas
where no buses are available and where the only
way for households to send children to school is to
hire private transport In order to provide for
childrenrsquos right to education the transport costs are
counted for in the MEB
Since the MEB was constructed to assure full access
to all rights the high education expenditure was
justified However a comparison of the theoretical
costs for basic needs as estimated by humanitarian
partners and the actual consumption choices of
households can reveal divergence Even if
households are assisted there is nothing to say that
they will actually start hiring private transport to get
their children to school ie the principal ldquoneedrdquo
identified by humanitarian actors will not necessary
translate into effective demand if the MEB is used as
a basis for transfer value calculations While an
important access problem has been identified other
complementary interventions will likely be needed
to address it
depending on the objective of a particular intervention and
the choices targeted households are likely to make regarding
food and nutrition once they receive a transfer Targeted
nutrition interventions may be needed such as providing
certain nutritious foods for specific groups (through in-kind
assistance or commodity vouchers) and social behavioural
change communication to nudge people towards making
better choices for health and nutrition47 Expenditure data can
be helpful to understand the consumption patterns of people
at different points of the wealth distribution Fill the Nutrient
Gap analysis also examines packages of blanket and targeted
household interventions to estimate the most cost-effective
way to address the nutrient requirements of different target
groups For further considerations including complementary
programming please consult the WFP interim guidance on
transfer values48
MEBs are often constructed in an interagency context such
as the Cash Working Group which helps facilitate dialogue
and validation from the beginning of the process However
sometimes not all clusters or key partners are engaged in such
forums which can limit the buy-in and understanding of the
MEB unless there is adequate consultation It is also essential
to consult government stakeholders and development
partners Endorsement by government counterparts could be
needed if there are existing government safety nets or policies
regarding minimum wages For example if the population of
interest for the MEB are refugees or IDPs and a transfer value
based on the MEB is higher than the social assistance provided
by the Government to the resident population this could be a
point of contention Development partners might also wonder
why a MEB is needed in addition to the national poverty line
Dialogue and validation of the final MEB with partners is
therefore vital49
47 The Fill the Nutrient Gap (FNG) analysis of which CotD is often part can help understand what programming might be needed and how interventions can be combined to improve dietary intake and reach food and nutrition objectives
48 WFP 2020c49 The Cash Learning Partnershiprsquos MEB Tip Sheet contains useful advice on the interagency processes around constructing a MEB Baizan and Klein 201950 Hobbs 2016 and WFP 2018
30
Minimum Expenditure Baskets Guidance Note | December 2020
Naturally the needs of a household increase with the size of
the household How can the different magnitude of needs
for households of different sizes be taken into account when
constructing the MEB
One simple approach is to calculate the per capita MEB
and simply scale it up for households of different sizes For
example if the MEB is constructed for a household of six and
equals USD 120 the per capita MEB would be USD 20 USD and
the MEB for a household of three people would be USD 60
However this proportional scaling ignores one important
factor while the needs of a household grow with each
additional member the increase may not be proportional
This is because some goods consumed within a household
such as food are ldquoprivateldquo in character ndash once a person has
consumed it no one else can consume the same ndash while other
goods such as housing are ldquocommonrdquo or ldquopublicrdquo meaning they
can be shared among household members Hence the needs
for housing space or electricity are not necessarily three times
higher for a household with three members than for a single-
person household This is called economies of scale Changes
in household composition can also influence how needs
grow with household size consider large households with
many children who do not have the same needs as adults
Economies of scale are particularly relevant in contexts where
shared goods constitute a major part of household essential
needs for example where rent payment is a large expense A
one-bedroom apartment may be necessary for a one-person
household but could also possibly house a family of three
who would then share the expenditure When in a context of
large economies of scale the MEB is adjusted to household
size by scaling up average per capita needs proportionally
to household size the resulting MEB will underestimate
the needs for small households and overestimate the
needs for large households by construction This is because
the per capita needs for small households are larger than
this simple scaling reflects This can have implications if the
per capita MEB is used to inform targeting or transfer value
calculations For instance if the needs of smaller households
are underestimated they are more likely to be miscategorized
as being able to meet their essential needs and might therefore
not receive the assistance they require
7 Accounting for household composition and economies of scale
Expenditures
Household sizeno economies of scale expenditures proportional to household sizeeconomies of scale expenditures non-proportional to household size
1 2 3 4 5 6 7 8 9 10
EXPENDITURES PER CAPITA
Figure 3 Economies of scale and expenditures per capita ndash illustration of the concept
31
Minimum Expenditure Baskets Guidance Note | December 2020
In other contexts economies of scale might be smaller
because of the higher relative importance of ldquoprivaterdquo goods
such as food and certain non-food items (for example soap)
or if shared costs such as shelter are not prominent How
household size is catered for in the MEB ultimately depends
on context and how needs are related to household size
Some suggested steps to account for economies of scale and
household composition are listed below
When examining how to account for different household
sizes in the MEB start by ascertaining whether economies
of scale exist and to which extent51 Figure 3 provides a
hypothetical illustration of two extreme cases no economies
of scale at all and strong economies of scale If there are no or
little economies of scale the per capita expenditures will be
very similar across household sizes while they will decrease
by household size if economies of scale are present52
Plotting per capita expenditures against household size
helps enable for this type of examinations It can be useful
to further disaggregate the analysis into different categories
(for instance food non-food or shelter expenditures per
capita) to understand which expenditures might be driving the
economies of scale if present
Box 19 illustrates two different country examples
expenditures by household size for Syrian refugees in
Lebanon and for vulnerable populations in Coxrsquos Bazar
Bangladesh In Lebanon where shelter plays an important
role household expenditures double only at a household size
of 5 and they triple at a household size of 11
COUNTRYEXAMPLE
ECONOMIES OF SCALE INLEBANON AND COXrsquoS BAZAR
Box 19
Figure a shows expenditures by household size compared to one-person households For Syrian refugees in Lebanon
average expenditure doubles only when the household size reaches five and it takes 11 members to triple the expenditures
of a one-person household The economies of scale are therefore large primarily due to the importance of shelter costs for
the refugees
In Coxrsquos Bazar in contrast total expenditures grow almost proportionally with household size (double at a two-person
household triple at a three-person household) Slight economies of scale can be seen for food For non-food expenditures
larger households even spent more per person From this data the economies of scale seem to be small
Figure a Increase in household expenditure by household size comparedto one-person households
Multiplicationfactor
Household sizeHousehold size
100
90
80
70
60
50
40
30
20
10
Coxrsquos Bazar (Bangladesh)Lebanon
1 2 3 4 5 6 7 8 9 10 11
Total Food Non-food
1 2 3 4 5 6 7 8 9 10 11
Note Figure based on authorsrsquo calculations Data from the Vulnerability Assessment of Syrian Refugees in Lebanon (VaSyr) 2017
and the Refugee influx Emergency Vulnerability Assessment (REVA II) 2019
51 Expenditure data is required to perform this analysis If no information on expenditure exists information on how needs change with household size can be collected through qualitative means such as focus group discussions or key informant interviews
52 Theoretically it is possible to also analyse expenditures by household composition but sample sizes rarely allow for such detailed disaggregation
32
Minimum Expenditure Baskets Guidance Note | December 2020
If the analysis reveals small economies of scale or none at all it is reasonable to use a per capita approach to scale up the MEB proportional to household size
Even for food strong economies of scale can be detected
which could be a result of large households being able to
buy food in bulk at a lower price However in Coxrsquos Bazar
where shelter and other shareable non-food goods are of less
importance household expenditures are close to proportional
to household size
If the analysis reveals small economies of scale or none at all
it is reasonable to use a per capita approach to scale up the
MEB proportional to household size If significant economies
of scale are present it is important to think about how to
take this into account when constructing the MEB Here are
some suggestions
One possible solution (in the expenditure-based
approach) is to disaggregate (or re-select see below)
the reference cohort for each household size sub-
sample and using the expenditures for each of these
cohorts construct specific MEBs for each household
size53 This approach takes into account economies of
scale by looking directly at the specific needs of different
size households but only reflects average differences
in household composition within each household size
The approach will most likely suffer from very small
sample sizes once analysis needs to be performed by
household size If this is the case household sizes could
be grouped into categories so that the analysis uses sub-
samples eg for household sizes 1ndash2 3ndash5 and 6ndash8 etc
or other groupings meaningful for the context When
following this approach bear in mind that if the reference
cohort is selected based on expenditure distribution
characteristics such as the removal of extreme deciles or
quintiles this procedure of removal of quintiles or deciles
needs to be repeated within each household size (or
household size group) Otherwise if there are economies
of scale for consumption there is a risk of skewing the
sample against the smallest and largest households
because their per-capita expenditures will be at the
extreme ends of the expenditure distribution
Another solution is to divide the MEB content into
ldquoprivaterdquo (non-shared) and ldquopublicrdquo (shared) consumption
For example food could be non-shared and rent and
fuel shared Examine the MEB expenditures for the
non-shared and shared goods for an average sized
household (or for household sizes around the average
for instance 4ndash6 members in order to leverage a larger
share of the sample) The non-shared value can then be
scaled proportionally to household size while the shared
value is held constant across household sizes This way
the resulting MEB consists of a lsquoflatrsquo and a proportional
element54 This is a relatively crude but intuitive way to
approximate economies of scale Figure 4 provides a
simple illustration of this approach
In the literature on poverty the most common solution
used to adjust for economies of scale and difference
in household composition is to use adult equivalents
instead of per capita numbers These equivalence scales
assign an ldquoadult equivalent numberrdquo to each household
depending on its size and composition taking into
account economies of scale as well as the different needs
of children and adults ie household composition For
example the first adult in the household is counted
as 1 and each additional adult as for example 07 A
child under 15 is counted as a fraction of an adult (eg
05) The effective adult equivalent household size is
then the sum of these adult-equivalent fractions55 Next
total household expenditures are divided by the adult
equivalent household size The MEB is then calculated
using these adjusted per-adult-equivalent expenditures
While this is not necessarily a complicated approach
from an analytical point of view equivalence scales can
53 See Lanjouw (1998) on the construction of poverty lines specific to household size (and composition)53 Alternatively the flat element can also be lsquosemi-flatrsquo and set according to household size groups ndashby examining shared costs and applying the same flat value within eg household size groups 1-2 3-5 6-8 or other
groupings as dictated by the context 53 One common equivalence scale is the OECD scale it assigns the weight 1 to the household head 07 to all additional adults and 05 to all children A household with five people say two adults and three children
consists of 32 adult equivalents (1+07+05+05+05) This is a common scale used in many developing and developed countries Another common scale is to give weight 1 to each adult and different weights to children depending on their age For the official poverty line in Zambia the following weights are given to children 0ndash3 years 036 4ndash6 years 062 7ndash9 years 076 and 10ndash12 years 078
33
Minimum Expenditure Baskets Guidance Note | December 2020
MEB - COMBINING FLAT ANDPROPORTIONAL ELEMENTS -ILLUSTRATION
MEB value
Household size
1 2 3 4 5 6 7 8 9
140
120
100
80
60
40
20
0
Proportional element - non-shared part of MEB
Flat element - shared part of MEB
MEB value per capita
Figure 4 Combining flat and proportional elements in the MEB
prove challenging when operationalising the MEB If
equivalence scales are used in constructing the MEB they
will also need to be applied when measuring household
expenditures compared with the MEB for gap analysis
against the MEB and in monitoring Translating the
concept of equivalence scaling into operational decision
making may therefore prove tricky Additionally results
can be quite sensitive to the choice of equivalence scales
so selecting appropriate scales is important yet often not
straightforward and a range of different scales exist56 In
some countries country-specific equivalence scales may
have been devised for the purpose of the calculation of
the national poverty line
No matter the approach the recommendation is always
to leverage data analysis as much as possible in order
to understand how needs evolve with household size
(and possibly composition) while keeping in mind that
the final MEB needs to be operationally relevant
Particularly in the (common) cases where MEBs are
used to calculate household transfer values it is worth
considering what level of analytical granularity can
feasibly be turned into programmatic action In some
cases it may not be operationally possible to handle
different per-capita size transfers for differently sized
households and the extra effort of achieving accurate
MEB figures by household size may not be worth it
The same general recommendation as for all aspects
of MEB construction also applies here the final result
should be realistic a fair depiction of needs and an
operationally relevant product
56 See for instance httpwwwoecdorgeconomygrowthOECD-Note-EquivalenceScalespdf
34
Minimum Expenditure Baskets Guidance Note | December 2020
A SMEB can be expenditure-based or rights-based or a hybrid of the two approaches depending on data availability and programmatic requirements
The SMEB is the absolute minimum amount required to maintain existence and cover lifesaving needs which could involve the deprivation of certain human rights
A survival minimum expenditure basket (SMEB) is often
constructed alongside a MEB While the MEB is defined as
what a household requires in order to meet their essential
needs on a regular or seasonal basis and its average cost the
SMEB is the absolute minimum amount required to maintain
existence and cover lifesaving needs which could involve the
deprivation of certain human rights However the concepts
of SMEB and MEB have not always been used consistently
by the humanitarian community and are sometimes used
interchangeably It is therefore important to be clear from the
outset of the analysis whether a MEB or a SMEB is the goal
A SMEB can serve at least two purposes First together with
the MEB it can be used to classify households into different
categories of economic capacity to meet their needs whereby
households whose expenditures fall below the SMEB have
highly insufficient economic capacity households between the
SMEB and the MEB have insufficient economic capacity and
households above the MEB have sufficient economic capacity
This information can then be used for profiling people in need
prioritizing beneficiaries or monitoring Second the SMEB
can inform programmatic decisions such as transfer values in
situations where immediate lifesaving assistance is required
The approaches presented here follow the MEB methods
adjusted to suit the different purpose of the SMEB
Accordingly a SMEB can be expenditure-based or rights-
based or a hybrid of the two approaches depending on data
availability and programmatic requirements
8 How to construct a SMEBExpenditure-based approach toconstructing a SMEBThe calculation of an expenditure-based SMEB is closely aligned
with the literature on how to estimate national poverty lines
While the MEB corresponds to an ldquoupperrdquo poverty line a ldquolowerrdquo
extreme or austere poverty line is often defined by taking the
food part of a MEB and adding this to the non-food needs
regarded as the essential minimum for household survival57
But how are survival non-food needs defined based on
expenditure data When people receive assistance it is
sometimes observed that households sell part of their food
rations to cover some non-food items These households forgo
some of the required food intake in order to cover what they
regard as survival non-food needs Using expenditure data to
construct a SMEB a similar idea is explored to calculate the
SMEB analysts identify those households whose total food AND
non-food expenditures are approximately equal to the MEB food
basket amount only In order to access non-food items these
households will compromise their food intake to some extent
because their total expenditures would only be enough to cover
their essential food requirements ie the food MEB anything
spent on non-food items means that they are not meeting their
essential food requirements It is therefore fair to assume that
the amount they choose to spend on non-food items must
be regarded by the households as absolutely necessary The
non-food expenditures of these households can therefore be
considered as the survival non-food needs The SMEB is then
calculated by adding these survival non-food expenditures
to the food MEB This SMEB allows households to meet their
essential food needs and their survival non-food consumption
Note that this approach requires a food MEB figure (either
already available or calculated as part of the SMEB analysis)
57 See Lanjouw 1998 and Haughton and Khandker 2009
35
Minimum Expenditure Baskets Guidance Note | December 2020
The steps for constructing an expenditure-based SMEB are
similar to those taken to construct a MEB with the following
additional considerations
1 Prepare expenditure data the expenditure data source can
be the same as that used for the MEB
2 Select the reference cohort this step is different The cohort
is selected by computing total household expenditures
and comparing them to the food MEB Households with
total expenditures equal to (or in an interval around) the
food MEB are selected as the SMEB reference cohort
3 Establish food basket and 4) Establish non-food basket
Using the SMEB reference cohort start by examining
how much these households spend on non-food items
Add this value to the MEB food value to arrive at the total
value of the SMEB To establish a food and non-food
basket there are two options i) use the MEB food basket
as the SMEB food basket and the non-food expenditures
of the SMEB reference cohort as the non-food basket
or ii) look at a third cohort of households namely those
whose total expenditures are around the just established
total SMEB level examine their food and non-food
expenditures and unpack those into food and non-food
baskets While both options will provide the same overall
value of the SMEB they will differ in composition and the
share of foodnon-food expenditures
Annex 2 provides an illustration of this method of constructing
a SMEB
Rights-based approach to constructing a SMEBThe rights-based approach to constructing a SMEB closely
follows the rights-based approach to constructing a MEB The
main difference is that needs and the items and quantities
included should be restricted to what is regarded as absolutely
necessary for survival ndash which can be challenging to define
This applies to both the food basket and the non-food
basket The MEB can be a starting point if there is one or
the Sphere Standards Sometimes rights-based SMEBs have
been constructed based on a MEB but with lower quantities
for certain items or by keeping some needs while removing
others
Hybrid SMEBs and reality checking resultsAs with MEBs it can be advantageous to combine the
expenditure-based and rights-based approaches to create
a hybrid SMEB The guiding principles are the same as for
the MEB with the difference that the resulting SMEB should
continue to contain nothing but the minimum required for
survival
The same logic applies to the ldquoreality checkrdquo of the SMEB
results as for the MEB it is crucial to ensure that the end
result is realistic and operationally relevant bearing in mind
the conceptual difference between the MEB and the SMEB It
is important to consult the population of interest as much as
possible to understand their views on what constitutes the
bare minimum needed by households to maintain existence
and cover lifesaving needs
COUNTRYEXAMPLE
RIGHTS-BASED SMEBS Box 20
In Lebanon health and education are excluded
from the rights-based SMEB while other needs are
covered with smaller amounts than in the MEB For
example the SMEB has a less diverse food basket
than the MEB58
In Syria the SMEB developed for the northern part
of the country includes food kerosene hygiene
products water and a small amount to cover other
survival goods Rent and utilities are not covered59
58 El Koury and Hajal 201659 Cash Based Responses Technical Working Group Syria 2014
36
Minimum Expenditure Baskets Guidance Note | December 2020
COUNTRYEXAMPLE
HYBRID SMEBs Box 21
For the MEB review in Lebanon for Syrian refugees60 a hybrid SMEB approach was chosen First an expenditure-based
SMEB was used calculating the non-food expenditures of households whose total expenditures equalled the food MEB
and adding this to the food MEB This resulted in very low expenditures on shelter (SMEB A) Due to the importance of
shelter in urban settings a second hybrid version was established calculating the non-food expenditures of households
whose total expenditures equalled the sum of the food MEB plus a rights-based value of a tent as survival shelter the cost
of which came from a rights-based SMEB (SMEB B)
Cohort HH size 4ndash6quint 2ndash4 acceptable FCS
n=923
Cohort total expenditure= food MEB
n=923210
Cohort total expenditure= food MEB + tent value
n=923210
SMEB Afood + survivalnon-food
Hybrid SMEB
437
83
40
93
20
16
29
19
314
1033
437
43
18
37
06
04
17
60
621
437
47
24
42
11
06
20
162
750
Food
Utilities (water gas fuel electricity)
Non-food items (hygiene clothing)
Health
Education
Transport
Communication
Other expenditures
Shelter
Total (USD)
Table a Hybrid SMEB for Syrian refugees
SMEB Bfood + survivalnon-food amp tent
In the Kinshasa urban assessment61 a SMEB was established in addition to the MEB comprising a basket of the most
essential items based on expenditure data used for the MEB For the food SMEB a less diverse diet was established by
excluding certain food items from the food MEB and rescaling the resulting basket to 2100 kcal For the non-food
component the only items included were those that were seen as critical to attaining the most basic standards for safety
food preparation water sanitation and hygiene These consisted of water cooking fuel hygiene products and lighting The
value for these items in the SMEB was derived from the median expenditures of the non-poor cohort
Expenditure-basedMEB
Expenditure-basedSMEB
60 Hohfeld et al 2020 61 WFP et al 2018
37
Minimum Expenditure Baskets Guidance Note | December 2020
91 Adjustment for seasonal or regional price differencesIf the MEB will only be used in one area where prices are
relatively homogenous it is often not necessary to adjust for
regional price differences However if the MEB is intended
for use across different urbanperi-urban andor rural
areas throughout the country it could be vital to adjust for
differences This means that the MEB can be priced differently
for different regions or rural or urbanperi-urban areas (or any
other division of areas that makes sense in relation to price
behaviour) There are a few approaches for this
Price the MEB based on available price data for different
regions or urbanrural areas For the food reference
basket this is most often possible using WFP food prices
or other similar price time series For non-food items
including housing utilities and services this can be more
challenging and may rely on price data collection by
different partners or require new data collection
For some countries price data provided by the national
statistical office is useful In the case of Turkey regional
purchasing power parity indices were used to provide
price estimates for components of the MEB for which
direct price information was not available
Use approximations from expenditure data If the
household survey has sufficient regional coverage the
expenditure levels in different regions can be explored
using the cohort of households just above the poverty
line Care should be taken in using this method
particularly if the sample size by region is very small
9 Additional considerations when constructing MEBs
92 Needs that vary by season or areaIn many countries where WFP works household needs change
with the seasons For instance in Turkey where winters are
cold households have additional needs for heating and warm
clothes to survive In other contexts there are significant
differences in needs between lean and rainy seasons These
changing needs could be a reason to construct different MEB
reference baskets to use at different times during the year or
to design seasonal top-ups In the case of items needed for cold
winters this is often referred to as ldquowinterizationrdquo
While this does not influence the approach used to construct
the MEB it does mean that analysts need to consider when
the data used in its construction was collected and whether
this influences the resulting MEB These considerations also
matter when using the MEB for monitoring if a monitoring
expenditure survey is used to analyse whether peoplersquos
expenditures are above or below the MEB threshold but
the survey is undertaken when prices are high or when
winters are cold if the MEB is not adjusted the results will
probably show a decrease in the percentage of people whose
expenditures are below the MEB as households have higher
needs andor are confronted with higher prices and thus
have higher expenditures without in reality being better off
In Turkey it was estimated that household needs during the
winter would result in a 48 percent increase in minimum
expenditures
In other cases different baskets might be necessary
for different areas of the country eg rural and urban
areas While the MEB should be constructed for a relatively
homogenous population it may sometimes be desirable to
construct a MEB covering all or most of a country where
consumption patterns vary substantially In this case it is
worth considering whether (some elements of) the MEB should
be different between areas Again the selected approach to
construct the MEB should not change but analysts need to
check where the data used in its construction was collected
and whether consumption patterns are very different between
different regionsareas For example in the case of Somalia
the main cereal consumed varies significantly between the
north and the south of the country so the MEB uses different
main cereals in the food reference basket according to region
While the MEB should be constructed for a relatively homogenous population it may sometimes be desirable to construct a MEB covering all or most of a country where consumption patterns vary substantially
38
Minimum Expenditure Baskets Guidance Note | December 2020
Constructing a MEB can be challenging in a sudden onset
emergency or if data is scarce or unavailable Below are some
ideas on how this can be resolved However from a ldquodo no
harmrdquo perspective it is important to emphasize that proxies
should only be used in the interim when no other solutions are
available
Use the national MEB or MEB reference basket If survey
data is not directly available and if the population of
interest is part of and similar to the overall population of
the country the national MEB or MEB reference basket
used for the national poverty line can be used if available
Bear in mind however that this basket should be used on
the condition that it corresponds to data that WFP collects
or has access to through partners or the Government to
ensure that monitoring can be conducted against the MEB
In its most basic form a MEB essentially only requires an
approximate value for the food basket and an estimate
of the average expenditure share that households use
on food Even if no relevant survey data is available this
information should be available to a country office or can
rapidly be collected or approximated
Consider using the minimum wage as a proxy Bear in
mind that while the MEB captures household-level needs
the minimum wage is individual-level income so an
assessment of how many minimum wages are needed per
household depending on the household size is required
It is also advisable to find out how the minimum wage has
been constructed
Ultimately a MEB is a good preparedness measure and should
be constructed before an emergency While both prices and
availability will be affected by an emergency it is still likely to
provide a useful starting point
11 Monitoring and updating the MEB111 Monitoring the cost of the MEBTo be operationally useful the MEB must be tracked and
updated over time to account for price changes If inflation is
high this might have to be done every month if it is low as
little as once a year could be sufficient This should be planned
for when the MEB is constructed to ensure that the costs of the
MEB components can be updated
There are different ways to update the MEB with price changes
If a reference basket is adequately defined (for food
and for non-food items) and prices are collected for the
individual items in the basket by WFP or its partners the
MEB can be priced anew using the updated prices for
each item and multiplying them by the quantities in the
reference basket
A simple solution is to adjust the MEB using the
nationalsub-national CPI or its components This
simply involves updating the cost of the MEB with
the increase (or decrease) in the CPI for the period
in question However in some contexts CPIs are not
updated or relevant for the target population Urban
areas are often over-represented in the national CPI on
the other hand prices and costs faced by for example
displaced populations can be very different from national
price levels In contexts of poverty where food constitutes
a large part of household expenditures the evolution of
food and fuel prices is central when it comes to capturing
price changes
If a CPI does not exist or is not considered applicable
a price index for key consumption items can be
constructed using price data collection for food items
and basic non-food items conducted by WFP andor
other agencies this can then be used to update the cost
of the MEB In contexts where shelter is a major part of
household expenditures changes in shelter costs should
also be captured
10 How to find a proxy for a MEB when data or time is insufficient
39
Minimum Expenditure Baskets Guidance Note | December 2020
112 When to construct a new MEBThe composition of MEB reflects consumption patterns
It is recommended as much as possible keeping the MEB
composition constant and only monitor how cost changes
over time However when there is reason to believe that
consumption patterns of the population for whom the MEB
is constructed has significantly changed it is time to review
its composition and possibly reconstruct the MEB to reflect
these changes
What could suggest such consumption changes have
occurred The figure to the right summarises some typical
events that could result in a significant change in household
consumption Shocks eg a natural disaster might create
additional needs if livelihoods are disrupted or living
conditions are altered Significant changes to the prices of
key consumption items can also alter consumption pattens
insofar it pushes households to substitute certain items
for other items (be aware however that reconstructing
the MEB would only be advisable if the substitution is not
just temporary) Population changes such as an influx of
displaced people or other events that changes the population Figure 5 Possible triggers for MEB composition review
Has a shock occured creating
different or additional needs
Have costs changed significantly
between key consumption items so
that households have substituted
consumption patterns
Has there been a change in
population - eg a displacement
Has the supply side or service
provision changed leading to a
change in household consumption
Shock
Substitution
Population
Supply
composition in the area that the MEB is constructed for
could also lead to a review Finally if supply of essential
goods and services changes this may also shift household
consumption eg if health services are made free of charge
and no longer require households to pay for them
40
Minimum Expenditure Baskets Guidance Note | December 2020
CaLP The Cash Learning Partnership
CBT cash-based transfers
CotD Cost of the Diet [approach]
CPI consumer price index
FCN-N food consumption score ndash nutrition
FCS food consumption score
FNG Fill the Nutrient Gap
HEA household economy approach
LSMS Living standard measurement survey
MEB minimum expenditure basket
OCHA United Nations Office for the Coordination of Humanitarian Affairs
REVA II 2019 Refugee Influx Emergency Vulnerability Analysis
SDG Sustainable Development Goal
SMEB survival minimum expenditure basket
UNHCR Office of the United Nations High Commissioner for Refugees
VAM Vulnerability Analysis and Mapping
WFP World Food Programme
WHO World Health Organization
Abbreviations
41
Minimum Expenditure Baskets Guidance Note | December 2020
Deaton and Grosh 2000 ldquoConsumptionrdquo in Designing Household Survey Questionnaires for Developing Countries Lessons from Ten
Year of LSMS Experience httpsscholarprincetonedudeatonpublicationsconsumption
Deaton and Zaidi 2002 Guidelines for Constructing Consumption Aggregates for Welfare Analysis LSMS Working Paper no 135
httpsopenknowledgeworldbankorghandle1098614101
The Cash Learning Partnership (CaLP) Glossary of terminology for cash and voucher assistance
httpswwwcalpnetworkorglearning-toolsglossary-of-terms
Cash Based Responses Technical Working Group Syria 2014 Northern Syria Survival Minimum Expenditure Basket Guidance
Document httpswwwhumanitarianresponseinfositeswwwhumanitarianresponseinfofilesdocumentsfilesnorthern_
syria_smeb_guidance_document_dec_2014pdf
Cash Working Group Nigeria 2018 Minimum Expenditure Basket for North East Nigeria ndash Justification and recommendations Draft
report httpswwwhumanitarianresponseinfositeswwwhumanitarianresponseinfofilesdocumentsfilesmeb_justification_
guidelinespdf
Baizan and Klein 2019 Minimum Expenditure Basket (MEB) Decision Making Tools The Cash Learning Partnership httpswww
calpnetworkorgpublicationminimum-expenditure-basket-meb-decision-making-tools-2
El Koury and Hajal 2016 MEB and SMEB revision Community Consultation Lebanon Cash Consortium httpsreliefwebintsites
reliefwebintfilesresourcessmeb-fgd-report-final-1pdf
Geniez Mathiassen de Pee Grede and Rose 2014 ldquoIntegrating food poverty and minimum cost diet methods into a single
framework A case study using a Nepalese household expenditure surveyrdquo in Food and Nutrition Bulletin vol 35 no 2 https
journalssagepubcomdoi101177156482651403500201
Haughton and Khandker 2009 Handbook on Inequality and Poverty The World Bank httpsopenknowledgeworldbankorg
handle1098611985
Hobbs 2016 MEBSMEB calculation for Syrians living in Turkey Report commissioned by the Cash-Based Interventions Technical
Working Group in Turkey httpsdata2unhcrorgendocumentsdownload57031
Hohfeld Papavero Sandstrom Dalbai and Renk 2020 Minimum Expenditure Basket for Syrian Refugees in Lebanon ndash Rights-based
versus Expenditure Based Approaches WFP httpsreliefwebintsitesreliefwebintfilesresources76229pdf
Inter-Agency Network for Education in Emergencies (INEE) Minimum Standards for Education Handbook Preparedness Response
Recovery httpsineeorgstandards
Jolliff and Prydz 2016 Estimating International Poverty Lines from Comparable National Thresholds World Bank Policy Research
Paper 7606 httpsopenknowledgeworldbankorgbitstreamhandle1098624148Estimating0int00national0thresholdspdf
Lanjouw 1998 Demystifying Poverty Lines World Bank
Ravallion 1994 ldquoPoverty Comparisonsrdquo in Fundamentals of Pure and Applied Economics 56
Republic of Zambia Central Statistical Office 2016 2015 Living Conditions Monitoring Survey (LCMS) Report httpswwwzamstats
govzmphocadownloadLiving_Conditions201520Living20Conditions20Monitoring20Survey20Reportpdf
Save the Children UK 2018 Basic Needs Assessment Guidance and Toolbox Part I Background and Concepts httpsreliefwebint
reportworldbasic-needs-assessment-guidance-and-toolbox
Sphere Standards Handbook Humanitarian Charter and Minimum Standards in Humanitarian Response 2018 edition httpswww
spherestandardsorghandbook
UNHCR CaLP Danish Refugee Council OCHA Oxfam Save the Children and WFP 2015 Operational Guidance and Toolkit for
Multipurpose Cash Grants httpswwwcalpnetworkorgwp-contentuploads202001operational-guidance-and-toolkit-for-
multipurpose-cash-grants-webpdf
References
42
Minimum Expenditure Baskets Guidance Note | December 2020
WFP 2004 Sampling Guidelines for Vulnerability Analysis Thematic guidance httpsdocumentswfporgstellentgroupspublic
documentsmanual_guide_procedwfp197270pdf
WFP 2008 Food Consumption Analysis Calculation and use of the Food Consumption Score in food security analysis https
documentswfporgstellentgroupspublicdocumentsmanual_guide_procedwfp197216pdf
WFP 2015 Food Consumption Score Nutritional Analysis (FCS-N) Guidelines httpswwwwfporgpublicationsfood-consumption-
score-nutritional-quality-analysis-fcs-n-technical-guidance-note
WFP 2018 Revising the Food Basket and Minimum Expenditure Basket Analysis to calculate a realistic cost of living for refugees in
Turkey httpsreliefwebintreportturkeyrevising-food-basket-minimum-expenditure-basket-analysis-calculate-realistic-cost
WFP 2019 Refugee influx Emergency Vulnerability Assessment ndash Coxrsquos Bazar Bangladesh httpsreliefwebintsitesreliefwebintfiles
resourcesWFP-0000106095pdf
WFP 2020a Essential Needs Assessment Guidance note httpswwwwfporgpublicationsessential-needs-guidelines-july-2018
WFP 2020b Technical Note Fill the Nutrient Gap and Minimum Expenditure Basket An explanation of approaches and identification of
synergies httpsdocswfporgapidocumentsWFP-0000116644download
WFP 2020c Setting the transfer value for CBT interventions Transfer Value Interim Guidance httpsdocswfporgapi
documentsWFP-0000117963download
WFP global Food Security Cluster and Food Security Cluster for the Democratic Republic of the Congo 2018 Adapting to an Urban
World Urban Essential Needs Assessment in the five communes of Kimbanseke Kinsenso Makala Nrsquosele and Selambao (Kinshasa)
httpswwwwfporgpublicationsdemocratic-republic-congo-urban-essential-needs-assessment-five-communes-kimbanseke-
kinsenso
World Health Organisation and Global Health Cluster ndash Cash Task Team 2020 Technical Note on the Inclusion of Health
Expenditures in the Minimum Expenditure Basket and Subsequent Multi-purpose Cash Transfer httpswwwcalpnetworkorg
publicationinclusion-of-health-expenditures-in-the-meb
43
Minimum Expenditure Baskets Guidance Note | December 2020
Survivalnon-foodexpenditure
TOTALEXPENDITURE
FOODEXPENDITURE
MEBnon-foodexpenditure
EXPE
ND
ITU
RE
CONSUMPTION
SMEBAusterepoverty line
Essential foodneeds (MEB)
Acceptable food consumption(based on FCS)
Food expenditure for HHwith tot exp at essential
food needs (MEB)
Analysts should always ensure that the expenditure data is properly cleaned and outliers removed and that it is converted into
the same recall period (food and non-food items usually have different recall periods)
Expenditures should be calculated into per capita figures (eg by dividing total household expenditures by household size) in
order to make them immediately comparable across households (or per adult equivalent see section 7 on how to account for
economies of scale and household composition)
Before starting the MEB analysis it is highly recommended to carry out some simple descriptive analysis of the expenditure
data in order to understand it Analyse the mean and median expenditures for the sample This will help understand the
distribution of the expenditures and detect possible issues While the median is more robust to outliers if a large part of the
sample has 0 expenditures on a particular item the median could be 0 and may therefore not be the best estimate of the need
In this case the mean may be preferable A frequency analysis of non-zero expenditures by groupitem can also be helpful in
understanding whether certain expenditures are infrequent or lumpy
Annex 1 - Good practice when analysing expenditure data
Figure based on Lanjouw 1998 Demystifying poverty lines and World Bank and Ravallion 1994 ldquoPoverty comparisonsrdquo in
Fundamentals of Pure and Applied Economics 56
Annex 2 - The expenditure-based SMEB ndash an illustration

8
Minimum Expenditure Baskets Guidance Note | December 2020
Before embarking on the construction of the MEB
components consider the following questions to decide how
best to approach the analysis
What is the objective and whowill be the partnersStart by setting the objective and consider what the MEB will
be used for once the analysis is finished If the MEB analysis
is a joint exercise identify potential partners possibly in
interagency working groups such as a cash working group find
out what kind of information various organizations can share
and decide on the division of labour In some cases it can be
helpful to write terms of reference for the MEB analysis in
order to clarify the envisioned process and methodology Even
if the MEB analysis will be conducted by just one agency it is
always a good idea to identify partners who will be interested in
the results and who can be consulted along the way12
Who is the MEB being constructed forIt is important to define the population of interest for the
MEB Is it intended to be valid for the entire country Or will it
only be used in a refugee camp for example or a particular
region where needs might differ from those in the rest of
the country It is vital to decide from the start where and for
whom the MEB should apply Since the MEB describes the
cost of essential needs the population for whom the MEB
is constructed should ideally have relatively homogenous
consumption patterns and needs If consumption patterns are
very different consider constructing different MEBs or varying
certain components of the MEB for sections of the population
Have any MEBs already been created for the population of interest If there are one or more MEBs already in use the analytical
exercise might be aimed at updating or even ldquoreality
checkingrdquo the existing baskets to see whether they still match
consumption behaviour and price levels If existing baskets
are found to be valid and relevant it might not be necessary
to start a new MEB analysis
4 Before starting the analysis What information and data is already available and is new data neededConsider what data or analysis is already available from
essential needs assessments or other household surveys
(undertaken by WFP or others) Does the data cover the area
and population of interest Also consider what qualitative
information might be available to shed light on certain
expenditure patterns and whether there is access to market
and price information If the data available is insufficient or
outdated plan to collect fresh data A MEB analysis is greatly
strengthened by being conducted as part of a comprehensive
essential needs assessment The assessment describes the
essential needs of the population of interest which is a
useful starting point for a MEB analysis and complements the
monetary perspective provided by a MEB
Can the national poverty line be usedBefore beginning the construction of a MEB it is useful to find
out if a national poverty line exists and how and when it was
constructed Many countries have their own national poverty
lines so why not use this poverty line (and the corresponding
basket) as the MEB Whenever possible the first choice
should be to align with government practices However this is
often not feasible for three main reasons
Practices vary widely when it comes to constructing
national poverty lines Although the most common
approach is the cost of basic needs using MEBs
sometimes poverty lines are set as a share of the
country mean or median income or expenditures or
as a fixed percentage of the income or expenditure
distribution (although this is mostly not the case in low
income countries) Furthermore even when a MEB has
been constructed to develop the poverty line different
methodologies exist For example sometimes countries
exclude non-food items from their poverty line MEB
Since the MEB describes the cost of essential needs the population for whom the MEB is constructed should ideally have relatively homogenous consumption patterns and needs
12 The Cash Learning Partnershiprsquos MEB Tip Sheet contains useful advice on the interagency processes around constructing a MEB Baizan and Klein 2019
9
Minimum Expenditure Baskets Guidance Note | December 2020
Countries can also have different poverty lines for
different purposes and regions13 These factors can all
limit the use of the national poverty line as the MEB
The population of interest for a MEB could differ from the
overall population of the country and hence the national
poverty line This group of people may have different
essential needs for instance if they live in refugee camps
or do not have access to the same services as the resident
population (eg public education)
The data that WFP typically collects through essential
needs assessments comprehensive food security
and vulnerability analyses emergency food security
assessments baseline assessments and post distribution
monitoring is often much less detailed than that gathered
through the household budget surveys or living standards
measurement surveys used to calculate national poverty
lines It is widely observed that the more detailed the
survey questions about expenditures the higher the
reported expenditures14 If the national poverty line is
constructed using detailed data but the assessment of
household needs or expenditures relative to the poverty
line is based on less detailed data errors in the analysis
are likely to occur Furthermore WFP expenditure
modules do not include asset depreciation which is often
accounted for when calculating national poverty lines
Even if the national poverty line cannot be used in most
cases and especially in humanitarian contexts elements of
the methodology can perhaps be replicated It is therefore
important to find out how the national poverty line is
constructed
How about using the methodology applied for consumer price indices The consumer price index (CPI) is used to measure changes
in price levels based on a weighted average consumer basket
of goods and services In most countries household budget
survey data is used to construct the baskets used to measure
consumer prices A weight that corresponds to average
household expenditure patterns is applied to each component
of the CPI17 This basket is not ideal for MEB calculations
because it corresponds to overall national average
consumption patterns MEBs are based on the consumption
levels and patterns of those households who are just able to
meet their essential needs within the population of interest
(this is further described in the following sections)
13 Jolliff and Prydz 2016 14 Haughton and Khandker 200915 Republic of Zambia Central Statistical Office 2016 16 See Turkish institute of statistics data portal httpsdatatuikgovtrKategoriGetKategorip=Income-Living-Consumption-and-Poverty-10717 The CPI weights are usually available through national statistical offices
COUNTRYEXAMPLE
EXAMPLES OF NATIONAL POVERTY LINESEG Box 2
In Zambia the national poverty line is constructed using the cost of basic needs MEB approach based on a simple food
basket that meets minimum food needs for a family of six15 Imagine this food basket costs USD 100 per month This is
defined as the food poverty line To construct the full poverty line the minimum non-food needs of households are
estimated based on the average share of expenditure that households just above the food poverty line dedicate to needs
other than food Let us say that this corresponds to USD 35 per month The total poverty line is then the sum of the food
and non-food lines which with these hypothetical figures would be USD 100 + USD 35 = USD 135
By contrast Turkey uses the standard European Union approach to measuring poverty which is 50 or 60 percent of
median income16 However eligibility for social assistance is based on the gap between household income and the national
minimum wage
10
Minimum Expenditure Baskets Guidance Note | December 2020
In developing country contexts consumption is generally considered a better metric of wellbeing than income and in turn consumption expenditures as captured in household data generally provide the most reliable measure for consumption
5 Constructing a MEB expenditure-based and rights-based approaches
51 The expenditure-based approachThe expenditure-based approach to constructing a MEB
relies on household-level expenditure data to examine the
consumption behaviour of households who are just able
to meet their essential needs The expenditure level and
consumption patterns for this group of households reveal the
minimum cost of covering essentail food and non-food needs
and therefore form the basis of the expenditure-based MEB
The expenditure-based approach builds on the theory
behind poverty measurement and poverty line construction
To measure poverty the first step is to define a measure
of wellbeing In developing country contexts consumption
is generally considered a better metric of wellbeing than
income and in turn consumption expenditures as captured in
household data generally provide the most reliable measure
for consumption18 Household survey data on expenditures
therefore provides the foundation for measuring wellbeing
and is used to set the MEB threshold
The steps for constructing a MEB using the expenditure-based
approach are explained below
1 Prepare the expenditure data The prerequisite for an expenditure-based MEB is a
good-quality household survey with a detailed expenditure
module with a sufficient sample size representative of the
population for whom the MEB is being constructed (the
ldquopopulation of interestrdquo)
The notion of a ldquodetailedrdquo expenditure module is a
relative one Constructing an expenditure-based MEB
requires more detailed data on different types and
groups of expenditures than is usually gathered by
household surveys conducted in humanitarian settings
However this guidance has been designed to cope
with less detailed expenditure data than that gathered
through extensive national expenditure surveys such
as the very granular expenditure modules typically used
when constructing poverty lines (eg national household
budget surveys household income and expenditure
surveys living standards measurement surveys or other
large-scale household surveys)
What is a sufficient sample size The survey should
always follow good practices for sampling19 Consider
that for MEBs the analysis focuses on the consumption
patterns of a subset of the sample the ldquoreference cohortrdquo
(see next below) The characteristics of the population
and the cohort selection criteria determine the size of
this subsample in relation to the overall sample but
experience shows that the cohort can comprise between
10 and 60 percent of the sample The sample will be
further disaggregated if analysis by household size or
group of household size is desired (see section 7 on
accounting for household sizes)
Using expenditures to understand consumption involves
calculating a ldquoconsumption aggregaterdquo This entails
combining household expenditures on food and non-
food paid in cash or through credit as well as the
imputed monetary values of consumed own production
and received assistance Expenditures are analysed in
per-capita values Box 3 describes this process in more
detail Annex 1 further outlines some best practices when
analysing expenditure data
In addition to the household survey data market price
data is needed in order to estimate the final cost of the
basket The price data should be collected around the
same time as the household survey data
18 Deaton and Zaidi 2002 and Haughton and Khandker 2009 19 For guidance see WFP 2004 Additional resources can be found in the online VAM Resource Centre httpsresourcesvamwfporg
11
Minimum Expenditure Baskets Guidance Note | December 2020
HOW TO
EXPENDITURE DATA IN MEB CALCULATIONS -CONSTRUCTING A LIGHT ldquoCONSUMPTION AGGREGATErdquo
Box 3
Using expenditures to calculate a MEB entails combining different household expenditures to arrive at a measure of house-
hold consumption This is typically referred to as a consumption aggregate although a lighter version is used than those
usually constructed for national poverty lines due to the less granular data typically available for MEB construction20
Expenditures considered in a MEB should reflect household consumption related to essential needs Therefore both
household expenditures made in cash and those on credit must be considered as the latter also reflect current consump-
tion even if payment occurs later If the population can be expected to consume food from their own production the value
of this food should be captured to avoid underestimating food expenditures Lastly if the surveyed households are receiv-
ing and consuming assistance it is advisable to estimate the implied value of this assistance and include it in the expendi-
tures (however care needs to be taken if the population of interest includes a large group of in-kind assistance beneficiar-
ies as this can significantly skew consumption choices see next section on selecting the reference cohort) In summary the
expenditure module should capture any expenditures made in the reference period through cash and credit purchases as
well as the monetary value of consumed own production and assistance Most standard expenditure modules include all
these types of expenditures
Expenditures should be collected for both food and non-food goods and services For food expenditures at the food group
level are required as a minimum If food expenditures are collected at the item level a more granular analysis can be per-
formed The same applies for non-food expenditures they must be available at the group level and item-level data will add
detail However whenever household data is collected a balance needs to be struck between the granularity of the data
and the time and resources available for its collection
The WFP standard expenditure module can be used as a reference for the minimum requirement for expenditure data
collection WFP standard modules can be found in the online VAM Resource Centre httpsresourcesvamwfporg
+ ndash=
2 Select the reference cohort The next step is to identify the households in the survey
data that are just able to meet their essential needs and
examine their expenditures Including households below
this level would generate a basket that does not satisfy
essential needs while including relatively wealthier
households would lead to the inclusion of non-essential
needs and therefore inflate the MEB But what is ldquojust
enoughrdquo
Identifying the cohort of households who are just able
to meet their needs can be challenging How to approach
it depends on the characteristics of the population
and the available data The key is to identify one or
more criteria that can be good proxies for whether
households are just able to meet their essential
needs and that can be observed in the data One
basic indicator would be a food consumption of 2100
kcal per person per day21 However since the available
expenditure data is often too crude to make accurate
calibrations of diet compositions around the 2100
kcal point the use of alternative indicators is highly
recommended These could be indicators such as food
consumption score (FCS) or food consumption score ndash
nutrition (FCS-N)22 which indicate whether households
eat sufficient and balanced diets quality of housing
indicators use of coping strategies (selecting households
who do not engage in severe strategies) or any other
indicator that reflects a householdrsquos ability to meet its
needs Combining several indicators is often useful
20 For thorough guidance on constructing consumption aggregates using data from living standard measurement surveys (LSMS) see Deaton and Zaidi 2002 In most WFP cases household data is less granular than the LSMS-type datasets This section therefore describes how to construct consumption aggregates with less detailed data21 Use of calorie consumption close to the Sphere Standard of 2100 kcalpersonday as the starting point for selecting the reference cohort originates in the cost of basic needs approach used in most national poverty line estimations 22 WFP 2008 and WFP 2015
12
Minimum Expenditure Baskets Guidance Note | December 2020
Figure 2 Selecting the MEB cohort
In simple terms it is useful to think of the green people in the figure as the basis for selecting the reference cohort they are not amongst the worst-off
nor the wealthiest ndash but rather are just able to meet their essential needs
DESTITUTE
WEALTHY
It is also recommended to examine the expenditure
distribution Excluding households in the extreme ends
of the expenditure distribution can help ensure that
the cohort is neither ldquotoo poorrdquo nor ldquotoo wealthyrdquo (eg
by removing households in expenditure quintiles 1 and
5 or similar exclusion criteria based on distribution
characteristics) This is in particular useful if there is a
relatively large spread in wealth across the sampled
population
Figure 2 provides a simplistic depiction of selecting the
reference cohort the aim is to identify households that
are just able to cover their needs and hence do not fall in
either extreme end of the spectrum
13
Minimum Expenditure Baskets Guidance Note | December 2020
Box 4 outlines some typical cases and presents suggestions
for how to select the cohort in a survey sampled on
the population of interest
There is a spread in the
population in terms of well-being
and a proportion is able to cover
their essential needs no
households receive assistance
A relatively large proportion of
households receive food
assistance
The vast majority of the
households are far from being
able to cover their essential
needs (prior to receiving
assistance)
Select households with an acceptable FCS23 or with adequate consumption in FCS-N
who do not use negative coping strategies (or have a high coping strategy index)
Combine or cross-check with other criteria such as dwelling quality or asset index
Exclude extreme expenditure quintiles
Exclude households receiving in-kind food assistance from the reference group (if
sample size allows) This is because any assistance that is not unrestricted cash
might influence the consumption choices of the beneficiary households (in-kind
food means a large portion of food consumption is determined by the assistance
provided not the households) However be aware that if the majority of
households receive some form of restricted assistance excluding them all from the
cohort can lead to sample size issues as well as selection bias
Alternatively to the extent possible avoid using criteria that are highly influenced
by assistance For example in the presence of food assistance the FCS of some
households might be acceptable even if they are not able to meet their essential
needs Furthermore if in-kind food is provided the consumption behaviour of such
households might be skewed as most of their food needs are already covered by
assistance
Consider using dwelling quality an asset index or other similar indicators instead
(or in combination with the FCS)
Consider using a rights-based approach since it will be very difficult to obtain a big
enough sample of households who can meet their essential needs making it
challenging to construct an expenditure-based MEB Carry out a reality check using
the survey data to understand household consumption patterns keeping in mind
that the sample represents a population not able to fulfill their essential needs
HOW TO
REFERENCE COHORT SELECTIONBox 4
Scenario Possible approach to selecting the cohortUse one or several of the below criteria
The use of sensitivity tests is highly recommended in the form
of repetitions of the expenditure analysis for different versions
of the reference cohort this will indicate the extent to which
the choice of cohort selection criteria is influencing the MEB
23 It is usually not advisable to use the FCS as a single criterion If it is used alone the indicator should be capped at a certain level above the acceptable threshold (the FCS builds on a continuous score from 0ndash112 and applies thresholds for poor borderline and acceptable consumption) This is because if all households with acceptable FCS are included this will likely also capture some households who are ldquotoo wealthyrdquo to be considered in the reference cohort
14
Minimum Expenditure Baskets Guidance Note | December 2020
See box 5 for examples of how sensitivity tests can be
conducted as well as how the reference cohort has been
COUNTRYEXAMPLE
SELECTING AND CHECKING THE REFERENCE COHORTCHAD SYRIAN REFUGEES IN LEBANON AND COXrsquoS BAZAR
EG Box 5
Reference cohort sensitivity analysis ndashCoxrsquos Bazar MEB
Table a
In Chad the calculation of an expenditure-based MEB relied on national data collected by the Government during their
annual national food security and nutrition survey The reference cohort for the MEB was selected on the basis of two
criteria FCS between 35 and 70 eg in an interval around the acceptable threshold and no adoption of crisis or emergency
livelihood coping strategies based on the livelihood coping strategies indicator These two criteria ensured that the
selected reference cohort had consumption levels that provided sufficient food security and sustainable livelihood
strategies
For Syrian refugees in Lebanon24 an expenditure-based MEB was calculated by WFP in order to review an existing MEB
Shelter plays an important role as most refugees live in an urban host community and face high rents The FCS reveals
whether people can cover their food needs but could be influenced by the presence of food assistance To ensure results
would be robust against the choice of the cohort two different approaches were compared both included households of 4
to 6 members (as the MEB under review was defined only for households of these sizes) and excluded households in
expenditure quintiles 1 and 5 In version 1 an additional criterion of acceptable FCS was included while in version 2 an
additional criterion of acceptable housing conditions was applied The results were similar for both cohort versions
A MEB was calculated in Coxrsquos Bazar Bangladesh as part of the 2019 Refugee Influx Emergency Vulnerability Analysis
(REVA-II)25 for Rohingya refugees An expenditure-based MEB was built using a large household survey that included
refugees and host community households the reference cohort also included refugees and host communities as the MEB
was meant to apply to both groups Households receiving in-kind food assistance were excluded to avoid possible bias in
consumption choices which would be reflected in the expenditure data The reference cohort was then selected based on
FCS and expenditure quintiles To ascertain that the appropriate cohort had been chosen a sensitivity analysis was
conducted which tested the effect of removing different expenditure quintiles (quintiles 1 and 5 versus quintiles 1 4 and 5)
and including different FCS ranges (FCS 42+ versus FCS 35ndash80) This showed that across different iterations of the reference
cohort total food expenditures were relatively stable while non-food expenditures went up when richer households (eg in
the higher expenditure quintiles) were included This allowed the analysts to select the cohort of households who were just
at the point where the share of food expenditures out of total expenditures began to decrease as a high share of
expenditure on food is often an indicator of vulnerability In other words the selected cohort was just at the point where
households started meeting more needs than just food and the most basic non-food requirements The consumption
patterns of this cohort -highlighted in table a below - therefore became the basis for the MEB
Indicator 1expenditurequintiles
Indicator 2FCS Sample
size Value in taka
Total MEB
Exclude quintiles 1 4 and 5
Exclude quintiles 1 4 and 5
Exclude quintiles 1 and 5
Exclude quintiles 1 and 5
FCS 35ndash80
FCS gt= 42
FCS 35ndash80
FCS gt= 42
403
296
610
474
5259
5324
5691
5740
2304
2299
2990
3082
070
070
066
065
030
030
034
035
7562
7623
8681
8822
Food MEBValue in taka Value in taka
Non-food MEB
identified in different contexts
24 Hohfeld et al 2020 25 WFP 2019
15
Minimum Expenditure Baskets Guidance Note | December 2020
3 Establish the food basketWith the reference cohort identified the food basket value
should be calculated in correspondence with the food
consumption patterns of the reference cohort
To calculate the food basket start by computing the mean
(or median) food expenditures for the chosen reference
cohort It is good practice to compute the overall food
expenditures and break the analysis down into the different
food groups or food items in order to understand how food
consumption is distributed across different foods
Next consider whether an explicit reference food basket
is needed in the MEB this is a list of the food items in the
basket and their quantities Having a reference basket
brings advantages in terms of monitoring of the cost
of the MEB (as new prices can easily be applied to the
quantities) it shows consumption patterns in quantities
and can hence help check if food consumption is adequate
at the given level of expenditures and it can help when
communicating about the MEB It can therefore be a useful
practice to establish one However in some instances
a simple monetary value for the food MEB is sufficient
This could be the case when the MEB is calculated to
review an existing MEB if reference basket is not needed
for operational purposes when time is limited or
where limited data means a reference basket cannot be
adequately calculated Wherever a food reference basket
is not needed the food MEB will simply be the mean (or
median) food expenditures by food groups or food items
as calculated above If a reference food basket is feasible
and desired the next steps depend on the level of detail in
the data available
With expenditure data and market prices a food
reference basket can be approximated using expenditures
by food group or food item and dividing these
expenditures by the relevant food prices This provides
estimates of consumed quantities Expenditures and prices
must be collected at the same time in order to arrive at
correct quantities If for example prices are collected six
months later than expenditures and prices have changed
significantly dividing expenditures by prices will produce
inaccurate estimates
Note that the level of detail and accuracy with which a
food refence basket can be established using expenditures
and prices also depends on whether expenditures
were collected at the food group or food item level Box 6
illustrates how to approximate a reference basket when
expenditures are collected at the food group level and
box 7 shows an example of a food basket estimation from
an assessment in Kinshasa Democratic Republic of the
Congo
If the expenditure module includes consumed quantities
of food in addition to expenditures a food basket can be
established directly based on the consumed quantities by
food group or food item Having data on quantities will
also enable analysts to estimate prices directly from the
survey data by dividing the household expenditure on a
particular food item by the quantity consumed This can be
advantageous as it provides a direct estimate of the prices
households actually paid (unlike a price survey which uses
typically consumed items and is often only conducted
at specific points of sale) On the other hand this may
introduce issues related to non-standard measurement
units that make prices hard to compute and aggregate26
Box 8 shows an example from Coxrsquos Bazar of how a food
reference basket can be established using item-level
expenditures and quantities from the survey data
Once the quantities consumed have been established using
one of the methods described above it is good practice to
check the calories these quantities provide and the balance in
terms of nutrients The basket should be close to the Sphere
Standard of 2100 kcal per person per day ndash if it is not one
option could be to scale the basket Use information on the
calorie content of the different food items in the basket to
calculate the total calorie content of the basket27 The quantities
in the basket can then be scaled up or down to reach 2100
kcal However bear in mind that if the reference cohort has
been well selected and the data is of sufficient quality and
detail the basket should already be close to 2100 kcal If large
rescaling is required investigate the reasons behind this For
the sake of simplification quantities can be rounded and the
basket can be streamlined by removing items with very low
consumption or nutritional value
26 Deaton and Grosh 2000 27 Calorie information of food items can be drawn from a variety of sources The Nutval tool (httpwwwnutvalnet) provides information on calories and other nutrients for a list of items Consider that the
specifications and quality of a product can influence its caloric value (eg whole fish vs fish fillet) ndash it might be necessary to adjust for this for certain items that vary widely Many food composition tables (available from FAO for different continents httpwwwfaoorginfoodsinfoodstables-and-databasesfaoinfoods-databasesen) contain a wastage factor or edible portion conversion factor to convert from edible portions into full products as they are bought on the market
16
Minimum Expenditure Baskets Guidance Note | December 2020
After establishing the reference basket and possibly rescaling
it the basket is priced This is done by multiplying the basket
quantities by the food prices The basket can be priced using
current food prices from a price survey or by estimating food
prices from the expenditure data as described earlier The
result should be close to the expenditures for the reference
cohort although differences could arise from any rescaling or
simplification of the basket
APPROXIMATING A FOOD BASKET WITHGROUP-LEVEL FOOD EXPENDITURES
Box 6
HOW TO
Data quality and granularity has a big impact on the calculation of a food reference basket If consumed quantities are not
directly available in the dataset they need to be calculated by dividing expenditures by prices However this will always
produce an approximation and the more aggregated the data on expenditures is the more approximate the results will be
In particular when the food expenditure data is available at the food group level care needs to be taken when converting
expenditures into quantities
For example to convert expenditures on the food group ldquocerealsrdquo into a reference quantity analysts need to divide cereal
expenditures by the price of cereals But how do they determine the price of cereals This is a food group not a specific item
so there is no exact price The recommended way to approach this is to determine which is the most commonly consumed
item or combination of items for each food group Then a price for the most commonly consumed item or a composite price
of a combination of items can be used to arrive at quantities So if the most commonly consumed cereals for the population
of interest are maize and rice and they are eaten in equal measure by the population the cereal quantities for the reference
basket can be calculated in the following way
Mean cereal expenditures for our reference cohort = 150 shilling
Price of rice = 18 shillingkg
Price of maize = 12 shillingkg
Composite price of rice and maize = (18 + 12) 2 = 15 shillingkg
Cereal quantity consumed = 150 shilling (15 shillingkg) = 10 kg (5 kg rice 5 kg maize)
Of course this is an approximation care needs to be taken when converting expenditures into quantities using
group-level data
Certain food groups may lend themselves more to this approximate conversion than others For example cereals
might be relatively easy to convert using this method as cereal consumption often is concentrated on a few key staples In
contrast vegetable consumption may be so diverse that conversion via prices is not helpful In this latter case one option
could be to obtain reference basket quantities for the groups that can be converted and leave other groups as expenditures
only so that the food MEB becomes a combination of quantities and expenditures
In summary to establish the food basket
i Calculate mean (median) food expenditures by food group
or item If an explicit reference basket with quantities is not
needed stop here and simply use the expenditures as the food
basket
ii Estimate consumed quantities (by dividing expenditures
by prices or directly from data if it contains consumed
quantities)
iii Check the resulting quantities and consider scaling to meet
Sphere Standards
iv Price the basket using market prices or prices derived
from the household data
17
Minimum Expenditure Baskets Guidance Note | December 2020
Table a Food reference basket ndash Kinshasa MEB
COUNTRYEXAMPLE
KINSHASA FOOD REFERENCE BASKET USINGFOOD GROUP EXPENDITURES
Box 7
In the Kinshasa urban essential needs assessment28 the food reference basket for the MEB was established as follows
Expenditure data was available at the food group level only The caloric importance of each food group (column A of the
table below) as a part of the overall food intake was determined For each of the calorie-relevant food groups the most
commonly consumed food item was then identified (eg maize in the case of cereals) (see column B) Using the average per
capita expenditure from the household survey (column C) and the market price for each food item (column D) the
quantities consumed per person per month were approximated (column E) Next the total calorie intake was calculated
(column G) For urban Kinshasa this amounts to 1967 kcal which is close to the Sphere Standard of 2100 kcalpersonday
and suggests that the expenditure data is likely to be reliable However a proportional rescaling to 2100 kcalpersonday
was done to ensure consistency with Sphere (column H) On the basis of the rescaled total calories all values were then
converted back to monthly figures to arrive at a monetary value for each food item (columns I and J) In addition to the
calorie-relevant food items the mean expenditures on other food categories that households regularly consume were
added (vegetables fruit etc) As these food items represent little overall share of peoplersquos calorie consumption (given the
quantities consumed or the type of the foods) they were not included when calories were calculated Furthermore it would
be difficult to select specific food items in each of these categories as they are quite diverse (eg vegetables) However as
most households still consume these food items as part of their usual diet and they provide important micronutrients their
costs need to be reflected in the food MEB The mean expenditure on these food categories was therefore used as a
good-enough approximation for householdsrsquo consumption of these food groups Meals consumed outside the household
were excluded from the MEB as they were not considered essential
Food
grou
p
Food
item
per
capi
ta a
vm
onth
ly e
xp
Pric
e(f
ranc
kg)
kg c
ons
per
mon
th =
CD
food
item
kca
lpe
r 10
0g
kcal
con
s p
er d
ay=(
EF
10)
30
kcal
per
day
res
cale
d=G
(21
001
967)
kg p
er m
onth
res
cale
d=(
H(
F10
))30
roun
ded
MEB
food
-bas
ket
(fra
nc)=
ID
6898
1808
2089
2341
4306
1817
2826
833
799
2509
2144
900
500
1300
2300
2500
2200
77
36
16
10
17
08
920
412
179
302
44
110
1967
360
342
335
890
76
400
TOTAL
982
440
192
322
47
118
2100
82
39
17
11
18
09
7400
1900
2200
2500
4600
1900
2800
800
800
2500
27400
A B C D E F G H I JCereals
Tubers
Pulses
Oilsfats
Meatfish
Sugars
Vegetables
Fruit
Dairy
Condiments
Meals out-
side home
Maize
Cassava
Beans
Veg Oil
Fish
White sugar
Vegetables
Fruit
Dairy
Condiment
Meals out-
side home
29 WFP 2019 Also see box 5
18
Minimum Expenditure Baskets Guidance Note | December 2020
COUNTRYEXAMPLE
COXrsquoS BAZAR FOOD REFERENCE BASKETWITH DETAILED EXPENDITURE AND QUANTITY
Box 8
In the MEB for Coxrsquos Bazar calculated as part of the REVA II assessment expenditures and consumed quantities were
available for 87 food items which formed the basis for the consumption aggregate While the expenditure data was used to
select the appropriate reference cohort the reported quantities were used to determine household calorie intake
Quantities were reported at the food item level and consumed calories were calculated for each item The items were then
categorized by food group (cereals pulses oilsfats vegetables etc) and the total calories from each group were
calculated To create an operationally relevant reference basket without very large numbers of food items the number of
items in each food group were reduced where possible For example 95 percent of the calories that households get from
the food group ldquocerealsrdquo come from rice The cereal food group was therefore simplified to rice only keeping the total
calories sourced from cereals constant and adjusting the quantity of rice in the basket slightly upwards For pulses the four
main consumed items were identified and calories and quantities proportionally adjusted For other food groups such as
vegetables the variety of items consumed within the group was too great to simplify items to a small number for this
group no items were assigned and instead total expenditures on vegetables for the reference cohort were used directly in
the food MEB The total calories of all items were taken into account The resulting basket was close to 2100 kcal so only
minor rescaling was undertaken to arrive at final reference basket of 2100 kcalpersonday
Once the final basket had been determined quantities were priced using median prices derived from the household data
(by dividing expenditures by purchased quantities for the relevant items)
For vegetables fruits meat dairy and condiments expenditures are used directly in the food MEB (converted into monthly per
household values) For all other items quantities per capita per day are multiplied by the item median price (as derived from
the household data) and converted into monthly per household values
The MEB uses household size 5
Note The MEB for Coxrsquos Bazar was calculated for analytical purposes for the REVA II assessment It is not the operational MEB used
for the district
Foodgroup
Fooditem
Consumedquantity(grammescapitaday)
Calories(kcalcapitaday)rescaled
Median prices(takakg)
Value in MEB(taka per HHmonth)
424
14
7
2
1
182
6
81
1
33
6
28
1527
48
27
8
4
78
5
85
1
294
24
0
2100
30
80
60
40
80
-
-
-
-
80
60
-
1909
168
67
14
13
1065
48
1600
15
392
57
345
5691
Cereals
Pulses
Pulses
Pulses
Pulses
Vegetables
Fruit
Meat
Dairy
Fats
Sugar
Condiments
TOTAL FOOD
Rice
Lentil
Chickpea
Anchor daal
Mung
none
none
none
none
Soybean oil
Sugar
none
Table a Food reference basket ndash Coxrsquos Bazar MEB
19
Minimum Expenditure Baskets Guidance Note | December 2020
4 Establish the non-food basketOnce the food component has been established a non-
food component is added There is no wholly satisfactory
way to add a non-food component as it can be difficult to
define an essential minimum Unlike food needs many
non-food needs are often more contextual and are not
easy to anchor in a specific universal threshold (like the
food Sphere Standard of 2100 kcal per person per day)
While Sphere Standards exist they often need to be
contextualized and may not cover all non-food essential
needs
The non-food basket can be established with different
levels of detail depending on the available data and the
level of granularity desired
As for the food expenditures start by calculating the
mean (andor median) non-food expenditures for the
reference cohort If the expenditure data is detailed it can
be used to identify specific non-food needs Expenditures
can be analysed by non-food group (eg shelter hygiene
or transport) to design a non-food basket composed
of group-specific expenditures The precise non-food
components can vary by context but would generally
include the components discussed in the section on
the rights-based MEB below Some non-food items that
expenditure data has been collected for might need to be
excluded for the purpose of constructing the MEB (eg
tobacco which is hard to consider an essential need)
In theory it would be possible to establish a non-food
reference basket with specific quantities using the same
method as for food ie by dividing expenditures by prices
to arrive at quantities However this is usually not feasible
for non-food goods and services simply because non-food
expenditure data is often much harder to break down into
specific items than food expenditure data For instance
even if expenditures on clothing or transportation
are known relating this to exact clothing items or
transportation services and then obtaining accurate
prices for those itemsservices will often prove difficult if
not impossible Therefore as a general recommendation
in the expenditure-based approach when non-food
expenditure data is not available at the item level it is
best to keep the non-food basket to expenditures and not
provide quantities If reliable market price information on
relevant non-food items is available total expenditures
could be checked against prices to obtain an approximate
idea of the adequacy of the non-food expenditures
Particular groups of non-food expenditures may require
special attention due to their nature Box 9 highlights a
few examples
TIP BOXNON-FOOD EXPENDITURES ndashEXPENDITURES OF PARTICULAR INTEREST
$$
$
Box 9
Shelter expenditures can be a tricky component to deal with especially for urban populations If the share of the
population who rent accommodation is significant rent will typically be included in the MEB as it is the cost of shelter an
essential need Indeed it can form quite a significant part of the MEB However if the resulting MEB is compared to actual
expenditures to determine whether households fall below the MEB those who own their dwelling and therefore do not pay
rent might be classified as unable to cover their needs just because they do not have any major shelter expenditures
Therefore large single expenditures such as rent should be included with care and context will determine how shelter
expenditures are handled in the MEB Generally speaking if no or very few households in the population of interest have
major shelter expenditures such as rent this component should be left out of the MEB and no attempt made to impute it
(as is sometimes the case in poverty line estimations) If the majority of households rent their dwellings it is advisable to
include mean rent expenditures in the MEB The trickier case is when the households in the population of interest are split
between a significant number of households living in owned or no-rent housing and a significant number paying rent ndash
here it is difficult to reflect shelter expenditures adequately in the MEB Simply using mean rent estimations in the MEB will
underestimate the need for the renters while overestimating it for those who own their housing or do not pay rent In this
case insofar as data allows one solution could be to impute rent expenditures for the non-renters by estimating the
would-be rental cost for the type of housing they live in Doing this typically requires a housing module in the household
survey that contains information on ownership and types and sizes of housing so rental equivalents can be computed and
imputed for the non-renters
20
Minimum Expenditure Baskets Guidance Note | December 2020
NON-FOOD EXPENDITURES ndashEXPENDITURES OF PARTICULAR INTEREST
$$
$
Box 9
Health expenditures can also be challenging to capture adequately in survey data as such expenditures are often irregular
in nature Bear in mind that health expenditures usually consist of payment for goods such as medicines and for services
such as visits to the doctor When analysing the expenditures and deciding how to include them in the MEB consider which
services may be provided free of charge and what households pay themselves and at what cost30
Care should be taken when it comes to the underreporting of expenditures and treatment of expenditures that are
irregular in nature Remember that the MEB should include all recurrent essential needs but it typically does not include
one-off expenditures ldquolumpy expendituresrdquo such as marriage expenditures or dowries or investments Expenditures
on durables (for instance the purchase of vehicles or large household appliances) are also not included (in national poverty
lines the rental value of the durables owned by households adjusted for depreciation is sometimes included31 however
this is not recommended for MEB calculations)
Household expenditures on savings taxes and debt repayment are not usually included in the MEB as these types of
expenditures do not reflect actual consumption
Tobacco and alcohol are often included in expenditure surveys While households may choose to spend money on these
items they can fairly be assumed to be non-essential and are generally not recommended for inclusion in the MEB
The ldquoquick fixrdquo if data is very limited If the expenditure
data has no or very insufficient data on non-food
expenditures a ldquoquick fixrdquo solution is to use the average
non-food expenditure share of total expenditures This can
often be obtained from external sources such as monitoring
reports or food security assessments This is then added
COUNTRYEXAMPLE
Table a Non-food basket ndash valuesCoxrsquos Bazar
Value in MEB (takaHHmonth)
Non-food group
Toiletries and cleaning
Clothes shoes and towels
Cooking equipment
Education
Fuel and electricity
Medical treatment
Household textiles and small repairs
Communication
Transport
Total non-food
461
521
25
134
775
447
57
274
295
2990
Figure a Non-food basket ndash distribution Coxrsquos Bazar
Note The MEB for Coxrsquos Bazar was calculated for
analytical purposes in the REVA II assessment
It is not the operational MEB for the district
9Communication
10Transport
2Householdtextiles and
small repairs
15Medical
treatment
26Fuel andelectricity
5Education
1Cooking
equipment
17Clothes shoes
and towels
15Toiletries
and cleaning
EXPENDITURE-BASED NON-FOOD REFERENCEBASKET EXAMPLE FROM COXrsquoS BAZAR
Box 10EG
to the cost of the food basket to arrive at the total MEB
However when using an additional data source analysts
should understand how the average share of non-food
expenditures has been calculated and what sample it has
been derived from as it may not reflect the consumption
patterns of the reference cohort
30 The WHO and Global Health Cluster guidance on health expenditures in the MEB has some useful insights into household health expenditures See WHO and Global Health Cluster ndash Cash Task Team 2020 31 Deaton and Zaidi 2002
21
Minimum Expenditure Baskets Guidance Note | December 2020
52 The rights-based approachIn humanitarian contexts ldquoessential needsrdquo have been
understood as referring to access to full rights as set out by
international humanitarian law and the Humanitarian Sphere
Standards The term ldquorights-based MEBrdquo is derived from
this understanding According to the operational guidance
on multipurpose cash grants32 international humanitarian
and human rights law protects the right of crisis-affected
persons to food33 drinking water soap clothing shelter and
lifesaving medical care Humanitarian Sphere Standards
builds on this definition and outlines minimum humanitarian
standards in the areas of food security and nutrition
shelter and settlement health and WASH (water supply
sanitation and hygiene)34 In some contexts residency or legal
documentation is also included Humanitarian standards
for education are outlined in the Education in Emergencies
Minimum Standards Handbook35
The rights-based approach entails defining a detailed list
of the food and non-food items that make up the MEB
reference basket and pricing them using current market
prices MEBs built by the Interagency Cash Working Group or
other interagency coordination forum are often constructed
following the rights-based approach with each sector or
cluster contributing to the needs in their respective sectors
In these cases WFP is usually responsible for defining the
food component of the MEB For both food and non-food
items the reference basket is typically produced or cross-
checked through focus group discussions with the population
of interest partners and key informants It is usually put
together based on the needs of an average-sized household
1 Establish the food basketTo construct the food basket for a rights-based MEB compile
a list of food items and their quantities The Sphere Standards
offer a useful starting point recommending a diet of 2100
kcal per person per day with 10ndash12 percent of daily energy
intake from protein and 17 percent from fats36 The food
basket should be adapted to local diets and preferences
2 Establish the non-food basketOnce the food basket has been established a non-food basket
should be added In the rights-based approach this is typically
done by quantifying needs by producing a list of items by
sector Some examples are found below
Shelter This is the cost of accommodation that meets
basic shelter needs and rights What this means in practice
will depend on the context driven for example by weather
conditions and what is realistically available to the population
Utilities These include the cost of basic utilities such as safe
drinking water and depending on the context electricity
Non-food items These reflect basic household needs
related to cooking clothing and hygiene plus other general
household items Cooking gasfuel or firewood is often
included In line with the definition of the MEB the list should
focus on recurrent needs In practice these non-food items
can look very different depending on the context 38
Services This includes the costs of accessing basic services
such as healthcare education transport and communication
Healthcare costs are often difficult to quantify since they
are inherently irregular large and unpredictable Typically
however only basic minimum needs are covered in the MEB
such as eg two visits per year to the doctor expenses for
critical events deliveries and medicines are sometimes also
included Note that even if a need is not covered by the MEB
it does not mean that these needs do not need to be met for
the population of interest Health can be an example of this
health needs are often better met through service provision
than purchased through the market and therefore may
be only partially reflected in the MEB However guidance
from WHO and the Global Health Cluster notes that people
tend to have some level of health expenditures even when
COUNTRYEXAMPLE
SHELTER IN THE MEBFOR SYRIAN REFUGEES
EG Box 11
For the Syrian refugee operation in Turkey the MEB
includes the costs of shelter that meets certain
standards such as a minimum of 35 m2 per
person access to a toilet and running water
32 UNHCR et al 2015 33 Defined as energy needs not considering full nutrient needs (protein vitamins minerals etc) 34 See the Sphere Standards Handbook 35 INEE 2010 36 Further recommendations on micronutrient requirements can be found in the Sphere Standards Handbook37 Hobbs 201638 For some refugee contexts the Office of the United Nations High Commissioner for Refugees (UNHCR) has lists of specific items which can be considered for the MEB
22
Minimum Expenditure Baskets Guidance Note | December 2020
policies are in place that require the free public provision of
health services39
Education costs usually cover school fees materials
uniforms and transport depending on what households
have to pay themselves and what is publicly available
Transport and communication needs are often defined as
the average transport and communication costs reported by
household surveys and then validated with the communities
COUNTRYEXAMPLE
EXAMPLE OF A RIGHTS-BASED MEBFOR NORTHEAST NIGERIA
Box 12EG
The northeast Nigeria cash working group designed a MEB for a household of seven people40 the resulting reference
basket is shown below
Sectorgroup
Item Quantity(7 pers HH)
Sectorgroup
Item Quantity(7 pers HH)
Cooking fuel
WASH
Cooking fuel
WASH
Transportation
Communication
Health
Education
Firewoodbriquette
charcoal
Water + vendor fee
Bathing soap
Laundry soap
Sanitary pads
Firewoodbriquette
charcoal
Water + vendor fee
Bathing soap
Laundry soap
Sanitary pads
Rides
Airtime 500 NGN
Average expense
Pen
Pencil
Notebook
1 bag
158 jerrycans
13 bars
3 bars
4 packs
1 bag
158 jerrycans
13 bars
3 bars
4 packs
10 rides
1
7 pers
3 pcs
3 pcs
3 pcs
Table a MEB example northeast Nigeria
27 kg
45 kg
135 kg
18 L
27 kg
18 kg
36 L
09 kg
144 kg
2 kg
2 kg
1 kg
05 kg
12pcs
1L
Food Rice
Maize
Beans
Palm oil
Groundnuts
Sugar
Vegetable oil
Salt
Onion
Non-leafy vegetables
Leafy vegetables
Fruits
Meats
Chicken eggs
Vinegar
communication needs can also be specified as the cost of a
SIM card with a certain amount of data or airtime
3 Price the reference basketWith the food and non-food reference baskets established
the list of items and quantities are now priced using updated
prices from markets relevant to the population of interest
The pricing should be done based on actual current market
prices This produces the final rights-based MEB
39 WHO and Global Health Cluster ndash Cash Task Team 2020 40 Cash Working Group Nigeria 2018
23
Minimum Expenditure Baskets Guidance Note | December 2020
MEB APPROACHES ndash CONSTRUCTION SUMMARYBox 13
HOW TO
Rights-based approach
Establish the food basket
Define a list of relevant and locally preferred and
available food items and their quantities The Sphere
Standards can be used as a reference
Establish the non-food basket
Define a list of essential non-food items relevant to the
population of interest and their quantities Services such
as education or transport can also be included The list is
usually put together sector by sector
Price the basket
Use current market prices for the food and non-food
items in the reference baskets to calculate the price of
the basket Use prices from markets relevant to the
population of interest
1
2
3
4
1
2
3
Expenditure-based approach
Prepare the expenditure data
Ensure the data is cleaned Compute expenditures by
combining cash and credit expenditures the value of
consumed own production and consumed assistance
for both food and non-food expenditures Compute
expenditures as per capita figures
Select the reference cohort
Identify households ldquojust able to meet their essential
needsrdquo using indicators such as FCS FCS-N housing or
others excluding households in extreme quantiles of
expenditure distribution or other criteria or
combination of criteria Check the sensitivity of the
results to the selection of reference cohort
Establish the food basket
Calculate mean (median) food expenditures by food
group or item Either stop here or ndash to obtain a refence
basket ndash estimate consumed quantities check the
calorie content of the resulting quantities and consider
scaling them to Sphere Standards Price the basket
using market prices or prices derived from the
household data
Establish the non-food basket
Calculate mean (median) non-food expenditures by
non-food group or item If item-level data and prices
are available it is possible to derive a non-food
reference basket using same methodology as for the
food basket otherwise the non-food basket will
comprise the expenditures at the group level If a
quick-fix solution is needed add the average household
non-food expenditure share to the food MEB
53 Summary and data needs for expenditurendashbased and rights-based approachesBox 13 summarizes the steps to follow in order to construct a
MEB using an expenditure-based or a rights-based approach
24
Minimum Expenditure Baskets Guidance Note | December 2020
Qualitative understanding
of essential needs for the
population of interest
Representative household
survey with detailed
expenditure module
List of ldquorights-basedrdquo needs
Price information
Focus group discussions with key informants or population
of interest
Literature review of existing information on the essential needs of
the population of interest
WFP essential needs assessment emergency food security
assessment or comprehensive food security and vulnerability
analysis or other representative pre-assistance baseline survey
National household budget surveys household income and
expenditure surveys living standard measurement surveys or
other large-scale household survey
Clusters Cash Working Group other interagency forum
Sectoral assessments other secondary information
Price data series covering the area of interest for relevant food
and non-food items and services from WFP (Dataviz41 has
up-to-date price information) or partners
Price indices from national statistical offices
Prices derived from household expenditure data where quantities
are also reported
Suggested sources Expe
ndit
urendash
base
d
Righ
tsndashb
ased
INFORMATION NEEDS AND SOURCESMEB APPROACHES
Box 14
HOW TO
Information need
TIP BOXWHAT IF DATA USINGA HOUSEHOLD ECONOMY APPROACH IS AVAILABLE
$Box 15
The household economy approach (HEA) developed by Save The Children is commonly used for analysing food security and
livelihoods It is based on understanding how households normally access income food and other itemsservices required
for survival established through a baseline analysis As part of the baseline the HEA defines livelihood zones where
households share similar strategies for obtaining food and income It also distinguishes households within these livelihood
zones in at least three (often four and sometimes more) wealth groups The HEA baseline quantifies the sources of food
and income and the expenditure patterns for each wealth group and livelihood zone
The information collected on expenditures can be used as a data source for calculating a MEB However due to the relative
nature of the wealth cut-off points used there is no set standard regarding which group should be the reference for the
MEB If HEA data is utilized it is important to understand how it was collected ndash the HEA is simply an analytical framework
not a set method of data collection Thus while HEAs are often conducted through qualitative methods (eg focus group
discussions) they may also be based on quantitative modules in household surveys The latter yields more rigorous
information however qualitative data can be used but should be cross-checked or triangulated with other sources
39 See VAM data portal at httpsdatavizvamwfporg
25
Minimum Expenditure Baskets Guidance Note | December 2020
54 Expenditure-based or rightsndashbased approach Pros and consThere are advantages and disadvantages to both types of
approach which should be kept in mind when constructing
the MEB
The expenditure-based approach has the advantage that it
directly reflects the actual demand of the population of interest
as it uses survey data to examine peoplersquos consumption
behaviour It is also fairly straightforward to carry out if good
survey data on the population is available One disadvantage is
that it can be difficult to put into practice when the population
of interest is generally poor (such as in a pre-assistance
refugee situation) because the number of households who can
constitute the reference cohort can be too small to analyse
Also care has to be taken when looking at expenditure patterns
only as the reference cohort may not always cover all of their
essential needs to a desired level (from a ldquorightsrdquo perspective)
For example the food patterns for those ldquojust able to meet
their essential needsrdquo may not always be very nutritionally
diverse as they are based purely on consumption behaviour42
In general the expenditure-based approach should not be applied
without good quality household expenditure data
TIP BOX ADVANTAGES AND DISADVANTAGES OFDIFFERENT APPROACHES TO ESTABLISHING MEBS
Box 16
Pros
Cons
Expenditure-based Rights-based
Straightforward to carry out if household data
is of good quality
Builds on actual consumption patterns of the
population of interest
Difficult to identify reference cohort if
everybody is poor
Survey data may not capture all essential needs
fully from a ldquorightsrdquo perspective
Survey data is not needed
Effective demand can be different from identified
needs leading to a MEB that does not reflect
actual demand and making comparison with
monitoring data tricky
Contains incentives to inflate sector-specific needs
The advantage of the rights-based approach is that
it can be used to construct a MEB without survey data
(although survey data is needed to monitor the MEB) One
disadvantage is that the effective demand of households
can look quite different from the basket that results from
this approach Another disadvantage is that particularly
when constructed in an interagency setting a rights-based
MEB can easily become an instrument for different partners
to compete for and secure funding There is a substantial
incentive to include excessively high sectoral needs if sector-
specific interventions are envisaged Finally if the MEB is
very detailed but the expenditure module in the household
surveys used to monitor peoplersquos expenditures against the
MEB is very crude comparison is difficult and therefore the
practical use of the MEB can be limited Many households
may fall below the MEB simply because of the discrepancy in
methods between the MEB and the monitoring data This is
similar to the issue previously discussed regarding the use of
national poverty lines
Box 16 summarizes the advantages and disadvantages of the
two approaches
42 A study conducted in Nepal showed that the food poverty line is well below the so-called ldquonutrient povertyrdquo line (see Geniez et al 2014)
26
Minimum Expenditure Baskets Guidance Note | December 2020
6 Arriving at a realistic and operationally relevant MEBRegardless of which processes and approaches are used to
construct the MEB it is crucial to arrive at a final result that
is a realistic picture of the cost of essential needs for the
population of interest rooted in actual consumption
behaviour This section looks at how approaches can be
combined to generate a hybrid MEB and how the result can be
ldquoreality checkedrdquo and validated
61 Combining approaches the hybrid MEBAs described in section 54 there are disadvantages to the
expenditure-based and the rights-based MEB approaches that
can affect the final MEB One way to overcome this challenge
may be to combine information from each approach in
a ldquohybridrdquo MEB This means making sure that the MEB is
consistent with the actual consumption behaviour of the
population of interest as found in expenditure data while
keeping the rights-based lens There is no one way to go about
this the method is subject to the availability of expenditure
data and other information on essential needs as well as the
objective of the MEB
When good quality expenditure data with a large enough
sample size is available for constructing the MEB it is good
practice to use the expenditure-based approach as a basis
for the analysis as far as possible If the expenditures of
the reference cohort are subsequently found not to reflect the
costs of covering certain essential needs for the population of
interest rights-based information should be used to reinforce
the MEB with a hybrid model If expenditure data is not
available and cannot be collected a rights-based MEB can be
constructed but should be cross-checked against any available
household-level information on consumption patterns
When starting with the construction ofan expenditure-based MEB
Did the household survey capture all essential needs or
are some not included in the data at all
If some needs are wholly overlooked consider using
rights-based information to capture them but ensure these
needs are actually in demand by the population of interest
and only missing because the survey did not capture them
Are the expenditures that are typically trickier to capture
well reflected and are the reference cohortrsquos expenditures
on them adequate from a rights-based perspective
For example if education expenditures are completely
inadequate for the reference cohort (and this is not because
the reference cohort selected is ldquotoo poorrdquo) consider using
rights-based information to capture them eg by using the
cost of school fees or school supplies like books or
uniforms
Be particularly careful with the inclusion of needs where the
supply of goods or services is far from adequate or may be
inexistent The MEB needs to ultimately reflect consumption
behaviour so adding goods or services that are not
available to the population of interest or not in demand
will lead to an unrealistic MEB
When starting with the construction ofrights-based MEB
Are the identified needs in line with the actual
consumption patterns of the population of interest
Check the reference baskets against any available
information on demand and consumption and adjust items
and quantities to reflect actual consumption patterns This
could be done using data on consumption shares by food
group and non-food group for example
Are there needs that people consider essential and choose
to spend resources on but are not captured by any sector
Check the reference baskets against any available
information on demand and consumption and adjust items
and quantities to reflect actual consumption patterns
The key to constructing a hybrid MEB lies in triangulating
information and asking the right questions during the
analysis When constructing a MEB consider the following
27
Minimum Expenditure Baskets Guidance Note | December 2020
Box 17 contains examples of hybrid MEBs constructed in different contexts
COUNTRYEXAMPLE
HYBRID MEBS IN URBAN SETTINGS IN KINSHASATHE DEMOCRATIC REPUBLIC OF THE CONGOAND FOR SYRIAN REFUGEES IN TURKEY
Box 17
For the MEB calculated as part of an urban assessment in Kinshasa43 a hybrid approach was chosen to deal with
hard-to-capture but essential expenditures such as health and education Health costs are often difficult to estimate as they
are not regular and when they do occur they often make up a large share of monthly expenditures The analysts decided to
estimate health costs through a rights-based approach instead of using expenditures from the survey Qualitative
information from key informants was used to define the cost of one doctorrsquos visit per year for each household member In
each commune the median cost was between CDF5000 and CDF6000 per visit this was represented in the MEB as
CDF500 per household member per month Over-the-counter medication was also included as part of health-related
expenditure through the addition of a per-capita expenditure of CDF1500 every two months sufficient for a course of
antimalarial drugs or antibiotics and simple medication such as painkillers or anti-inflammatory drugs
In Turkey expenditure and price data from different sources was used to assess update and adjust an existing
rights-based MEB44 for Syrian refugees living in the country A hybrid food basket was calculated using detailed information
on the consumption behaviour of Syrian refugees in Lebanon collected through itemized receipts from food assistance
e-cards The resulting food basket was triangulated with the less detailed information available from a household survey on
Syrian refugees in Turkey The results showed strong consistency between consumption behaviour of both groups
The resulting food reference basket for the MEB was then priced with official price statistics data and inserted into the
rights-based MEB Quantities of non-food items were kept as before but updated with current price data To ensure that
the MEB reflected consumption behaviour expenditure shares were triangulated with household data See table a
To value and update the MEB price data was required The official price statistics included higher quality items and brands
consumed more by the average Turkish population than by the poorer refugees To correct for this the difference between
the price of the MEB and the food expenditures of a non-poor cohort were assessed and a correction factor applied to
compensate for the overestimation of the updated MEB
Commodity
Table a Food reference basket ndash MEB for Syrian refugees in Turkey
Daily ration perperson in gram
Dailykilocalorie
Old referential food basketDaily ration perperson in gram
Dailykilocalorie
Revised Turkey food basket
150
200
50
20
30
40
20
8
30
30
5
0
0
0
0
540
684
186
29
65
137
0
28
116
265
0
0
0
0
0
100
50
0
70
0
50
30
50
50
25
5
250
50
30
5
Rice white medium grain
Bulghur wheat
Pasta
Egg whole chicken fresh
Poultry
Beans dried
Cucumber
Cheese canned
Sugar
Oil sunflower fortified
Salt iodised
Bread made from wheat
Yoghurt whole milk (leban)
Tomatoes red ripe
Tea black nutrients per 100ml of brewed tea
360
171
0
100
0
170
0
178
194
221
0
675
31
5
0
Total Kcal 2050 Total Kcal 2104
43 WFP et al 201844 WFP 2018
28
Minimum Expenditure Baskets Guidance Note | December 2020
62 Reality checks and validation with stakeholdersIn addition to asking the right questions of the data as
described in the previous section it is crucial to reality check
results when constructing the MEB This means understanding
whether the MEB provides a picture of the cost of living that
matches the reality on the ground
First of all it is important to check the MEB result with the
real circumstances of the population of interest Focus group
discussions andor key informant interviews can be held when
starting work on the MEB and after a result is obtained in
order to ensure that the MEB is a true reflection of needs and
priorities
The MEB figures can be compared with the national poverty
line ndash even if it is not advisable to use the poverty line directly
as the MEB it is good practice to check the MEB results against
it They can also be checked against any social assistance
transfer values provided in government programmes the
minimum wage or the casual labour rate or any other
information available about needs and cost of living For
instance if the MEB is much higher than what the wages
from one month of work for a typical household can buy
that could indicate that it needs adjustment and that some
of the analytical steps need to be revisited ndash as long as the
wage rate itself is reasonable The same goes for the poverty
line ndash if the two are very far apart it could be a sign that the
MEB analysis should be crosschecked Perhaps the reference
cohort was not adequately selected some sectoral needs were
overestimated or there is a large proportion of consumption of
own production has not been properly taken into account
Something that is often of particular interest is the nutritional
composition of the food part of the MEB As seen above MEB
construction typically starts from the Sphere requirement of
2100 kcalpersonday However since the MEB follows the
actual consumption behaviour of the population of interest
(especially when following an expenditure-based approach)
the resulting food basket reflects what households actually
eat which is not necessarily a nutrient adequate diet If the
basket is found to be very low in essential nutrients it could
be that the reference cohort was not well selected and a
wealthier cohort with a more balanced diet at the 2100 kcal
personday threshold might need to be identified45 However
selecting better-off households will not necessarily lead to a
more nutritionally balanced basket as food preferences are
influenced by a range of factors in addition to budget
Analytical tools to determine the cost of nutritious diets
include Cost of the Diet (CotD) developed by Save the Children
UK and used by WFP in the Fill the Nutrient Gap Analysis
CotD uses linear programming to establish the lowest cost
diet that can meet requirements for energy protein fat and
13 micronutrients for individuals in a population considering
age gender body weight physical activity level and whether
a woman is pregnant or breastfeeding CotD can be thought
of as the lowest cost of an optimal diet considering individual
requirements It is therefore useful in illustrating the needs
of vulnerable populations and their nutrient intake barriers
However it is important to keep in mind that a MEB food
basket may not deliver adequate nutrient intake when used
to set a transfer value for households even if aligned with
an optimal diet As noted above because of household
consumption choices and food allocation within households
having more money to spend may not necessarily lead
households to buy more nutritious food
MEBs should be first and foremost built on consumption
patterns that reflect actual behaviour A large difference in
cost between the MEB food basket and CoTD may hence
be driven by factors such as low availabilityhigh cost of
nutritious foods or household preferences The WFP technical
note on Fill the Nutrient Gap and minimum expenditure
baskets offers further insights into the complementarities
of the two analyses and how to use them on conjunction for
programming purposes46 When a MEB is operationalised
additional nutritional considerations could be necessary
It is important to check the MEB result with the real circumstances of the population of interest Focus group discussions andor key informant interviews can be held when starting work on the MEB and after a result is obtained in order to ensure that the MEB is a true reflection of needs and priorities
45 Note that the 2100 kcal Sphere Standard for daily diet is an estimate based on a population average Nutrient needs vary across the lifecycle It is also recommended that a food basket based on the 2100 kcal threshold should include a minimum of between four and five different food groups
46 Also see WFP 2020b
29
Minimum Expenditure Baskets Guidance Note | December 2020
COUNTRYEXAMPLE
TURKEY NON-FOODBASKET MEBCOMPOSITION VERSUSACTUAL CONSUMPTION
Box 18
In the original rights-based MEB constructed for the
Syrian refugee operation in Turkey 17 percent was
devoted to education expenditure The average
education expenditure share in the pre-assistance
expenditure data was under 2 percent with little
variation by household vulnerability status50 The
large expenditure share in the MEB reflects the
costs for transportation to schools in rural areas
where no buses are available and where the only
way for households to send children to school is to
hire private transport In order to provide for
childrenrsquos right to education the transport costs are
counted for in the MEB
Since the MEB was constructed to assure full access
to all rights the high education expenditure was
justified However a comparison of the theoretical
costs for basic needs as estimated by humanitarian
partners and the actual consumption choices of
households can reveal divergence Even if
households are assisted there is nothing to say that
they will actually start hiring private transport to get
their children to school ie the principal ldquoneedrdquo
identified by humanitarian actors will not necessary
translate into effective demand if the MEB is used as
a basis for transfer value calculations While an
important access problem has been identified other
complementary interventions will likely be needed
to address it
depending on the objective of a particular intervention and
the choices targeted households are likely to make regarding
food and nutrition once they receive a transfer Targeted
nutrition interventions may be needed such as providing
certain nutritious foods for specific groups (through in-kind
assistance or commodity vouchers) and social behavioural
change communication to nudge people towards making
better choices for health and nutrition47 Expenditure data can
be helpful to understand the consumption patterns of people
at different points of the wealth distribution Fill the Nutrient
Gap analysis also examines packages of blanket and targeted
household interventions to estimate the most cost-effective
way to address the nutrient requirements of different target
groups For further considerations including complementary
programming please consult the WFP interim guidance on
transfer values48
MEBs are often constructed in an interagency context such
as the Cash Working Group which helps facilitate dialogue
and validation from the beginning of the process However
sometimes not all clusters or key partners are engaged in such
forums which can limit the buy-in and understanding of the
MEB unless there is adequate consultation It is also essential
to consult government stakeholders and development
partners Endorsement by government counterparts could be
needed if there are existing government safety nets or policies
regarding minimum wages For example if the population of
interest for the MEB are refugees or IDPs and a transfer value
based on the MEB is higher than the social assistance provided
by the Government to the resident population this could be a
point of contention Development partners might also wonder
why a MEB is needed in addition to the national poverty line
Dialogue and validation of the final MEB with partners is
therefore vital49
47 The Fill the Nutrient Gap (FNG) analysis of which CotD is often part can help understand what programming might be needed and how interventions can be combined to improve dietary intake and reach food and nutrition objectives
48 WFP 2020c49 The Cash Learning Partnershiprsquos MEB Tip Sheet contains useful advice on the interagency processes around constructing a MEB Baizan and Klein 201950 Hobbs 2016 and WFP 2018
30
Minimum Expenditure Baskets Guidance Note | December 2020
Naturally the needs of a household increase with the size of
the household How can the different magnitude of needs
for households of different sizes be taken into account when
constructing the MEB
One simple approach is to calculate the per capita MEB
and simply scale it up for households of different sizes For
example if the MEB is constructed for a household of six and
equals USD 120 the per capita MEB would be USD 20 USD and
the MEB for a household of three people would be USD 60
However this proportional scaling ignores one important
factor while the needs of a household grow with each
additional member the increase may not be proportional
This is because some goods consumed within a household
such as food are ldquoprivateldquo in character ndash once a person has
consumed it no one else can consume the same ndash while other
goods such as housing are ldquocommonrdquo or ldquopublicrdquo meaning they
can be shared among household members Hence the needs
for housing space or electricity are not necessarily three times
higher for a household with three members than for a single-
person household This is called economies of scale Changes
in household composition can also influence how needs
grow with household size consider large households with
many children who do not have the same needs as adults
Economies of scale are particularly relevant in contexts where
shared goods constitute a major part of household essential
needs for example where rent payment is a large expense A
one-bedroom apartment may be necessary for a one-person
household but could also possibly house a family of three
who would then share the expenditure When in a context of
large economies of scale the MEB is adjusted to household
size by scaling up average per capita needs proportionally
to household size the resulting MEB will underestimate
the needs for small households and overestimate the
needs for large households by construction This is because
the per capita needs for small households are larger than
this simple scaling reflects This can have implications if the
per capita MEB is used to inform targeting or transfer value
calculations For instance if the needs of smaller households
are underestimated they are more likely to be miscategorized
as being able to meet their essential needs and might therefore
not receive the assistance they require
7 Accounting for household composition and economies of scale
Expenditures
Household sizeno economies of scale expenditures proportional to household sizeeconomies of scale expenditures non-proportional to household size
1 2 3 4 5 6 7 8 9 10
EXPENDITURES PER CAPITA
Figure 3 Economies of scale and expenditures per capita ndash illustration of the concept
31
Minimum Expenditure Baskets Guidance Note | December 2020
In other contexts economies of scale might be smaller
because of the higher relative importance of ldquoprivaterdquo goods
such as food and certain non-food items (for example soap)
or if shared costs such as shelter are not prominent How
household size is catered for in the MEB ultimately depends
on context and how needs are related to household size
Some suggested steps to account for economies of scale and
household composition are listed below
When examining how to account for different household
sizes in the MEB start by ascertaining whether economies
of scale exist and to which extent51 Figure 3 provides a
hypothetical illustration of two extreme cases no economies
of scale at all and strong economies of scale If there are no or
little economies of scale the per capita expenditures will be
very similar across household sizes while they will decrease
by household size if economies of scale are present52
Plotting per capita expenditures against household size
helps enable for this type of examinations It can be useful
to further disaggregate the analysis into different categories
(for instance food non-food or shelter expenditures per
capita) to understand which expenditures might be driving the
economies of scale if present
Box 19 illustrates two different country examples
expenditures by household size for Syrian refugees in
Lebanon and for vulnerable populations in Coxrsquos Bazar
Bangladesh In Lebanon where shelter plays an important
role household expenditures double only at a household size
of 5 and they triple at a household size of 11
COUNTRYEXAMPLE
ECONOMIES OF SCALE INLEBANON AND COXrsquoS BAZAR
Box 19
Figure a shows expenditures by household size compared to one-person households For Syrian refugees in Lebanon
average expenditure doubles only when the household size reaches five and it takes 11 members to triple the expenditures
of a one-person household The economies of scale are therefore large primarily due to the importance of shelter costs for
the refugees
In Coxrsquos Bazar in contrast total expenditures grow almost proportionally with household size (double at a two-person
household triple at a three-person household) Slight economies of scale can be seen for food For non-food expenditures
larger households even spent more per person From this data the economies of scale seem to be small
Figure a Increase in household expenditure by household size comparedto one-person households
Multiplicationfactor
Household sizeHousehold size
100
90
80
70
60
50
40
30
20
10
Coxrsquos Bazar (Bangladesh)Lebanon
1 2 3 4 5 6 7 8 9 10 11
Total Food Non-food
1 2 3 4 5 6 7 8 9 10 11
Note Figure based on authorsrsquo calculations Data from the Vulnerability Assessment of Syrian Refugees in Lebanon (VaSyr) 2017
and the Refugee influx Emergency Vulnerability Assessment (REVA II) 2019
51 Expenditure data is required to perform this analysis If no information on expenditure exists information on how needs change with household size can be collected through qualitative means such as focus group discussions or key informant interviews
52 Theoretically it is possible to also analyse expenditures by household composition but sample sizes rarely allow for such detailed disaggregation
32
Minimum Expenditure Baskets Guidance Note | December 2020
If the analysis reveals small economies of scale or none at all it is reasonable to use a per capita approach to scale up the MEB proportional to household size
Even for food strong economies of scale can be detected
which could be a result of large households being able to
buy food in bulk at a lower price However in Coxrsquos Bazar
where shelter and other shareable non-food goods are of less
importance household expenditures are close to proportional
to household size
If the analysis reveals small economies of scale or none at all
it is reasonable to use a per capita approach to scale up the
MEB proportional to household size If significant economies
of scale are present it is important to think about how to
take this into account when constructing the MEB Here are
some suggestions
One possible solution (in the expenditure-based
approach) is to disaggregate (or re-select see below)
the reference cohort for each household size sub-
sample and using the expenditures for each of these
cohorts construct specific MEBs for each household
size53 This approach takes into account economies of
scale by looking directly at the specific needs of different
size households but only reflects average differences
in household composition within each household size
The approach will most likely suffer from very small
sample sizes once analysis needs to be performed by
household size If this is the case household sizes could
be grouped into categories so that the analysis uses sub-
samples eg for household sizes 1ndash2 3ndash5 and 6ndash8 etc
or other groupings meaningful for the context When
following this approach bear in mind that if the reference
cohort is selected based on expenditure distribution
characteristics such as the removal of extreme deciles or
quintiles this procedure of removal of quintiles or deciles
needs to be repeated within each household size (or
household size group) Otherwise if there are economies
of scale for consumption there is a risk of skewing the
sample against the smallest and largest households
because their per-capita expenditures will be at the
extreme ends of the expenditure distribution
Another solution is to divide the MEB content into
ldquoprivaterdquo (non-shared) and ldquopublicrdquo (shared) consumption
For example food could be non-shared and rent and
fuel shared Examine the MEB expenditures for the
non-shared and shared goods for an average sized
household (or for household sizes around the average
for instance 4ndash6 members in order to leverage a larger
share of the sample) The non-shared value can then be
scaled proportionally to household size while the shared
value is held constant across household sizes This way
the resulting MEB consists of a lsquoflatrsquo and a proportional
element54 This is a relatively crude but intuitive way to
approximate economies of scale Figure 4 provides a
simple illustration of this approach
In the literature on poverty the most common solution
used to adjust for economies of scale and difference
in household composition is to use adult equivalents
instead of per capita numbers These equivalence scales
assign an ldquoadult equivalent numberrdquo to each household
depending on its size and composition taking into
account economies of scale as well as the different needs
of children and adults ie household composition For
example the first adult in the household is counted
as 1 and each additional adult as for example 07 A
child under 15 is counted as a fraction of an adult (eg
05) The effective adult equivalent household size is
then the sum of these adult-equivalent fractions55 Next
total household expenditures are divided by the adult
equivalent household size The MEB is then calculated
using these adjusted per-adult-equivalent expenditures
While this is not necessarily a complicated approach
from an analytical point of view equivalence scales can
53 See Lanjouw (1998) on the construction of poverty lines specific to household size (and composition)53 Alternatively the flat element can also be lsquosemi-flatrsquo and set according to household size groups ndashby examining shared costs and applying the same flat value within eg household size groups 1-2 3-5 6-8 or other
groupings as dictated by the context 53 One common equivalence scale is the OECD scale it assigns the weight 1 to the household head 07 to all additional adults and 05 to all children A household with five people say two adults and three children
consists of 32 adult equivalents (1+07+05+05+05) This is a common scale used in many developing and developed countries Another common scale is to give weight 1 to each adult and different weights to children depending on their age For the official poverty line in Zambia the following weights are given to children 0ndash3 years 036 4ndash6 years 062 7ndash9 years 076 and 10ndash12 years 078
33
Minimum Expenditure Baskets Guidance Note | December 2020
MEB - COMBINING FLAT ANDPROPORTIONAL ELEMENTS -ILLUSTRATION
MEB value
Household size
1 2 3 4 5 6 7 8 9
140
120
100
80
60
40
20
0
Proportional element - non-shared part of MEB
Flat element - shared part of MEB
MEB value per capita
Figure 4 Combining flat and proportional elements in the MEB
prove challenging when operationalising the MEB If
equivalence scales are used in constructing the MEB they
will also need to be applied when measuring household
expenditures compared with the MEB for gap analysis
against the MEB and in monitoring Translating the
concept of equivalence scaling into operational decision
making may therefore prove tricky Additionally results
can be quite sensitive to the choice of equivalence scales
so selecting appropriate scales is important yet often not
straightforward and a range of different scales exist56 In
some countries country-specific equivalence scales may
have been devised for the purpose of the calculation of
the national poverty line
No matter the approach the recommendation is always
to leverage data analysis as much as possible in order
to understand how needs evolve with household size
(and possibly composition) while keeping in mind that
the final MEB needs to be operationally relevant
Particularly in the (common) cases where MEBs are
used to calculate household transfer values it is worth
considering what level of analytical granularity can
feasibly be turned into programmatic action In some
cases it may not be operationally possible to handle
different per-capita size transfers for differently sized
households and the extra effort of achieving accurate
MEB figures by household size may not be worth it
The same general recommendation as for all aspects
of MEB construction also applies here the final result
should be realistic a fair depiction of needs and an
operationally relevant product
56 See for instance httpwwwoecdorgeconomygrowthOECD-Note-EquivalenceScalespdf
34
Minimum Expenditure Baskets Guidance Note | December 2020
A SMEB can be expenditure-based or rights-based or a hybrid of the two approaches depending on data availability and programmatic requirements
The SMEB is the absolute minimum amount required to maintain existence and cover lifesaving needs which could involve the deprivation of certain human rights
A survival minimum expenditure basket (SMEB) is often
constructed alongside a MEB While the MEB is defined as
what a household requires in order to meet their essential
needs on a regular or seasonal basis and its average cost the
SMEB is the absolute minimum amount required to maintain
existence and cover lifesaving needs which could involve the
deprivation of certain human rights However the concepts
of SMEB and MEB have not always been used consistently
by the humanitarian community and are sometimes used
interchangeably It is therefore important to be clear from the
outset of the analysis whether a MEB or a SMEB is the goal
A SMEB can serve at least two purposes First together with
the MEB it can be used to classify households into different
categories of economic capacity to meet their needs whereby
households whose expenditures fall below the SMEB have
highly insufficient economic capacity households between the
SMEB and the MEB have insufficient economic capacity and
households above the MEB have sufficient economic capacity
This information can then be used for profiling people in need
prioritizing beneficiaries or monitoring Second the SMEB
can inform programmatic decisions such as transfer values in
situations where immediate lifesaving assistance is required
The approaches presented here follow the MEB methods
adjusted to suit the different purpose of the SMEB
Accordingly a SMEB can be expenditure-based or rights-
based or a hybrid of the two approaches depending on data
availability and programmatic requirements
8 How to construct a SMEBExpenditure-based approach toconstructing a SMEBThe calculation of an expenditure-based SMEB is closely aligned
with the literature on how to estimate national poverty lines
While the MEB corresponds to an ldquoupperrdquo poverty line a ldquolowerrdquo
extreme or austere poverty line is often defined by taking the
food part of a MEB and adding this to the non-food needs
regarded as the essential minimum for household survival57
But how are survival non-food needs defined based on
expenditure data When people receive assistance it is
sometimes observed that households sell part of their food
rations to cover some non-food items These households forgo
some of the required food intake in order to cover what they
regard as survival non-food needs Using expenditure data to
construct a SMEB a similar idea is explored to calculate the
SMEB analysts identify those households whose total food AND
non-food expenditures are approximately equal to the MEB food
basket amount only In order to access non-food items these
households will compromise their food intake to some extent
because their total expenditures would only be enough to cover
their essential food requirements ie the food MEB anything
spent on non-food items means that they are not meeting their
essential food requirements It is therefore fair to assume that
the amount they choose to spend on non-food items must
be regarded by the households as absolutely necessary The
non-food expenditures of these households can therefore be
considered as the survival non-food needs The SMEB is then
calculated by adding these survival non-food expenditures
to the food MEB This SMEB allows households to meet their
essential food needs and their survival non-food consumption
Note that this approach requires a food MEB figure (either
already available or calculated as part of the SMEB analysis)
57 See Lanjouw 1998 and Haughton and Khandker 2009
35
Minimum Expenditure Baskets Guidance Note | December 2020
The steps for constructing an expenditure-based SMEB are
similar to those taken to construct a MEB with the following
additional considerations
1 Prepare expenditure data the expenditure data source can
be the same as that used for the MEB
2 Select the reference cohort this step is different The cohort
is selected by computing total household expenditures
and comparing them to the food MEB Households with
total expenditures equal to (or in an interval around) the
food MEB are selected as the SMEB reference cohort
3 Establish food basket and 4) Establish non-food basket
Using the SMEB reference cohort start by examining
how much these households spend on non-food items
Add this value to the MEB food value to arrive at the total
value of the SMEB To establish a food and non-food
basket there are two options i) use the MEB food basket
as the SMEB food basket and the non-food expenditures
of the SMEB reference cohort as the non-food basket
or ii) look at a third cohort of households namely those
whose total expenditures are around the just established
total SMEB level examine their food and non-food
expenditures and unpack those into food and non-food
baskets While both options will provide the same overall
value of the SMEB they will differ in composition and the
share of foodnon-food expenditures
Annex 2 provides an illustration of this method of constructing
a SMEB
Rights-based approach to constructing a SMEBThe rights-based approach to constructing a SMEB closely
follows the rights-based approach to constructing a MEB The
main difference is that needs and the items and quantities
included should be restricted to what is regarded as absolutely
necessary for survival ndash which can be challenging to define
This applies to both the food basket and the non-food
basket The MEB can be a starting point if there is one or
the Sphere Standards Sometimes rights-based SMEBs have
been constructed based on a MEB but with lower quantities
for certain items or by keeping some needs while removing
others
Hybrid SMEBs and reality checking resultsAs with MEBs it can be advantageous to combine the
expenditure-based and rights-based approaches to create
a hybrid SMEB The guiding principles are the same as for
the MEB with the difference that the resulting SMEB should
continue to contain nothing but the minimum required for
survival
The same logic applies to the ldquoreality checkrdquo of the SMEB
results as for the MEB it is crucial to ensure that the end
result is realistic and operationally relevant bearing in mind
the conceptual difference between the MEB and the SMEB It
is important to consult the population of interest as much as
possible to understand their views on what constitutes the
bare minimum needed by households to maintain existence
and cover lifesaving needs
COUNTRYEXAMPLE
RIGHTS-BASED SMEBS Box 20
In Lebanon health and education are excluded
from the rights-based SMEB while other needs are
covered with smaller amounts than in the MEB For
example the SMEB has a less diverse food basket
than the MEB58
In Syria the SMEB developed for the northern part
of the country includes food kerosene hygiene
products water and a small amount to cover other
survival goods Rent and utilities are not covered59
58 El Koury and Hajal 201659 Cash Based Responses Technical Working Group Syria 2014
36
Minimum Expenditure Baskets Guidance Note | December 2020
COUNTRYEXAMPLE
HYBRID SMEBs Box 21
For the MEB review in Lebanon for Syrian refugees60 a hybrid SMEB approach was chosen First an expenditure-based
SMEB was used calculating the non-food expenditures of households whose total expenditures equalled the food MEB
and adding this to the food MEB This resulted in very low expenditures on shelter (SMEB A) Due to the importance of
shelter in urban settings a second hybrid version was established calculating the non-food expenditures of households
whose total expenditures equalled the sum of the food MEB plus a rights-based value of a tent as survival shelter the cost
of which came from a rights-based SMEB (SMEB B)
Cohort HH size 4ndash6quint 2ndash4 acceptable FCS
n=923
Cohort total expenditure= food MEB
n=923210
Cohort total expenditure= food MEB + tent value
n=923210
SMEB Afood + survivalnon-food
Hybrid SMEB
437
83
40
93
20
16
29
19
314
1033
437
43
18
37
06
04
17
60
621
437
47
24
42
11
06
20
162
750
Food
Utilities (water gas fuel electricity)
Non-food items (hygiene clothing)
Health
Education
Transport
Communication
Other expenditures
Shelter
Total (USD)
Table a Hybrid SMEB for Syrian refugees
SMEB Bfood + survivalnon-food amp tent
In the Kinshasa urban assessment61 a SMEB was established in addition to the MEB comprising a basket of the most
essential items based on expenditure data used for the MEB For the food SMEB a less diverse diet was established by
excluding certain food items from the food MEB and rescaling the resulting basket to 2100 kcal For the non-food
component the only items included were those that were seen as critical to attaining the most basic standards for safety
food preparation water sanitation and hygiene These consisted of water cooking fuel hygiene products and lighting The
value for these items in the SMEB was derived from the median expenditures of the non-poor cohort
Expenditure-basedMEB
Expenditure-basedSMEB
60 Hohfeld et al 2020 61 WFP et al 2018
37
Minimum Expenditure Baskets Guidance Note | December 2020
91 Adjustment for seasonal or regional price differencesIf the MEB will only be used in one area where prices are
relatively homogenous it is often not necessary to adjust for
regional price differences However if the MEB is intended
for use across different urbanperi-urban andor rural
areas throughout the country it could be vital to adjust for
differences This means that the MEB can be priced differently
for different regions or rural or urbanperi-urban areas (or any
other division of areas that makes sense in relation to price
behaviour) There are a few approaches for this
Price the MEB based on available price data for different
regions or urbanrural areas For the food reference
basket this is most often possible using WFP food prices
or other similar price time series For non-food items
including housing utilities and services this can be more
challenging and may rely on price data collection by
different partners or require new data collection
For some countries price data provided by the national
statistical office is useful In the case of Turkey regional
purchasing power parity indices were used to provide
price estimates for components of the MEB for which
direct price information was not available
Use approximations from expenditure data If the
household survey has sufficient regional coverage the
expenditure levels in different regions can be explored
using the cohort of households just above the poverty
line Care should be taken in using this method
particularly if the sample size by region is very small
9 Additional considerations when constructing MEBs
92 Needs that vary by season or areaIn many countries where WFP works household needs change
with the seasons For instance in Turkey where winters are
cold households have additional needs for heating and warm
clothes to survive In other contexts there are significant
differences in needs between lean and rainy seasons These
changing needs could be a reason to construct different MEB
reference baskets to use at different times during the year or
to design seasonal top-ups In the case of items needed for cold
winters this is often referred to as ldquowinterizationrdquo
While this does not influence the approach used to construct
the MEB it does mean that analysts need to consider when
the data used in its construction was collected and whether
this influences the resulting MEB These considerations also
matter when using the MEB for monitoring if a monitoring
expenditure survey is used to analyse whether peoplersquos
expenditures are above or below the MEB threshold but
the survey is undertaken when prices are high or when
winters are cold if the MEB is not adjusted the results will
probably show a decrease in the percentage of people whose
expenditures are below the MEB as households have higher
needs andor are confronted with higher prices and thus
have higher expenditures without in reality being better off
In Turkey it was estimated that household needs during the
winter would result in a 48 percent increase in minimum
expenditures
In other cases different baskets might be necessary
for different areas of the country eg rural and urban
areas While the MEB should be constructed for a relatively
homogenous population it may sometimes be desirable to
construct a MEB covering all or most of a country where
consumption patterns vary substantially In this case it is
worth considering whether (some elements of) the MEB should
be different between areas Again the selected approach to
construct the MEB should not change but analysts need to
check where the data used in its construction was collected
and whether consumption patterns are very different between
different regionsareas For example in the case of Somalia
the main cereal consumed varies significantly between the
north and the south of the country so the MEB uses different
main cereals in the food reference basket according to region
While the MEB should be constructed for a relatively homogenous population it may sometimes be desirable to construct a MEB covering all or most of a country where consumption patterns vary substantially
38
Minimum Expenditure Baskets Guidance Note | December 2020
Constructing a MEB can be challenging in a sudden onset
emergency or if data is scarce or unavailable Below are some
ideas on how this can be resolved However from a ldquodo no
harmrdquo perspective it is important to emphasize that proxies
should only be used in the interim when no other solutions are
available
Use the national MEB or MEB reference basket If survey
data is not directly available and if the population of
interest is part of and similar to the overall population of
the country the national MEB or MEB reference basket
used for the national poverty line can be used if available
Bear in mind however that this basket should be used on
the condition that it corresponds to data that WFP collects
or has access to through partners or the Government to
ensure that monitoring can be conducted against the MEB
In its most basic form a MEB essentially only requires an
approximate value for the food basket and an estimate
of the average expenditure share that households use
on food Even if no relevant survey data is available this
information should be available to a country office or can
rapidly be collected or approximated
Consider using the minimum wage as a proxy Bear in
mind that while the MEB captures household-level needs
the minimum wage is individual-level income so an
assessment of how many minimum wages are needed per
household depending on the household size is required
It is also advisable to find out how the minimum wage has
been constructed
Ultimately a MEB is a good preparedness measure and should
be constructed before an emergency While both prices and
availability will be affected by an emergency it is still likely to
provide a useful starting point
11 Monitoring and updating the MEB111 Monitoring the cost of the MEBTo be operationally useful the MEB must be tracked and
updated over time to account for price changes If inflation is
high this might have to be done every month if it is low as
little as once a year could be sufficient This should be planned
for when the MEB is constructed to ensure that the costs of the
MEB components can be updated
There are different ways to update the MEB with price changes
If a reference basket is adequately defined (for food
and for non-food items) and prices are collected for the
individual items in the basket by WFP or its partners the
MEB can be priced anew using the updated prices for
each item and multiplying them by the quantities in the
reference basket
A simple solution is to adjust the MEB using the
nationalsub-national CPI or its components This
simply involves updating the cost of the MEB with
the increase (or decrease) in the CPI for the period
in question However in some contexts CPIs are not
updated or relevant for the target population Urban
areas are often over-represented in the national CPI on
the other hand prices and costs faced by for example
displaced populations can be very different from national
price levels In contexts of poverty where food constitutes
a large part of household expenditures the evolution of
food and fuel prices is central when it comes to capturing
price changes
If a CPI does not exist or is not considered applicable
a price index for key consumption items can be
constructed using price data collection for food items
and basic non-food items conducted by WFP andor
other agencies this can then be used to update the cost
of the MEB In contexts where shelter is a major part of
household expenditures changes in shelter costs should
also be captured
10 How to find a proxy for a MEB when data or time is insufficient
39
Minimum Expenditure Baskets Guidance Note | December 2020
112 When to construct a new MEBThe composition of MEB reflects consumption patterns
It is recommended as much as possible keeping the MEB
composition constant and only monitor how cost changes
over time However when there is reason to believe that
consumption patterns of the population for whom the MEB
is constructed has significantly changed it is time to review
its composition and possibly reconstruct the MEB to reflect
these changes
What could suggest such consumption changes have
occurred The figure to the right summarises some typical
events that could result in a significant change in household
consumption Shocks eg a natural disaster might create
additional needs if livelihoods are disrupted or living
conditions are altered Significant changes to the prices of
key consumption items can also alter consumption pattens
insofar it pushes households to substitute certain items
for other items (be aware however that reconstructing
the MEB would only be advisable if the substitution is not
just temporary) Population changes such as an influx of
displaced people or other events that changes the population Figure 5 Possible triggers for MEB composition review
Has a shock occured creating
different or additional needs
Have costs changed significantly
between key consumption items so
that households have substituted
consumption patterns
Has there been a change in
population - eg a displacement
Has the supply side or service
provision changed leading to a
change in household consumption
Shock
Substitution
Population
Supply
composition in the area that the MEB is constructed for
could also lead to a review Finally if supply of essential
goods and services changes this may also shift household
consumption eg if health services are made free of charge
and no longer require households to pay for them
40
Minimum Expenditure Baskets Guidance Note | December 2020
CaLP The Cash Learning Partnership
CBT cash-based transfers
CotD Cost of the Diet [approach]
CPI consumer price index
FCN-N food consumption score ndash nutrition
FCS food consumption score
FNG Fill the Nutrient Gap
HEA household economy approach
LSMS Living standard measurement survey
MEB minimum expenditure basket
OCHA United Nations Office for the Coordination of Humanitarian Affairs
REVA II 2019 Refugee Influx Emergency Vulnerability Analysis
SDG Sustainable Development Goal
SMEB survival minimum expenditure basket
UNHCR Office of the United Nations High Commissioner for Refugees
VAM Vulnerability Analysis and Mapping
WFP World Food Programme
WHO World Health Organization
Abbreviations
41
Minimum Expenditure Baskets Guidance Note | December 2020
Deaton and Grosh 2000 ldquoConsumptionrdquo in Designing Household Survey Questionnaires for Developing Countries Lessons from Ten
Year of LSMS Experience httpsscholarprincetonedudeatonpublicationsconsumption
Deaton and Zaidi 2002 Guidelines for Constructing Consumption Aggregates for Welfare Analysis LSMS Working Paper no 135
httpsopenknowledgeworldbankorghandle1098614101
The Cash Learning Partnership (CaLP) Glossary of terminology for cash and voucher assistance
httpswwwcalpnetworkorglearning-toolsglossary-of-terms
Cash Based Responses Technical Working Group Syria 2014 Northern Syria Survival Minimum Expenditure Basket Guidance
Document httpswwwhumanitarianresponseinfositeswwwhumanitarianresponseinfofilesdocumentsfilesnorthern_
syria_smeb_guidance_document_dec_2014pdf
Cash Working Group Nigeria 2018 Minimum Expenditure Basket for North East Nigeria ndash Justification and recommendations Draft
report httpswwwhumanitarianresponseinfositeswwwhumanitarianresponseinfofilesdocumentsfilesmeb_justification_
guidelinespdf
Baizan and Klein 2019 Minimum Expenditure Basket (MEB) Decision Making Tools The Cash Learning Partnership httpswww
calpnetworkorgpublicationminimum-expenditure-basket-meb-decision-making-tools-2
El Koury and Hajal 2016 MEB and SMEB revision Community Consultation Lebanon Cash Consortium httpsreliefwebintsites
reliefwebintfilesresourcessmeb-fgd-report-final-1pdf
Geniez Mathiassen de Pee Grede and Rose 2014 ldquoIntegrating food poverty and minimum cost diet methods into a single
framework A case study using a Nepalese household expenditure surveyrdquo in Food and Nutrition Bulletin vol 35 no 2 https
journalssagepubcomdoi101177156482651403500201
Haughton and Khandker 2009 Handbook on Inequality and Poverty The World Bank httpsopenknowledgeworldbankorg
handle1098611985
Hobbs 2016 MEBSMEB calculation for Syrians living in Turkey Report commissioned by the Cash-Based Interventions Technical
Working Group in Turkey httpsdata2unhcrorgendocumentsdownload57031
Hohfeld Papavero Sandstrom Dalbai and Renk 2020 Minimum Expenditure Basket for Syrian Refugees in Lebanon ndash Rights-based
versus Expenditure Based Approaches WFP httpsreliefwebintsitesreliefwebintfilesresources76229pdf
Inter-Agency Network for Education in Emergencies (INEE) Minimum Standards for Education Handbook Preparedness Response
Recovery httpsineeorgstandards
Jolliff and Prydz 2016 Estimating International Poverty Lines from Comparable National Thresholds World Bank Policy Research
Paper 7606 httpsopenknowledgeworldbankorgbitstreamhandle1098624148Estimating0int00national0thresholdspdf
Lanjouw 1998 Demystifying Poverty Lines World Bank
Ravallion 1994 ldquoPoverty Comparisonsrdquo in Fundamentals of Pure and Applied Economics 56
Republic of Zambia Central Statistical Office 2016 2015 Living Conditions Monitoring Survey (LCMS) Report httpswwwzamstats
govzmphocadownloadLiving_Conditions201520Living20Conditions20Monitoring20Survey20Reportpdf
Save the Children UK 2018 Basic Needs Assessment Guidance and Toolbox Part I Background and Concepts httpsreliefwebint
reportworldbasic-needs-assessment-guidance-and-toolbox
Sphere Standards Handbook Humanitarian Charter and Minimum Standards in Humanitarian Response 2018 edition httpswww
spherestandardsorghandbook
UNHCR CaLP Danish Refugee Council OCHA Oxfam Save the Children and WFP 2015 Operational Guidance and Toolkit for
Multipurpose Cash Grants httpswwwcalpnetworkorgwp-contentuploads202001operational-guidance-and-toolkit-for-
multipurpose-cash-grants-webpdf
References
42
Minimum Expenditure Baskets Guidance Note | December 2020
WFP 2004 Sampling Guidelines for Vulnerability Analysis Thematic guidance httpsdocumentswfporgstellentgroupspublic
documentsmanual_guide_procedwfp197270pdf
WFP 2008 Food Consumption Analysis Calculation and use of the Food Consumption Score in food security analysis https
documentswfporgstellentgroupspublicdocumentsmanual_guide_procedwfp197216pdf
WFP 2015 Food Consumption Score Nutritional Analysis (FCS-N) Guidelines httpswwwwfporgpublicationsfood-consumption-
score-nutritional-quality-analysis-fcs-n-technical-guidance-note
WFP 2018 Revising the Food Basket and Minimum Expenditure Basket Analysis to calculate a realistic cost of living for refugees in
Turkey httpsreliefwebintreportturkeyrevising-food-basket-minimum-expenditure-basket-analysis-calculate-realistic-cost
WFP 2019 Refugee influx Emergency Vulnerability Assessment ndash Coxrsquos Bazar Bangladesh httpsreliefwebintsitesreliefwebintfiles
resourcesWFP-0000106095pdf
WFP 2020a Essential Needs Assessment Guidance note httpswwwwfporgpublicationsessential-needs-guidelines-july-2018
WFP 2020b Technical Note Fill the Nutrient Gap and Minimum Expenditure Basket An explanation of approaches and identification of
synergies httpsdocswfporgapidocumentsWFP-0000116644download
WFP 2020c Setting the transfer value for CBT interventions Transfer Value Interim Guidance httpsdocswfporgapi
documentsWFP-0000117963download
WFP global Food Security Cluster and Food Security Cluster for the Democratic Republic of the Congo 2018 Adapting to an Urban
World Urban Essential Needs Assessment in the five communes of Kimbanseke Kinsenso Makala Nrsquosele and Selambao (Kinshasa)
httpswwwwfporgpublicationsdemocratic-republic-congo-urban-essential-needs-assessment-five-communes-kimbanseke-
kinsenso
World Health Organisation and Global Health Cluster ndash Cash Task Team 2020 Technical Note on the Inclusion of Health
Expenditures in the Minimum Expenditure Basket and Subsequent Multi-purpose Cash Transfer httpswwwcalpnetworkorg
publicationinclusion-of-health-expenditures-in-the-meb
43
Minimum Expenditure Baskets Guidance Note | December 2020
Survivalnon-foodexpenditure
TOTALEXPENDITURE
FOODEXPENDITURE
MEBnon-foodexpenditure
EXPE
ND
ITU
RE
CONSUMPTION
SMEBAusterepoverty line
Essential foodneeds (MEB)
Acceptable food consumption(based on FCS)
Food expenditure for HHwith tot exp at essential
food needs (MEB)
Analysts should always ensure that the expenditure data is properly cleaned and outliers removed and that it is converted into
the same recall period (food and non-food items usually have different recall periods)
Expenditures should be calculated into per capita figures (eg by dividing total household expenditures by household size) in
order to make them immediately comparable across households (or per adult equivalent see section 7 on how to account for
economies of scale and household composition)
Before starting the MEB analysis it is highly recommended to carry out some simple descriptive analysis of the expenditure
data in order to understand it Analyse the mean and median expenditures for the sample This will help understand the
distribution of the expenditures and detect possible issues While the median is more robust to outliers if a large part of the
sample has 0 expenditures on a particular item the median could be 0 and may therefore not be the best estimate of the need
In this case the mean may be preferable A frequency analysis of non-zero expenditures by groupitem can also be helpful in
understanding whether certain expenditures are infrequent or lumpy
Annex 1 - Good practice when analysing expenditure data
Figure based on Lanjouw 1998 Demystifying poverty lines and World Bank and Ravallion 1994 ldquoPoverty comparisonsrdquo in
Fundamentals of Pure and Applied Economics 56
Annex 2 - The expenditure-based SMEB ndash an illustration