

VARIABILITY OF INORGANIC NITROGEN FORMSIN ROMANIAN BLACK SEA MARINE
AND COASTAL WATERS
Luminiţa LAZĂR1, M.-T. GOMOIU2, D. VASILIU1, F. TIMOFTE1
1National Institute for Marine Research and Development“Grigore Antipa” Constanta, Romania
2National Institute of Marine Geology and Geo-Ecology“GeoEcoMar”, Bucharest – Constanta, Romania
e-mail: [email protected]
ABSTRACT
Seawater from a NW Black Sea transect was sampled in 9stations with bottom depths within 15 – 2200 m duringR/V “Mare Nigrum” cruise on 7-14 April 2008. Thesamples were frozen and subsequently analyzed in NIMRD“Grigore Antipa” laboratory for salinity, dissolved oxygenand nutrients (inorganic forms of phosphorus andnitrogen).The purpose of the paper is to investigate the inorganicnitrogen forms and concentrations and control factors ofwater column distribution in NW Black Sea along a South-South East transect of Sf. Gheorghe area. The N*parameter test (Gruber and Sarmiento, 1997) was proposedto estimate nitrogen fixation-denitrification (marinenitrogen cycle significant stages) in NW Black Sea waters.
KEY WORDS: Black Sea, nutrient, nitrogen cycle,denitrification
INTRODUCTION
Nitrogen is one of life’s bricks. It is essential in protein and nucleicacids synthesis. With a significant influence on major biogeochemical cycles(for example C or P) [1], nitrogen is the chemical element in sea water both inthe molecular state (oxidation number, ON = 0) and compounds that may holdoxidation numbers from -3 to 5, making the marine nitrogen to have acomplex chemistry. This variability includes both organic and inorganicnitrogen forms. Only some forms of nitrogen are biologically used but theiravailability has the key to ocean productivity [2].

In this respect, ammonia, nitrites and nitrates are the most studiedmineral forms of nitrogen due to their importance in the primary productivityof marine waters. Each of these forms should be interpreted as a more or lessadvanced stage of organic matter degradation through bacterial action.Excepting the coastal areas frequently contaminated by land intake, themineral salts dissolved in sea water can be interpreted as nitrogen cycle steps(Peres, 1963). Thus, whereas all forms of nitrogen appearance are highlyinfluenced by oxygen environmental conditions, the study of the Black Seawaters, the largest permanently anoxic basin in the world (Murray, 1991), canprovide important information for understanding the marine nitrogen cycle,being an attractive natural laboratory for marine chemists and microbiologists(Codispoti, l991).
The paper aim is to investigate the dominant forms of inorganicnitrogen concentrations in the NW Black Sea as well as the control factors oftheir distribution in the water column along a SSE transect of Sf. Gheorghearea. At the same time a model is proposed for nitrogen estimating nitrogenfixation and denitrification (important stages in marine nitrogen cycle) incoastal and deep waters of the NW Black Sea.
MATERIAL AND METHODS
Seawater samples were collected with a CTD SeaBird equipped withrosette and 5 liters Niskin bottles in the framework of international projectSESAME, R/V "Mare Nigrum" oceanographic expedition, during 7-14 April2008.
There were collected and analyzed 81 samples from the water column(0-500m) on a profile located S-SE of Sf.Gheorghe Danubian branch,consisting of 9 stations with bottom depths between 15 and 2200 m (Fig. 1).The samples were frozen and subsequently analyzed in the NIMRD “GrigoreAntipa” measurements and analysis laboratory, where determinations weremade for salinity, dissolved oxygen, nutrients (phosphorus and inorganicnitrogen forms).

Fig. 1 - Map of stations performed during R/V “Mare Nigrum” expedition,April 2008
Seawater nutrients were quantified by spectrophotometric analyticalmethods validated in the accredited laboratory according to EN ISO17025:2005 and having as reference manual "Methods of Seawater Analysis"(Grasshoff, 1999) with the following detection limits and extended relativeuncertainties, coverage factor, 95.45% (Table 1).
Table 1
Parameter UM Limit of detection(µmol/dm3)
Extended relative uncertainty,U(c), k=2, coverage factor
95.45%1. (NO3)- µM 0.12 c x 0.08 µmol/dm3
2. (NO2)- µM 0.03 c x 0.06 µmol/dm3
3. (NH4)+ µM 0.12 c x 0.10 µmol/dm3
4. (PO4)3- µM 0.01 c x 0.12 µmol/dm3
A Shimadzu UV-VIS spectrophotometer was used measuring within the range 0-1000 nm. Salinity was determined by using Mohr Knudsen method whiledissolved oxygen by using Winkler method on board immediately aftersampling.
The data were processed with Ocean Data View software version 4.0(Schlitzer, 2009) and Microsoft Office Excel.

Results and discussions
1. General environmental indicators distribution
Horizontal distribution of temperature (Fig. 1.1) highlights bothsurface (a) and bottom (b) the increased gradient with distance from shore.
a) b)
Fig. 1.1 - Seawater temperature horizontal distributionsurface (a) and bottom (b) –
“Mare N igrum”, April 2008
Fig. 1.2 - Seawater columntemperature distribution –
“Mare Nigrum”, April 2008
Being under the direct influence of air temperature, seawatertemperature (Fig.1.2) was lower in the shallow stations by minimum 5.67°Crecorded in Station 2, at maximum depth of 47m. Maximum value - 10.81°C,was found in Station 9, at 10.1m depth. Although the temperature varieswithin a narrow range, the measurements showed the whole pattern of theBlack Sea thermal stratification (Vespremeanu, 2004): the presence of mixedlayer (0 – 10m depth), the seasonal weakly pronounced thermocline (10 - 40mdepth), the Cold Intermediate Layer – CIL (40 – 150m depth) and theintermediate layer (150 – 500m depth). At 500m, the temperatures in Stations5 - 9 ranged between 8.71 - 8.88oC.
Concerning the salinity regime the minimum value (7.45 PSU) wasrecorded in Station 1 - surface layer, due to the Danube direct influence.Except for this value, salinity fitted within specific area and season range,14.09 - 22.08 PSU. The maximum value is found in Station 9, at 500m depth.Thus, the horizontal distribution analysis (Fig.1.3) highlights the ascendinggradient from inshore to offshore and also from surface to the bottom.
0
100
200
300
400
500
5.5 6.5 7.5 8.5 9.5 10.5
T [0C]
Dept
h [m
]

a) b)
Fig. 1.3 - Seawater salinity horizontal distributionsurface (a) and bottom (b) – “Mare Nigrum”,
April 2008
Fig.1.4-Seawater column salinitydistribution – “Mare Nigrum”,
April 2008
Vertical distribution of salinity (Fig.1.4) clarifies the mixed layer (0 –40m depth) where salinity ranges from 7.45-18.49 PSU, the halocline layer(40 – 200m depth) with values between and 18.20-21.62 PSU and theintermediate layer (200-500m) where there are slight variations of salinitysuch as 22.03 - 22.08 PSU.
Both temperature and salinity values, recorded in the 200 – 500m layerdepth, are consistent with the fact that T = 8.5oC - 9oC and S = 22.32 PSU alsocharacterize the deepest area of the Black Sea, being stationary for centuries(Konovalov and Murray, 2001).
Dissolved oxygen regime was maintained within the specific values of seasonalnatural variability of the studied area. Being under the influence of temperature, water masscirculation and biological phenomena amplitude, dissolved oxygen values recordedhomogeneous values at surface (0-20m) for the entire study area ranging from 7.01 - 7.38cm3/l, (313.1 - 329.6 µM) (Fig. 1.5a).
Bottom horizontal distribution of dissolved oxygen (Fig. 1.5.b) showsthe parameter decreasing up to "undetectable" at depths greater than 150m.The oxycline layer is situated at 50 – 90m depth layer (into CIL) whereconcentrations decreased from about 7 cm3/l to 1cm3/l. The suboxic layer,where concentrations fall below 1cm3/l to almost zero is found in Stations 4, 5and 6 between 100 – 150m and higher in Stations 7, 8 and 9, at 70 -100mdepth (Fig.1.6).

0
100
200
300
400
500
0.00 5.00
Dissolved oxygen [cm3/l]
Dep
th [m
]
a) b)
Fig. 1.5 - Seawater dissolved oxygen horizontaldistribution surface (a) and bottom (b) –
“Mare Nigrum”, April 2008
Fig. 1.6 – Seawater dissolvedoxygen column distribution –
“Mare Nigrum”, April 2008
At depths greater than 200 m, dissolved oxygen is "undetectable", waters beinganoxic.
2. Nitrogen electronic diversity – nitrogen compounds variability
Holding five relatively stable oxidation states in the marineenvironment, nitrogen, N, is very different from most other nutrients. With thesame number of valence electrons, phosphorus, P, is found almost exclusivelyin the marine environment in the form of orthophosphate (PO4
3-) with ON=+5. At the same time, nitrogen can be found in the marine environment as nitrate,NO3
-(ON=+5), nitrite, NO2-(ON=+3), nitrous oxide, N2O (ON=+1), molecular
nitrogen, N2 (ON=0) and ammonium NH4+ (ON=-3). In addition there are
many organic compounds containing nitrogen, most often in the form ofamino groups, -NH2 (ON =-3). The reason why nitrogen has a large number ofstable oxidation states is reflected in its electronic configuration, 1s22s22p3, astructure allowing releasing up to 5 e-(ON=+5) or acceptance up to 3 e-(ON=-3) to achieve a rare gas stable configuration. The required ionization energyfor donating five valence electrons is relatively small so it can be compensatedby the covalent bonds formation, which explains the relative stability of nitrateforms, NO3
- and ammonium NH4+ but does not explain the stability of nitrite
species, NO2-, molecular nitrogen, N2, or nitrous oxide, N2O[1] .
Seawater nitrogen cycle involves a series of complex transformations:(1) nitrates and nitrites reduction to nitrous oxide, molecular nitrogen,ammonia and organic nitrogen through assimilation or denitrification

processes, (2) ammonium production by organic nitrogen decomposition(ammonification), (3) ammonium oxidation to nitrites, nitrates or nitrous oxide(nitrification) and (4) molecular nitrogen reduction to ammonium and organicnitrogen (N2 fixation). Thus, the nitrogen cycle involves transfer of electronsbetween the oxidized (NO3
-) and reduced (NH4+) forms. The phytoplankton
uptake removes efficiently nitrates, nitrites and ammonium duringphotosynthesis in the photic zone. During DIN (dissolved inorganic nitrogen)processing in PON (particulate organic nitrogen) the oxidation state changesfrom +3 (NO2
-) or +5 (NO3-) to -3 (organic nitrogen) by intracellular reduction
(Gianguzza, 2000). Therefore, by energy reasons, ammonium, NH4+, which
contains nitrogen in -3 oxidation state, is preferentially consumed byphytoplankton. Multiple oxidation states of nitrogen in the marine environment gives riseto a large number of compounds involved in redox reactions that transform one species intoanother, associated with assimilation or disassimilation functions of marine organisms (Table2.1).
Table 2.1 - The most important biologically influenced processes whichtransform nitrogen into seawater (after Gruber)
Process Organism Redoxenvironment
Biochemicalrole for theorganisms
NO3- Assimilation Phytoplankton aerobe N source
NO2- Assimilation Phytoplankton aerobe N source
NH4+ Assimilation Phytoplankton aerobe N source
NH4+ Oxidation
(Nitrification stage)NH4
+ oxidizerse.g.Nitrosomonas
aerobe Energy source
NO2-Oxidation
(Nitrification stage)NO2
- oxidizerse.g.Nitrobacter
aerobe Energy source
N2 Fixation Cianobacteria etc.e.g.Trichodesmium
aerobe N source
Ammonification Bacteria/zooplankton aerobe/anaerobe N source
Denitrification Bacteria anaerobe Electronsacceptor
Anammox(AnaerobeAmmoniumOxidation)
Bacteria anaerobe Energy source

3. NW Black Sea inorganic nitrogen forms distribution(R/V „Mare Nigrum” expedition – April 2008)
Anoxic waters are characterized by a particular chemistry. Threeimportant characteristics of this water type were mentioned by Richards(1965): (1) denitrification subsequently nitrates and nitrites losses, with thedisappearance of oxygen, (2) reduction of sulfate ions, SO4
2- and hydrogensulfide, H2S production, (3 ) redox potential decreasing thus reduced removalof organic matter (Horne, 1969).
The Black Sea, the largest permanently anoxic basin (Murray, 1991),provides an excellent environment for investigating the processes occurring inanoxic basins, especially for oxic-anoxic interface (Codispoti, 1991), andhence to investigate the distribution of inorganic nitrogen forms. Anoxicenvironment creates phenomena (Table 3.2.1) which determine different profiles of nitrates,nitrites and ammonium in the water column.
Nitrates profile (Fig. 3.1) highlights the Danube input confirmed by the highest value,49.67µM (Station 1 – surface layer). Another high value was found in Station 2 – surfacelayer, 28.67 µM. Actually, we can observe two water bodies, a coastal one with nitratesconcentrations in the range 5.08 - 49.67 µM (Station 1 and 2, maximum depth 50 m) andanother one, a marine water body with nitrates concentrations within 0.24 - 9.79µM (Station 3- 9). Statistical analysis (t-test) shows de difference between nitrates concentrations in the twowater bodies extremely statistically significant (p<0.0001, t = 4.53, df = 79).
Minimum nitrates value, 0.24µM, is found at 500m depth, Station 9, noting decreasedconcentrations with oxygen disappearance, following denitrification (1) (Horne, 1969):
Fig. 3.1 - Nitrates vertical profile,R/V “Mare Nigrum” expedition - April 2008
4332223431631062 164.1482.421068.84)( POHNHOHNCOHNOPOHNHOCH (1)

Intermediate forms of nitrogen cycle both in the nitrification and denitrificationstages, nitrites recorded values between 0.01 - 1.36μM (Fig. 3.2). Like nitrates, the maximumvalue is found in the coastal stations area.
For marine waters, concentrations oscillated in the “undetectable" - 0.32 µM narrowrange. Generally, nitrites profile had two maxima: one in the oxic layer due to nitrificationprocesses and another one in the anoxic layer, Stations 5 - 9, following the samedenitrification process (Fig. 3.2).
Ammonium had values within 0.87 - 48.53µM. As a response to decreased dissolvedoxygen concentrations, ammonium is the dominant form of inorganic nitrogen at depthsexceeding 200m.
The vertical distribution (Fig. 3.3) highlights the maximum at 500m depths, in anoxicwaters, where predominates remineralization of organic nitrogen (constituent of proteins,polypeptides, amino acids), denitrification and sulfate reduction (2) contributing to marinenitrogen cycle.
43232
224431631062 106165310653 POHOHNHSCOSOPOHNHOCH (2)
Fig.3.2 - Nitrites vertical profile,R/V “Mare Nigrum” expedition– April, 2008
Fig. 3.3 - Ammonium vertical profile, R/V ”Mare Nigrum”expedition – April, 2008

0
50
100
150
200
250
300
350
400
450
500
0.00 5.00 10.00
PO43- [µM]
Dep
th [m
]
Fig. 3.5 - Vertical profile ofphosphates –R/V”Mare Nigrum”
expedition –April 2008
Observing the inorganic nitrogen forms profile (nitrates, nitrites and ammonium) inthe open sea (Stations 5 - 9) with bottom depths ranging from 500 – 2200m (Fig. 3.4),highlights the oxic, suboxic and anoxic layers.
In the oxic layer we observe the continuously increasing of nitrates, variability ofnitrites and lowest values of ammonium concentrations. In the suboxic layer there wererecorded maximum values for both nitrates with an average of 7.53μM (60 – 100m depthlayer) (Codispoti, 1991) and nitrites (average 0.08µM), minimum for ammoniumconcentrations (average 1.61µM), and the anoxic layer (over 150m depth) where the latterprevails with an average concentration 33.06µM. Note minimum levels of nitrate andammonium concentrations in the same suboxic area (aprox. 150m depth). These gradientsimply that both species of nitrogen were consumed, without ammonium uptake from theanoxic zone (Codispoti, 1991).
With variations in “undetectable” - 8.37µM range, phosphates had two maxima: onein the oxic-suboxic area (50-150m) (Fig. 3.5) through regenerative and respiratory processes(Codispoti, 1991) and another one in the anoxic area, due to specific reactions such as:denitrification (1) and sulfate reduction (2).
At the distance of the euphotic zone,biogeochemical cycles of N and P are primarilyaffected by organic matter mineralization and alsodenitrification and mineralization processes of richnitrogen organic matter. Given the importance ofknowledge concerning nitrogen speciestransformations in the biogeochemical cycle aparameter N * (Gruber and Sarmiento, 1997) wasproposed to study the denitrification and nitrogenfixation distribution in the NW Black Sea waters. Tosimplify, the entire process ofremineralization was considered as
OX
ICA
NO
XIC
0
50
100
150
200
250
300
350
400
450
500
0.00 5.00 10.00
NO3-[µM]
Dept
h[m
]
0
50
100
150
200
250
300
350
400
450
500
0.00 0.10 0.20
NO2-[µM]
Dept
h[m
]
0
50
100
150
200
250
300
350
400
450
500
0.00 20.00 40.00 60.00
NH4+[µM]
Dept
h [m
]
SUBOXIC
Fig. 3.4 - Nitrates, nitrites and ammonium vertical profiles, opensea stations (5-9) –R/V “Mare Nigrum” expedition – April 2008
nitrification (oxidation to NO3-) even if the first step is ammonification.
Parameter N * (μM) is quasi-conservative and combines linear nitrates andphosphates concentrations to study denitrification and nitrogen fixationdistribution. It was calculated using the formula:
N* = (N-16P + 2, 9µmol/kg)*0, 87 [µM]
where N is the nitrate concentration (μM), P the phosphate concentration (μM)and 16 represents the stoichiometric ratio N:P (Redfield), constant duringorganic matter remineralization (Gruber and Sarmiento, 1997). The otherconstants were determined by the authors based on data collected from theentire World Ocean in the parameter design. This linear combination largelyeliminates the effect of nitrification through nitrate and phosphate so N*variability is primarily due to denitrification and nitrogen fixation effects.
N * absolute value is arbitrary. Positive values can not be directlyassociated with nitrogen fixation or negative values with denitrification. Onlychanges that lead to a nonconservative behavior can be interpreted asdenitrification or nitrogen fixation net effect (Gruber, 1997).
According to our nitrate and phosphate concentration measurements, N* has valuesbetween -112 ÷ 28μM, with average -10 µM and standard deviation 27µM. Our datarevealed a high correlation between N* and salinity at the surface (R2 =0.8637) - the parameter is conservative. Together with increasing depth andlack of oxygen, N* becomes less correlated with salinity, the decreasedcoefficient of linear regression (R2 = 0.4492) deviations could explaindenitrification (Fig. 3.6).
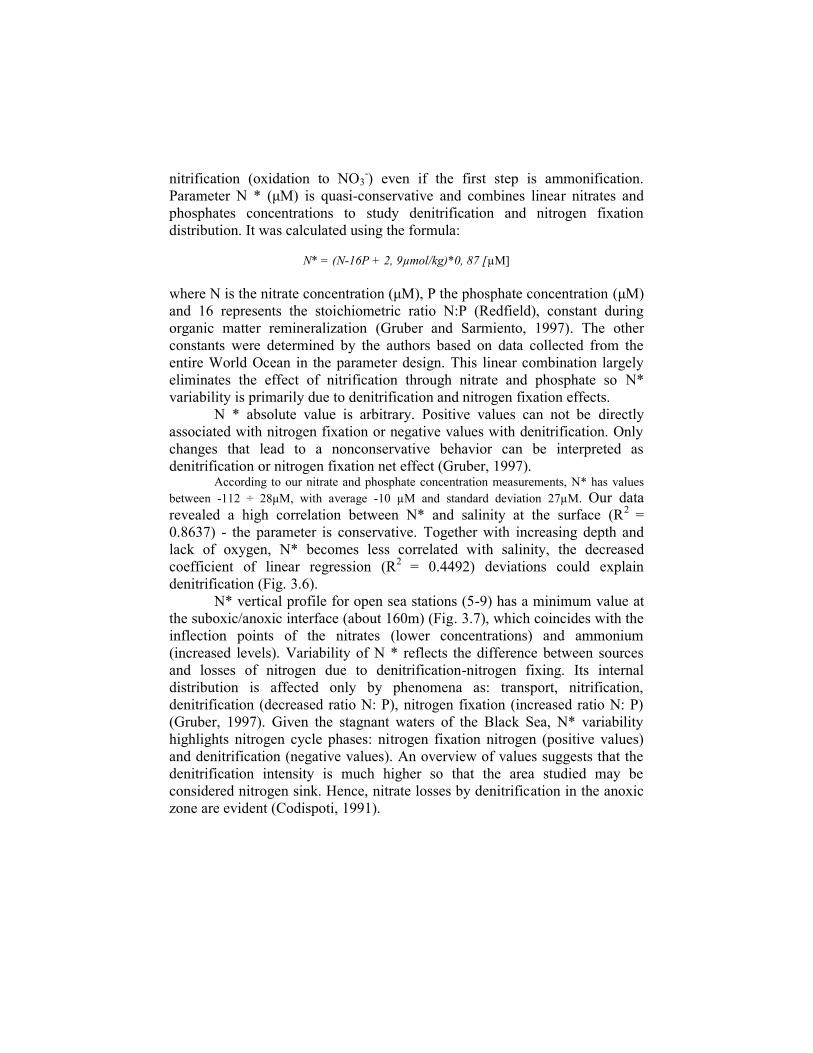
N* vertical profile for open sea stations (5-9) has a minimum value atthe suboxic/anoxic interface (about 160m) (Fig. 3.7), which coincides with theinflection points of the nitrates (lower concentrations) and ammonium(increased levels). Variability of N * reflects the difference between sourcesand losses of nitrogen due to denitrification-nitrogen fixing. Its internaldistribution is affected only by phenomena as: transport, nitrification,denitrification (decreased ratio N: P), nitrogen fixation (increased ratio N: P)(Gruber, 1997). Given the stagnant waters of the Black Sea, N* variabilityhighlights nitrogen cycle phases: nitrogen fixation nitrogen (positive values)and denitrification (negative values). An overview of values suggests that thedenitrification intensity is much higher so that the area studied may beconsidered nitrogen sink. Hence, nitrate losses by denitrification in the anoxiczone are evident (Codispoti, 1991).

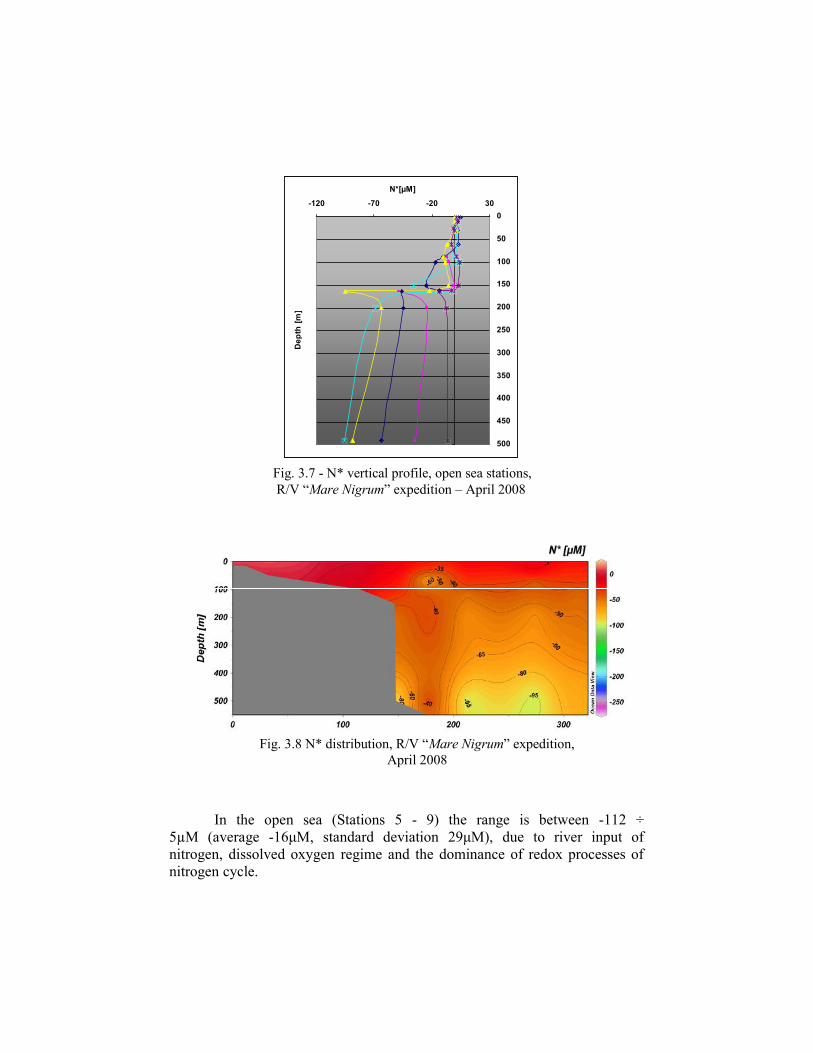
N * distribution (Fig. 3.8) is variable depending on the analyzed waterbodies. Thus, in the coastal Stations 1 - 4, with a significant contribution ofnitrates, the parameter varies in the range -10 ÷ 28µM (average 6μM, standarddeviation 8μM) due to high ratio N: P.
Fig. 3.6 - Linear correlations between N* and salinity – R/V “Mare Nigrum”,April 2008
Suprafaţă
R2 = 0,8637
0
5
10
15
20
25
30
35
0 5 10 15 20
S[g/l]
N*[
µM]
N*Linear (N*)
Toate staţiile
R2 = 0,2298
-300
-250
-200
-150
-100
-50
0
50
100
0 5 10 15 20 25
S[g/l]
N*[
µM]
N*[µM]Linear (N*[µM])
Fund
R2 = 0,4492
-120
-100
-80
-60
-40
-20
0
20
40
0,00 5,00 10,00 15,00 20,00 25,00
S[g/l]
N*[
µM] N*
Linear (N*)
All stations
Surface
Bottom
0
50
100
150
200
250
300
350
400
450
500
-120 -70 -20 30
N*[µM]
Dep
th [m
]
Fig. 3.7 - N* vertical profile, open sea stations,R/V “Mare Nigrum” expedition – April 2008
In the open sea (Stations 5 - 9) the range is between -112 ÷5µM (average -16μM, standard deviation 29μM), due to river input ofnitrogen, dissolved oxygen regime and the dominance of redox processes ofnitrogen cycle.
Fig. 3.8 N* distribution, R/V “Mare Nigrum” expedition,April 2008

CONCLUSIONS
The results of our researches carried out in NW Black Sea in the springof the year 2008 confirm that the values of general environmental indicators(temperature, oxygen, salinity) correspond to the specific seasonal characteristics known forthe coastal and marine waters in NW Black Sea:
nitrogen inorganic forms highlight the influence of the Danube input and thedominance of nitrate;
inshore vertical distribution of nitrogen inorganic forms shows specific valuesfor shallow areas with major river input where biological activity is intense;
the same parameters in the offshore waters had characteristic values forstratified anoxic zones, where redox processes influence nitrogencycle and ammonium is the dominant form;
in the offshore waters nitrogen is the limiting factor of primaryproduction;
data provided by the parameter N*, tested as a new method for theBlack Sea, prove to be useful in initiating the assessment process ofthe nitrogen role in the marine biogeochemical cycle;
considering that globally 30-50% of the total nitrogen catch in theocean is in oxygen minimum zones due to denitrification (Gruber,1997), it is necessary to correlate these data with microbiologystudies allowing quantification of microbial oxidation-reductionprocesses of nitrogen in the studied area.
BIBLIOGRAPHY
http://ocean.stanford.edu/gp231/readings/N-cycle.pdfhttp://www.mpi-bremen.de/en/Nitrogen_Cycling_in_the_Black_Sea.htmlANDERSON L.A., SARMIENTO J.L. - Redfield ratios of remineralization determined by
nutrient data analysis. Global Biogeochemical Cycles, Vol.8, No.1, 65-80, 1994CODISPOTI L.A., BRANDES J., CHRISTENSEN J., DEVOL A., NAQVI S., PAERL H.,
YOSHINARI T. - The oceanic fixed nitrogen and nitrous oxide budgets:Movingtargets as we enter the anthropocene? Scientia Marina, 65 (Suppl. 2): p.85-105, 2001
CODISPOTI L.A., FRIEDERICH G.E., MURRAY J.W., SAKAMOTO C.M. – Chemicalvariability in the Black Sea: implications of continuos vertical profiles thatpenetrated the oxic/anoxic interface. Deep Sea-Research Vol.38, 1991
CODISPOTI L.A., RICHARDS F.A. - An analysis of the horizontal regime of denitrificationin the eastern tropical North Pacific, Limnology and Oceanography, vol.21, 1976
GIANGUZZA A., PELIZZETTI E., SAMMARTANO S. - Chemical processes in marineenvironments, 441 p., Springer, 2000
GRASSHOFF K., KREMLING K., EHRHARDT M. – Methods of Seawater Analysis, Third,Completely Revised and Extended Edition. Wiley – VCH, 1999
GRUBER N., SARMIENTO J. – Global patterns of marine nitrogen fixation anddenitrification, Global Biogeochemical Cycles, Vol.11, No.2, p 235-266, 1997

HISCOCK W., MILLERO F. – Alkalinity of the anoxic waters in the western Black Sea,Deep-Sea Research II 53, p. 1787-1801, 2006
HORNE R.A. – Marine Chemistry, The structure of water and the Chemistry of theHydrosphere, 567p., Wiley – Interscience, 1969
JENSEN M., PETERSEN J., DALSGAARD T., THAMDRUP B. - Pathways, rates, andregulation of N2 production in the chemocline of an anoxic basin, Mariager Fjord,Denmark. Marine Chemistry, journal homepage: www.elsevier.com/locate/marchem,Available online 15 January 2009
KONOVALOV S.K., MURRAY J.W. - Variations in the chemistry of the Black Sea on atime scale of decades 1960–1995. Journal of Marine Systems 795 2001 xxx 45,www.elsevier.com, 2001
MURRAY J.W. – The 1988 Black Sea Oceanographic Expedition: introduction and summary,Deep Sea-Research Vol.38, 1991
PERES J.-M. - Oceanographie Biologique et Biologie Marine. Presses Universitaires deFrance, Paris, 1961
SCHLITZER R., Ocean Data View, http://odv.awi.de, 2009SOUCHU P., GASC ANNE, COLLOS Y., VAQUER A., TOURNIER H., BIBENT B.,
DESLOUS-PAOLI J.M. - Biogeochemical aspects of bottom anoxia in aMediterranean lagoon (Thau, France). Marine Ecology Progress Series, Vol. 164:135-146, 1998
VACCARO R.F. – Inorganic nitrogen in Sea Water. Chemical Oceanography, Vol.I.Academic Press London and New York, 1965
VESPREMEANU E. – Geografia Mării Negre. Editura Universităţii din Bucureşti, 2004YILMAZ A., COBAN-YILDIZ Y., TUGRUL S. - Biogeochemical cycling and multilayer
production in the Black Sea. Geophysical Research Abstracts, Vol. 8, 00541, 2006


