

Investor Presentation
February, 2018

Safe Harbor2
Certain statements in this presentation concerning our future growth prospects are forward-lookingstatements regarding our future business expectations intended to qualify for the 'safe harbor' under thePrivate Securities Litigation Reform Act of 1995, which involve a number of risks and uncertainties thatcould cause actual results to differ materially from those in such forward-looking statements. The risksand uncertainties relating to these statements include, but are not limited to, risks and uncertaintiesregarding fluctuations in earnings, fluctuations in foreign exchange rates, our ability to manage growth,intense competition in IT services including those factors which may affect our cost advantage, wageincreases in India, our ability to attract and retain highly skilled professionals, time and cost overruns onfixed-price, fixed-time frame contracts, client concentration, restrictions on immigration, industrysegment concentration, our ability to manage our international operations, reduced demand fortechnology in our key focus areas, disruptions in telecommunication networks or system failures, ourability to successfully complete and integrate potential acquisitions, liability for damages on our servicecontracts, the success of the companies in which Infosys has made strategic investments, withdrawal orexpiration of governmental fiscal incentives, political instability and regional conflicts and inability toaccurately predict economic or industry trends, legal restrictions on raising capital or acquiringcompanies outside India, and unauthorized use of our intellectual property and general economicconditions affecting our industry. Additional risks that could affect our future operating results are morefully described in our United States Securities and Exchange Commission filings including our AnnualReport on Form 20-F for the fiscal year ended March 31, 2017. These filings are available atwww.sec.gov. Infosys may, from time to time, make additional written and oral forward-lookingstatements, including statements contained in the company's filings with the Securities and ExchangeCommission and our reports to shareholders. In addition, please note that the date of this presentationis mentioned at the beginning of the presentation, and any forward-looking statements contained hereinare based on assumptions that we believe to be reasonable as of this date. The company does notundertake to update any forward-looking statements that may be made from time to time by or on behalfof the company unless it is required by law.

An overview
*Based on Q3FY18 numbers
@ New Services include Cloud Ecosystem, Big Data and Analytics, API and Micro services, Data and Mainframe Modernization, Cyber Security, IoT Engineering Services. #As of last day of the quarter based on closing NYSE price
3
LTM Revenues ($/INR)* $10.7 billion/ ₹69,559 crsLTM Net Income ($/INR)* $2.46 billion/ ₹15,941 crsNew services & software*@ 11.6% of revenuesEmployees (December-17) 201,691 from 126 nationalitiesMarket cap (December-17)# $35.4 billion
Global Listing NSE, BSE, NYSE, NYSE Euronext London, NYSE Euronext Paris
Business Model To provide integrated end-to-end outsourcing and consulting services, products and platforms

4
•Automation•New- Renew•Innovation
•Design thinking•Artificial Intelligence
People | Organization | Infrastructure | Process | Quality Infosys Global Delivery Model
1981
1996
2001
2008
2014
Expanding the services footprint
ADM,Software re-engeneering
Technology Consulting, Technology
enabledBPR,
EnterpriseSolutions
IT outsorcing, Systems
Integration, Infrastructure Manageemnt,
ProductLifecycle
Management
SaaS,Learning,
Consulting, Business Process
Management
Automation,Renew-New, Innovation,
Design Thinking, Artificial
Intelligence

Strategy and approach to market 5
Strategy
• Renew-New strategy - Doing more with less for more
• Combine Automation and Innovation led by a culture of education and learning with emphasis on Design Thinking
• Drive new opportunities in business through end-to-end service capability, deep vertical penetration and broad geographical footprint
Approach to market
• ‘One INFY’ – helping clients’ leverage full service potential
• Cross-selling – sell more services to clients
• Vertical focus to create industry-specific expertise
• Investing in people and infrastructure
• Creating products and platforms

A ‘Renew-New’ strategy to embrace future6
RENEW THECORE BUSINESS
o Reimagined core service lineso Improved end user productivityo Implemented “how” innovations
INNOVATE INTONEW BUSINESS
o Integrated design thinking into consulting
o Implemented “what” innovations o Created living labs to co-create with
client
CULTURE of EDUCATION & COLLABORATION
o Instituted learning through world’s largest corporate university.o Accelerated design thinking training for all.

Growing Client Relationships and Increasing Client Base
7
Execution excellence resulted in high share of repeat business (98.3% in Q3 FY 18)
798 890
950
1,092 1,162 1,191
FY 13 FY 14 FY 15 FY 16 FY 17 9m FY 18
Increasing client base
311432
97
142
28
36
12
20
FY 13 9m FY18
`
Large, Growing Client Relationships
1-10 mn 10-50 mn 50-100 mn 100 mn+

Market Opportunities8
Global Mega Trends• Asia – New “center of gravity” for the world
• “Geography becomes History” with reduced telecommunication costs
• Technology – the supreme enabler
• Differentiated access to highly educated, cost-competitive human capital
• Leading the Next-Generation Business Model and investing in innovations and business solutions
• Redefining scalability with modular global infrastructure
Infosys – Transformation Partner

Offshore Outsourcing is a Global Mega Trend9
Outsourcing Benefits
• Convert fixed costs to variable• Reduce TCO and enhance ROI• Improve competitiveness • Improve time-to-market
Offshore Benefits
• Deliver high quality at great value• Highly scalable with a large resource pool available• Proven track record

Competitive Situation10
High Quality Delivery and Offerings
• Established track record of exceptional quality
• Expanded offerings that encompass the entire value chain
Established Industry
• IT-BPM continues to remain the highest impact sector for India amongst all service industries in terms of contribution to GDP and exports
• Offshore ‘home’ for virtually all the leading technology companies
Strong Government Support
• “Tax Holiday” schemes
• Supportive Government policy environment
Significant Benefits
• Substantial cost savings associated with moving offshore
• Large intangible benefits such as reduced time to marketIndia – Uniquely positioned

Developing and Retaining the Best11
• Learning support to employeestowards new technologiesthereby enhancing careerprogression which improves long-term retention
• 1300+ unique employees trained oncritical skills in FY17
• Trained over 142,000+ employeesin design thinking
• Annualized standalone attrition at15.8% in Q3 FY18; high performerattrition significantly lower thancompany average
• Initiatives like Zero Distance andZero Bench are instilling a cultureof innovation
Leadership Development
Leadership Training
Advanced Training
Managerial Training
Client-facing Training
Domain Training
Role-Based Development
Soft Skills TrainingQuality TrainingOn-the-job
TrainingFoundation
Training
Role-Based DevelopmentInduction
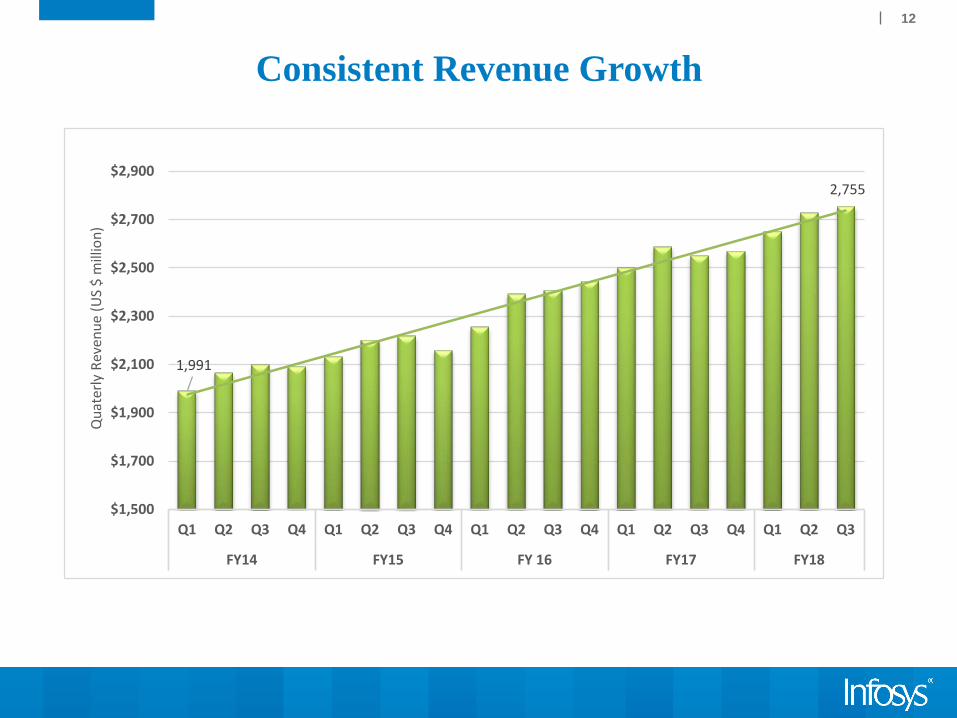
Consistent Revenue Growth12
1,991
2,755
$1,500
$1,700
$1,900
$2,100
$2,300
$2,500
$2,700
$2,900
Q1 Q2 Q3 Q4 Q1 Q2 Q3 Q4 Q1 Q2 Q3 Q4 Q1 Q2 Q3 Q4 Q1 Q2 Q3
FY14 FY15 FY 16 FY17 FY18
Qua
terly
Rev
enue
(US
$ m
illio
n)

Sustained Profitability13
418
796
23.5% 24.3%
0.0%
5.0%
10.0%
15.0%
20.0%
25.0%
30.0%
$350
$400
$450
$500
$550
$600
$650
$700
$750
$800
$850
Q1 Q2* Q3 Q4 Q1 Q2 Q3 Q4 Q1 Q2 Q3 Q4 Q1 Q2 Q3 Q4 Q1 Q2 Q3^
FY14 FY15 FY 16 FY17 FY18
Ope
ratin
g M
argi
n %
Qua
rter
ly N
et In
com
e (U
S $
mill
ion)
Flexible cost structure helps Infosys maintain high margins
*Q2 FY14 include a provision of $36 mn towards visa related matters^Q3 FY18 includes $ 225 mn of reversed income tax expense provision in accordance with "APA" which
pertains to previous period

Cost Optimization Initiatives
14
Revenue per employee:
Continued productivity improvements led to high revenue
per employee of $52,676 in Q3, growth of 1.9% QoQ and 4.8% YoY
SUBCON COST:
At 5.9% in Q3 FY 18 led by higher utilization and onsite talent
demand
UTILIZATION EX-TRAINEES:
Highest utilization in 15 years at 84.9% in Q3 FY 18. Utilization
including trainees continues to remain highest ever at 82.1%
ONSITE MIX:
At 29.0%, v/s 29.4% QoQ, lowest level in last 11 quarters

Strong and Liquid Balance Sheet 15
• Highly liquid (Liquid assets including cash and cash equivalents and investments stand at $4,538 mn as at December’17, post an outflow of $2 bn towards share buy back in December’17), Zero debt
• Cash generated from operations stands at $657 mn vs. $441 mn in Q2 FY18
Consistent shareholder’s returns
3.8 5.0 7.5 10.0 11.0 13.06.810.8
14.814.3 14.8
0.0
5.0
10.0
15.0
20.0
25.0
30.0
FY 13 FY 14 FY 15 FY 16 FY 17 FY 18
Dividend history
Interim Final
10.5
15.8
22.324.3 25.8

Evolution of Capital Allocation Policy 16
Prior to FY 14 April-14 April-15 April-17
30% of NP
40% of NP
50% of NP
70% of FCF
o Board has reviewed the capital allocation policyon multiple occasions and revised it to increaseshareholder returns
o In April-17, the Board identified an amount of upto₹13,000 crore ($2 billion) to be paid out toshareholders during Financial Year 2018
o In August – 17, the Board approved a proposal tobuy back fully paid up equity shares for an amountnot exceeding ₹ 13,000 crores representing 4.92% ofthe paid up share capital of the company at a priceof ₹ 1,150 per share
o In December – 17, the company successfullycompleted the buyback of app. 113 million equityshares from eligible shareholders
FCF refers to Free cash flow, defined as net cash provided by operating activities less capital expenditure as per the consolidated statement of cash flows prepared under IFRS

We are a responsible corporate citizen*17
Environmental Sustainability
• Reduced per capita electricity consumption by 51% *• 11.1 million sqft. of built up area is LEED Platinum certified • 44.6% of our overall electricity requirements met through renewables• We joined the Carbon Pricing Leadership Coalition (CPLC)• Pune Phase 2 is the world’s largest LEED Platinum Certified campus*while employee strength increased 143% our electricity consumption only increased by 19%
• Women make up 36% of our workforce; By 2020, our aspiration is for women to account for 25% of our leadership.
• The Practice Guidelines to integrate employees with disabilities and accessible infrastructure across our India campuses were primary initiatives for EwD
• Our target for Non-Indian nationals is to reach 15% of our workforce by 2020
• We achieved the best Customer Satisfaction scores in 12 years • 16,551 ZD ideas created with over 8,368 discussed with clients• Over the years we have won 12 Global MAKE (Most Admired Knowledge
Enterprise) awards
Diversity
BusinessSustainability
*As of March, 2017

Challenges18
Economic uncertainty
Regulatory changes
Currency Volatility
Pricing pressures
Wage inflation
Volatility in global IT spend - discretionary & non- discretionary
Resource availability

© 2015 Infosys Limited, Bangalore, India. All Rights Reserved. Infosys believes the information in this document is accurate as of its publication date; such information is subject to change without notice. Infosys acknowledges the proprietary rightsof other companies to the trademarks, product names and such other intellectual property rights mentioned in this document. Except as expressly permitted, neither this documentation nor any part of it may be reproduced, stored in a retrievalsystem, or transmitted in any form or by any means, electronic, mechanical, printing, photocopying, recording or otherwise, without the prior permission of Infosys Limited and/ or any named intellectual property rights holders under this document.
Thank You


