

VIRGINIA IN THE FUTURE TRENDS ANALYSIS MULTIMODAL ADVISORY COMMITTEE MEETING - AUGUST 4, 2014
1
2
INTR
OD
UC
TIO
N
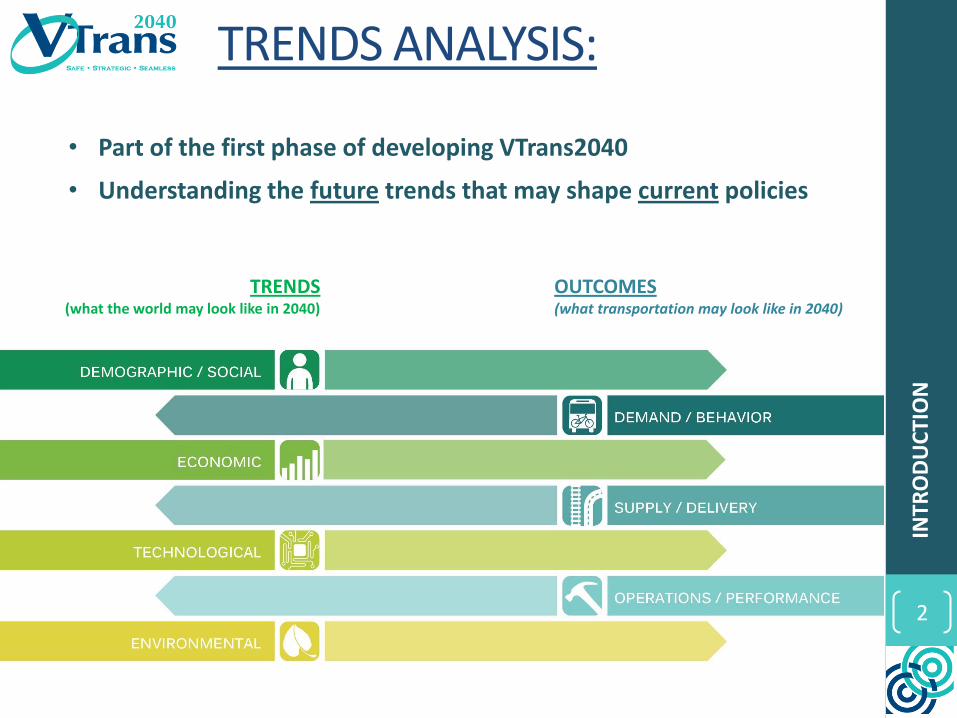
• Part of the first phase of developing VTrans2040
• Understanding the future trends that may shape current policies
TRENDS (what the world may look like in 2040)
OUTCOMES (what transportation may look like in 2040)
TRENDS ANALYSIS:

3
INTR
OD
UC
TIO
N What is
Virginia’s Future Economy?
What are its Transportation
Needs?
KEY QUESTIONS

4
INTR
OD
UC
TIO
N
PRESENTATION OVERVIEW
DEMOGRAPHIC / SOCIAL
ECONOMIC
TECHNOLOGICAL
ENVIRONMENTAL
1 REVIEW TRENDS:
2 COMBINE DATA:
A
B
3 GET INPUT:
SYNTHESIS
WHAT DO YOU SAY? ?
5
DEMOGRAPHIC / SOCIAL

6
Virginia’s Population will Grow
Virginia’s Projected Population Growth by 2040 Projected Population Growth (2040) in US vs. VA
DEM
OG
RA
PH
IC /
SO
CIA
L

7
DEM
OG
RA
PH
IC /
SO
CIA
L
WHY IS THIS IMPORTANT? Our forecasts are uncertain – even more so in the smallest areas of study
Projected Population vs. Actual Population over 20 Years
Forecasts are Humbling
Forecasts Can Disagree

8
DEM
OG
RA
PH
IC /
SO
CIA
L
WHY IS THIS IMPORTANT? To understand where transportation needs will be concentrated
Ten Jurisdictions Displaying Greatest Total Population Increases
Continued Population Concentrations
Projected Population Growth

9
DEM
OG
RA
PH
IC /
SO
CIA
L
Older Virginians are an expanding proportion of the population in 2040
Ten Jurisdictions Displaying Highest Increase in 65+ Population by 2040
WHY IS THIS IMPORTANT? Some elderly will need more travel options as they age
Virginia is Aging
10
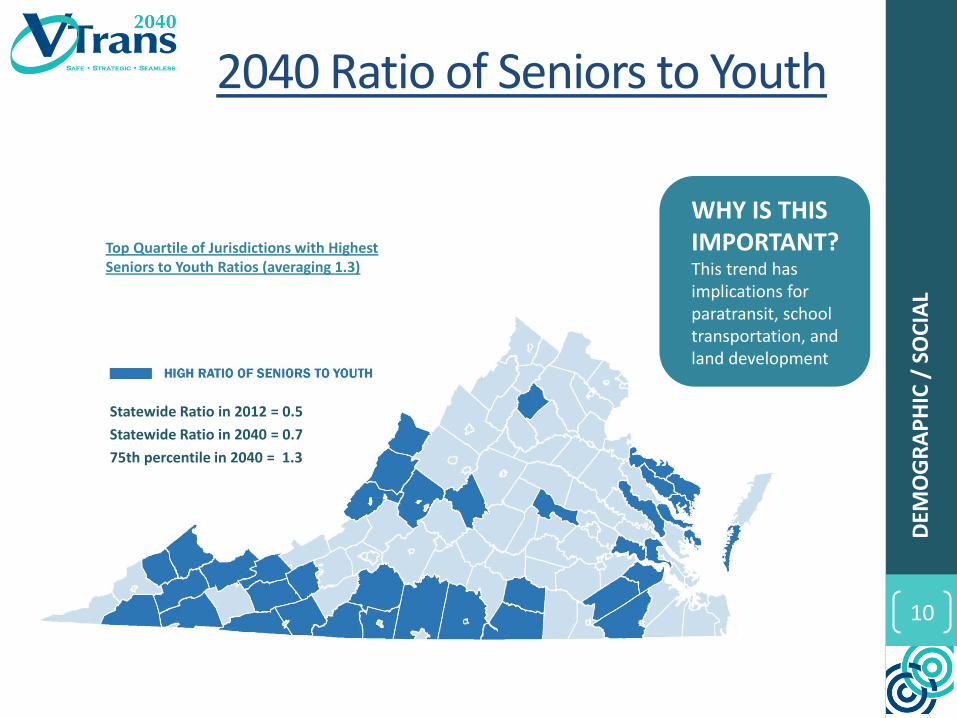
2040 Ratio of Seniors to Youth
Top Quartile of Jurisdictions with Highest Seniors to Youth Ratios (averaging 1.3)
WHY IS THIS IMPORTANT? This trend has implications for paratransit, school transportation, and land development
Statewide Ratio in 2012 = 0.5
Statewide Ratio in 2040 = 0.7
75th percentile in 2040 = 1.3
DEM
OG
RA
PH
IC /
SO
CIA
L

11
DEM
OG
RA
PH
IC /
SO
CIA
L
WHY IS THIS IMPORTANT? Millenials are often the workforce for the fastest growing economic sectors
Ten Jurisdictions with the Highest Increase in Millenial Population
Millenial Population
12
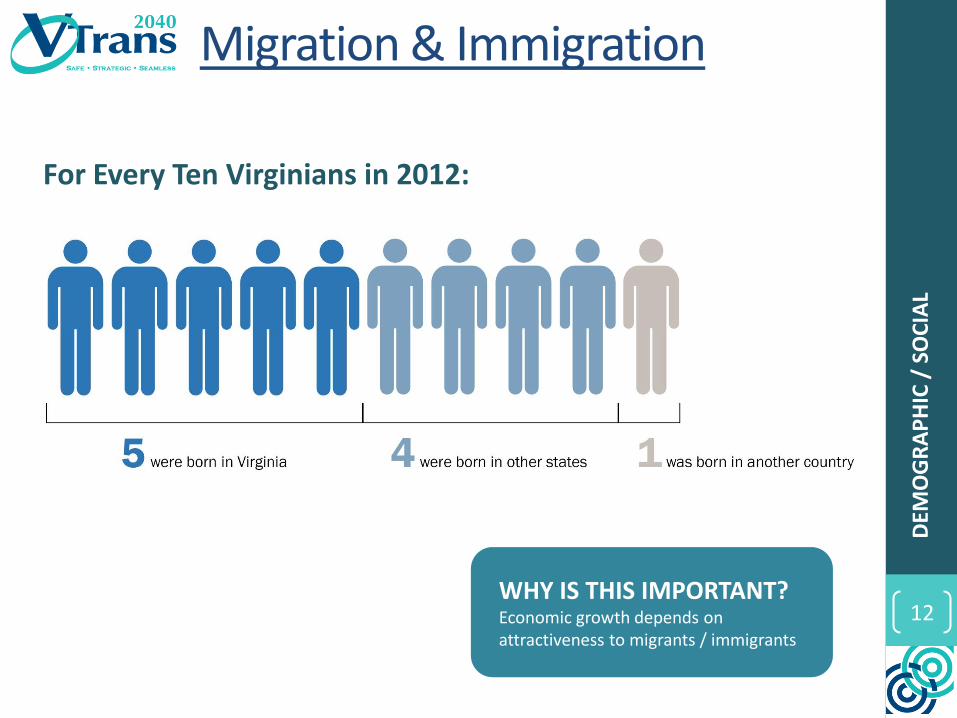
For Every Ten Virginians in 2012:
DEM
OG
RA
PH
IC /
SO
CIA
L
WHY IS THIS IMPORTANT? Economic growth depends on attractiveness to migrants / immigrants
Migration & Immigration

13
ECONOMIC
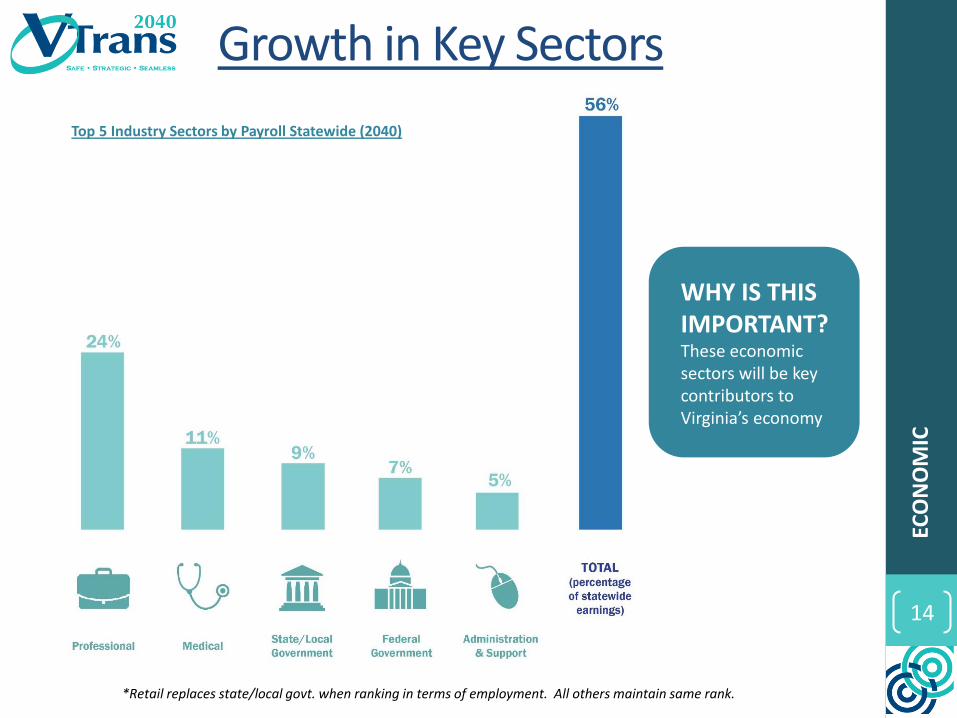
Top 5 Industry Sectors by Payroll Statewide (2040)
14
*Retail replaces state/local govt. when ranking in terms of employment. All others maintain same rank.
Growth in Key Sectors
WHY IS THIS IMPORTANT? These economic sectors will be key contributors to Virginia’s economy
ECO
NO
MIC

15 15
Economic Activity in Key Regions
2012 % of Total State Employment
2012 % of Total State GDP
WHY IS THIS IMPORTANT? These areas are key contributors to Virginia’s economy today
37% of Total State GDP
47% of Total State Employment
ECO
NO
MIC

16
Economic Concentrations by Region
WHY IS THIS IMPORTANT? Different Industry sectors will have different workforce and transportation needs
Retail Trade Employment (2040 Note the Rural Concentration
Health Care and Social Assistance Payroll (2040) Note the Rural Concentration
Professional Services Employment (2040) Note the Urban Concentration
Finance and Insurance Payroll (2040) Note the Urban Concentration
Higher Total Payroll
Higher Employment

Measuring Relative Change in Industrial Specialization through Location Quotient (LQ) Analysis
• While the greatest magnitude of job gains occur in the largest counties, LQ Analysis can show which counties have seen the greatest relative change in industrial specialization
Largest Gains in Professional Services (NAICS 54) 2001-2013
• Lynchburg
• Architectural and Engineering Services + 3.04 LQ
• Albemarle County
• Scientific Research and Development + 2.63 LQ
• Bedford County
• Advertising + 2.29 LQ 17
WHY IS THIS IMPORTANT? Concentrations of key industries indicate local/ regional workforce and transportation needs

18
Freight Concentrations by Region
Legend
county selection
ChangeTonsPCT
-35 to 0
0 to 20
20 to 35
35 to 50
50 to 86
Legend
county selection
CombTons2040
222 to 3,000
3,000 to 6,500
6,500 to 12,000
12,000 to 22,000
22,000 to 62,000
Legend
county selection
Comb2040Value
211 to 2,000
2,000 to 5,000
5,000 to 10,000
10,000 to 22,000
22,000 to 112,000
2012
2040
WHY IS THIS IMPORTANT? Note growth in I-81 and 58 corridors – important to understand future corridor needs
Truck Value Growth Virginia Counties ($M)
ECO
NO
MIC
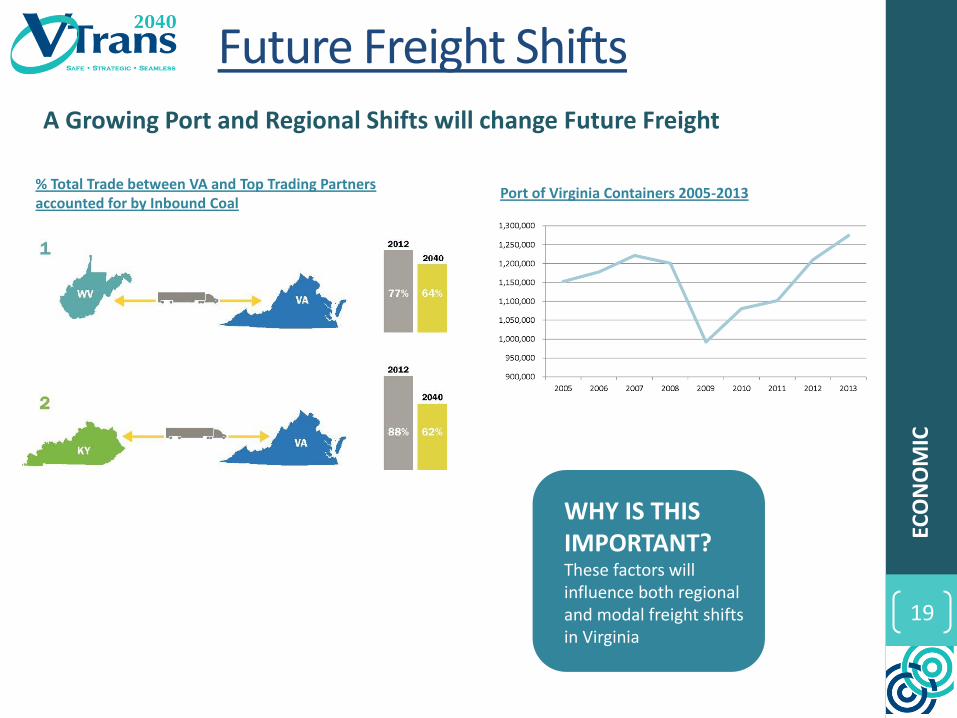
Future Freight Shifts
19
A Growing Port and Regional Shifts will change Future Freight
Port of Virginia Containers 2005-2013
WHY IS THIS IMPORTANT? These factors will influence both regional and modal freight shifts in Virginia
% Total Trade between VA and Top Trading Partners accounted for by Inbound Coal
ECO
NO
MIC

Modal Shifts in Freight
SOURCE: FAF3
US & VA Tonnage Growth by Mode 2012 to 2040
WHY IS THIS IMPORTANT? Virginia is expected to have significant rail freight increases
ECO
NO
MIC
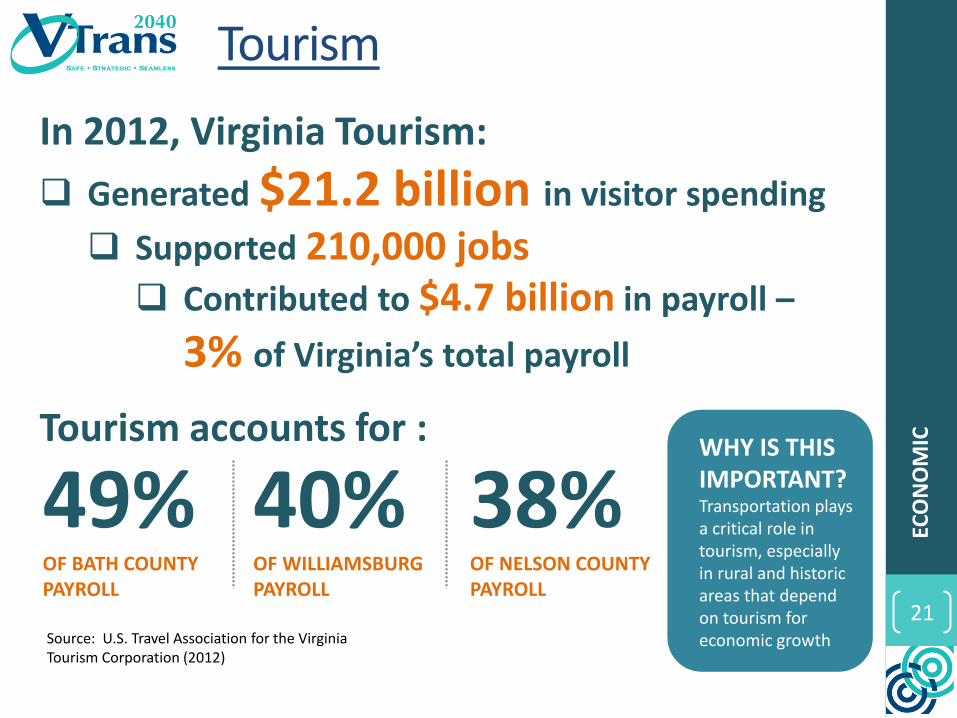
Tourism
21
In 2012, Virginia Tourism:
Generated $21.2 billion in visitor spending
Supported 210,000 jobs Contributed to $4.7 billion in payroll –
3% of Virginia’s total payroll
Source: U.S. Travel Association for the Virginia Tourism Corporation (2012)
49% OF BATH COUNTY PAYROLL
40% OF WILLIAMSBURG PAYROLL
38% OF NELSON COUNTY PAYROLL
Tourism accounts for : WHY IS THIS IMPORTANT? Transportation plays a critical role in tourism, especially in rural and historic areas that depend on tourism for economic growth
ECO
NO
MIC
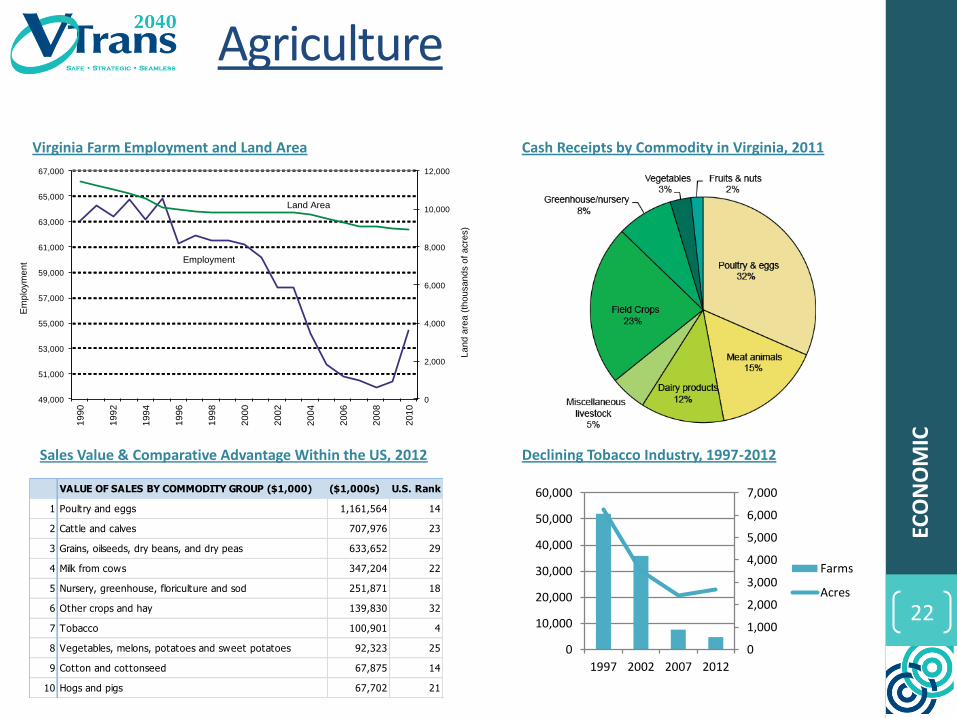
Agriculture
22
ECO
NO
MIC
0
2,000
4,000
6,000
8,000
10,000
12,000
49,000
51,000
53,000
55,000
57,000
59,000
61,000
63,000
65,000
67,000
19
90
19
92
19
94
19
96
19
98
20
00
20
02
20
04
20
06
20
08
20
10
La
nd
are
a (
tho
usa
nd
s o
f a
cre
s)
Em
plo
ym
en
t Employment
Land Area
VALUE OF SALES BY COMMODITY GROUP ($1,000) ($1,000s) U.S. Rank
1 Poultry and eggs 1,161,564 14
2 Cattle and calves 707,976 23
3 Grains, oilseeds, dry beans, and dry peas 633,652 29
4 Milk from cows 347,204 22
5 Nursery, greenhouse, floriculture and sod 251,871 18
6 Other crops and hay 139,830 32
7 Tobacco 100,901 4
8 Vegetables, melons, potatoes and sweet potatoes 92,323 25
9 Cotton and cottonseed 67,875 14
10 Hogs and pigs 67,702 21
Virginia Farm Employment and Land Area Cash Receipts by Commodity in Virginia, 2011
Sales Value & Comparative Advantage Within the US, 2012
0
1,000
2,000
3,000
4,000
5,000
6,000
7,000
0
10,000
20,000
30,000
40,000
50,000
60,000
1997 2002 2007 2012
Farms
Acres
Declining Tobacco Industry, 1997-2012

23
Rural Employment Change
WHY IS THIS IMPORTANT? While holding steady overall, rural employment will grow in healthcare & social services
ECO
NO
MIC
24
TECHNOLOGICAL
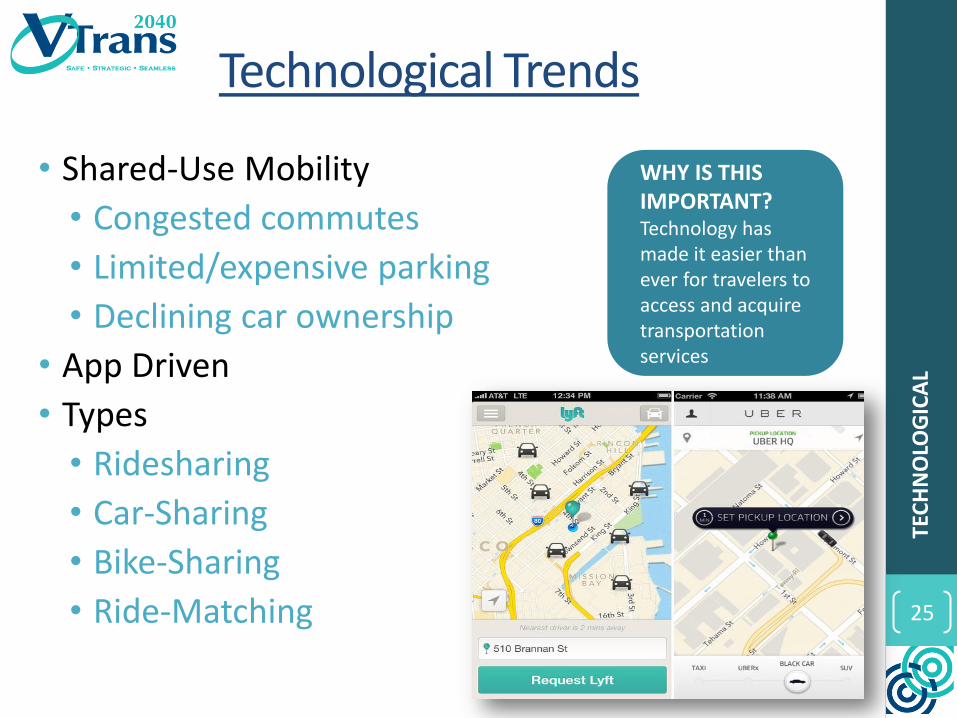
Technological Trends
• Shared-Use Mobility
• Congested commutes
• Limited/expensive parking
• Declining car ownership
• App Driven
• Types
• Ridesharing
• Car-Sharing
• Bike-Sharing
• Ride-Matching
WHY IS THIS IMPORTANT? Technology has made it easier than ever for travelers to access and acquire transportation services
25
TEC
HN
OLO
GIC
AL
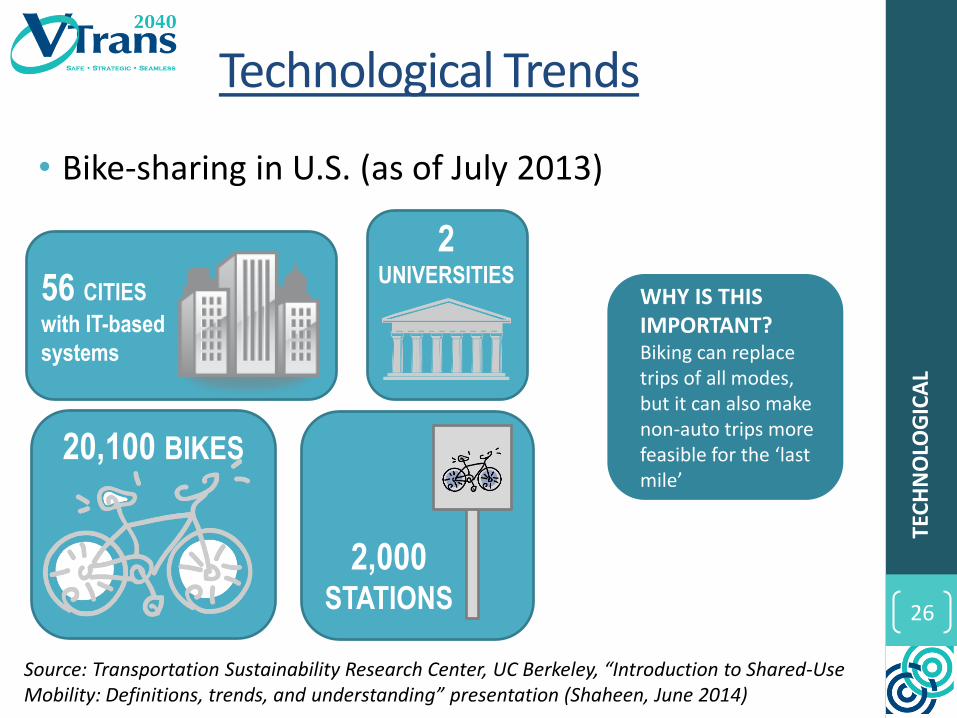
Technological Trends
• Bike-sharing in U.S. (as of July 2013)
26
56 CITIES
with IT-based
systems
2 UNIVERSITIES
20,100 BIKES
2,000 STATIONS
Source: Transportation Sustainability Research Center, UC Berkeley, “Introduction to Shared-Use Mobility: Definitions, trends, and understanding” presentation (Shaheen, June 2014)
TEC
HN
OLO
GIC
AL
WHY IS THIS IMPORTANT? Biking can replace trips of all modes, but it can also make non-auto trips more feasible for the ‘last mile’
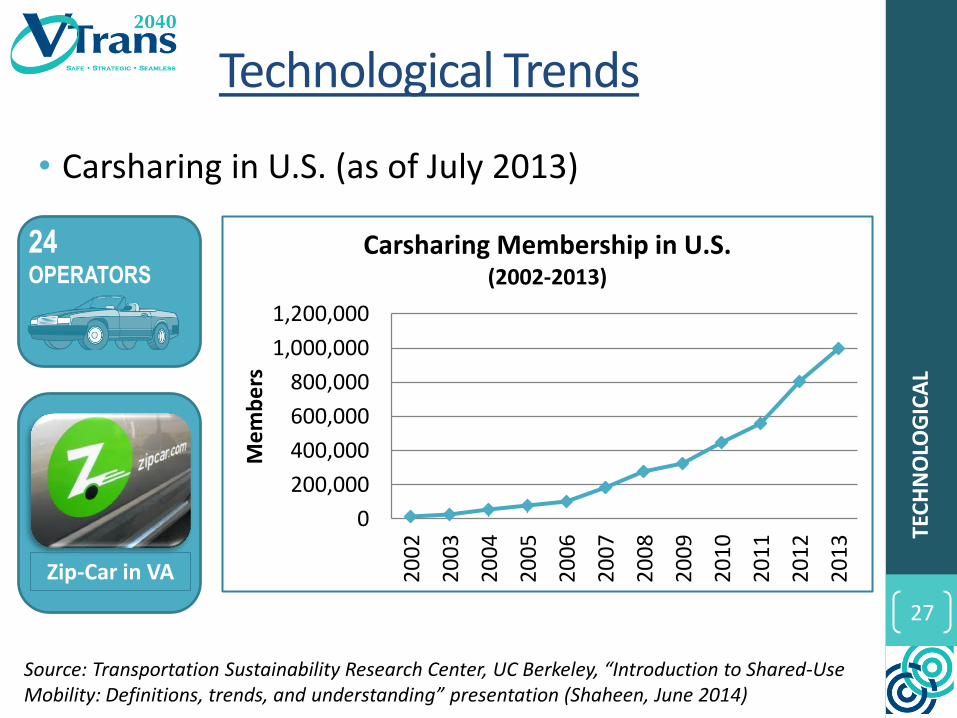
Technological Trends
• Carsharing in U.S. (as of July 2013)
27
Source: Transportation Sustainability Research Center, UC Berkeley, “Introduction to Shared-Use Mobility: Definitions, trends, and understanding” presentation (Shaheen, June 2014)
0
200,000
400,000
600,000
800,000
1,000,000
1,200,000
20
02
20
03
20
04
20
05
20
06
20
07
20
08
20
09
20
10
20
11
20
12
20
13
Me
mb
ers
Carsharing Membership in U.S.
(2002-2013)
24 OPERATORS
Zip-Car in VA
TEC
HN
OLO
GIC
AL

Technological Trends
• Smart Infrastructure
• Test bed on I-66, I-495 (Fairfax)
• Virginia Smart Road by VTTI and VDOT
• Wireless vehicle communication
• Dynamic paint, anti-icing
• Wireless electric-charging
• Innovations in roadway material
28
WHY IS THIS IMPORTANT? Innovations may lead to fuel economy, safety, congestion reduction
Photo: Solar Roadways
TEC
HN
OLO
GIC
AL

29
ENVIRONMENTAL

Climate Change
• Coastal Virginia – 2nd most vulnerable region in U.S.
• Degradation of ecosystems
• Low-elevation
• Rates of sea-level rise greater than average
WHY IS THIS IMPORTANT? VA Roads, bridges and other structures are vulnerable to shoreline erosion, increasing storm intensity, increasing global temperatures and rising ocean levels. Source: USGS, Coastal Vulnerability Index
Map
30
ENV
IRO
NM
ENTA
L

31
Climate Change
Source: “The Potential Impacts of Global Sea Level Rise on Transportation Infrastructure,” U.S. DOT, 2007-2008
ENV
IRO
NM
ENTA
L

Climate Change – Transportation Infrastructure
• Increase in very hot days/heat waves impacts
• Thermal expansion – bridges and pavements
• Rail track deformations
• Lift-off limits at hot weather airports
• Limitations on hours of construction
Source: 2008 Virginia Governor’s Commission on Climate Change, “The Potential Impacts of Global Sea Level Rise on Transportation Infrastructure” presentation (Transportation Research Board)
32 Ph
oto
: Jo
e M
aho
ney
, Un
iver
sity
of
Was
hin
gto
n
ENV
IRO
NM
ENTA
L
33
SYNTHESIS

How can we predict travel?
34
National Vehicle Miles Traveled (in Millions): Actual versus Projections
SYN
THES
IS
WHY IS THIS IMPORTANT? Observations about past behavior are not necessarily the best assumptions with which to forecast the future
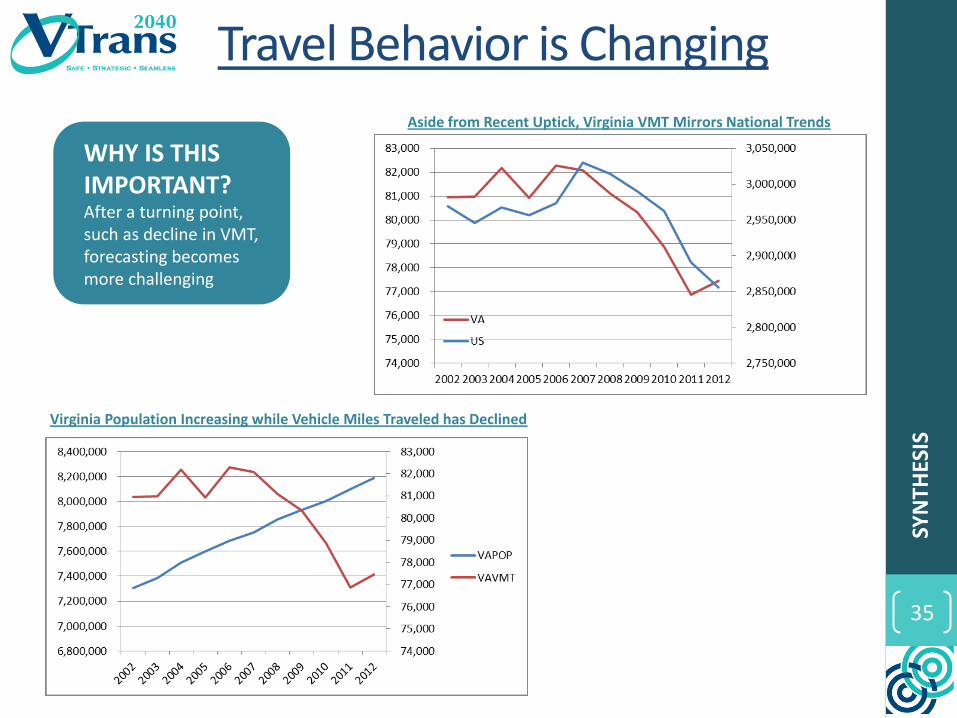
Travel Behavior is Changing
35
Virginia Population Increasing while Vehicle Miles Traveled has Declined
Aside from Recent Uptick, Virginia VMT Mirrors National Trends
SYN
THES
IS
WHY IS THIS IMPORTANT? After a turning point, such as decline in VMT, forecasting becomes more challenging

Travel Behavior is Changing
36
SYN
THES
IS
0
50,000
100,000
150,000
200,000
250,000
300,000
350,000
400,000
450,000
500,000
Carpooled
Worked from Home
Public Transportation
Walk
Bicycle, Motorcycle,Taxi
-10.0%
0.0%
10.0%
20.0%
30.0%
40.0%
50.0%
60.0%
Percent Change in Mode in Virginia (2005-2012)
Trips by Mode in Virginia (2012)
WHY IS THIS IMPORTANT? Future transportation plans must recognize changing preferences of commuters and travelers
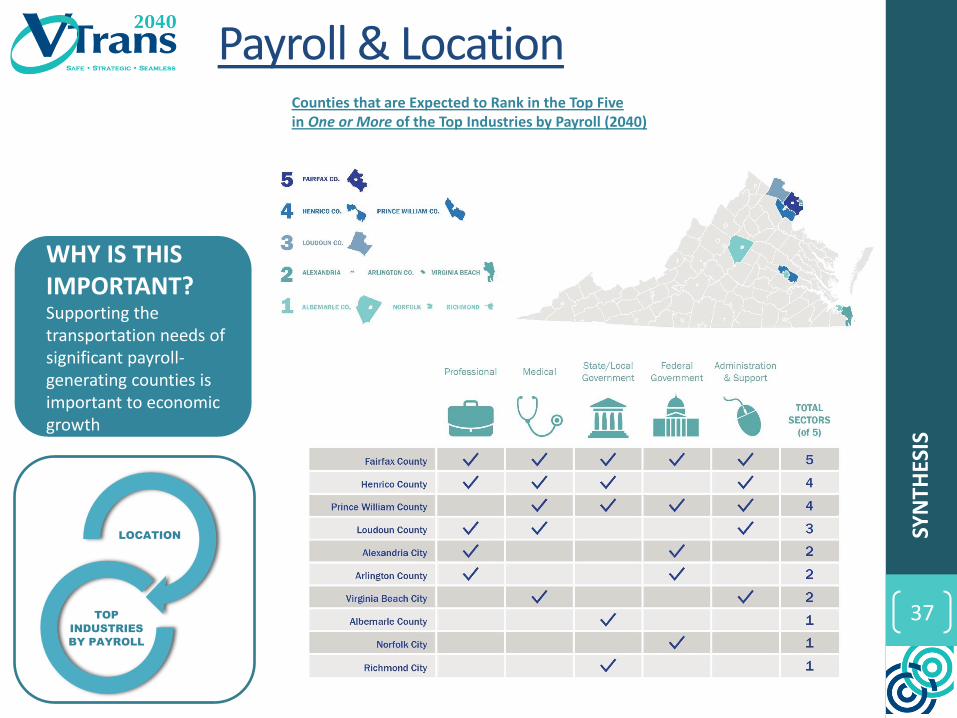
Payroll & Location
37
WHY IS THIS IMPORTANT? Supporting the transportation needs of significant payroll-generating counties is important to economic growth
LOCATION
TOP
INDUSTRIES
BY PAYROLL
Counties that are Expected to Rank in the Top Five in One or More of the Top Industries by Payroll (2040)
SYN
THES
IS

38
= approximately 1,000 people/square mile
Payroll & Density
Population Density: Counties with Top Industries by Payroll (2040)
POPULATION
DENSITY
COUNTIES
WITH TOP
INDUSTRIES
BY PAYROLL
WHY IS THIS IMPORTANT? Key economic sectors locate in higher-density jurisdictions
SYN
THES
IS

39
WHY IS THIS IMPORTANT?
Millenials may drive the higher wage-based knowledge and information economy in the future
Counties with Top Industries by Payroll in 2040
Highest Population of Millenials in 2040
Millenials & High Wage Areas
MILLENIALS
COUNTIES
WITH TOP
INDUSTRIES
BY PAYROLL
WHY IS THIS IMPORTANT? Millenials may drive the higher wage-based knowledge and information economy in the future
SYN
THES
IS

40 *On average (weighted by population), DVMT in the counties with top industries by payroll is 8% less (2.2 miles less) than DVMT statewide
Location & Travel
Travel Times & Per Capita Daily Vehicle Miles Traveled for Counties with Top Industries by Payroll. VDOT (2012), ACS (2012)
*On average (weighted by workers), travel times are 4% longer in the counties with top industries by payroll (roughly 80 seconds longer) than the statewide average. However, they are 15 minutes less than statewide average when Prince William County is excluded.
TRAVEL
TIME/ VMT
LOCATION
WHY IS THIS IMPORTANT? For Millenials: there was a 15% decline when comparing use of their car as today’s primary form of transportation (86%) versus in the future (71%). Source: APA Poll, 2014.
SYN
THES
IS

41
82.9% of Henrico County workers get to work in SOVs
15.0% of Prince William County workers carpool
25.2% of Arlington workers get to work using public transp.
4.4% of Richmond workers walk to work
4.0% of Richmond workers motorbike/bike to work
8.3% of Loudon County workers telecommute
Mode & Counties with Top Industries by Payroll
% Workers Taking Transit / % Workers Working from Home (2012)
Key Mode Share Stats for Counties with Top Industries by Payroll COUNTIES
WITH TOP
INDUSTRIES
BY PAYROLL
MODE
WHY IS THIS IMPORTANT? We need to understand the travel preferences of the high-payroll-industry workers to support future economic needs
SYN
THES
IS
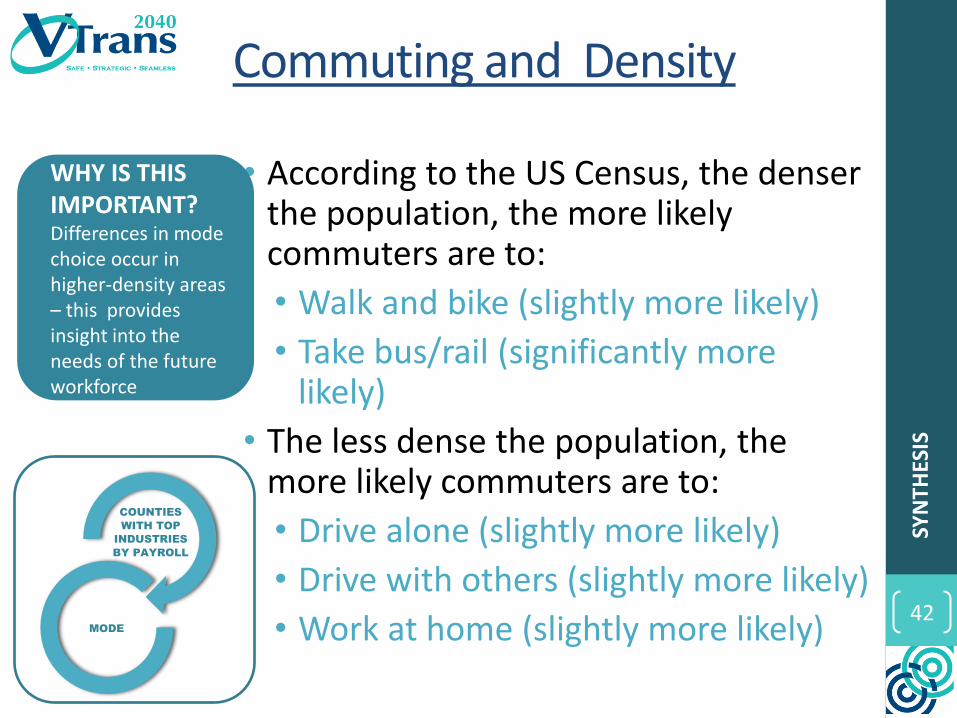
Commuting and Density
42
• According to the US Census, the denser the population, the more likely commuters are to:
• Walk and bike (slightly more likely)
• Take bus/rail (significantly more likely)
• The less dense the population, the more likely commuters are to:
• Drive alone (slightly more likely)
• Drive with others (slightly more likely)
• Work at home (slightly more likely)
COUNTIES
WITH TOP
INDUSTRIES
BY PAYROLL
MODE
SYN
THES
IS
WHY IS THIS IMPORTANT? Differences in mode choice occur in higher-density areas – this provides insight into the needs of the future workforce
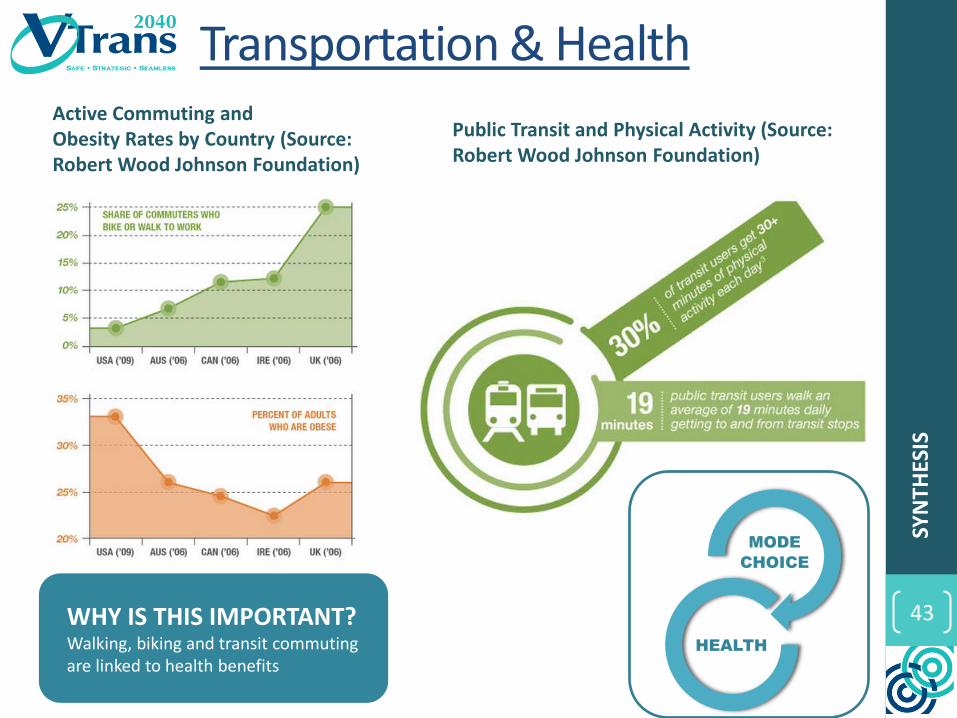
43
Transportation & Health Active Commuting and Obesity Rates by Country (Source: Robert Wood Johnson Foundation)
WHY IS THIS IMPORTANT? Walking, biking and transit commuting are linked to health benefits
Public Transit and Physical Activity (Source: Robert Wood Johnson Foundation)
MODE
CHOICE
HEALTH
SYN
THES
IS

44
Livable Communities
SYN
THES
IS
SOCIAL
LIFESTYLE
WOULD PREFER TO LIVE SOMEDAY IN A WALKABLE COMMUNITY, WHETHER AN URBAN, SUBURBAN, OR SMALL TOWN LOCATION.
56% OF MILLENIALS
46% ACTIVE BOOMERS
Only 8% of Millenials and
7% of Active Boomers prefer living if they can afford it in a suburb that requires driving to most places.
Source: “Investing in Place.” American Planning Association (APA), 2014.

DISCUSSION 45

46
How Trends fit in the Process
DIS
CU
SSIO
N

What do you say?
• Are there other trends that may shape transportation outcomes in the future?
• What trends do you think will have the biggest impacts on transportation in Virginia’s future, and how?
47
DIS
CU
SSIO
N

Your Input
WHAT DO YOU SAY?
What’s Missing? What’s Significant?
What’s Missing? What’s Significant?
What’s Missing? What’s Significant?
What’s Missing? What’s Significant?
What’s Missing? What’s Significant?
DEMOGRAPHIC / SOCIAL
ECONOMIC
TECHNOLOGICAL
ENVIRONMENTAL
A
B SYNTHESIS
DIS
CU
SSIO
N
WORKSHOP 49

Discussion Questions
1. What does this goal mean to you/your agency?
2. What are the most important ways to accomplish this goal from your agency perspective and in light of the future trends we just discussed?
50

Safety & Security
51

System Maintenance & Preservation
52
Mobility, Connectivity and Accessibility
53

Environmental Stewardship
54
Economic Vitality
55

Coordination of Transportation & Land Use
56

Program Delivery
57


