

1
Voluntary Non-financial Disclosure, Corporate Governance, and Investment Efficiency
Jean J. Chen
School of Management, University of Southampton, Southampton SO17 1BJ, 7XH
UK
Tel: +44 (023)80597256
Email: [email protected]
Xinsheng Cheng
Research Centre for Corporate Governance, Nankai Business School
Nankai University, China
Email: [email protected]
Stephen X. Gong
School of Accounting and Finance
Faculty of Business
Hong Kong Polytechnic University
Hong Kong
Email: [email protected]
Youchao Tan
Department of Accounting, Southwestern University of Finance and Economics
Chengdu, China
Email: [email protected]
Acknowledgements: This project is supported by the National Natural Science Foundation of
China (ID: 71132001) and the Programme for Changjiang Scholars and Innovative Research Team in
Nankai University (PCSIRT). Partial financial support is provided by the Research Grants Council of
the HKSAR (PolyU 5922/13H). We thank participants at the American Accounting Association
Annual Conference 2014 (especially the Discussant) for constructive comments. The usual disclaimer
applies.

2
Voluntary Non-financial Disclosure, Corporate Governance, and Investment Efficiency
Abstract:
Different from prior studies that typically use rough proxies for accounting information quality, we
construct a direct measure of voluntary disclosure of non-financial information pertaining specifically to
firm’s current and planned investments. We then study the effects of voluntary non-financial disclosure
(NF) on investment efficiency. Based on a sample of 1029 China-listed firms during 2007-2011, we find
that NF is not associated with investment efficiency for weak corporate governance firms. However, for
strong corporate governance firms we find that NF can mitigate over- and under-investment.
Cross-sectional analysis indicates that while the impact of NF on investment efficiency is higher for
state-owned enterprises (SOEs) than non-SOEs, corporate governance has a stronger moderating effect on
the association between NF and investment efficiency for non-SOEs than SOEs. The moderating role of
corporate governance in the association between NF and investment efficiency is similar between firms
headquartered in high-marketization regions and those in low-marketization regions. These results are
robust to controls for potential endogeneity and alternative measurement of the key variables. Our
evidence suggests that good corporate governance enhances the credibility of voluntary non-financial
disclosure, and, by doing so, contributes to investment efficiency.
Keywords: Non-financial information; voluntary disclosure; corporate governance; investment efficiency;
China.

3
Voluntary Non-financial Disclosure, Corporate Governance, and Investment Efficiency
1. INTRODUCTION
A fundamental question in economics and finance is the optimal allocation of scarce
resources. In frictionless capital markets, a firm's investment policy is solely dependent on its
investment opportunities, and funds are allocated in such a way that the marginal return to
investment projects is equated across every available project in the economy (Modigliani and
Miller, 1958). At the firm level, this means that a firm obtains financing for all positive net
present value projects at the prevailing cost of capital and continues to invest until the
marginal benefit of investment equals the marginal cost (Chen et al., 2011b). However, in the
real world firms deviate from this optimal investment behavior due to various frictions.
Information asymmetry and agency problems are two such frictions (Stein, 2003). As an
important type of firm-specific information, financial disclosure has the potential to
significantly reduce information asymmetry and agency problems and consequently improve
investment efficiency (Bushman and Smith, 2001; Healy and Palepu, 2001; Lambert et al.,
2007; Biddle et al., 2009).
However, due to recognition and measurement problems in accounting, financial
information is mainly backward-looking, and often lacks relevance and timeliness. As such,
financial information contained in traditional financial statements cannot capture some
important information that investors need in order to better understand firms’ current situation
and future prospects. In recent years researchers have increasingly recognized the
value-relevance of non-financial information (e.g., Amir and Lev, 1996; Ittner and Larcker
1998; Gelb, 2002; Orens et al., 2010; Simpson, 2010; Dhaliwal et al., 2011, 2012).1 Not only
is the use of non-financial information recognized in business practices such as the balanced
scorecard framework (Kaplan and Norton, 1996); it is also reommended by the Jenkins
Comittee commissioned by the American Institute of Certified Public Accountants (Robb et
al., 2001). Nowadays securities regulators worldwide have amended or issued various rules
1 Financial disclosures consist of those items of information which are quantifiable in monetary amounts. Non-financial
disclosures are either (1) narrative descriptions, facts, or opinions that do not readily lend themselves to quantification in
monetary terms, or (2) items of information quantified in something other than money (Gernon and Meek, 2001).
4
and guidelines to encourage voluntary non-finacial disclosures.2
Unlike financial information, voluntary disclosure of non-financial information is usually
unregulated. As a result, managers have great discretion regarding what information to
disclose, and how such information is presented. While such discretion allows managers to
convey relevant information to outsiders in a more timely and flexible manner, it also gives
rise to opportunistic disclosure which limits its usefulness and which may even mislead
investors (Lang and Lundholm, 2000; García Osma and Guillamón-Saorín, 2011).3 Depsite
some evidence that non-financial disclosure may reduce cost of capital (Orens et al., 2010)
and improve the quality of analysts’ earnings forecasts (Vanstraelen et al., 2003), much of the
evidence is limited to the developed markets (Continental Europe and North America), where
strong institutions enhance the credibility of the non-financial disclosures, thereby making
them potentially useful to investors.4 To the best of our knowledge, there is little empirical
evidence, either in the developed or the emerging markets, on whether the investment
efficiency of listed firms is affected by the quantity and/or quality of voluntary non-financial
disclosure, and whether this relationship depends on the effectiveness of firm-level corporate
governance. We aim to fill this literature gap by studying the association between firm-level
investment efficiency and voluntary non-financial disclosure pertaining to ongoing and
planned investment projects in China’s market setting. The focus on China is motivated both
by the lack of relevant studies in this largest emerging economy, and because the institutional
features of China (e.g., state ownership of the majority of the listed firms, and weak investor
protection) make it an interesting research setting. The evidence from our study contributes to
the general accounting literature on the real effects of voluntry non-financial disclosure, and
2 The SEC recently amended the “Safe Harbor Rules” and Private Securities Litigation Reform Act (PSLRA) to encourage
the disclosure of forward-looking non-financial information and limit frivolous securities lawsuits. Securities regulators in
the UK and Canada also encourage the disclosure of forward-looking information in the financial statements. In China,
regulators and other stakeholders increasingly encourage non-financial information disclosure; see Zhong et al. (2011).
3 Even when they are not opportunistic, increased quantity and timeliness of voluntary disclosures are not without concerns.
Timely voluntary disclosure of information by companies sometimes results in erroneous disclosure that must later be
retracted and/or corrected. Tan & Koonce (2011) present experimental evidence on the adverse consequences of retractions
and corrections of management earnings forecasts.
4 Oren et al. (2010) argue and show that since institutional differences affect the quality of mandatory financial information,
the association between voluntary non-financial disclosure and a firm’s cost of capital also differs across countries.

5
offers policy implications useful to other emerging as well as developed economies.
The China Securities and Regulatory Commission (CSRC) requires listed companies to
disclose non-financial information about current and new investment projects. However, the
companies are given much discretion as to how much information to provide, and how
detailed such disclosures should be. As such, disclosure of non-financial information about
ongoing and planned investments largely falls into the realm of voluntary disclosure (Chen et
al., 2014). Regarding the motives for and consequences of voluntary disclosure, two schools
of thought emerge from the extant literature (Healy and Palepu, 2001), based primarily on the
Anglo-Saxon markets. In one view (the “information perspective”), firms proactively disclose
high-quality information so as to mitigate information asymmetry and financing constraints
and consequently lower the cost of capital (Grossman and Hart, 1980;Grossman, 1981;
Milgrom, 1981; Hughes, 1986; Botoson, 1997; Bozzolan et al., 2009). Another view (the
“opportunistic perspective” or “impression management”) holds that managers attempt to
influence investor perceptions for their private benefit by voluntarily disclosing misleading
information (Lang and Lundholm, 2000; Jo and Kim, 2007; Merkl-Davies and Brennan, 2007;
Kothari et al., 2009; Li, 2008, 2010). Although there is evidence that the potential for
voluntary non-financial disclosure to mislead investors is constrained by strong investor
protection and sophisticated investors/intermediaries in the Anglo-Saxon markets, such
counteracting forces are considerably weaker in emerging markets, such as China, due to
weaker institutional and market environments. Therefore, we expect that the opportunistic
perspective is likely to prevail in emerging markets owning to their generally lax legal and
regulatory frameworks, under-developed market intermediaries, and unsophisticated (retail)
investors.
Existing research provides evidence on the monitoring and disciplining role of
governance mechanisms, in particular highlighting the role of boards of directors, in
facilitating and improving the control exerted over senior managers and ensuring that
management acts in the interest of investors (Dechow et al., 1996; Ajinkya et al., 2005;
Karamanou and Vafeas, 2005; Ahmed and Duellman, 2007; García Osma and
Guillamón-Saorín, 2011). In China’s market setting, there is some evidence that strong
corporate governance is effective in constraining managerial opportunism and protecting
6
investors (Liu and Lu, 2007; Lo et al., 2010; Firth et al., 2011; Chen and Zhang, 2014).
However, most of the existing evidence concerns the relationship between corporate
governance and quality of financial information, which, other than being regulated, is
generally verifiable and thus relatively more difficult or costly to manipulate. By contrast,
non-financial disclosure is unregulated, and allows greater discretion and flexibility. To the
extent that strong corporate governance limits managerial opportunism and enhances the
credibility of voluntary non-financial disclosure about ongoing and planned investment
projects, we expect that such disclosure may contribute positively to investment efficiency by
aiding project selection and monitoring of managers/insiders.
Using a sample of 1029 A-share firms listed in the Shanghai and Shenzhen Stock
Exchanges during 2007-2011, we find that the extent of voluntary disclosure of non-financial
information about ongoing and planned investment projects is on average not associated with
investment efficiency for weak corporate governance firms. However, voluntary
non-financial disclosure is associated with significantly higher investment efficiency for
strong corporate governance firms. Since we control for corporate governance in all the
regressions, and since corporate governance and non-financial disclosure are only weakly
correlated (their correlation coefficient ranges from 0.03 to 0.05), the strong evidence on the
interaction effect cannot be attributed to non-financial disclosure acting as a proxy for
corporate governance. Instead, the interaction effect indicates that non-financial disclosure
has an incremental effect on investment efficiency, but the effect is significant only when a
firm has strong corporate governance. We argue that this occurs because strong corporate
governance enhances the credibility and thus value-relevance of non-financial disclosure
(García Osma and Guillamón-Saorín, 2011; Wang and Hussainey, 2013).
Cross-sectional analysis indicates that while the impact of non-financial disclosure on
investment efficiency is higher for state-owned enterprises (SOEs) than non-SOEs, the
moderating effect of good governance on the relation between investment efficiency and
voluntary non-financial disclosure is stronger for non-SOEs than SOEs. This finding is
explained by the fact that, compared with SOEs which are often given preferential treatment
by the government, non-SOEs in general face greater financial constraints, and thus have
stronger incentives to engage in opportunistic disclosure in order to access market resources.
7
As a result, in non-SOEs strong corporate governance plays a more important role in
constraining opportunistic disclosure and enhancing the credibility and usefulness of
voluntary non-financial disclosure. In contrast, we find the moderating role of corporate
governance in the non-financial disclosure-investment efficiency relation to be equally strong
for firms headquartered in high-marketization regions, and for those headquartered in
low-marketization regions. This suggests that internal corporate governance positively
impacts investment efficiency irrespective of the stage of regional economic development.
The results are robust to controls for endogeneity in the voluntary disclosure and investment
decisions, and to alternative measurement of the key variables. Taken together, the evidence
suggests that in China’s emerging stock market, strong corporate governance enhances the
credibility of voluntary non-financial disclosure, and, by doing so, improves investment
efficiency.
We contribute to the literature in several ways. Firstly, our results for China, based on a
content analysis of voluntary non-financial disclosure pertaining to ongoing and planned
investment projects, complements and supplemens prior studies (mainly in developed
markets) which suggest that non-financial disclosure is value-relevant and useful (Amir and
Lev, 1996; Vanstraelen et al., 2003; Orens et al., 2010; Dhaliwal et al., 2011). Secondly, we
extend that strand of accounting literature by showing that voluntary non-financial
disclosure has the potential to mitigate over- and under-investment, but such potential
depends on whether firm-level corporate governance is able to constrain information
manipulation and enhance the credibility of such disclosure (García Osma and
Guillamón-Saorín, 2011; Wang and Hussainey, 2013). In situations where voluntary
non-financial disclosure is not constrained by strong corporate governance and thus is more
likely to be opportunistic, such disclosure does not help improve investment efficiency.
Although the importance of the credibility of voluntary disclosure in resource allocation has
been well recognized in the litertaure (e.g., Healy and Palepu, 2001), we are among the first
to examine this issue in the specific context of firm-level investment efficiency. In addition,
while prior studies (e.g., Hope and Thomas, 2008; Biddle et al., 2009; Shroff et al., 2014)
have examined the usefulness of financial disclosure (e.g., the role of financial disclosures in
monitoring managers; the effect of aggregate financial reporting quality on investment

8
efficiency) using rough proxies for the information environment or financial reporting
quality, our study focuses on voluntary non-financial disclosure pertaining specifically to
investment projects, which represent one major source of value creation (McConnell and
Muscarella, 1985; Chung et al., 1998). Doing so has the advantage of illuminating the likely
mechanisms through which such disclosure may affect investment efficiency.5 Lastly, we
contribute to the corporate governance literature by providing evidence that strong
firm-level corporate governance to some extent can substitute for weak country-level
investor protection in terms of promoting transparency and truth-telling, and improving
investment efficiency. The positive effect of strong corporate governance on investment
efficiency we document for China corroborates, and extends the findings in prior studies
which suggest that corporate governance, broadly construed, impacts firms’ information
disclosure quality (García Osma and Guillamón-Saorín, 2011; Wang and Hussainey, 2013),
and affects stock price efficiency and capital allocation (Morck et al., 2000; Wurgler, 2000;
Durnev et al., 2004). The evidence has implications for regulators, managers and investors
alike.
Section 2 reviews the literature on corporate information disclosures, introduces China’s
institutional background, and presents the predictions. Section 3 describes the sample
selection, variable measurement and testing method. Section 4 presents and discusses the
empirical results. The final section provides a summary and concludes.
2. BACKGROUND AND RESEARCH QUESTION
(i) Value-relevance of corporate information disclosure
5 Firms’ investment decision-making process cannot be directly observed, and thus it is difficult, if not impossible, to say
definitively whether and how more and better information actually mitigates investment efficiency. Most previous studies
measure accounting or financial reporting quality using rough proxies. For example, Shroff et al. (2014) derive proxies for
the transparency of the external information environment based on analyst coverage, press coverage, and earnings
transparency. They show that this measure of information quality improves firm-level investment efficiency (which they
proxy using measures similar to ours in nature), based on the assumption that a better information environment reduces
information asymmetries and improves the investment decision-making processes. Like previous studies, we must base our
inference on the presumed channel/mechanism of influence that high quality information reduces information asymmetry
and enhances monitoring. However, compared to past studies, our measure of non-financial disclosure is based on
information pertaining specifically to firms’ current and planned future investments, and thus the likely impact of such
disclosures on investment efficiency appear to be more direct.

9
Studies of the relationship between information disclosure and investment efficiency
start from examining the role of financial disclosure. Bushman and Smith (2001) and Healy
and Palepu (2001) amongst others argue that high-quality financial information potentially
contributes to investment efficiency in at least three ways. First, financial accounting
information of firms and their competitors helps managers and investors identify and
distinguish between good and bad investment opportunities (project identification). This
leads directly to the more accurate allocation of capital by investors and managers to their
highest valued uses. In addition, the lower estimation risk perceived by investors will likely
reduce the cost of capital, which may further contribute to investment efficiency (Botosan,
1997; Francis et al., 2008; Cheynel, 2013). Second, financial accounting information is a
direct input to corporate control mechanisms designed to discipline (via monitoring)
managers to guide resources towards good projects and away from bad projects, and to
prevent managers from expropriating the wealth of investors. Finally, firms’ pre-commitment
to the timely disclosure of high-quality financial information reduces investors’ risk of loss
from trading with more informed investors, thereby attracting more funds in the capital
markets, which, in turn, lowers investors’ liquidity and risk and improves firms’ operating
decisions (Fama and Laffer, 1971; Diamond and Verrecchia, 1991; Baiman and Verrecchia,
1996; Verrecchia, 2001). These theoretical arguments are supported by substantial empirical
evidence (e.g., Verdi, 2006; Biddle and Hilary, 2006; McNichols and Stubben, 2008; Kedia
and Philippon, 2009; Biddle et al., 2009; Bushman et al., 2011).
In addition to financial information, investors are also concerned about non-financial
information. Although non-financial information, such as intangible assets, is important in
the value creation processes of firms, financial reporting standards largely fail to recognize
such information in the financial statements (Gu and Wang, 2005). Consequently, investors,
financial analysts and other stakeholders need to rely on non-financial information in order
to assess a firm’s future cash flows and value creation (Orens et al., 2010). Indeed, a
plethora of studies find that non-financial information plays an important role in the capital
markets, in particular in relation to valuation, similar to the role of financial information.
Amir and Lev (1996) examine the value relevance of non-financial information of
independent cellular companies in the US. They find that non-financial indicators, such as

10
POPS (a growth proxy) and Market Penetration (an operating performance measure), are
highly value-relevant. Focusing on US-listed firms, Brazel et al. (2009) examine whether
auditors can effectively use non-financial measures (NFMs, such as the number of retail
outlets, warehouse space, or employee head counts) to assess the reasonableness of financial
performance and, thereby, help detect financial statement fraud. Their results suggest that
NFMs can be effectively used to assess fraud risk. Dhaliwal et al. (2012) examine the
relationship between disclosure of non-financial information and analyst forecast accuracy
in 31 countries. Using the issuance of stand-alone corporate social responsibility (CSR)
reports to proxy for disclosure of non-financial information, they find that the issuance of
stand-alone CSR reports is associated with lower analyst forecast error. Focusing on three
European countries, Vanstraelen et al. (2003) find that higher levels of forward-looking
non-financial disclosures are associated with lower dispersion and higher accuracy in
financial analysts’ earnings forecasts. Using a large-scale sample of UK FTSE All-Share
companies, Wang and Hussain (2013) find that forward-looking statements of well-governed
firms improve the stock market’s ability to anticipate future earnings.
One important type of non-financial disclosure is information about firms’ investment
projects, including current and planned investments. As discussed previously, such disclosure
falls into the realm of voluntary disclosure, at least in China, and the usefulness of voluntary
non-financial disclosure, and hence its potential impact on investment efficiency, hinges
critically on the credibility as well as the amount and content of the disclosure. We next
discuss this within China’s specific market setting.
(ii) China’s institutional, regulatory and market environments
China’s capital markets have developed rapidly since the 1990s, marked by the
establishment of two stock exchanges and the (partial) privatization of SOEs through public
listing. However, compared with the developed economies, China’s capital markets are still
immature, due to incomplete legislation and an inefficient regulatory framework. Allen et al.
(2005) compare China’s legal system with the 49 countries studied in La Porta et al. (1999)
and find that, in the code of law on paper, China falls between the English-origin countries
and French-origin countries in terms of investor protection. However, in terms of actual law

11
enforcement, China’s measures are significantly below all average measures of the LLS
sample countries, regardless of their legal origins. China’s weak institutions and information
environment make it difficult to detect disclosure violations by listed firms, punish
management opportunistic behavior, such as false or misleading financial disclosures, and
protect minority shareholders’ interest (Piotroski and Wong, 2011; Cheng et al., 2011).
In terms of the regulatory framework, China’s property rights system and institutional
reality make “regulatory capture” more likely (Shleifer, 2005). The majority of China’s listed
firms are SOEs, and the government plays the dual role of being the controlling shareholder
and the regulator (Clarke, 2003; Firth et al., 2006; Firth et al., 2013). The government wants
the firms it owns to be run efficiently, but not solely for the purpose of wealth maximization
(Liu and Lu, 2007). In fact, the government also has other objectives, such as the
maintenance of employment levels, direct control over sensitive industries, or politically
motivated appointments (Clarke, 2003; Liu and Lu, 2007). As a result, many SOEs are
charged with many social functions. To prop up failing SOEs, the government often has to
protect and bail them out (Lin and Li, 2004). Due to government intervention and political
influences, SOEs often suffer from investment inefficiency (Cheng et al., 2011) and
suboptimal financial performance (Sun and Tong, 2003; Fan et al., 2007). However, the
extent to which investment efficiency is enhanced by the quantity and/or quality of voluntary
non-financial disclosure, and whether the relationship varies between SOEs and non-SOEs
has not been systematically examined.
Currently, regulatory sanctions for misleading/false information disclosure are governed
primarily by Notice on Accepting Civil Tort Cases Involving False Information Disclosure in
the Securities Market (hereafter, Notice), issued by the High Court in 2002, and by
Stipulations Regarding the Acceptance of Civil Litigation Cases Arising from False
Information Disclosure in the Securities Market (hereafter, Stipulations), issued by the High
Court in 2003. To further improve the quality of information disclosure and to be consistent
with the new Company Law and Securities Law, the CSRC released in 2007 the Regulations
on Information Disclosure of Listed Companies, which clearly specifies the disclosure
contents in periodical reports, set particular rules for the disclosure of incidents in ad hoc

12
reports, and stipulates the punishments on the violation of disclosure rules.6 Although these
regulations provide a legal basis and judicial guidance for the acceptance and handling of
cases involving misleading or false information disclosures in the securities market, there
exist many practical problems in the actual implementation.
First, it is very difficult to establish causation between false disclosures and the losses
sustained. In practice, many listed companies have managed to lower or be exonerated from
legal liability on the ground of systemic risk or factors beyond their control.
Second, there is uncertainty about how to establish the discovery date for false
disclosure. According to Article 20.2 of the Stipulations, “The discovery date of false
disclosure shall be the date on which the false disclosure was first publicized on national
newspapers, periodicals, radio, or television etc.” However, because many media are likely to
be involved, it would be difficult for investors to decide whether and when the false
disclosure was first exposed to the public. In actual practice, the listed firms being accused
often managed to limit their damages paid by citing a large number of media reports and
arguing that the false disclosure had already been publicized before the announcement of
investigation by CSRC.
Third, the burden of proof imposed on the plaintiff has the effect of increasing the costs
of protecting minority shareholder right owning to their information disadvantage. Even if
successful, minority shareholders only get compensated for the actual damages suffered, and
the listed firm does not suffer punitive damages.7 Furthermore, due to historical and other
reasons, regulatory bodies in China often recruit from brokerage firms and fund houses. The
cooperative relationship between regulators and industry practitioners has the effect of
hindering the achievement of the regulatory objectives (Yue and Wang, 2006).
It is thus apparent that China’s existing legal framework has only a limited deterrence
effect on misleading or false disclosures, with the result that managers are faced with
relatively low risks (both ex ante and ex post) of being punished for opportunistic or false
6 For details on the evolution and current status of China’s corporate governance system and disclosure practices, see
Standard & Poor’s (2009a, b), Zhong et al. (2011), Chen and Gong (2012), Leung and Cheng (2013), and Lan et al. (2013).
7 In the famous ST Jiabao case, six shareholders only received a total compensation of 6.1973 million yuan, which
represents a mere 32.28% of the losses suffered.
13
disclosures, a problem that may be particularly severe among poorly governed firms,
especially financially constrained non-SOEs that need external financing for new
investments.
China embarked on corporate governance reforms at the beginning of the 2000s with the
aim of enhancing minority shareholders’ protection against expropriation by controlling
shareholders. The Guidance on Establishing Independent Directors for Listed Companies
was issued in 2001. This was followed by implementation of the Code of Corporate
Governance for Listed Companies in China in 2002, and of the new Company Law in 2006
(Chen and Gong, 2012). Over the past decade China has established a corporate governance
system centered on the board of directors. The continuous improvement in China’s corporate
governance system and investor protection was recognized by Standard & Poor’s (2009a)
Country Governance Study–Corporate Governance in China. Empirical studies suggest that
improvement in China’s corporate governance system has played a positive role in
constraining managerial opportunism and protecting investors’ rights. For example, Chen et
al. (2006) find that among the sample of 169 firms sanctioned by CSRC for financial frauds
during 1999-2003, firms with a large proportion of outside directors commit less fraud. This
is attributed to outside directors monitoring a firm’s actions and helping deter fraud. Lo et al.
(2010) find that strong corporate governance firms (e.g., those with a board that has a higher
percentage of independent directors, or those without CEO duality) are less likely to engage
in transfer pricing manipulations. Using data from 447 firms representing 3129 firm-year
observations during 2000-2006, Chen and Zhang (2014) find that earnings management is
curbed through the introduction of independent non-executive directors on the board and the
audit committee and accounting/financial experts sitting on the audit committee.
(iii) Voluntary non-financial disclosure, corporate governance and investment efficiency
The discussions above suggest that the ability of corporate voluntary disclosures to
mitigate the adverse effects of information asymmetries between managers/insiders and
outsider investors depends critically on the credibility and value-relevance of the disclosure.
Voluntary non-financial disclosure pertaining to ongoing and planned investment projects
potentially overcomes the backward-looking nature of financial disclosures, and thus may

14
contribute positively to investment efficiency by aiding project selection and monitoring of
managers/insiders. However, a plethora of studies show that managers/insiders may mislead
outside investors by intentionally disclosing false information (Healy and Palepu, 2001; Lang
and Lundholm, 2000; Jo and Kim, 2007; Li, 2008, 2010). Such a problem can become even
more serious in developing countries, such as China, where lax regulation and ineffective law
enforcement make it difficult to deter, detect and punish misleading or false information
disclosures (Piotroski and Wong, 2011). It is not uncommon in China for companies to be
quick to release good news, and slow to release bad news. Some even intentionally release
unreliable or misleading information in the hopes of pumping up selective publicity (He,
2003).8 Tang et al. (2008) find that in China, managers extract private benefits of control by
packaging and making their information disclosures appear more reliable and timely. Thus,
there is at least anecdotal evidence in China that voluntary disclosures are likely opportunistic,
and hence are of low credibility/quality.
Low-quality (i.e. self-serving and misleading) non-financial disclosure may lead to
adverse economic consequences. For example, unsophisticated credulous investors may not
properly discount the reliability of such disclosures.9 Reliance on positive publicity or false
disclosures may lead to under-estimation of firm’s risk, and over-estimation of project future
cash flows and firm value. The result may be lower cost of capital and capital misallocation,
such that high productivity firms are denied scarce resources while low productivity firms
obtain financing for low-quality projects. These tend to distort investment efficiency.
As an important investor protection mechanism, corporate governance can limit
managerial misbehavior, influence corporate information quality, and improve investment
efficiency, by providing an architecture of accountability. Corporate governance encompasses
all of the provisions and mechanisms aimed at ensuring that the assets of the
firm are managed efficiently and in the interests of the providers of finance (Shleifer
and Vishny, 1997). A growing body of literature examines whether various internal
8 The lack of an independent press in China makes it difficult for investors and other stakeholders to detect and punish
misleading information disclosures (Gong et al., 2012, 2013; Jin et al., 2014).
9 In the well-publicized case involving Hangxiaoganggou in 2007, the firm disclosed only favorable information about its
housing projects in Angola amounting to 34 billion yuan, but was silent about the possible risks involved.
15
governance mechanisms are effective in controlling opportunistic managerial behaviour
(Beasley, 1996; Xie et al., 2003). The results from this literature highlight the importance of
corporate boards in ensuring that managers act in the interest of investors. Another body of
recent work views corporate governance in a broader light, as encompassing a number of
internal and external mechanisms that, jointly, lessen managerial ability to extract rents or
bias information (e.g., Bertrand and Mullainathan, 2003; Davila and Penalva, 2006; Gompers
et al., 2003).
There is broad empirical support, both within China (e.g., Bai et al. 2004; Liu and Lu,
2007; Chen and Zhang, 2014) and in other countries, for the proposition that strong corporate
governance plays a positive role in affecting economic and corporate outcomes. In a recent
study using Spain data, García Osma and Guillamón-Saorín (2011) find that strong
governance limits impression management, consistent with governance monitoring
effectively reducing self-serving disclosures by management. However, to date there is no
direct empirical evidence on the issue of whether and how corporate governance impacts the
quality of voluntary non-financial disclosure and consequently investment efficiency. We
predict that strong corporate governance mechanisms reduce information manipulation and
increase the reliability and relevance of the information voluntarily disclosed. This is
achieved by strong corporate governance monitoring firm communication strategy to reduce
biases in the preparation, presentation and dissemination of information, and thus reducing
the potential for erroneous decision making by outsiders (García Osma and Guillamón-Saorín,
2011). As a result of higher quality (i.e., more reliable/relevant/credible) non-financial
disclosures pertaining to ongoing and planned investment projects, we predict that outside
investors will be able to more accurately estimate the firm’s future revenues, performance and
hence value creation, such that capital will be channeled into higher quality (more efficient)
firms/projects, and away from lower quality firms/projects. We test the following hypothesis:
H1: Strong corporate governance is associated with more credible voluntary
non-financial disclosure and hence higher investment efficiency.
It is now well established that ownership type/control, through its impact on corporate
governance, is associated with firm value and performance in China. Xu and Wang (1997)
using 1993, 1994 and 1995 data finds that there is a relationship between ownership structure
16
and corporate performance, confirming the positive role of institutional investors and the
negative role of state shareholding. Using a sample of 434 manufacturing firms listed on the
Chinese stock exchange in 1997, Chen (2001) find a strong relation between ownership
concentration and corporate performance, measured by Tobin's Q. A further classification of
owners reveals that while shares held by state play a negative role in corporate governance,
domestic institutional and managerial shareholdings improve the firms' performance. A study
by the Shanghai Stock Exchange (2006) found that the corporate governance mechanisms of
central SOEs are better than those of local SOEs, because the largest shareholders of the
former do not have strong incentives to expropriate profits and the central government, as the
ultimate shareholder, has implemented restrictions on the activities of the largest shareholders.
In contrast, the largest shareholders of local SOEs usually engage in tunnelling and other
forms of expropriation. Chen et al. (2009) argue that because different types of owners in
China’s listed firms have different objectives and motivations, this will affect how they
exercise their control rights over the firms they invest in, and in turn the relative efficiency of
these firms. Their empirical results indicate that the operating efficiency (measured by return
on assets, cash flow return on assets, return on sales, productivity, and Tobin’s Q) of Chinese
listed companies varies across the type of controlling shareholder: SOEs controlled by the
central government perform best, firms controlled by State Asset Management Bureaus and
private firms perform worst, and SOEs controlled by local governments are in the middle.
Some previous studies (e.g. Cheung et al. 2010) find a positive association between the level
of corporate governance (as opposed to ownership type, though the two are likely to be
strongly correlated) and firm value. More recently, Cheng et al. (2011) and Chen et al. (2011b)
find that SOEs have weaker investment efficiency than non-SOEs.
None of the aforesaid prior studies have examined the role of corporate governance in
moderating the association between non-financial disclosure and investment efficiency, and
how this varies between SOEs and non-SOEs. Because most prior research suggests a
negative effect of state ownership on firm performance in China, and given prior findings of a
negative association between ownership type/concentration and corporate governance quality,
we expect ownership type and, relatedly, corporate governance to impact the role of
voluntary non-financial disclosure in affecting investment efficiency.

17
Specifically, regarding the impact of state ownership on the motives for and effects of
voluntary disclosure, the literature suggests two possibilities. On the one hand, the
institutional environment in China favors SOEs over non-SOEs (Berkman et al., 2010), with
large SOEs often given preferential treatment in terms of access to bank loans, tax cuts,
award of contracts, direct government subsidies, and even bias in the judicial process (e.g.,
Sun and Tong, 2003; China Securities and Regulatory Commission, 2009; Firth et al., 2011).
Given such special treatment, especially easy access to capital, SOEs tend to have lower
incentives to engage in manipulation of non-financial disclosure. In contrast, non-SOEs
(firms owned/controlled by non-state entities or individuals) have relatively limited resources
(Yiu et al., 2005). For example, non-SOEs in China are often discriminated against by the
state-owned banks (Li et al., 2012). Allen et al. (2005) suggest that, while non-SOEs account
for a larger share of production than SOEs in China, the amount of bank credit extended to
the former is much lower than that extended to the latter. Also, the banks’ lending decisions to
non-SOEs are made on a competitive basis, and the banks place more restrictions on
information reflecting profitability. Non-SOEs’ financial constraints and reliance on external
capital jointly create stronger incentives for them to manipulate voluntary non-financial
disclosure. This leads to the prediction that non-financial disclosure by non-SOEs is of lower
credibility/quality, and thus has a lower impact on investment efficiency on average. Among
such firms, however, strong corporate governance is expected to have a larger marginal
moderating effect on the role of non-financial information in mitigating investment
inefficiency.
On the other hand, it may be argued that the disclosure quality of SOEs is poorer than
that of non-SOEs. This belief is advanced on the following grounds: First, agency problem is
more serious in SOEs than in non-SOEs due to multiple interest conflicts, which, in turn,
increase information asymmetry and limit monitoring efficiency. Second, as Shleifer and
Vishny (1989) suggest, concentrated ownership can promote managerial self-dealing and
magnifies private control benefits. Thus, managers of SOEs are more likely to limit
information disclosure for the benefit of the controlling parties. This line of argument implies
that voluntary non-financial disclosure by SOEs is of lower quality and hence has a relatively
low impact on investment efficiency on average, and that corporate governance has a larger
18
marginal effect on the relation between non-financial disclosure and investment efficiency
within SOEs. Given these divergent predictions, we tentatively formulate our second
hypothesis as follows:
H2: The moderating role of corporate governance in the non-financial
disclosure-investment efficiency relation is stronger among non-SOEs than among SOEs.
One of the major contributions of this paper is to shed light on how variations in
firm-level corporate governance, both between SOEs and non-SOEs, and within each
ownership type, affect the role of non-financial disclosure pertaining specifically to
firm-level investments, in improving investment efficiency.
3. RESEARCH DESIGN AND SAMPLE DATA
(i) Sample selection
Our sample comprises all listed A-share companies in China during 2007-2011. We
choose this time period because China introduced a new accounting standard in 2007. The
change in accounting standard affects the comparability of the accounting data after 2007
with the accounting data in the earlier years.
The data sources include the China Centre for Economics Research (CCER) database,
the Nankai Corporate Governance Index for Chinese Listed Companies, and the China Stock
Market and Accounting Research (CSMAR) database. Following prior studies (e.g., Chen et
al., 2011b), we use non-financial Chinese firms listed on the Shanghai and Shenzhen stock
exchanges during 2007-2011 to construct our sample. We remove firms with missing data
and/or with abnormal observations. This gives us a total of 1029 firms per year, and a total of
5145 firm-year observations. We winsorize the continuous variables at the top 1% and
bottom 1% levels to mitigate the effects of outliers (all results are qualitatively similar
without winsorization).
(ii) Variable definition and measurement
Investment efficiency
The two key constructs in the analysis are investment efficiency and voluntary disclosure

19
of non-financial information (NF) in corporate reports (including annual reports and other
corporate disclosures) pertaining to planned and on-going investment projects. In a first
attempt to control for the interdependencies between firms’ disclosure and investment
decisions (Beyer and Guttman, 2012), we investigate how NF in the current year affects next
year’s investment efficiency.
Following prior research (e.g., Richardson, 2006; Biddle et al., 2009; Chen et al., 2011b),
we measure investment efficiency as deviations from expected investment using a model that
predicts investment as a function of growth opportunities. Thus, both under-investment
(negative deviations from expected investment) and over-investment (positive deviations
from expected investment) are considered inefficient investments. Specifically, we estimate a
parsimonious model for expected investment as a function of revenue growth (e.g.,
Modigliani and Miller, 1958; Hubbard, 1998; Chen et al., 2011b), and allow for differential
predictability for revenue increases and revenue decreases (McNichols and Stubben, 2008).
Operationally, we estimate the following piecewise linear regression model:
, 0 1 , 1 2 , 1 3 , 1 ,% *%i t i t i t i t i tInvest NEG REVGrowth NEG REVGrowth (1)
,i tInvest is defined as the sum of new investment in machinery, equipment, vehicles, land,
buildings, and research and development expenditures, less the sale of fixed assets, and scaled
by lagged total assets for firm i in year t; %REVGrowtht-1 is the annual revenue growth rate
for firm i in year t-1; and the indicator variable , 1i tNEG takes the value of 1 for negative
revenue growth, and 0 otherwise.
We estimate the investment model cross-sectionally with at least ten observations in each
CSRC level-one industry, based on the residuals of Equation (1), i.e., the deviations from the
predicted investment levels. As explained later, we use both the raw value and the absolute
value of the residuals to classify firms into over- and under-investment firms. Furthermore, to
mitigate measurement errors arising from possible misclassification of firm types based on
residuals, for robustness we also use decile ranks in place of residuals, and obtain
qualitatively similar results.
Voluntary disclosure of non-financial information (NF)

20
We focus on voluntarily disclosed non-financial information pertaining to planned and
on-going investment projects. Specifically, we start with the Nankai Corporate Governance
Index for Chinese Listed Companies database which contains detailed information
disclosures made by the listed firms. We compile a NF score based on the following
criteria/items.10
First, we count disclosures regarding the sources and cost of financing, and
use of the funds. Such information helps investors understand the firms’ investment projects
and their financing. Second, we count disclosures regarding the impact of the planned and
on-going investment projects on current and future performance. Such information helps
investors understand the expected returns on the investments. Third, we count disclosures
regarding investment risks and risk management strategy. Such information informs investors
about the risk profiles of the firms’ investments and the risk-return tradeoff faced by investors.
Appendix 1 lists the 18 indicators and describes the scoring method in greater detail.
Operationally, we compute NF as follows:
Nonfinancial disclosure score
Total number of nonfinancial disclos sN
rF
u e
Corporate governance index
Well-governed firms tend to disclose more information, and are likely to be more
efficient. To gauge the incremental effect of non-financial disclosure and the interaction effect
of non-financial disclosure and corporate governance on investment efficiency, it is necessary
to control for corporate governance as well as other determinants of investment efficiency.
Our measure of corporate governance follows Bai et al. (2004) and Chen et al. (2014) among
others which take into account China’s institutional setting. Specifically, we include the
10
We consider these disclosures to be voluntary disclosure for the following reasons. First, although CSRC requires timely
disclosure of information about major investment projects (e.g., risks, revenues and progress), up till 2011 CSRC did not
stipulate what constitutes major investment projects, effectively leaving this to be determined by management. Second,
while CSRC mandates the disclosure of project risks and expected return, no detailed guidelines have been issued regarding
actual implementation. Third, as a practical matter, we observe wide variations in firms’ non-financial disclosures pertaining
to investment projects. Such variations are not to be expected if the disclosures are mandatory. Our non-financial disclosure
items, whilst less comprehensive than those in Robb et al. (2001) or Orens et al. (2010), are deemed to be suitable for our
research question in that they allow investors and other stakeholders to assess a firm’s future cash flows and value creation
pertaining to investment projects.

21
following variables in constructing a corporate governance index.11
The first is the stake of
the largest shareholder, which measures both the largest shareholder’s interest in a company
and also the largest shareholder’s power on the board. Prior research (e.g., Bai et al., 2004;
Ding et al., 2007) finds evidence of a U-shaped relationship between ownership concentration
and firm performance in China. Thus we include the square of the largest shareholder’s
percentage ownership. We also include a dummy variable coded 1 if a firm has a parent
company, and 0 otherwise. This is because if the largest shareholder of a listed company is a
firm, the scope for tunneling is large because a company has more channels available than
does an individual, such as through related party transactions (Cheung et al., 2006; Jian and
Wong, 2010) or transfer pricing manipulation (Lo et al., 2010).
With respect to the board of directors, we include a dummy variable that equals 1 if CEO
duality exists and 0 if otherwise. The monitoring role of board of directors is compromised
when a CEO controls fully or partially the board. To measure the degree of outside control of
the board, we include the ratio of the number of directors who are not members of the
management team. If the board is dominated by members of the management team, we do not
expect it to play an effective monitoring role.
Regarding executive compensation, stock options are rare in China. Furthermore, the
information on executive pay is not complete and is often inaccessible. Hence, following Bai
et al. (2004) we define the top executives of the firm to be its CEO, the executive vice
presidents, the chairperson and the vice chairpersons of the board of directors. We take the
percentage of shares held by these top executives as a measure of their economic interests in
a company. The interests of the top managers are better aligned with the interests of
shareholders if they have a larger stake in the firm.
Turning to the external mechanisms, we measure the market for corporate control by the
concentration of shares in the hands of the second to the tenth largest shareholders. We take
11
García Osma and Guillamón-Saorín (2011) amongst others point out that multiple elements of corporate governance
jointly contribute to the strength of the overall governance system and limit managerial self-serving disclosures. By
computing a comprehensive corporate governance index, our paper differs from many prior China studies which categorize
firms based on type of ownership/control (e.g. SOE versus non-SOE, local SOE versus central SOE).

22
the natural logarithm of the sum of squares of the percentage shareholding by the 2nd to the
10th largest shareholders. This variable is expected to have a positive effect on corporate
governance and firm value.
While most Chinese listed companies issue only A-shares and are regulated uniformly by
Chinese jurisprudences, some companies have also issued H shares (traded on the Hong
Kong Stock Exchange) or B shares (foreign shares traded in the Shanghai or Shenzhen stock
exchange). Dual-listed companies are subject to stricter legal/disclosure rules. We follow Bai
et al. (2004) amongst others and include in our corporate governance index a dummy variable
that equals 1 if a company has H/B shares and 0 otherwise. In addition to the above seven
measures of corporate governance derived from conventional economic theory, we also
include a variable to indicate whether the controlling shareholder is the central or local
government. Prior studies find that a controlling government stakeholder can use the listed
company as a vehicle to achieve policy goals although they may conflict with shareholders’
interests, and may even expropriate minority shareholders (Bai et al., 2000; Cheung et al.,
2010; Berkman et al., 2010).
In addition to the above corporate governance variables, we also include several other
variables in our construction of corporate governance index that affect firms’ information
environment, including percentage of institutional ownership and the number of analysts
following the firm. To reduce the dimensionality of the individual corporate governance
mechanisms, we follow prior studies and construct a corporate governance index using the
principal component method.
Following prior studies (e.g., Verdi, 2006; Biddle and Hilary, 2006; Chen et al., 2011b),
we include additional firm-level variables to control for firm characteristics. We include a
cash flow variable (CFOt-1), defined as cash flow of the firm divided by its total asset at the
end of year t, to control the effect of firm’s cash flow. In order to control the effect of firm’s
size on over-investment behaviour, we include LN (ASSET)t-1,defined as the natural logarithm
of the book value of total assets at the end of year t-1. We also include firm’s revenue (REVt-1),
23
leverage (LEVt-1), earnings (ROEt-1) to control their effect on investment behaviour. Table 1
contains the variable definitions.
[Insert Table 1 here]
(iii) Baseline empirical model
To test our first hypothesis (H1), we first divide the sample firms into strong corporate
governance and weak corporate governance firms based on the median value of the corporate
governance index for each industry and year. We then estimate the following regression
model and test if the regression coefficient on NF is statistically different between the strong
governance and the weak governance groups:
0 1 1 2 3 11
4 1 5 1 6 1
t t tt
t t t t
LN ASSET LEV
REV ROE C
I N
O
F
F
NE F
(2)
INEFt denotes investment efficiency (over-investment, OVER, or under-investment,
UNDER), and NFt-1 denotes extent of voluntary non-financial disclosure. INEFt is alternately
measured as the raw value, and the absolute value of the residual, of the residual from
Equation (1).
Since corporate governance index is a continuous variable, we also test H1 by
examining the regression coefficient on the interaction term between corporate governance
index and NF:
0 1 1 2 1 3 1 1 4 1
5 1 6 1 7 1 8 1
*t t t t t t
t t t t t
LN ASINEF NF CG SET
LEV
NF
REV ROE CF
CG
O
(3)
INEFt denotes investment efficiency, CGt-1 denotes corporate governance index, and
NFt-1*CGt-1 denotes the interaction of CG and NF. A statistically significant coefficient on
NF*CG indicates that the effect of non-financial disclosure on investment efficiency depends
on the level of corporate governance, after controlling for other determinants of investment
efficiency (including corporate governance). Specifically, when the dependent variable is the
raw value of UNDER (OVER), a positive (negative) coefficient on NFt-1*CGt-1 indicates that
24
strong corporate governance mitigates under-investment (over-investment).12
Note that in
Equation (3), the partial effect of non-financial disclosure on investment efficiency is
captured by 1+3.
4. EMPIRICAL RESULTS
(i) Descriptive statistics
Panel A of Table 2 reports the time variation of voluntary non-financial disclosure (NF)
and new external financing (increase in total external financing, scaled by total asset at end of
the prior year) for the whole sample. There is no apparent time trend in either variable. At the
firm level, the first-order autocorrelation of NF is 0.2362 (untabulated), which is significant
at the 1% level. In the robustness check, we find a positive and statistically significant
association between voluntary non-financial disclosure and contemporaneous as well as next
year’s external financing. Together, these suggest that non-financial disclosure exhibits some
degree of ‘stickiness’, but increases when firms need to raise external financing.
Panel B and Panel C present the descriptive statistics of the key variables for the
over-investment and under-investment firms, respectively. A total of 3305 firm-observations
exhibit under-investment, compared with 1855 that exhibit over-investment. The mean
(median) of NF is 0.3399 (0.3125) for the under-investment group, whereas for the
over-investment group, the mean (median) is 0.3474 (0.3750). Thus, overall Chinese listed
firms seem to voluntarily disclose only a limited amount of non-financial information.
However, there is considerable variation in the amount of non-financial disclosures, as
reflected in the minimum, maximum and standard deviation of NF.
Panel D and Panel E of Table 2 present the correlation coefficients among the key
variables for the over-investment and under-investment firms separately. Of special interest to
this study, under-investment is positively correlated with both voluntary non-financial
disclosure and corporate governance, while over-investment is negatively correlated with
corporate governance. Note also that the correlation coefficient between NF and CG is low
(ranging from 0.03 to 0.05), so any impact of NF on investment efficiency is unlikely to be
12
Unless otherwise noted, UNDER (OVER) is defined as the raw value of the residual from Equation (1).

25
attributed to NF being a function (or surrogate) of CG, especially when both are included in
the same regression.
[Insert Table 2 here]
(ii) Baseline regression results
[Insert Table 3 here]
Panel A of Table 3 shows that for the whole sample, the coefficient on non-financial
disclosure is 0.0045 (-0.0060) for the under-investment (over-investment) firms, and is
statistically indistinguishable from zero. Thus, the extent of non-financial disclosure is on
average not statistically associated with investment efficiency in the subsequent year. A
possible reason for this is that voluntary non-financial disclosure in general is perceived as
subject to manipulation and thus is of low credibility.
Panel B and Panel C of Table 3 report the results for strong corporate governance and
weak corporate governance firms within the under-investment and over-investment
sub-samples, respectively.13
For the strong corporate governance firms within the
under-investment (over-investment) sub-sample, the coefficient on non-financial disclosure is
positive (negative) and statistically significant at the 5% level. By contrast, for the weak
corporate governance firms within both the under- and over-investment sub-samples, the
coefficients on non-financial disclosure are much smaller in magnitude, and are statistically
indistinguishable from zero. The evidence indicates that non-financial disclosure by strong
corporate governance firms is useful in mitigating investment inefficiency (i.e., increasing
investment among the under-investment firms, and decreasing investment among the
over-investment firms). We argue that this is because such disclosure is rendered credible by
the strong corporate governance in place which constrains managerial opportunism.
Our interpretation is consistent with prior research arguing for a credibility-enhancing
role of corporate governance in financial reporting. For instance, Mercer (2004) posits that
investors may feel more confidence in the veracity of a firm's disclosures when the firm has
a high-quality board of directors. Healy and Palepu (2001) suggest that the board plays an
13
We run the regressions separately for the OVER and UNDER groups (using the signed residuals) because the effect of
NF on INEF may not be symmetric between the two groups/types of firms.

26
important role in enhancing the quality of voluntary disclosure and hence its credibility. By
including multiple indicators of corporate governance quality in our corporate governance
index, and by relating corporate governance to non-financial disclosure and investment
efficiency, our study extends prior research and reaffirms the credibility-enhancing role of
corporate governance in a new and important context (i.e., investment efficiency in China).
To further investigate the moderating role of corporate governance on the relation
between non-financial disclosure and investment efficiency, we next estimate Equation (3)
after adding the interaction term NF*CG. Other than the regression coefficient on the
interaction term, we are also interested in the sum of the coefficients on NF and NF*CG,
which captures the overall effect of NF on investment efficiency. The results are reported in
Panel A of Table 4.
[Insert Table 4 here]
For the under-investment sub-sample, higher voluntary non-financial disclosure per se is
not associated with higher investment efficiency (the coefficient on NF is statistically
insignificant). For the over-investment sub-sample, the coefficient on NF is negative and only
marginally significant. For both sub-samples, higher corporate governance is associated with
higher investment efficiency, as indicated by a positive (negative) and statistically significant
coefficient on CG for the under-investment (over-investment) sub-sample. More importantly
for this study, the coefficient on NF*CG is positive and statistically significant for the
under-investment sub-sample, and negative and statistically significant for the
over-investment sub-sample. This is consistent with the by-group regression results in Table
3, and reaffirms the earlier finding that effect of voluntary non-financial disclosure on
investment efficiency is contingent on the level of corporate governance. For both the
under-investment and over-investment cases, the sum of the coefficients on NF and NF*CG
is statistically different from zero, which indicates that non-financial disclosure has a positive
effect on investment efficiency, with the effect increasing as the level of corporate
governance increases.
To facilitate interpretation, and assess whether the results are sensitive to how we classify
over- and under-investment firms, we next re-run the regressions using the absolute value of
27
the residual from Equation (1). Consistent with Chen et al. (2011a), higher (absolute) residual
values indicate higher levels of investment inefficiency. The results are reported in Panel B of
Table 4.
For the whole sample, NF is not associated with investment efficiency. Better corporate
governance mitigates investment inefficiency (a negative and statistically significant
coefficient on CG). And as corporate governance improves, NF mitigates investment
inefficiency (a negative and statistically significant coefficient on CG*NF).
For the strong corporate governance group, higher levels of NF mitigate investment
inefficiency (a negative and statistically significant coefficient on NF). However, for the
weak corporate governance group, the coefficient on NF is statistically indistinguishable from
zero, so there is no evidence to suggest that non-financial disclosure mitigates investment
inefficiency among weak corporate governance firms. The results in Panel B are therefore
consistent with those in Panel A, suggesting that they are not sensitive to whether investment
inefficiency is defined using the raw value of the residuals, or the absolute value of the
residuals, from Equation (1). In the remainder of the paper we will only report the results
based on the raw value of the residuals.
The analyses thus far indicate that the effect of voluntary non-financial disclosure on
investment efficiency depends on corporate governance—strong governance enhances the
effectiveness of voluntary non-financial disclosure in mitigating over- and under-investment.
To see if this conclusion depends critically on firm characteristics such as ownership type
(H2) and the external market environment, we next conduct cross-sectional analysis to gauge
the reliability of the baseline results.
(iii) Cross-sectional analysis
State-own enterprises (SOEs) versus non-state-owned enterprises (NSOEs)
A distinct characteristic of Chinese listed firms is that many of them are SOEs, in which
the state is the ultimate controlling shareholder. As discussed in the literature review section,
prior China studies document a strong effect of ownership type on firm performance. We
further extend this literature by testing whether the effects of non-financial disclosure on
investment efficiency are different between SOEs and NSOEs, and, within each ownership

28
type, whether the association is moderated by the level of corporate governance.
[Insert Table 5 here]
As seen in Table 5, for both the over- and under-investment sub-samples, voluntary
non-financial disclosure has a statistically significant effect on investment efficiency
(reducing over-investment and increasing under-investment) among the SOEs, but not among
non-SOEs. These results are consistent with the view that SOEs in China have lower
incentives to opportunistically manipulate their non-financial disclosures, making them more
credible such that increases in non-financial disclosure contribute to improvement in
investment efficiency. In contrast, because non-SOEs have relatively strong incentives to
engage in opportunistic manipulation, their non-financial disclosures are associated with low
credibility and hence are on average ineffective in mitigating investment inefficiency.
To the extent that good corporate governance can constrain opportunism and enhance
the credibility of voluntary non-financial disclosure, the above argument also suggests that
the marginal effect of corporate governance on the ability of non-financial disclosures to
improve investment efficiency is stronger for non-SOEs than for SOEs. In other words, given
that non-SOEs have stronger incentives to engage in opportunistic disclosure, strong
corporate governance is expected to play a more important role in constraining such
opportunism in non-SOEs relative to SOEs. To test this conjecture (H2), Table 6 reports the
results of the baseline regression after adding corporate governance and the interaction term
between corporate governance and voluntary non-financial disclosure.
[Insert Table 6 here]
Firstly focusing on SOEs, the coefficient on NF is positive (negative) and statistically
significant for the under-investment (over-investment) sub-sample. This reaffirms our earlier
finding that non-financial disclosure mitigates investment efficiency. Importantly, the
coefficient on NF*CG is positive and statistically significant for the under-investment
sub-sample (Panel A), and is positive though statistically insignificant for the
over-investment sub-sample (Panel B). Thus there is some evidence that, among SOEs, the
effect of voluntary non-financial disclosure on investment efficiency increases as the value of
corporate governance increases, i.e., there is an interaction effect between corporate
governance and voluntary non-financial disclosure.

29
Next moving on to non-SOEs, the coefficient on NF is statistically insignificant for both
the under- and over-investment sub-samples. In contrast, the coefficient on the interaction
term NF*CG is positive (negative) and statistically significant for the under-investment
(over-investment) sub-sample. The results show that, among non-SOEs, better corporate
governance enhances the credibility and thus quality of non-financial disclosure, which in
turn improves investment efficiency.
Lastly, a Wald test of equality of the coefficient on NF*CG indicates that the moderating
role of corporate governance in the non-financial disclosure-investment efficiency relation is
stronger for non-SOEs than SOEs in the case of over-investment, but there is no statistically
significant difference in the case of under-investment. Taken together, the evidence is
supportive of H2 that the marginal effect of corporate governance on the ability of
non-financial disclosures to improve investment efficiency is stronger for non-SOEs than for
SOEs.14
Firms from high-marketization regions versus firms from low-marketization regions
Prior research (e.g., Fan et al., 2007; Jian and Wong, 2010) finds that Chinese listed
firms headquartered in regions with better developed market institutions (such as Guangdong,
Shanghai, Zhejiang and Jiangsu) are subject to greater market discipline, have better
corporate governance, and perform better. Chen et al. (2014) also find that relation between
firm value and voluntary disclosure varies between firms located in high- and
low-marketization regions. We next test for differences in the credibility-enhancing role of
corporate governance between high-marketization firms and low-marketization firms.
[Insert Table 7 here]
Table 7 reports the baseline regression results by stage of regional economic
development. In both high- and low-marketization regions, non-financial disclosure per se is
not significantly related to investment efficiency. There is also no statistically significant
14
In untabulated analysis, we find that SOEs on average have significantly better corporate governance than non-SOEs, although their investment efficiency is not much different. Given that non-SOEs generally have weaker corporate
governance, it is expected that their voluntary disclosure is on average less credible. To the extent that strong corporate
governance constrains managerial opportunism (García Osma and Guillamón-Saorín, 2011), improvements in corporate
governance should have a stronger marginal effect on the ability of voluntary non-financial disclosure to impact investment
efficiency. This is what we found.

30
difference between high- and low-marketization firms in the association between
non-financial disclosure and investment efficiency.
[Insert Table 8 here]
To investigate the role of corporate governance in moderating the effect of non-financial
disclosure on investment efficiency, we next estimate Equation (3) by stage of regional
economic development. The results are reported in Table 8. For the high-marketization firms,
corporate governance per se mitigates over-investment (a negative and statistically significant
coefficient on CG) but not under-investment. The coefficient on NF*CG is positive but
statistically insignificant for the under-investment sub-sample, and is negative and
statistically significant for the over-investment sub-sample. Thus, corporate governance
enhances the role of non-financial disclosure in reducing over-investment, but not in
increasing under-investment. In contrast, for the low-marketization firms, corporate
governance per se mitigates both under- and over-investment. The coefficient on the
interaction term NF*CF is positive (negative) and statistically significant for the
under-investment (over-investment) firms, suggesting that the ability of non-financial
disclosure to mitigate investment inefficiency grows with improvement in the internal
corporate governance of firms headquartered in the less-developed regions. The test of
equality in the coefficient on the interaction term between the high-marketization and
low-marketization firms, however, is not statistically significant, so there is no evidence that
the role of corporate governance in moderating the non-financial disclosure-investment
efficiency relation differs between the high- and low-marketization regions.
(iv) Robustness tests
The cross-sectional regression results are largely consistent with the results in the
baseline analysis, and indicate that firm-level corporate governance can positively affect the
role of non-financial disclosure in improving investment efficiency. We next conduct
robustness tests to gauge the sensitivity of our results to controls for endogeneity and
financial information quality, as well as alternative measurements of the key variables.
Addressing potential endogeneity
31
Our main hypothesis is that voluntary non-financial disclosure that is made credible by
good corporate governance improves investment efficiency. While it is challenging to
establish causality in this line of research (Chen et al., 2011a), our research design has at least
partially alleviated such concerns. First, our hypothesis is grounded in economic theory and
builds on prior empirical research. Second, we test the effect of NF in the current period on
investment efficiency in the next period. Third, we include control variables that prior
research suggests are relevant. Fourth, our focus on interaction effects makes it hard to argue
for reverse causality (e.g., Rajan and Zingales, 1998; Chen et al., 2011a).
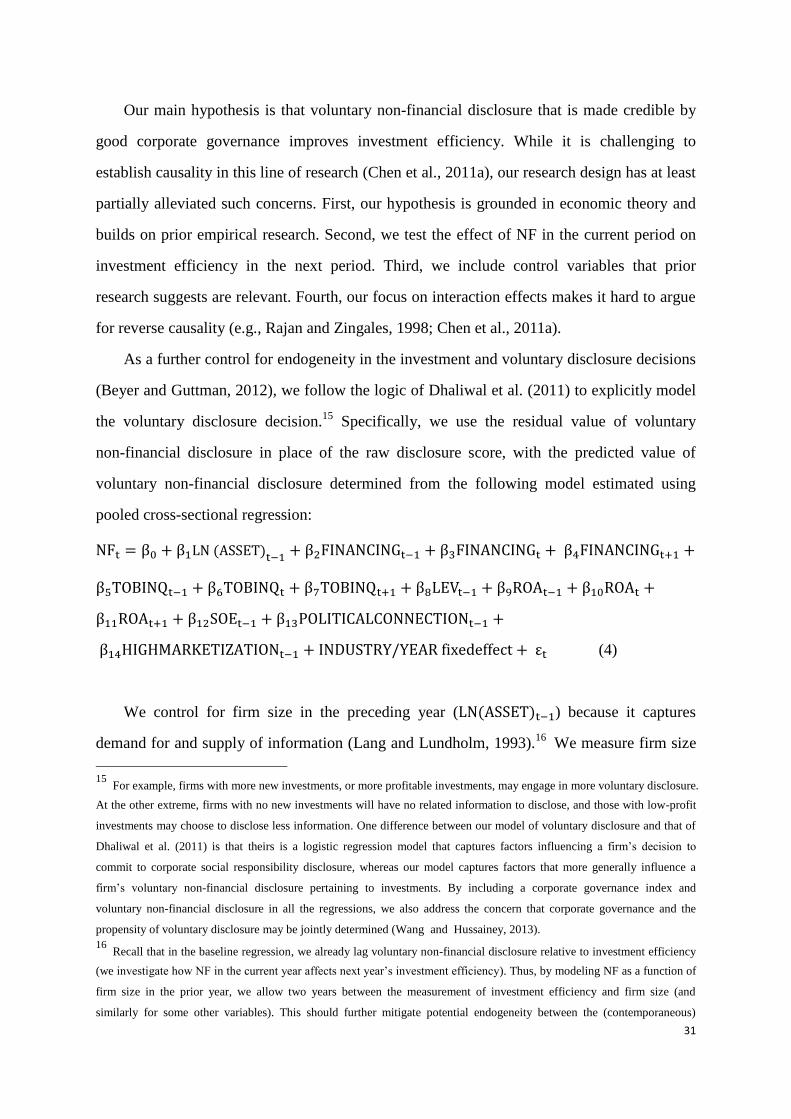
As a further control for endogeneity in the investment and voluntary disclosure decisions
(Beyer and Guttman, 2012), we follow the logic of Dhaliwal et al. (2011) to explicitly model
the voluntary disclosure decision.15
Specifically, we use the residual value of voluntary
non-financial disclosure in place of the raw disclosure score, with the predicted value of
voluntary non-financial disclosure determined from the following model estimated using
pooled cross-sectional regression:
(4)
We control for firm size in the preceding year ( ) because it captures
demand for and supply of information (Lang and Lundholm, 1993).16
We measure firm size
15
For example, firms with more new investments, or more profitable investments, may engage in more voluntary disclosure.
At the other extreme, firms with no new investments will have no related information to disclose, and those with low-profit
investments may choose to disclose less information. One difference between our model of voluntary disclosure and that of
Dhaliwal et al. (2011) is that theirs is a logistic regression model that captures factors influencing a firm’s decision to
commit to corporate social responsibility disclosure, whereas our model captures factors that more generally influence a
firm’s voluntary non-financial disclosure pertaining to investments. By including a corporate governance index and
voluntary non-financial disclosure in all the regressions, we also address the concern that corporate governance and the
propensity of voluntary disclosure may be jointly determined (Wang and Hussainey, 2013).
16 Recall that in the baseline regression, we already lag voluntary non-financial disclosure relative to investment efficiency
(we investigate how NF in the current year affects next year’s investment efficiency). Thus, by modeling NF as a function of
firm size in the prior year, we allow two years between the measurement of investment efficiency and firm size (and
similarly for some other variables). This should further mitigate potential endogeneity between the (contemporaneous)

32
as the natural logarithm of the market value of common equity at the beginning of each year.
We control for new external financing in the preceding year, current year and subsequent
year because firms may increase their voluntary disclosures after raising new financing, or in
anticipation of new financing.17
To account for the possibility that firms’ voluntary
disclosure is influenced by past, current or expected project profitability, we control for
profitability (which we proxy using ROA) in the preceding year, current year and subsequent
year. We also control for growth opportunity (which we proxy using TOBINQ), although its
effect on voluntary disclosure may be unclear ex ante (Dhaliwal et al., 2011). Leverage,
ownership type, political connection, regional economic development and industry/year fixed
effects are included as additional controls.
[Insert Table 9 here]
Panel A of Table 9 reports the results of regressing determinants of voluntary disclosure
against firm-level raw NF scores. Consistent with expectation, larger firms, firms that raise
new external financing in the current or subsequent year, and more profitable firms are
associated with higher voluntary non-financial disclosure, whereas high growth firms and
politically connected firms disclosed less non-financial information. The model has
reasonable explanatory power (adjusted R-squared=0.115).
We next use the abnormal value of NF (ANF, being the difference between the predicted
value of NF from the first-stage regression, and the raw NF) and re-do the baseline regression
analyses. The results are reported in Panel B of Table 9. While non-financial disclosure per se
is not statistically significantly associated with higher investment efficiency in the next year,
better corporate government mitigates under-investment (i.e., a positive and statistically
significant coefficient on CG for the under-investment sub-sample) and reduces
over-investment (i.e., a negative and statistically significant coefficient on CG for the
over-investment sub-sample). And as corporate governance improves, voluntary
non-financial disclosure plays a more significant role in improving investment efficiency for
both under- and over-investment firms. These results are qualitatively similar to those
investment and disclosure decisions.
17 We also tried using increase in capital expenditures in place of new external financing and obtained qualitatively similar
results. We do not include both as they are highly correlated.

33
obtained using raw values of non-financial disclosure.
Controlling for quality of financial information18
To account for the effect of quality of financial information, we further control for
several measures of financial information quality following prior literature, including
discretionary accruals (Dechow et al., 1995). Table 10 reports the results of re-running the
baseline regression after including these additional control variables. The results are
qualitatively the same.
[Insert Table 10 here]
Using number of sentences to measure non-financial information
Following Muslu et al. (2014), Bozzolan et al. (2009) and Li (2010) amongst others, we
use sentence (defined as a set of words that is complete in itself, typically containing a
subject and predicate, conveying a statement, and consisting of a main clause and sometimes
one or more subordinate clauses) as the unit of analysis because it is the smallest integral unit
of text that conveys an idea or message (Ivers, 1991), and because it is generally considered
more reliable than pages or paragraphs (Hackston and Milne, 1996). Operationally, we
trained a dozen MSc students to locate and manually read through the corporate reports and
count the number of sentences pertaining to firms’ new investment projects (see Appendix 1
for a list of voluntary disclosure items related to new investments). The baseline regression
results using this alternative measure of NF are reported in Table 11.
[Insert Table 11 here]
While the coefficients of NF are statistically insignificant, the coefficients of CG and the
interaction term NF*CG are positive (negative) and statistically significant for the
under-investment (the over-investment) sub-sample. This reaffirms the earlier findings that
corporate governance enhances the role of voluntary non-financial disclosure in improving
investment efficiency.
Differentiating between firms with new investments and those without
The above tests do not distinguish between firms that made new investments during the
18
From this point on we only tabulate the results for the baseline model. The results for the cross-sectional analysis
(omitted for brevity but available on request) are qualitatively the same.

34
year, and those that did not. In studying the relation between firm value and voluntary
disclosure of information in China, Chen et al. (2014) restrict their sample to firms that have
new investment projects, as these are the firms that are likely to need to attract new investors.
To see if the conclusions depend critically on whether the firms made any new investments,
we repeat all the above tests for the sub-sample of firms that indeed had new investments
during the year (about 60% of the overall sample).19
The results (untabulated) are
qualitatively similar.
5. SUMMARY AND CONCLUSIONS
A hotly debated issue in accounting and finance is the effect of information asymmetries
on investment efficiency. Adverse selection resulting from information asymmetries between
insiders and outside investors may lead to inefficient allocation of resources, such that
negative NPV projects may be taken up due to excess financing, and positive NPV projects
may be rejected due to financing constraints. Moral hazard resulting from information
asymmetries may similarly lead to inefficient investments as managers engage in empire
building (Hope and Thomas, 2008) or expropriation of shareholders. Past studies find that
financial information alleviates information asymmetries and is value-relevant. In comparison
with backward-looking financial information in traditional financial statements, non-financial
information is not subject to GAAP, and has the advantages of being more flexible, relevant
and timely. As an offsetting disadvantage, non-financial information is more easily
manipulated, and thus may be of lower reliability and quality than financial information. So
far, there has been limited research on whether voluntary non-financial disclosure affects
investment efficiency, and whether the association is moderated by firm-level corporate
governance.
We investigate this important issue using 5145 firm-year observations involving 1029
Chinese A-share companies listed on the Shanghai and Shenzhen Stock Exchanges during
2007-2011. Different from previous studies that typically use raw proxies for information
quality, we compose a direct measure of non-financial disclosure pertaining specifically to
19
Note that the overall sample includes firms with planned new investments but these may not have embarked upon during
the year.
35
firm’s ongoing and planned future investments, which has the advantage of illuminating the
underlying mechanism through which investment efficiency may be affected by voluntary
non-financial disclosure. Due to China’s under-developed institutional and market
environments, managers/insiders are more likely to pursue private gains by voluntarily
disclosing misleading or difficult-to-verify non-financial information. Outside investors may
not trust such disclosures, unless their credibility is enhanced by investor protection
mechanisms. Empirically, we find that voluntary non-financial disclosure on average is not
associated with higher investment efficiency for weak corporate governance firms. However,
for companies with strong corporate governance, voluntary non-financial disclosure is
significantly associated with higher investment efficiency. Furthermore, we find that as the
level of corporate governance increases, the relation between voluntary non-financial
disclosure and investment efficiency becomes stronger. We argue that this occurs because
good corporate governance constrains managerial opportunism, and thus enhances the
credibility of voluntary non-financial disclosure, such that outside investors utilize such
disclosures for effective monitoring of managers and project identification. The net result is
higher investment efficiency.
The positive effect of strong corporate governance on investment efficiency we
document for China corroborates and extends findings in prior studies elsewhere (mostly in
developed markets) which suggest that corporate governance impacts firms’ information
disclosure (García Osma and Guillamón-Saorín, 2011; Wang and Hussainey, 2013) and
affects stock price efficiency and capital allocation (Morck et al., 2000; Durnev et al., 2004).
Our research complements these studies by focusing on the world’s largest emerging market
(China), and by examining an identifiable and important source of firm-specific information
(non-financial disclosure regarding current or planned investments) that likely impacts
firm-level investment efficiency (as opposed to stock market- or analyst-based mesaures).
Our paper is not without limitations. Although our focus on disclosure of information
about ongoing and planned investments provides more direct evidence on the relations among
non-financial disclosure, corporate governance and investment efficiency, we do not directly
observe the investment decision-making process, and thus (like previous studies) must base
our inference on the presumed channel/mechanism of influence that high quality information

36
reduces information asymmetry and enhances monitoring. Furthermore, there are different
ways to measure/model investment efficiency. We are currently conducting sensitivity tests
by using different models of investment efficiency and by including a more comprehensive
set of control variables.
Nevertheless, our results are interesting from the viewpoint of both academic and policy
research. An important implication of our study is that firm-level corporate governance can
substitute for country-level institutions, and that voluntary non-financial disclosures can be
value-relevant. By improving internal corporate governance, which, in turn, enhances the
credibility of voluntary disclosure and enables outside investors to more effectively monitor
managers, firms in emerging markets may overcome the deficiencies in their institutional
environments and improve their investment efficiency. We call for more research in other
markets to corroborate our findings.

37
References
Ahmed, A.S. and S. Duellman (2007), ‘Accounting Conservatism and Board of Directors′
Characteristics: An Empirical Analysis’, Journal of Accounting and Economics, Vol. 43, pp.
411–437.
Ajinkya, B., S. Bhojraj and P. Sengupta (2005), ‘The Association Between Outside Directors,
Institutional Investors and the Properties of Management Earnings Forecasts’, Journal of
Accounting Research, Vol. 43, No. 3, pp. 343–376.
Allen, F., J. Qian and M. Qian (2005), ‘Law, Finance, and Economic Growth in China’,
Journal of Financial Economics, Vol. 77, No. 1, pp. 57-116.
Amir, E. and B. Lev (1996), ‘Value-Relevance of Non-Financial Information: The Wireless
Communications Industry’, Journal of Accounting and Economics, Vol. 22, Nos. 1–3, pp.
3-30.
Bai, C-E., Q. Liu, J. Lu, F.M. Song and J. Zhang (2004), ‘Corporate Governance and Market
Valuation in China’, Journal of Comparative Economics, Vol. 32, pp. 599–616.
Baiman, S. and R. Verrecchia (1996), ‘The Relation Among Capital Markets, Financial
Disclosure, Production Efficiency, and Insider Trading’, Journal of Accounting Research,
Vol. 34, No. 1, pp. 1–22.
Beasley, M. (1996), ‘An Empirical Analysis of the Relation Between the Board of Director
Composition and Financial Statement Fraud’, Accounting Review, Vol. 71, pp. 443-466.
Bertrand, M. and S. Mullainathan (2001), ‘Are CEOs Rewarded for Luck? The Ones Without
Principals Are’, Quarterly Journal of Economics, Vol. 116, pp. 901-932.
Beyer, A. and I. Guttman (2012), ‘Voluntary Disclosure, Manipulation, and Real Effects’,
Journal of Accounting Research, Vol. 50, pp. 1141-1177.
Berkman, H., R.A. Cole and L.J. Fu (2010), ‘Political Connections and Minority-Shareholder
Protection: Evidence from Securities-Market Regulation in China’, Journal of Financial and
Quantitative Analysis, Vol. 45, No. 6, pp. 1391-1417.
Bertrand, M. and S. Mullainathan (2003), ‘Enjoying the Quiet Life? Corporate Governance
and Managerial Preferences’, Journal of Political Economy, Vol. 111, pp. 1043-1075.
Biddle, G. and G. Hilary (2006), ‘Accounting Quality and Firm-Level Capital Investment’,
Accounting Review, Vol. 81, pp. 963-982.
Biddle, G., G. Hilary and R. Verdi (2009), ‘How Does Financial Reporting Quality Relate to
Investment Efficiency?’, Journal of Accounting and Economics, Vol. 48, pp.112-131.
Botosan, C. (1997), ‘Disclosure Level and the Cost of Equity Capital’, Accounting Review,
Vol. 72, pp. 323–349.
Bozzolan, S., M. Trombetta and S. Beretta (2009), ‘Forward-Looking Disclosures, Financial
Verifiability and Analysts’ Forecasts: A Study of Cross-Listed European Firms’, European
Accounting Review, Vol. 18, No. 3, pp. 435–473.
Brammer, S. and S. Pavelin (2006), ‘Voluntary Environmental Disclosures by Large UK
Companies’, Journal of Business Finance & Accounting, Vol. 33, Nos. 7–8, pp. 1168–88.
Brazel, J., K. Jones and M.F. Zimbelman (2009), ‘Using Nonfinancial Measures to Assess
Fraud Risk’, Journal of Accounting Research, Vol. 47, No. 5, pp. 1135–1166.
Bushman, R. and A. Smith (2001), ‘Financial Accounting Information and Corporate
Governance’, Journal of Accounting and Economics, Vol. 32, Nos. 1-3, pp. 237-333.
Bushman, R., J. Piotroski and A. Smith (2011), ‘Capital Allocation and Timely Accounting

38
Recognition of Economic Losses’, Journal of Business Finance & Accounting, Vol. 38, Nos.
1-2, pp. 1-33.
Chen, J. (2001), ‘Ownership Structure as Corporate Governance Mechanism: Evidence from
Chinese Listed Companies’, Economics of Planning, Volume 34, Nos. 1-2, pp. 53-72.
Chen, J.J, X. Cheng, S.X. Gong and Y. Tan (2014), ‘Do Higher Value Firms Voluntarily
Disclose More Information? Evidence from China’, British Accounting Review, Vol. 46,
18-32.
Chen G., M. Firth, D.N. Gao and O.M. Rui (2006), ‘Ownership Structure, Corporate
Governance, and Fraud: Evidence from China’, Journal of Corporate Finance, Vol. 12, No. 3,
pp. 424-448.
Chen, G. M. Firth and L. Xu (2009), ‘Does the Type of Ownership Control Matter? Evidence
from China’s Listed Companies’, Journal of Banking & Finance, Vol. 33, No. 1, pp. 171-181.
Chen, F., O-K. Hope, Q. Li and X. Wang (2011a), ‘Financial Reporting Quality and
Investment Efficiency of Private Firms in Emerging Markets’, Accounting Review, Vol. 86,
No. 4, pp. 1255-1288.
Chen, S., Z. Sun, S. Tang and D. Wu (2011b), ‘Government Intervention and Investment
Efficiency: Evidence from China’, Journal of Corporate Finance, Vol. 17, No. 2, pp.259-271.
Chen, J.J. and H. Zhang (2014), ‘The Impact of the Corporate Governance Code on Earnings
Management: Evidence from Chinese Listed Companies’, European Financial Management,
forthcoming.
Cheng, X., Y. Tan and M. Liao (2011), ‘Mandatory Disclosure, Earnings Quality, and
Marketization’, Financial Research, Vol. 2, pp. 60-71. (in Chinese)
Cheung, Y.-L., P. Jiang, P. Limpaphayom and T. Lu (2010), ‘Corporate Governance in China:
A Step Forward’, European Financial Management, Vol. 16, No. 1, 94–123.
Cheung, Y.-L., P.R. Rau and A. Stouraitis (2006), ‘Tunneling, Propping and Expropriation:
Evidence from Connected Party Transactions in Hong Kong’, Journal of Financial
Economics, Vol. 82, pp. 343–386.
Cheynel, E. (2013), ‘A theory of Voluntary Disclosure and Cost of Capital’, Review of
Accounting Studies, Vol. 18, pp. 987–1020.
China Securities Regulatory Commission (2009), Development report of Chinese listed
companies (Beijing: China Economic Publishing House).
Chung, K.H., P. Wright and C. Charaenwong (1998), ‘Investment Opportunities and Market
Reaction to Capital Expenditure Decisions’, Journal of Banking and Finance, Vol. 22, pp.
41–60.
Clarke, D. C. (2003), ‘Corporate Governance in China: An Overview’, China Economic
Review, Vol. 14, pp. 494–507.
Davila, A. and F. Penalva (2006), ‘Governance Structure and the Weighting of Performance
Measures in CEO Compensation’, Review of Accounting Studies, Vol. 11, pp. 463-493.
Dechow, P.M., R.G. Sloan and A.P. Sweeney (1995), ‘Detecting Earnings Management’,
Accounting Review, Vol. 70, pp. 193-225.
Dechow, P. M., R.G. Sloan and A.P. Sweeney (1996). ‘Causes and Consequences of Earnings
Manipulation: An Analysis of Firms Subject to Enforcement Actions by the SEC’,
Contemporary Accounting Research, Vol. 13, pp. 1–36.
Dhaliwal, D.S., O.Z. Li, A. Tsang and Y.G. Yang (2011), ‘Voluntary Nonfinancial Disclosure
39
and the Cost of Equity Capital: The Initiation of Corporate Social Responsibility Reporting’,
Accounting Review, Vol. 86, pp. 59-100.
Dhaliwal, D.S., S., Radhakrishnan, A. Tsang and Y.G. Yang (2012), ‘Nonfinancial Disclosure
and Analyst Forecast Accuracy: International Evidence on Corporate Social Responsibility
Disclosure’, Accounting Review, Vol. 87, pp. 723-759.
Diamond, D. and R. Verrecchia (1991), ‘Disclosure, Liquidity, and the Cost of Capital’,
Journal of Finance, Vol. 46, pp. 1325–1359.
Ding, Y., H. Zhang and J. Zhang (2007), ‘Private vs State Ownership and Earnings
Management: Evidence from Chinese Listed Companies’, Corporate Governance: An
International Review, Vol. 15, No. 2, pp. 223-238.
Durnev, A., R. Morck and B. Yeung (2004), ‘Value-Enhancing Capital Budgeting and
Firm-Specific Stock Return Variation’, Journal of Finance, Vol. 59, No. 1, pp. 65–105.
Fama, E. F. and A. B. Laffer (1971), ‘Information and Capital Markets’, Journal of Business,
Vol. 44, 289- 298.
Fan, J.P.H., T.J. Wong and T. Zhang (2007), ‘Politically Connected CEOs, Corporate
Governance, and Post-IPO Performance of China's Newly Partially Privatized Firms’,
Journal of Financial Economics, Vol. 84, pp. 330–357.
Firth, M., P. Fung and O. Rui (2006), ‘Corporate Governance and CEO Compensation in
China’, Journal of Corporate Finance, Vol. 12, pp. 693-714.
Firth, M., S.X. Gong and L. Shan (2013), ‘Cost of Government and Firm Value’, Journal of
Corporate Finance, Vol. 21, pp. 136-152.
Firth, M., O.M. Rui and W. Wu (2011), ‘Cooking the Books: Recipes and Costs of Falsified
Financial Statements’, Journal of Corporate Finance, Vol. 17, pp. 371-390.
Francis, J., D. Nanda and P. Olsson (2008), ‘Voluntary Disclosure, Earnings Quality,
and Cost of Capital’, Journal of Accounting Research, Vol. 46, No. 1, pp. 53-99.
García Osma, B. and E. Guillamón-Saorín (2011), ‘Corporate Governance and Impression
Management in Annual Results Press Releases’, Accounting, Organizations and Society, Vol.
36, Nos. 4-5, pp. 187-208.
Gelb, D. (2002), ‘Intangible Assets and Firms’ Disclosures: An Empirical Investigation’,
Journal of Business Finance & Accounting, Vol. 29, Nos. 3–4, pp. 457–76.
Gernon, H. and G.K. Meek (2001), Accounting: An International Perspective (New York:
McGraw-Hill).
Gompers, P., J. Ishii and A. Metrick (2003), ‘Corporate Governance and Equity Prices’,
Quarterly Journal of Economics, Vol. 118, pp. 107-155.
Gong, S.X., F.A. Gul and G. Lin (2012), ‘Do Media Market-Orientation and Firm
Characteristics Affect Financial News Reporting in China?’, Working Paper (Hong Kong
Polytechnic University).
Gong, S.X., F.A. Gul and L. Shan (2013), ‘Media Coverage and the Pricing of Audit Fees in
China’, Working Paper (Hong Kong Polytechnic University).
Grossman, S.J. (1981), ‘The Informational Role of Warranties and Private Disclosure about
Product Quality’, Journal of Law and Economics, Vol. 24, pp. 461–484.
Grossman, S.J. and O. Hart (1980), ‘Disclosure Laws and Takeover Bids’, Journal of Finance,
Vol. 35, pp. 323–334.

40
Gu, F. and W. Wang (2005), ‘Intangible Assets, Information Complexity, and Analysts’
Earnings Forecasts’, Journal of Business Finance & Accounting , Vol. 32, No. 9, pp. 1673–
702.
Hackston, D. and M.J. Milne (1996), ‘Some Determinants of Social and Environmental
Disclosures in New Zealand Companies’, Accounting, Auditing and Accountability Journal,
Vol. 9, No.1, pp. 77–108.
Hamilton, L.C. (2006), Statistics with STATA (Duxbury Resource Center, Duxbury).
He, W. (2003), ‘Voluntary Information Disclosure by Chinese Listed Companies’, Shenzhen
Stock Exchange Research Report.
Healy, P. and K. Palepu (2001), ‘Information Asymmetry, Corporate Disclosure, and the
Capital Markets: A Review of the Empirical Disclosure Literature’, Journal of Accounting
and Economics, Vol. 31, pp. 405-440.
Hope, O. and W. Thomas (2008), ‘Managerial Empire Building and Firm Disclosure’,
Journal of Accounting Research, Vol. 46, pp. 591-626.
Hubbard, R.G. (1998), ‘Capital-Market Imperfections and Investment’, Journal of Economic
Literature, Vol. 36, No. 1, pp. 193-225.
Hughes, P. (1986), ‘Signalling by Direct Disclosure under Asymmetric Information’, Journal
of Accounting and Economics, Vol. 8, pp. 119-142.
Ittner, C. and D. Larcker (1998), ‘Are Nonfinancial Measures Leading Indicators of Financial
Performance? An Analysis of Customer Satisfaction’, Journal of Accounting Research, Vol.
36, No. 3 (supplement), pp. 1–35.
Ivers, M. (1991), The Random House Guide to Good Writing (New York: Random House).
Jennings, R. (1987), ‘Unsystematic Security Price Movements, Management Earnings
Forecast and Revisions in Consensus Analysts Earnings Forecasts’, Journal of Accounting
Research, Vol. 25, No. 1, pp. 90 -110.
Jian, M. and T.J. Wong (2010), ‘Propping through Related Party Transactions’, Review of
Accounting Studies, Vol. 15, No. 1, pp. 70–105.
Jin, L., N. Xu, W. Zhang (2014), ‘The Effect of Politician Career Concern on Media Slant
and Market Return: Evidence from China’, Working Paper (Cheung Kong Graduate School
of Business).
Jo, H. and Y. Kim (2007), ‘Disclosure Frequency and Earnings Management’, Journal of
Financial Economics, Vol. 84, pp. 561-590.
Kaplan, R.S. and D.P. Norton (1996), The Balanced Scorecard: Translating Strategy into
Actions (MA: Harvard Business School Press).
Karamanou, I. and N. Vafeas (2005), ‘The Association between Corporate Boards, Audit
Committees, and Management Earnings Forecasts: An Empirical Analysis’, Journal of
Accounting Research, Vol. 43, pp. 453–486.
Kedia, S. and T. Philippon (2009), ‘The Economics of Fraudulent Accounting’, Review of
Financial Studies, Vol. 22, pp. 2169-2199.
Kothari, S.P., S. Shu and P. Wysocki (2009), ‘Do Managers Withhold Bad News?’, Journal of
Accounting Research, Vol. 47, No. 1, pp. 241-276.
Lan, Y., L. Wang and X. Zhang (2013), ‘Determinants and Features of Voluntary Disclosure
in the Chinese Stock Market’, China Journal of Accounting Research, Vol. 6. pp. 265-285.
Lang, M.H. and R.J. Lundholm (2000), ‘Voluntary Disclosure and Equity Offerings:

41
Reducing Information Asymmetry or Hyping the Stock?’, Contemporary Accounting
Research, Vol. 17, pp. 623-662.
La Porta, R., F. Lopez-de-Silanes and A. Shleifer (1999), ‘Corporate Ownership around the
World’, Journal of Finance, Vol. 54, pp. 471–517.
Lambert, R.A., C. Leuz, C. and R.E. Verrecchia (2007), ‘Accounting Information, Disclosure,
and the Cost of Capital’, Journal of Accounting Research, Vol. 45, No. 2, pp. 385-420.
Leung, N.W. and M.-A. Cheng (2013), ‘Corporate Governance and Firm Value: Evidence
from Chinese State-controlled Listed Firms’, China Journal of Accounting Research, Vol. 6,
pp. 89-112.
Li, F. (2008), ‘Annual Report Readability, Current Earnings, and Earnings Persistence’,
Journal of Accounting and Economics, Vol. 45, Nos. 2-3, pp. 221-247.
Li, F. (2010), ‘The Information Content of Forward-Looking Statements in Corporate
Filings-A Naïve Bayesian Machine Learning Approach’, Journal of Accounting Research,
Vol. 48, No. 5, pp. 1049-1102.
Li, O.Z., X. Su and Z. Yang (2012), ‘State Control, Access to Capital, and Firm Performance’,
China Journal of Accounting Research, Vol. 5, No. 2,101-125.
Liu, Q. and Z. Lu (2007), ‘Corporate Governance and Earnings Management in the Chinese
Listed Companies: A Tunneling Perspective’, Journal of Corporate Finance, Vol. 13, No. 5,
pp. 881-906.
Lin, Y. and Z. Li (2004), ‘Policy Burdens, Moral Hazards, and the Soft Budget Constraint’,
Financial Research, Vol. 2, pp. 17-27. (in Chinese)
Lo, A.W.Y., R.M.K. Wong and M. Firth (2010), ‘Can Corporate Governance Deter
Management from Manipulating Earnings? Evidence from Related-Party Sales Transactions
in China’, Journal of Corporate Finance, Vol. 16, pp. 225–235.
McConnell, J.J. and C.J. Muscarella (1985), ‘Corporate Capital Expenditure Decisions and
the Market Value of the Firm’, Journal of Financial Economics, Vol. 14, No. 3, pp. 399–422.
McNichols, M. and S. Stubben (2008), ‘Does Earnings Management Affect Firms’
Investment Decisions?’, Accounting Review, Vol. 83, pp. 1571-1603.
Mercer, M. (2004), ‘How Do Investors Assess the Credibility of Management Disclosures?’,
Accounting Horizons, Vol. 18, No. 3, pp. 185-196.
Merkl-Davies, D.M. and N.M. Brennan (2007), ‘Discretionary Disclosure Strategies in
Corporate Narratives: Incremental Information or Impression Management?’, Journal of
Accounting Literature, Vol. 26, pp. 116-194.
Milgrom, P. (1981). ‘Good News and Bad News: Representation Theorems and Applications’,
Bell Journal of Economics, Vol. 17, pp. 18–32.
Modigliani, F. and M. Miller (1958), ‘The Cost of Capital, Corporation Finance, and the
Theory of Investment’, American Economic Review, Vol. 48, pp. 261–297.
Morck, R., B. Yeung and W. Yu (2000), ‘The Information Content of Stock Markets: Why Do
Emerging Markets Have Synchronous Stock Price Movements?’, Journal of Financial
Economics, Vol. 59, pp. 215–60.
Muslu, V., S. Radhakrishnan, K.R. Subramanyam and D. Lim (2014), ‘Forward-Looking
MD&A Disclosures and the Information Environment’, Management Science, forthcoming.
Orens, R., W. Aerts and D. Cormier (2010), ‘Web-Based Non-Financial Disclosure and Cost
of Finance’, Journal of Business Finance & Accounting, Vol. 37, No. 9-10, pp. 1057–1093.

42
Piotroski, J.D. and T.J. Wong (2011), ‘Institutions and Information Environment of Chinese
Listed Firms’, NBER Working Paper. Rajan, R.G. and L. Zingales (1998), ‘Financial
Dependence and Growth’, American Economic Review, Vol. 88, No. 3, pp. 559–586.
Richardson, S. (2006), ‘Over-Investment of Free Cash Flow’, Review of Accounting Studies,
Vol. 11, pp. 159-189.
Shanghai Stock Exchange (2006), ‘State-owned Controlling Shareholders and Listed
Companies’, China Corporate Governance Report (2006): The Corporate Governance of
State Holding Listed Companies, Shanghai: Fudan University Press, 27–41(in Chinese).
Shleifer, A. (2005), ‘Understanding Regulation’, European Financial Management, Vol. 11,
pp. 439– 451.
Shleifer, A. and R. Vishny (1997), ‘A Survey of Corporate Governance’, Journal of Finance,
Vol. 52, No. 2, pp. 737-783.
Shroff et, N., R.S. Verdi and G. Yu (2014), ‘Information Environment and the Investment
Decisions of Multinational Corporations’, Accounting Review, Vol. 89, No. 2, pp. 759-790.
Simpson, A. (2010), ‘Analysts’ Use of Nonfinancial Information Disclosures’, Contemporary
Accounting Research, Vol. 27, No. 1, pp. 249-288
Standard & Poor’s (2009a), ‘Country Governance Study – Corporate Governance in China’
(www.standardandpoors.com).
Standard & Poor’s (2009b), ‘S&P Transparency and Disclosure Survey by Chinese
Companies 2008’ (www.standardandpoors.com).
Stein, J. (2003), ‘Agency, Information and Corporate Investment’, in G. Constantinides, M.
Harris and R. Stulz (eds.), Handbook of the Economics of Finance (Boston:
Elsevier/North-Holland), pp. 111-165.
Sun, Q. and W. Tong (2003), ‘China Share Issue Privatization: The Extent of Its Success’,
Journal of Financial Economics, Vol. 70, No. 1, pp. 183–222.
Tang, Y., P. Lu and X. Cheng (2008), ‘Counterbalancing of Majority Shareholders,
Governance Strategy, and Information Disclosure’, Economic Research Quarterly, Vol. 2, pp.
647-664 (in Chinese).
Tan, S-K. and L. Koonce (2011), ‘Investors’ Reactions to Retractions and Corrections of
Management Earnings Forecasts’, Accounting, Organizations and Society, Vol. 36, No. 6, pp.
382-397.
Verdi, R.S. (2006), ‘Financial Reporting Quality and Investment Efficiency’, SSRN Working
Paper (http://ssrn.com/abstract=930922).
Verrecchia, R. (2001), ‘Essays on Disclosure’, Journal of Accounting and Economics, Vol.
32, pp. 97-180.
Wang, M. And K. Hussainey (2013), ’Voluntary Forward-Looking Statements Driven by
Corporate Governance and Their Value Relevance’, Journal of Accounting and Public Policy,
Vol. 32, pp. 26-49.
Wurgler, J. (2000), ‘Financial Markets and the Allocation of Capital’, Journal of Financial
Economics, Vol. 58, pp. 187-214.
Xie, B., W.N. Davidson and P.J. DaDalt (2003), ‘Earnings Management and Corporate
Governance: The Roles of the Board and the Audit Committee’, Journal of Corporate
Finance, Vol. 9, pp. 295-316.
Xu, X. and Wang, Y. (1997), ‘Ownership Structure, Corporate Governance, and Corporate

43
Performance: The Case of Chinese Stock Companies’, Policy Research Working Paper 1794,
The World Bank, Economic Development Institute, Office of Director, Washington DC.
Yiu, D., G.D. Bruton and Y. Lu (2005), ‘Understanding Business Group Performance in An
Emerging Economy: Acquiring Resources and Capabilities in Order to Prosper’, Journal of
Management Studies, Vol. 42, No. 1, pp. 183-206.
Yue, C. and C. Wang (2006), ‘Development of Regulation Theory and Choice of Securities
Regulation System’, Modern Jurisprudence, Vol. 2, pp. 116-123 (in Chinese).
Zhong, H, W. Zhang and C. Zhang (2011), ‘Annual Report on Non-financial Information
Disclosure of Chinese Listed Companies (2011)’, Beijing: Social Sciences Publishing House
(in Chinese).
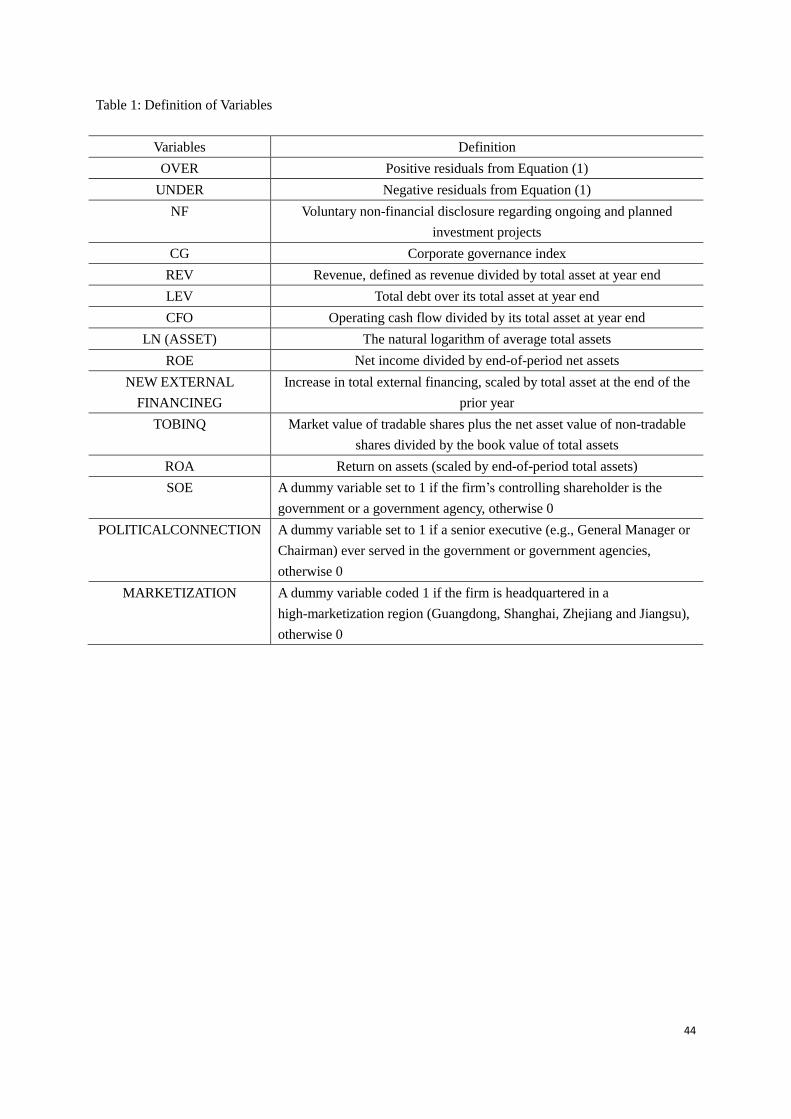
44
Table 1: Definition of Variables
Variables Definition
OVER Positive residuals from Equation (1)
UNDER Negative residuals from Equation (1)
NF Voluntary non-financial disclosure regarding ongoing and planned
investment projects
CG Corporate governance index
REV Revenue, defined as revenue divided by total asset at year end
LEV Total debt over its total asset at year end
CFO Operating cash flow divided by its total asset at year end
LN (ASSET) The natural logarithm of average total assets
ROE Net income divided by end-of-period net assets
NEW EXTERNAL
FINANCINEG
Increase in total external financing, scaled by total asset at the end of the
prior year
TOBINQ Market value of tradable shares plus the net asset value of non-tradable
shares divided by the book value of total assets
ROA Return on assets (scaled by end-of-period total assets)
SOE A dummy variable set to 1 if the firm’s controlling shareholder is the
government or a government agency, otherwise 0
POLITICALCONNECTION
A dummy variable set to 1 if a senior executive (e.g., General Manager or
Chairman) ever served in the government or government agencies,
otherwise 0
MARKETIZATION
A dummy variable coded 1 if the firm is headquartered in a
high-marketization region (Guangdong, Shanghai, Zhejiang and Jiangsu),
otherwise 0

45
Table 2: Summary and Descriptive Statistics
Panel A. Time variation of voluntary non-financial disclosure and new external financing
Year Mean value of NF
(standard deviation of NF)
Mean value of New External Financing
(standard deviation of New External Financing)
2007 0.571 (0.103) 0.271 (0.197)
2008 0.570 (0.135) 0.283 (0.210)
2009 0.580 (0.118) 0.285 (0.212)
2010 0.488 (0.144) 0.260 (0.209)
2011 0.502 (0.124) 0.264 (0.216)
Panel B. Summary statistics for the under-investment sub-sample
Variable Minimum Maximum Mean Median St. deviation
UNDER -0.11 0.00 -0.03 -0.02 0.02
NF 0.06 0.63 0.36 0.31 0.09
CG -0.03 0.04 0.00 -0.00 0.02
LN (ASSET) 16.52 26.41 21.74 21.68 1.23
CFO -0.20 0.27 0.02 0.01 0.07
ROE -1.11 0.51 0.05 0.06 0.19
LEV 0.08 1.03 0.53 0.53 0.20
REV 0.05 2.98 0.73 0.61 0.54
N 3262
Panel C. Summary statistics for the over-investment sub-sample
Variable Minimum Maximum Mean Median St. deviation
OVER 0.00 0.23 0.05 0.04 0.05
NF 0.06 0.63 0.37 0.38 0.08
CG -0.15 0.18 0.00 -0.00 0.02
LN (ASSET) -9.21 26.85 21.88 21.81 1.38
CFO -0.20 0.27 0.012 0.01 0.07
ROE -1.11 0.51 0.06 0.07 0.16
LEV 0.08 1.03 0.53 0.54 0.18
REV 0.05 2.98 0.71 0.60 0.52
N 1883

46
Panel D. Pearson correlation coefficients for the under-investment sub-sample
UNDER NF CG
LN
(ASSET) CFO ROE LEV REV
UNDER 1
NF 0.04** 1
CG 0.11*** 0.03* 1
LN
(ASSET) 0.17***
0.12*
**
0.24*
** 1
CFO 0.02 0.03* 0.01 0.06*** 1
ROE 0.05*** 0.02
0.06*
** 0.19***
0.15*
** 1
LEV 0.08*** 0.02 0.03 0.21***
-0.04*
*
-0.15*
** 1
REV 0.09***
0.04*
*
0.048
** 0.07***
0.04*
*
0.10*
**
0.11*
** 1
Panel E. Pearson correlation coefficients for the over-investment sub-sample
OVER NF CG
LN
(ASSET) CFO ROE LEV REV
OVER 1
NF 0.01 1
CG -0.10*** 0.05** 1
LN
(ASSET)
0.01 0.07*** 0.19*** 1
CFO 0.05** 0.02 -0.01 0.08*** 1
ROE 0.05** 0.02 0.07*** 0.21*** 0.10*** 1
LEV 0.01 0.03 0.05** 0.22*** -0.01 -0.17*** 1
REV -0.10*** 0.01 0.05** -0.01 -0.03 0.13*** 0.02 1
***, **, * significant at the 0.01, 0.05 and 0.10 levels, respectively (two-tailed test). Please see Table 1 for
definition of the other variables.

47
Table 3: Investment Efficiency and Voluntary Non-financial Disclosure
Panel A. Whole sample
Dependent Variable: UNDER Dependent Variable: OVER
Coef. t Coef. t
NF 0.0045 1.45 -0.0060 -0.43
LN (ASSET) 0.0025*** 9.88 -0.0003 -0.37
LEV -0.0043*** -3.07 0.0190*** 2.77
REV 0.0023*** 4.26 -0.0176*** -7.24
ROE 0.0009 0.64 0.0137 1.63
CFO -0.0039 -1.08 -0.0347** -2.31
_cons -0.0814*** -14.93 0.0540*** 2.85
YEAR Yes Yes
INDUSTRY Yes Yes
F Value 44.52 6.82
Adjusted R2 0.2189 0.0609
N 3262 1883
Panel B. Under-investment sub-sample
Dependent Variable: UNDER
Strong corporate governance firms Weak corporate governance firms
Coef. t Coef. t
NF 0.0106** 2.22 0.0007 0.17
t-statistic for test of equality in coefficient:[2.26]b
LN (ASSET) 0.0022*** 5.80 0.0026*** 7.59
LEV -0.0042* -1.95 -0.0038** -2.13
REV 0.0023*** 2.94 0.0016** 2.17
ROE 0.0000 -0.01 0.0015 0.82
CFO 0.0035 -0.66 0.0038 -0.78
_cons -0.0805*** -9.63 -0.0811*** -10.91
YEAR Yes Yes
INDUSTRY Yes Yes
F Value 29.25*** 18.71***
Adjusted R2 0.2668 0.1857
N 1631 1631

48
Panel C. Over-investment sub-sample
Dependent Variable: OVER
Strong corporate governance firms Weak corporate governance firms
Coef. t Coef. t
NF -0.0397** -2.26 0.0303 1.42
t-statistic for test of equality in coefficient: [3.35]a
LN (ASSET) 0.0021* 1.78 -0.0006 -0.52
LEV 0.0224*** 2.66 0.0159 1.52
REV -0.0183*** -6.19 -0.0153*** -3.95
ROE 0.0154 1.36 0.0171 1.41
CFO 0.0441** -2.38 0.0358 -1.56
_cons 0.0040 0.15 0.0492* 1.79
YEAR Yes Yes
INDUSTRY Yes Yes
F Value 3.64*** 4.94***
Adjusted R2 0.0556 0.0810
N 942 941
*, **, *** Significant at the 10%, 5%, 1% levels (two-tailed test). a, b, c Significant at the 1%, 5%, 10%
levels (one-tailed). Strong (weak) corporate governance firms are those with above (below) median
corporate governance index value. T-statistic for test of equality in coefficient refers to t-statistic for test of
equality in the coefficient on NF between the strong corporate governance and the weak corporate
governance firms. Please see Table 1 for definition of variables.
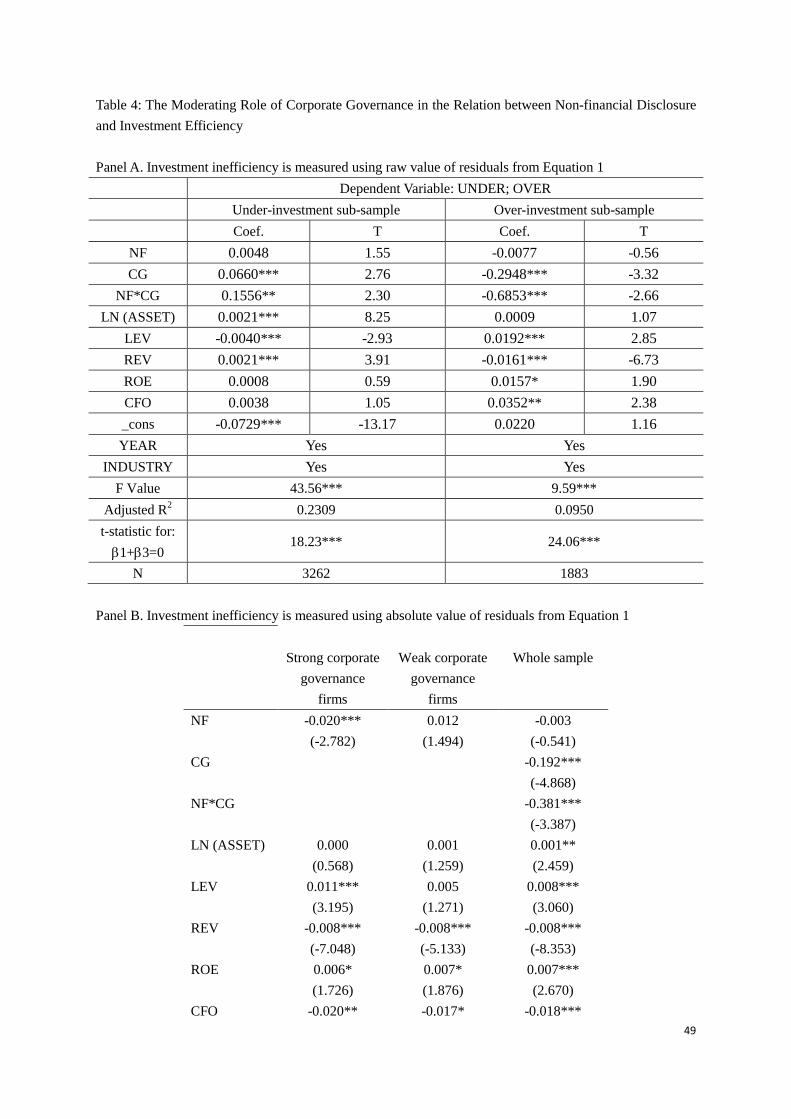
49
Table 4: The Moderating Role of Corporate Governance in the Relation between Non-financial Disclosure
and Investment Efficiency
Panel A. Investment inefficiency is measured using raw value of residuals from Equation 1
Dependent Variable: UNDER; OVER
Under-investment sub-sample Over-investment sub-sample
Coef. T Coef. T
NF 0.0048 1.55 -0.0077 -0.56
CG 0.0660*** 2.76 -0.2948*** -3.32
NF*CG 0.1556** 2.30 -0.6853*** -2.66
LN (ASSET) 0.0021*** 8.25 0.0009 1.07
LEV -0.0040*** -2.93 0.0192*** 2.85
REV 0.0021*** 3.91 -0.0161*** -6.73
ROE 0.0008 0.59 0.0157* 1.90
CFO 0.0038 1.05 0.0352** 2.38
_cons -0.0729*** -13.17 0.0220 1.16
YEAR Yes Yes
INDUSTRY Yes Yes
F Value 43.56*** 9.59***
Adjusted R2 0.2309 0.0950
t-statistic for:
1+3=0 18.23*** 24.06***
N 3262 1883
Panel B. Investment inefficiency is measured using absolute value of residuals from Equation 1
Strong corporate
governance
firms
Weak corporate
governance
firms
Whole sample
NF -0.020*** 0.012 -0.003
(-2.782) (1.494) (-0.541)
CG -0.192***
(-4.868)
NF*CG -0.381***
(-3.387)
LN (ASSET) 0.000 0.001 0.001**
(0.568) (1.259) (2.459)
LEV 0.011*** 0.005 0.008***
(3.195) (1.271) (3.060)
REV -0.008*** -0.008*** -0.008***
(-7.048) (-5.133) (-8.353)
ROE 0.006* 0.007* 0.007***
(1.726) (1.876) (2.670)
CFO -0.020** -0.017* -0.018***

50
(-2.552) (-1.827) (-2.968)
_cons 0.030*** 0.015 0.012
(2.620) (1.200) (1.386)
N 2571 2574 5145
Adjusted R2 0.084 0.071 0.098
*, **, *** Significant at the 10%, 5%, 1% levels (two-tailed test). Please see Table 1 for definition of
variables.

51
Table 5: Relation between Voluntary Non-financial Disclosure and Investment Efficiency by Ownership
Type
Panel A. Under-investment sub-sample
SOEs NSOEs
Coef. t Coef. t
NF 0.0085** 2.03 -0.0006 -0.12
t-statistic for test of equality in coefficient: [1.58]c
LN (ASSET) 0.0024*** 7.10 0.0026*** 6.55
LEV -0.0032* -1.71 -0.0061*** -2.89
REV 0.0026*** 3.78 0.0020** 2.28
ROE 0.0018 0.97 -0.0002 -0.10
CFO 0.0025 0.51 0.0053 1.02
_cons -0.0843*** -11.28 -0.0789*** -9.28
YEAR Yes Yes
INDUSTRY Yes Yes
F Value 27.10*** 20.31***
Adjusted R2 0.2061 0.2516
N 2112 1150
Panel B. Over-investment sub-sample
SOEs NSOEs
Coef. t Coef. t
NF -0.0339** -2.02 0.0369 1.45
t-statistic for test of equality in coefficient: [-1.71]b
LN (ASSET) -0.0010 -1.06 0.0007 0.41
LEV 0.0182** 2.11 0.0216* 1.91
REV -0.0202*** -6.86 -0.0124*** -2.74
ROE 0.0162 1.56 0.0077 0.53
CFO 0.0491** 2.52 0.0139 0.60
_cons 0.0855*** 3.78 0.0120 0.31
YEAR Yes Yes
INDUSTRY Yes Yes
F Value 5.64*** 2.04***
Adjusted R2 0.0705 0.0341
N 1289 594
*, **, *** Significant at the 10%, 5%, 1% levels (two-tailed test). a, b, c Significant at the 1%,5%,10%
level (one-tailed). T-statistic for test of equality in coefficient refers to t-statistic for test of equality in the
coefficient on NF between the SOEs and the NSOEs. Please see Table 1 for definition of variables.

52
Table 6: The Moderating Role of Corporate Governance in the Relation between Non-financial Disclosure
and Investment Efficiency by Ownership Type
Panel A. Under-investment sub-sample
Dependent Variable: UNDER
SOEs NSOEs
Coef. T Coef. T
NF 0.0077* 1.83 0.0017 0.38
CG 0.0437 1.16 0.0940*** 2.99
NF*CG 0.1847* 1.81 0.1886* 1.93
t-statistic for test of equality in coefficient: [-0.02]
LN (ASSET) 0.0022*** 6.46 0.0021*** 5.22
LEV -0.0028 -1.48 -0.0066*** -3.18
REV 0.0024*** 3.48 0.0022** 2.50
ROE 0.0017 0.93 -0.0008 -0.40
CFO 0.0021 0.43 0.0055 1.07
_cons -0.0794*** -10.58 -0.0680*** -7.87
YEAR Yes Yes
INDUSTRY Yes Yes
F Value 26.18*** 20.26***
Adjusted R2 0.2153 0.2694
t-statistic for:
1+3=0 9.59*** 11.45***
N 2112 1150
Panel B. Over-investment sub-sample
Dependent Variable: OVER
SOEs NSOEs
Coef. T Coef. T
NF -0.0332** -2.00 0.0290 1.15
CG -0.4137*** -3.21 -0.3602*** -2.80
NF*CG -0.1920 -0.49 -0.7763** -2.08
t-statistic for test of equality in coefficient: [1.67]b
LN (ASSET) 0.0000 -0.02 0.0018 1.02
LEV 0.0155* 1.82 0.0242** 2.19
REV -0.0191*** -6.56 -0.0118*** -2.65
ROE 0.0167 1.63 0.0164 1.15
CFO 0.0434** 2.27 0.0210 0.92
_cons 0.0601*** 2.66 -0.0176 -0.46
YEAR Yes Yes
INDUSTRY Yes Yes

53
F Value 7.16 3.25***
Adjusted R2 0.0993 0.0774
t-statistic for:
1+3=0 4.25** 12.89***
N 1289 594
*, **, *** Significant at the 10%, 5%, 1% levels (two-tailed test). T-statistic for test of equality in
coefficient refers to t-statistic for test of equality in the coefficient on NF*CG between the SOEs and the
NSOEs. Please see Table 1 for definition of variables.

54
Table 7: Relation between Voluntary Non-financial Disclosure and Investment Efficiency by Regional
Market Development
Panel A. Under-investment sub-sample
High-marketization Firms Low-marketization Firms
Coef. t Coef. t
NF 0.0046 1.04 0.0048 1.11
t-statistic for test of equality in coefficient: [-0.14]
LN (ASSET) 0.0019*** 4.78 0.0028*** 8.52
LEV -0.0045** -1.98 -0.0046*** -2.59
REV 0.0009 1.05 0.0031*** 4.48
ROE 0.0024 0.74 0.0004 0.24
CFO 0.0052 0.92 0.0031 0.66
_cons -0.0659*** -7.83 -0.0899*** -12.56
YEAR Yes Yes
INDUSTRY Yes Yes
F Value 21.67*** 24.85***
Adjusted R2 0.2715 0.1929
N 1166 2096
Panel B. Over-investment sub-sample
High-marketization Firms Low-marketization Firms
Coef. t Coef. t
NF 0.0006 0.02 -0.0086 -0.49
t-statistic for test of equality in coefficient: [0.02]
LN (ASSET) 0.0023 1.26 -0.0010 -1.05
LEV -0.0082 -0.63 0.0304*** 3.68
REV -0.0212*** -4.75 -0.0165*** -5.64
ROE -0.0013 -0.06 0.0177* 1.92
CFO 0.0285 0.99 0.0394** 2.21
_cons 0.0024 0.06 0.0715*** 3.23
YEAR Yes Yes
INDUSTRY Yes Yes
F Value 3.28*** 4.60***
Adjusted R2 0.0715 0.0554
N 593 1290
*, **, *** Significant at the 10%, 5%, 1% levels (two-tailed test). a, b, c Significant at the 1%,5%,10%
level (one-tailed). T-statistic for test of equality in coefficient refers to t-statistic for test of equality in the
coefficient on NF between the high-marketization firms and the low-marketization firms. Please see Table
1 for definition of variables.

55
Table 8: The Moderating Role of Corporate Governance in the Relation between Non-financial Disclosure
and Investment Efficiency by Marketization Level
Panel A. Under-investment sub-sample
Dependent Variable: UNDER
High-marketization Firms Low-marketization Firms
Coef. t Coef. t
NF 0.0045 1.04 0.0055 1.29
CG 0.0404 1.21 0.0723** 2.12
NF*CG 0.1507 1.61 0.1713* 1.76
t-statistic for test of equality in coefficient: [-0.10]
LN (ASSET) 0.0017*** 4.27 0.0023*** 6.78
LEV -0.0042* -1.85 -0.0043** -2.48
REV 0.0007 0.89 0.0029*** 4.18
ROE 0.0021 0.65 0.0004 0.25
CFO 0.0053 0.95 0.0026 0.57
_cons -0.0615*** -7.28 -0.0787*** -10.70
YEAR Yes Yes
INDUSTRY Yes Yes
F Value 20.65*** 24.55***
Adjusted R2 0.2795 0.2054
t-statistic for: 1+3=0 6.88*** 10.89***
N 1166 2096
Panel B. Over-investment sub-sample
Dependent Variable: OVER
High-marketization Firms Low-marketization Firms
Coef. t Coef. t
NF -0.0130 -0.56 -0.0033 -0.19
CG -0.3235*** -2.81 -0.3216** -2.23
NF*CG -0.6702* -1.86 -0.6506* -1.65

56
t-statistic for test of equality in coefficient: [-0.02]
LN (ASSET) 0.0031* 1.77 0.0002 0.23
LEV -0.0101 -0.79 0.0317*** 3.89
REV -0.0189*** -4.32 -0.0152*** -5.26
ROE 0.0013 0.06 0.0198** 2.19
CFO 0.0224 0.80 0.0408** 2.32
_cons -0.0160 -0.42 0.0352 1.56
YEAR Yes Yes
INDUSTRY Yes Yes
F Value 4.63*** 6.14***
Adjusted R2 0.1189 0.0841
t-statistic for: 1+3=0 11.25*** 11.44***
N 593 1290
*, **, *** Significant at the 10%, 5%, 1% levels (two-tailed test). T-statistic for test of equality in
coefficient refers to t-statistic for test of equality in the coefficient on NF*CG between the
high-marketization firms and the low-marketization firms. Please see Table 1 for definition of variables.

57
Table 9: Baseline Regression after Controlling for Potential Endogeneity
Panel A. Determinants of voluntary non-financial disclosure (NF)
Coef. t-statistic
LN (ASSET)t-1 0.003** 2.401
NEW EXTERNAL FINANCING t-1 -0.008 -0.889
NEW EXTERNAL FINANCING t 0.016* 1.705
NEW EXTERNAL FINANCING t+1 0.018** 2.240
TOBINQ t-1 -0.004** -2.562
TOBINQ t -0.001 -0.415
TOBINQ t+1 -0.002* -1.691
LEV t-1 -0.000 -1.150
ROA t-1 0.000 1.018
ROA t 0.001*** 3.555
ROA t+1 0.000 1.609
SOE t-1 0.002 0.890
POLITICALCONNECTION t-1 -0.006** -2.475
MARKETIZATION t-1 -0.001 -0.232
YEAR
INDUSTRY
YES
YES
_cons 0.269*** 8.549
F Value
Adjusted R2
N
22.70
0.115
5145
Panel B. Baseline regression using abnormal non-financial disclosure (ANF)
Dependent Variable: UNDER; OVER
UNDER OVER
Coef. t Coef. T
ANF 0.005 1.620 -0.009 -0.630
CG 0.058** 2.360 -0.296*** -3.410
ANF*CG 0.170** 2.480 -0.658*** -2.600
OTHER CONTROLS YES YES
F Value 42.95*** 9.72***
Adjusted R2 0.2292 0.0956
t-statistic for: 1+3=0 6.48** 6.86***
N 3262 1883
*, **, *** Significant at the 10%, 5%, 1% levels (two-tailed test). Please see Table 1 and the text for
definition of variables.

58
Table 10: Baseline Regression after Controlling for Financial Information Quality
Dependent variable: UNDER Dependent variable: OVER
Coef. t Coef. t
NF 0.0048 1.55 -0.0076 -0.55
CG 0.0673*** 2.82 -0.2955*** -3.33
NF* CG 0.1554** 2.30 -0.6716*** -2.61
DA -0.0033** -2.40 0.0148** 2.41
OTHER CONTROLS YES YES
F Value 42.04*** 9.44***
Adjusted R2 0.2320 0.0972
t-statistic for: 1+3=0 18.43*** 23.46***
N 3262 1883
*, **, *** Significant at the 10%, 5%, 1% levels (two-tailed test). DA denotes discretionary accruals (a
larger value indicates lower financial information quality). Please see Table 1 for definition of variables.

59
Table 11: Baseline Regression Using Number of Sentences to Measure Non-financial Information
Disclosure
Dependent variable: UNDER Dependent variable: OVER
Coef. t Coef. t
NF 0.0006 0.93 0.0001 0.91
CG 0.0149 0.32 -0.1021 -0.75
NF* CG 0.0334** 2.07 -0.1602*** -3.55
OTHER CONTROLS YES YES
F Value 43.19*** 10.86***
Adjusted R2 0.2297 0.1073
t-statistic for: 1+3=0 2.23 7.70***
N 3262 1883
***, **, * Significant at the 0.01, 0.05 and 0.10 levels, respectively (two-tailed test). Please see Table 1 for
definition of variables.
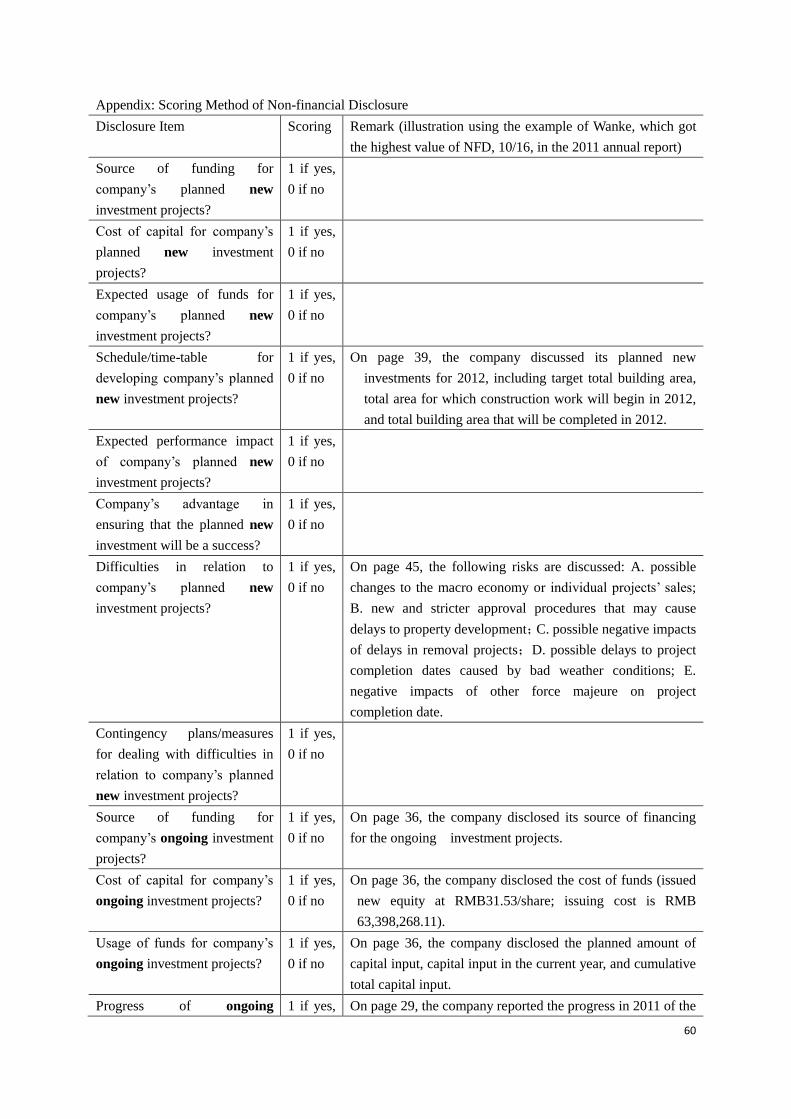
60
Appendix: Scoring Method of Non-financial Disclosure
Disclosure Item Scoring Remark (illustration using the example of Wanke, which got
the highest value of NFD, 10/16, in the 2011 annual report)
Source of funding for
company’s planned new
investment projects?
1 if yes,
0 if no
Cost of capital for company’s
planned new investment
projects?
1 if yes,
0 if no
Expected usage of funds for
company’s planned new
investment projects?
1 if yes,
0 if no
Schedule/time-table for
developing company’s planned
new investment projects?
1 if yes,
0 if no
On page 39, the company discussed its planned new
investments for 2012, including target total building area,
total area for which construction work will begin in 2012,
and total building area that will be completed in 2012.
Expected performance impact
of company’s planned new
investment projects?
1 if yes,
0 if no
Company’s advantage in
ensuring that the planned new
investment will be a success?
1 if yes,
0 if no
Difficulties in relation to
company’s planned new
investment projects?
1 if yes,
0 if no
On page 45, the following risks are discussed: A. possible
changes to the macro economy or individual projects’ sales;
B. new and stricter approval procedures that may cause
delays to property development;C. possible negative impacts
of delays in removal projects;D. possible delays to project
completion dates caused by bad weather conditions; E.
negative impacts of other force majeure on project
completion date.
Contingency plans/measures
for dealing with difficulties in
relation to company’s planned
new investment projects?
1 if yes,
0 if no
Source of funding for
company’s ongoing investment
projects?
1 if yes,
0 if no
On page 36, the company disclosed its source of financing
for the ongoing investment projects.
Cost of capital for company’s
ongoing investment projects?
1 if yes,
0 if no
On page 36, the company disclosed the cost of funds (issued
new equity at RMB31.53/share; issuing cost is RMB
63,398,268.11).
Usage of funds for company’s
ongoing investment projects?
1 if yes,
0 if no
On page 36, the company disclosed the planned amount of
capital input, capital input in the current year, and cumulative
total capital input.
Progress of ongoing 1 if yes, On page 29, the company reported the progress in 2011 of the
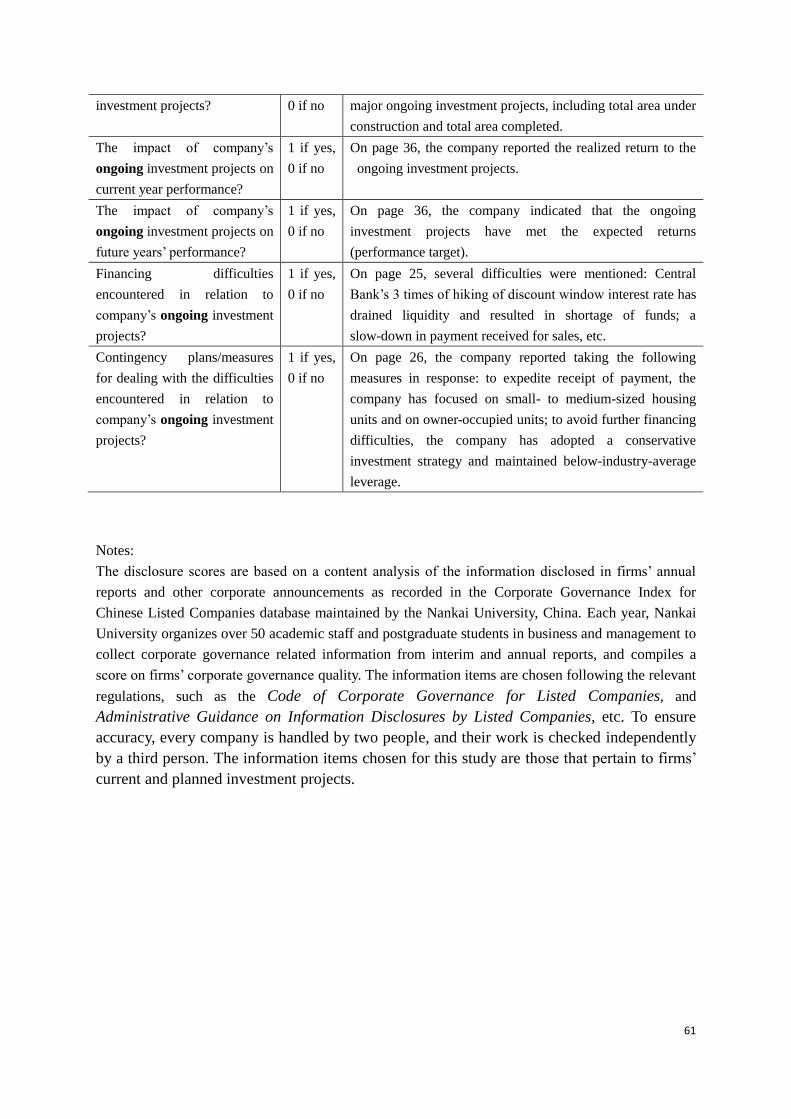
61
investment projects? 0 if no major ongoing investment projects, including total area under
construction and total area completed.
The impact of company’s
ongoing investment projects on
current year performance?
1 if yes,
0 if no
On page 36, the company reported the realized return to the
ongoing investment projects.
The impact of company’s
ongoing investment projects on
future years’ performance?
1 if yes,
0 if no
On page 36, the company indicated that the ongoing
investment projects have met the expected returns
(performance target).
Financing difficulties
encountered in relation to
company’s ongoing investment
projects?
1 if yes,
0 if no
On page 25, several difficulties were mentioned: Central
Bank’s 3 times of hiking of discount window interest rate has
drained liquidity and resulted in shortage of funds; a
slow-down in payment received for sales, etc.
Contingency plans/measures
for dealing with the difficulties
encountered in relation to
company’s ongoing investment
projects?
1 if yes,
0 if no
On page 26, the company reported taking the following
measures in response: to expedite receipt of payment, the
company has focused on small- to medium-sized housing
units and on owner-occupied units; to avoid further financing
difficulties, the company has adopted a conservative
investment strategy and maintained below-industry-average
leverage.
Notes:
The disclosure scores are based on a content analysis of the information disclosed in firms’ annual
reports and other corporate announcements as recorded in the Corporate Governance Index for
Chinese Listed Companies database maintained by the Nankai University, China. Each year, Nankai
University organizes over 50 academic staff and postgraduate students in business and management to
collect corporate governance related information from interim and annual reports, and compiles a
score on firms’ corporate governance quality. The information items are chosen following the relevant
regulations, such as the Code of Corporate Governance for Listed Companies, and
Administrative Guidance on Information Disclosures by Listed Companies, etc. To ensure
accuracy, every company is handled by two people, and their work is checked independently
by a third person. The information items chosen for this study are those that pertain to firms’
current and planned investment projects.


