

Walter WeirChief Information OfficerUniversity of NebraskaCopyright Walter Weir, 2001. This work is the intellectual property of the author. Permission is granted for this material to be shared for non-commercial, educational purposes, provided that this copyright appears on the reproduced materials and notice is given that the copying is by permission of the author. To disseminate otherwise or to republish requires written permission from the author.
“Doing the Right Things Right”
or should I say
“Let’s do more things right than wrong”

University of Nebraska Key Facts
Four campuses
– UNL
– UNO
– UNMC
– UNK
Approx 50,000 students
1.2 Billion dollar budget

Administrative•SAP•SIS•Budget•Facilities•Institutional Research•Foundation•Data Warehouse
Academic•Eduport•Lotus Notes•Distance Learning
•Development•Delivery•Support•R&D
•Digital Library•HS On-Line•Laboratories•Networking
•Building•Wireless
Research•Internet 2•Great Plains Network•LINUX•Bio-Informatics•Super computing•Biospheric modeling
Data•Data Dictionary•Data Models•Common data definitions•Knowledge workers•Training
Network•IP Centric•ATM•State wide networking•Client Server•Middleware•Firewalls
Management•Councils•TQM•Broad banding•Planning
We Have Many Diverse Systems and Customers
How can we know what is going on
and keep EVERYONE happy?

Too often, we had to use a “gut feel” when responding to questions like:
Are we delivering projects on time and on budget? Do we have the right staff?
– Do they have the right skills?– Are the right people working on critical
initiatives? What are we spending to support our ERP solution? Are we maximizing our resources? How can we justify increased spending in IT? Do the IT initiatives support University goals?

Our Approach To Resolve This:
Build an IT Management Information System– Better information about us– Understand and quantify the work we perform
time required cost associated with the work customer satisfaction with the result
– Improve communication– Understand the ramifications of our decisions– Confident of our actions
The Focus of Our IT Management Information System Is On:
InvestmentInvestment
CommunicationCommunication
Accountability
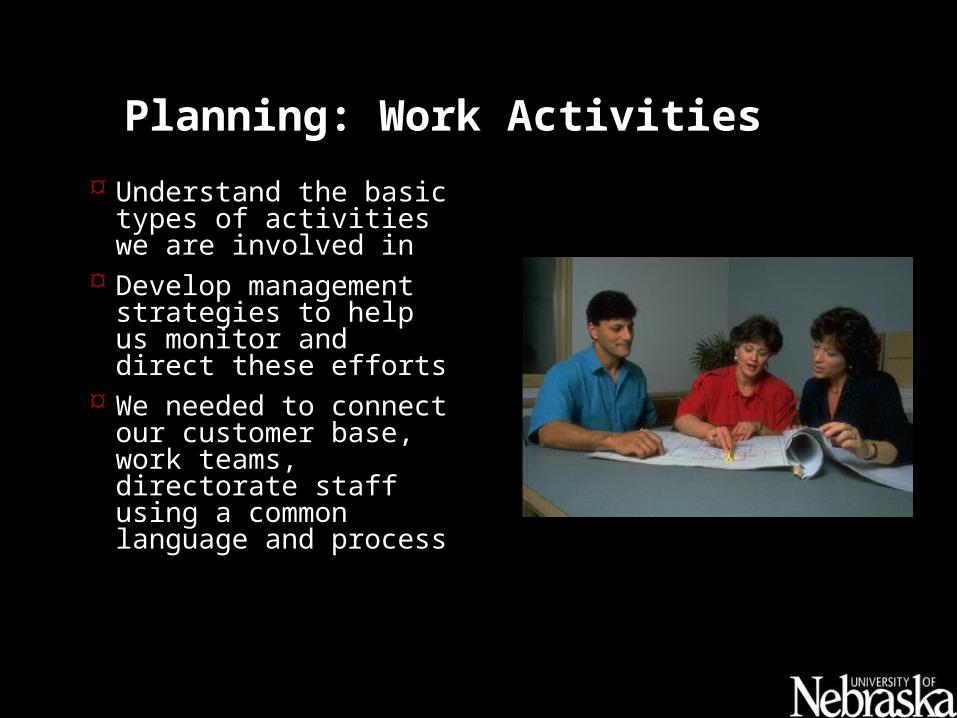
Planning: Work Activities
Understand the basic types of activities we are involved in
Develop management strategies to help us monitor and direct these efforts
We needed to connect our customer base, work teams, directorate staff using a common language and process

Work Activities: Project Types No choice - Got to do it things!
– Administrative Paper Work, Team Meetings, all efforts not associated with a
project or our product and services portfolio– Production
Care and feeding of the system; problem resolution “Emergency Response” – system is down – get it online
– Service Quick Response to End-user problems – keep them moving Course offerings; End User Support; Help desk, Production
services, Front Office, Machine Room Operations
Choice.– Enhancements
With whatever time is left, what projects should we work on that will have the best/biggest impact for the University?

Administrative Definition
– Administrative time represents hours that do not relate to a specific project or work effort. This includes such activities as attending organizational-wide or team status meetings, professional development and filling out weekly time sheets.
Management Strategies– Watch for unusually high administrative time. – Work with employees to remove excessive red tape or
bureaucracy standing in the way of progress. – 20% administrative time means that, on average, each member of
the team spends 1 day each week on activities that do not relate to a specific project, production problem or service activity.
Goal– Reduce administrative time; work with teams to stay beneath
goal.

Definition – Production activity represents a rapid response required to fix a problem,
in other words, an emergency situation. Such efforts include on-call activities, response to a system abend, working with a vendor to resolve a server error; or fixing a program that is not functioning correctly.
Management Strategies– Be on the look out for staff charging time to production when there were
no problems to resolve. – Be on the look out for Customer Support activities buried in Production.
Production activity does not include customer support unless the efforts are directly related to fixing a problem the customer identified.
– Make certain teams document each incident using c-Support.– Once each quarter, work with the team to review c-Support information.
Look for recurring problems. Consider starting enhancement projects for process improvements designed to reduce overall production activity.
Goal– Reduce production time; work with teams to identify recurring production
problems.
Production

Definition– Service activities represent a planned investment the organization makes in
aiding our internal and external customers and supporting operations.
Management Strategies– Look for buried Enhancement Projects! Review each Service project and identify
efforts that can be planned, scheduled and managed as Enhancement projects.– Make certain Service Activities are directly related to the Product and Service
Portfolio. If it doesn’t relate to a product or service, it’s most likely administrative time or it’s poorly defined.
– Make certain teams document End User support activities in c-Support.– Once each quarter, work with the team to review c-Support End User Support
information. Look for areas that the Customer Support Team can help take over this work. Look for recurring questions/issues that can be documented in the FAQ. Look for recurring problems that can be addressed as Enhancement projects.
Goal– We want to see service time stable, or changing due to changes in investment
strategies. Work with teams to meet their service goal.
Service

Definition– Enhancement time represents efforts that add to, or improve existing,
products and/or services. Enhancement projects have specific begin and end dates, deliverables and sponsors. Enhancement projects are by far the easiest efforts to monitor and evaluate.
Management Strategies– Be on the look out for “bucket” projects without specific deadlines,
deliverables or sponsors. Ask “when you have completed this effort, what will we have that we don’t have now?”
– Be on the look out for never-ending and stalled projects. – Look for too many projects with internal management sponsorship. – Work with teams to increase enhancement activities over time. – When Enhancement projects are complete: Make success visible!
Goal– Increase enhancement time; work with teams to stay above team goal.
Enhancements

Planning: The big picture
Next, we needed to plan the types of information we needed to collect for decision making and broad communication

Basic Project Information
Project Type – Is it an Administrative, Enhancement,
Production or Service activity? Project Name and Description Project Lead Start and Finish Date Team Priority
– High, Moderate or Low Project Phase
– Proposed, In Progress, On Hold, Cancelled, Complete
Time and Cost– Hours to date (regular time and overtime)– Estimated Hours Remaining– Cost (payroll expenses and overhead)

Customer Perspective Initiative
– What University Initiative does this effort support? Sponsor Area
– Who are we serving? Customer Commitment
– Are they slightly interested? Or, would they camp out with us, working right by our side to help us be successful?
Customer Base– Are we talking about helping 2 people? Or, will this effort help
thousands across each of our campuses? Estimated User Value
– Would it save a couple of keystrokes each day? Or, were we looking at freeing up millions of dollars?
Request Nature – Is this a mandated project? Or, is it an optional Customer request?
Or, is it an effort sponsored internally?

IT Perspective Alignment with IT Objectives
– How well did it fit our directions as an organization? Architectural Fit
– Will the effort make use of existing technologies? Or, are we going to have to gain additional skill and support increased diversity?
Complexity Management– Do we have the skills to work on this project and monitor success over
time? Can we monitor progress? Or, is it so complicated it is difficult to tell how well we are doing?
Funding Status– Does it require additional outlay of budget? If so, do we have the $$$?
Production and Services Readiness– Is our Customer Support Team ready to deploy the solution? Is our
Operations area ready to support the solution? Schedule Health
– On time? Within Budget? Or, is it a runaway train?

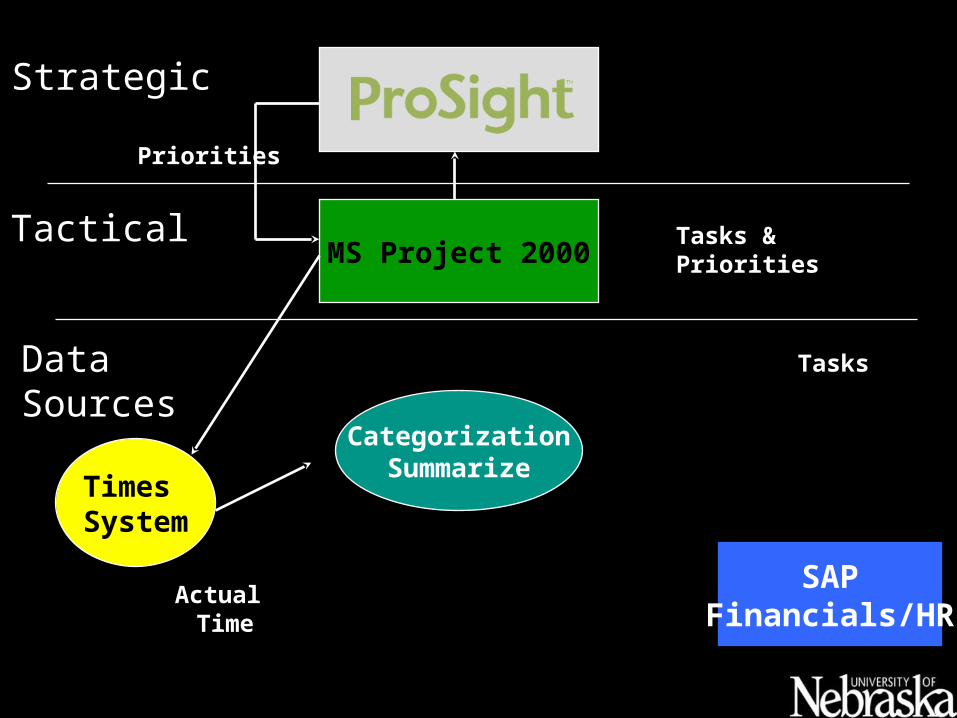
Infrastructure and ProcessInfrastructure and Process And so, with the
planning complete, we began to design and develop the technical environment needed to collect this information
Our goal was to integrate solutions available, rather than develop a “home grown” system
We worked to implement common workflow and monitoring processes

ArchitectureStrategic
Tactical
Priorities
Tasks &Priorities
Data Sources

ArchitectureStrategic
TacticalMS Project 2000
Priorities
Tasks &Priorities
Data Sources
Tasks

ArchitectureStrategic
TacticalMS Project 2000
Times System
Priorities
Actual Time
Tasks &Priorities
Data Sources
Tasks

ArchitectureStrategic
TacticalMS Project 2000
Times System
Priorities
Actual Time
Tasks &Priorities
Data Sources
SAPFinancials/HR
Tasks
ArchitectureStrategic
TacticalMS Project 2000
Times System
CategorizationSummarize
Priorities
Actual Time
Tasks &Priorities
Data Sources
SAPFinancials/HR
Tasks

ArchitectureStrategic
TacticalMS Project 2000
Times System
Data Warehouse
CategorizationSummarize
Priorities
Actual Time
Tasks &Priorities
Data Sources
SAPFinancials/HR
Tasks

ArchitectureStrategic
TacticalMS Project 2000
Times System
c-SupportGWI Help
Data Warehouse
CategorizationSummarize
Priorities
Actual Time
Tasks &Priorities
Data Sources
SAPFinancials/HR
Tasks

Workflow
Customer Request
Directorate Team
Categorize,Prioritize,
Monitor
Team AssignmentProject StatusStaff Assignment,
Work with Sponsor, Status Updates

Project Requests Project Requests and Team Assignmentsand Team Assignments
All Work Requests must be submitted from our website and are sent to the Directors
Using this form, we begin to capture information needed to describe the Customer Perspective
All requests are reviewed by the Directors and the appropriate work teams
Together each month, the directors and work teams define the team’s “three-month package” of Enhancement Projects

Scorecard Introduction
Snapshot of key variables (categories) for projects
Project listing
Key variables or “Categories”
Categories can be values and/or indicators….simples values or
calculations of other categories

Tracking Project InformationTracking Project Information Team Leads use MS Project to
define projects and track information required for reporting
Every team uses a standard template and can further exploit the environment, as needed
Custom Field definitions are used to consistently collect information and help ensure data integrity
The data is stored in a back-end database where edits are run, emailing messages when needed
Project information is extracted and combined with other data for reporting and to feed Prosight

Web ReportingWeb Reporting We hold ourselves
accountable – all of our project information is available on our public website
With a couple of points and clicks, our customers can review their projects to see our progress – we want their involvement – we want their direction
Staff use the environment to plan work activities and monitor their progress

Monthly ReportsMonthly Reports Monthly Team reports are
emailed to teams and to the directors and form the basis for productive conversations
We review actual work activities versus goals
We are beginning to find a common language; we are beginning to align our strategies with activities
We know where these are not congruent; we focus on improvements, where needed

We WANT to find and fix We WANT to find and fix problemsproblems
Where we see problems emerge, we set a goal and develop new reports to measure current status and future improvements
For example, in some areas, we found an excessive amount of Administrative Time, Professional Development and Research activities
We let teams and staff know what the goal is and how this compares to where they are at
We work together to improve; we keep the focus on the work, not on personalities and relationships
There is no consequence for initial discovery; there is consequence not to improve

We look for Problem ProjectsWe look for Problem Projects We want to find issues
EARLY before they get out of hand
We set standards; programs comb thru projects; find and report on stalled and “never ending, always used” efforts
This forms the basis for management and teams to discuss resource shortages, customer commitment issues, scope creep

We highlight successWe highlight success
One of our primary goals is to reduce Administrative time and Production activities (problem resolutions) in order to free up more time for Enhancement efforts
To encourage this, we make Enhancement Project completions visible

We plan betterWe plan better
We are doing a much better job of identifying future work activities
We work to have a good 12-month picture of known Enhancement projects defined for each team
We are now better able to determine resource needs and can position staff where needed

We look ahead and make We look ahead and make predictionspredictions
Given the projects defined, team goals and actual activities, programs make predictions regarding estimated completions.
This is included in the Monthly Team report package.
We are beginning to anticipate resource shortages or the need to find additional work well before it hits us.
Again, the directors and work teams have a common basis to discuss important matters

Prosight: Portfolio Management
With consistent workflow, data collection and common understanding in place, the information is now valuable for higher level analysis
Automated processes feed our Prosight environment.
Portfolio Management helps us to Allocate Resources in a manner consistent with the Objectives of the University
And to Demonstrate Our Value to non-technical people!

ArchitectureStrategic
TacticalMS Project 2000
Times System
c-SupportGWI Help
Data Warehouse
CategorizationSummarize
Priorities
Actual Time
Tasks &Priorities
Data Sources
SAPFinancials/HR
Tasks

How does ProSight fit in? Summarize the Detail – See the Big Picture - Strategic
– Visual presentation aids in understanding and retention. It helps to bring the story to life.
– Allows non-technical people to participate in strategy discussion—to better understand our value and the issues we face
Decision Making: view projects in new and different ways– Are we aligned with the University’s Initiatives?– Are we balancing our efforts across our various constituent
areas?– Are we aligning cost with the size of the customer base– Add resources to projects with poor schedule health and
large customer base and value– Question spending on projects at the end of their lifecycle

Scorecard Introduction
Snapshot of key variables (categories) for projects
Project listing
Key variables or “Categories”
Categories can be values and/or indicators….simples values or
calculations of other categories

IT Management can assess:• Project meets IT Requirements before committing resources• Whether or not we have resources• Whether or not we have skills• The Customer’s Commitment and the Business Value, etc.
IT MANAGEMENT
Gate Questionnaire

X-axis = Business
Value Y-axis = IT Organizations
Bubbles sized by: Actual Budget Bubbles colored
by: Health
Investor Map Introduction
Projects and Portfolios are represented by bubbles. Map shows “dynamic” view with respect to 4 variables

Have resources
Need resources
Explore Possible:• Over-Concentration in Administrative Systems• Opportunities Lost or Delays due to Insufficient Resources
STRATEGY
Objectives by Resource Availability and Health

Not so good:Low Impact / Lots of $
Good: High Impact,On-Schedule,
High Customer Value,Low Cost
Explore possible: • Why are we investing so much into projects with small customer bases? Esp. with Low Customer Value?• Scope Creep? Run-away projects?
OPERATIONAL: QUALITY
Schedule Health by Est Cust Base

Risk Impact:Function, Schedule or Cost (what’s most important to the customer)
Red: Projects withCritical Due Dates
& Poor Schedule Health
Explore possible: • Complexity Issues• Scope Creep• Resource Needs (shift resources from Functional projects to meet deadlines?)
OPERATIONAL: CAPACITY
Initiatives by Risk Impact

Don’t want to pass this line.
CSN Teams
OT %
Explore possible:• Workload Distribution Problems• Project Overload / Burnout• Manage Customer Expectations
OPERATIONAL: CAPACITY
Why so much OT for A Project with LOW Customer Value?
Org Group by Overtime Percent
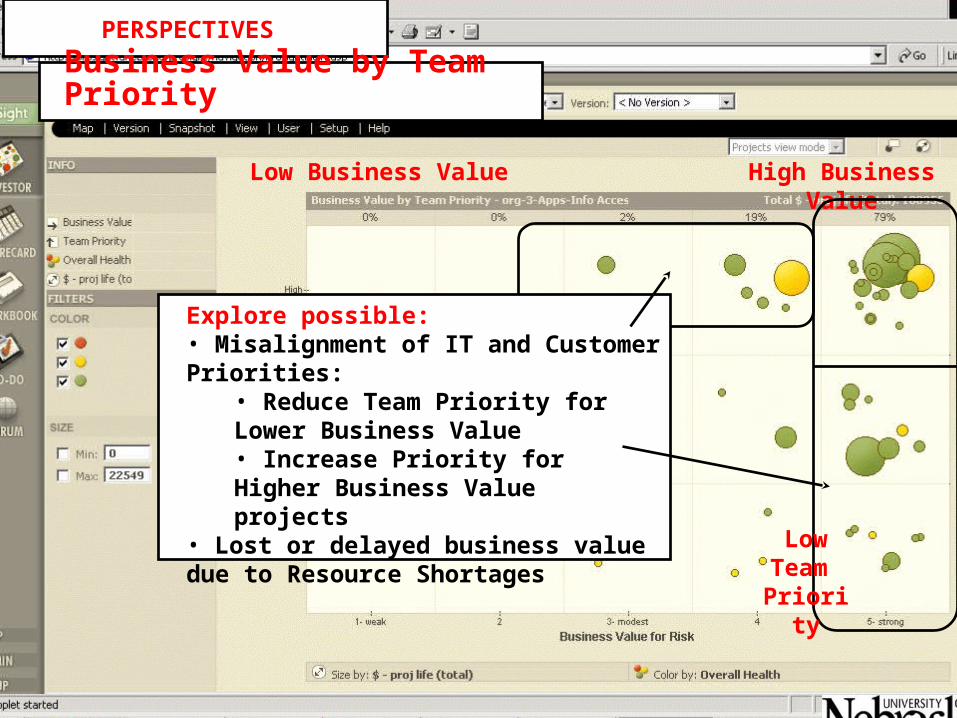
High Business Value
Explore possible: • Misalignment of IT and Customer Priorities:
• Reduce Team Priority for Lower Business Value • Increase Priority for Higher Business Value projects
• Lost or delayed business value due to Resource Shortages
PERSPECTIVES
LowTeam
Priority
Low Business Value
Business Value by Team Priority

Discoveries
Teams with weak and/or outdated missions
Duplication of effort Administrative Time
much higher than anticipated
Some Team Leads heavy into Bureaucracy
High Performers
Resource Shortages in areas we did not expect
Resources available in areas we thought we had shortages
We identify problems, we make adjustments, we move on, we look for improvements, we set expectation; we nudge; we celebrate

Lessons Learned Simplify! Define! Communicate!Analyze! Correct!
Review! Simplify! Define! Communicate!Analyze! Correct! Review!
The Discovery of a Problem must be safe– Not fixing a problem must have consequences
The path to success must be visible Fix the problem, not the data!
– Monitor closely and tighten up the system where needed
Change Management Issues are huge Regular Communication and Common Understanding is
Requisite to Continuous Improvement– And That’s a Mouthful!

Lastly
It has given us an audit We now have a better, all around, understanding
of what we do. We have a tool to help justify more resources We have a tool to kill off projects that have little to
no value We have better measurement of productivity
– Productive teams and not so productive teams; high performers and slackers
– We are more focused on working on the
““Doing the right things right”Doing the right things right”

Timeline in Months
6 3 2 2 6 1 6 21
0 6 12 18 24 30
1) Initial Planning/Prototype
2) Review/Redesign
3) Integration Development
4) Org-wide Training and Deployment
5) Collect Data 6) Audit and Adjustments
7) Continue collecting data
8) 2nd Audit
Planning and Development
Normal Operating Procedure
9) Continue…

Western Technology


