

Washington, DC office market overview
February 11, 2015

2
Source: JLL Research
Typically a durable and low volatility office market, Metro DC has experienced an unusual boom/bust cycle
Stimulus Sequestration

3
Office property clock indicates that Washington, DC is a tenant’s market
Peakingphase
Fallingphase
Risingphase
Bottomingphase
San Francisco, Silicon Valley
Boston, Denver, Los Angeles,Miami, Tampa
Cincinnati, Detroit
Phoenix, Salt Lake City
Atlanta, Orlando, Richmond
Baltimore, Washington, DC
Houston, Dallas
Austin, Pittsburgh, Portland
New JerseyChicago, Cleveland, San Diego
New York
Charlotte, Milwaukee, Philadelphia
Seattle-Bellevue
Minneapolis
Source: JLL Research
Land
lord
favo
rabl
e Tenant favorable
4
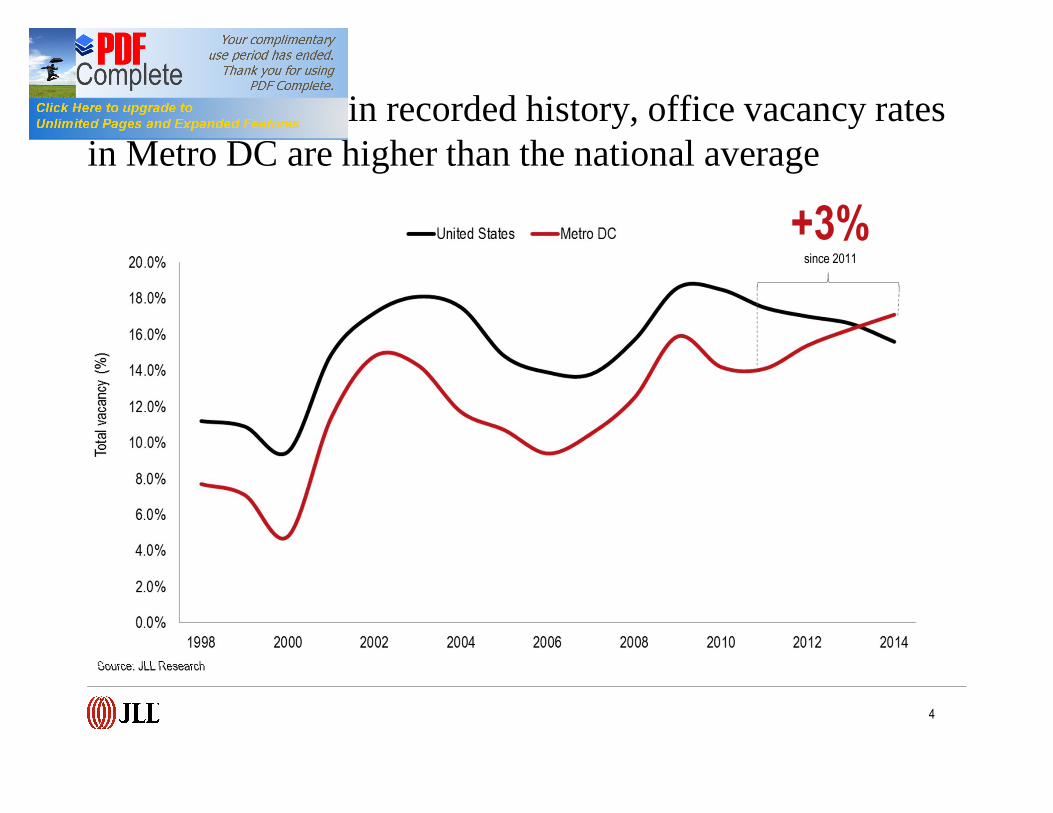
Source: JLL Research
For the first time in recorded history, office vacancy rates in Metro DC are higher than the national average
+3%since 2011

5
Inclusive of concessions, net effective rents in Washington, DC are 9.9% below 2008 peak
Annu
al %
chan
ge in
net e
ffecti
ve re
nt
2008: +0.2%
2010: +3.5%
2011: +2.3%
$$$$$$$$$$$$$$$$$$$$$$$$$$$$$$$$$$$$$$$$$$$$$$$$$$
$$$$$$$$$$$$$$$$$$$$$$$$$$$$$$$$$$$$$$$$$$$$$$$$$$$$2012: -7.7%
$$$$$$$$$$$$$$$$$$$$$$$$$$
$$
2009: -7.6%
$$2013: -0.5%
2014: -0.1% $$
Source: JLL Research

6
GSA leased inventory in National Capitol Region
Source: JLL, GSA.gov, “Renewal” includes Superseding, Succeeding and Renewal actions affecting term as defined in GSA’s 2014 Lease Inventory database; “New” includes New and New/Replacing actions affecting term; Holdover data only available back to 2011.
-54%Holdovers Extensions +37%

7
Despite potential savings, shortened lease terms have also become more prevalent in the private sector
Source: JLL Research (812 transactions; Class A, CBD and East End buildings only, excludes sublets, expansions and renewals)

8
NoMa submarket profile
• Submarket experienced unprecedented growth in 2010-2011 following the implementation of the stimulus
• Over the past three years, demand has diminished with restricted growth from the federal sector
• Two buildings remain fully-vacant post their 2013 deliveries – 1050 1st Street, NE & 175 N Street, NE
• Douglas Development will soon break ground at Uline Arena – a 200,000-square-foot adaptive reuse, which will deliver 150,000 square feet of office
Limited leasing velocity due to lack of growth from the federal sector
9.4 million s.f.Inventory
14.7%Total vacancy rate
$38.91Class B average direct asking rate
$51.62Class A average direct asking rate
6Blocks greater than 50,000 s.f.
0 s.f.Under construction
Total net absorption
Total vacancy rate
Direct average asking rent ($ p.s.f.)
Source: JLL Research

9
Southeast submarket profile
• Submarket comprised mainly of federal tenants and government contractors• Majority of office product delivered in the mid-2000’s• U.S. Department of Transportation and the Washington Navy Yard are located within
the submarket• Several large proposed development projects should significantly revitalize the
submarket – Congressional Square & The Yards• Neighborhood will continue to experience rapid retail and residential growth
Lack of contractor and GSA demand hinders growth
4.1 million s.f.Inventory
15.7%Total vacancy rate
$43.23Class B average direct asking rate
$46.13Class A average direct asking rate
4Blocks greater than 50,000 s.f.
0 s.f.Under construction
Total net absorption
Total vacancy rate
Direct average asking rent ($ p.s.f.)
Source: JLL Research

10
Southwest submarket profile
• Submarket comprised mainly of federal agencies• Likely to see space return to the market with GSA consolidation efforts• Dated, second-generation buildings increasingly finding it difficult to meet new GSA
mandates due to inefficient layouts• Trammell Crow’s 400 6th Street, NW is actively under construction and scheduled to
deliver in Q3 2015• PN Hoffman’s “The Wharf” development along the waterfront should help revitalize
the submarket
Federal enclave challenged with federal sector consolidations
12.3 million s.f.Inventory
10.8%Total vacancy rate
$46.55Class B average direct asking rate
$50.24Class A average direct asking rate
4Blocks greater than 50,000 s.f.
342,000 s.f.Under construction
Total net absorption
Total vacancy rate
Direct average asking rent ($ p.s.f.)
Source: JLL Research

11
175 N Street, NE
11 2
1050 1st Street, NE
3 4
899 N Capitol St, NE 1015 Half Street, SE
2
3
250 E Street, SW
5 6
370 L’Enfant Plaza, SW
7 8
950 L’Enfant Plaza, SW 1250 Maryland Ave, SW
4
5A
7
68
A
400 6th Street, SW
Under construction
Existing supply
Source: JLL Research
Sampling of long-term space options in government enclaves

12
Northern Virginia market profile
• Of the 23 largest leases signed in the fourth quarter, 12 were by growing tenants while only one was signed by a shrinking tenant.
• Concession packages from landlords are incentives by local government continue to grow throughout Northern Virginia. K2M received $850,000 from Virginia for its new 145,819-square-foot Leesburg headquarters. Landlords are also increasing TI packages and giving above $70.00 per square foot on a 10-year deal.
• While there is 29.9 million square feet of vacant space, much of the space is non-competitive due to changing demographic preferences and aging buildings inventory.
150.5 million s.f.Inventory
19.9%Total vacancy rate
$31.14Class B average direct asking rate
$35.85Class A average direct asking rate
108Blocks greater than 50,000 s.f.
2,138,793 s.f.Under construction
Total net absorption
Total vacancy rate
Direct average asking rent ($ p.s.f.)
Source: JLL Research
Market experiences fourth consecutive year of occupancy losses

13
Suburban Maryland market overview
• Flat federal budgets and restrained venture capital spending is unlikely to fuel significant demand
• Government contractors consolidating and downsizing as they await guidance on future levels of federal long-term spending
• Leasing activity declined 35.0 percent below the yearly average since 2000
Leasing activity sharply declines in 2014 as vacancy hits record highs
66.3 million s.f.Inventory
19.4%Total vacancy rate
$24.06Class B average direct asking rate
$29.74Class A average direct asking rate
49Blocks greater than 50,000 s.f.
605,918 s.f.Under construction
Total net absorption
Total vacancy rate
Direct average asking rent ($ p.s.f.)
Source: JLL Research

14
1. Given reduced rental rates and record-high vacancy, strong opportunities exist for federal agencies to lock in attractive deals in today’s tenant-favorable leasing environment.
2. Limited new development and private sector growth will close the window of opportunity for federal agencies to act over the next 24 months.
3. GSA should consider widening their search parameters (e.g. by including older buildings with lower ceiling heights and suburban locations in multi-jurisdictional procurements) to increase their options and build additional leverage in the marketplace.
Source: JLL Research
Conclusions and recommendations

15
This publication is the sole property of Jones Lang LaSalle IP, Inc. and must not be copied, reproduced or transmitted in any form or by any means, either in whole or in part, without the prior written consent of Jones Lang LaSalle IP, Inc. The information contained in this publication has been obtained from sources generally regarded to be reliable. However, no representation is made, or warranty given, in respect of the accuracy of this information. We would like to be informed of any inaccuracies so that we may correct them. Jones Lang LaSalle does not accept any liability in negligence or otherwise for any loss or damage suffered by any party resulting from reliance on this publication.
![presentation [PPT, 14.7 MB]](https://static.documents.pub/doc/80x56/5870a5961a28ab64358bbe53/presentation-ppt-147-mb.jpg)


