

8/14/2019 Watawala Plantations 2011.2012.pdf
http://slidepdf.com/reader/full/watawala-plantations-20112012pdf 1/160
TOUGH TIMES DON’T LAST...
8/14/2019 Watawala Plantations 2011.2012.pdf
http://slidepdf.com/reader/full/watawala-plantations-20112012pdf 2/160
TOUGH
COMPANIES DO!
2 0 1 1 - 2 0 1 2
A N N U A L R E P O R T
8/14/2019 Watawala Plantations 2011.2012.pdf
http://slidepdf.com/reader/full/watawala-plantations-20112012pdf 3/160
8/14/2019 Watawala Plantations 2011.2012.pdf
http://slidepdf.com/reader/full/watawala-plantations-20112012pdf 4/160
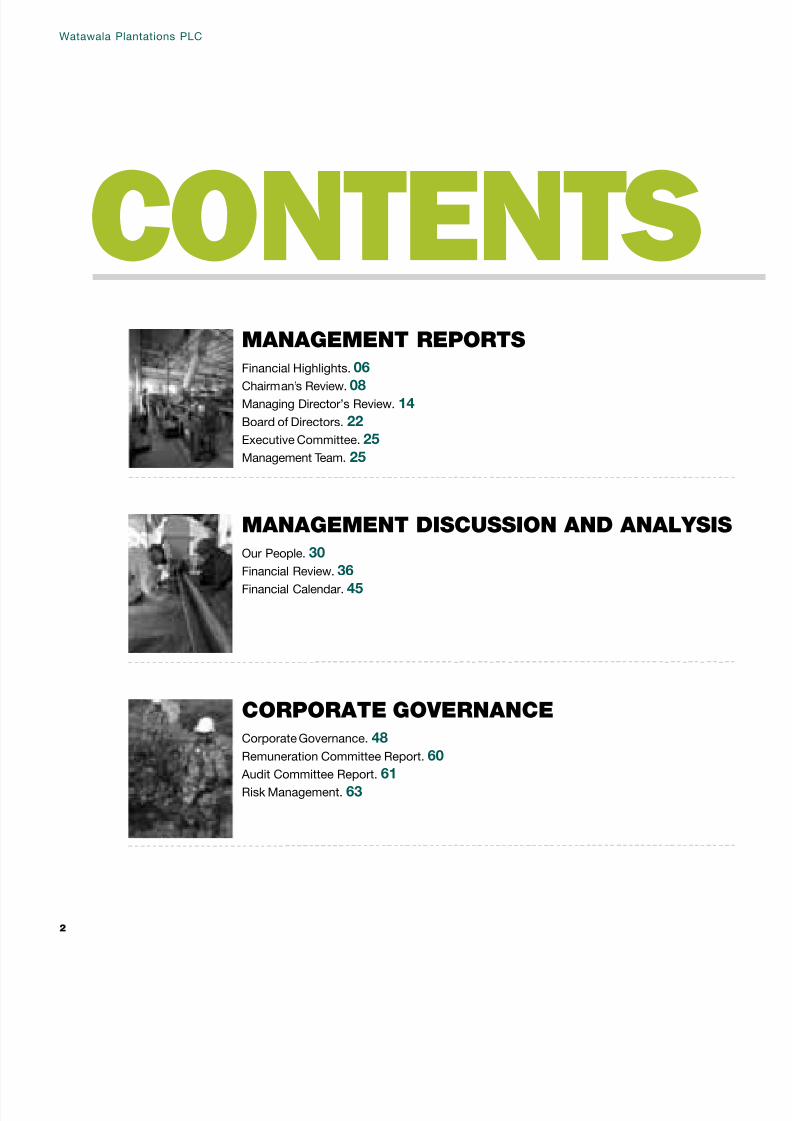
Corporate Governance. 48Remuneration Committee Report. 60
Audit Committee Report. 61
Risk Management. 63
CONTENTSMANAGEMENT REPORTS
MANAGEMENT DISCUSSION AND ANALYSIS
CORPORATE GOVERNANCE
Financial Highlights. 06 Chairman’s Review. 08
Managing Director’s Review. 14
Board of Directors. 22
Executive Committee. 25
Management Team. 25
Our People. 30Financial Review. 36
Financial Calendar. 45
Watawala Plantations PLC
2
8/14/2019 Watawala Plantations 2011.2012.pdf
http://slidepdf.com/reader/full/watawala-plantations-20112012pdf 5/160
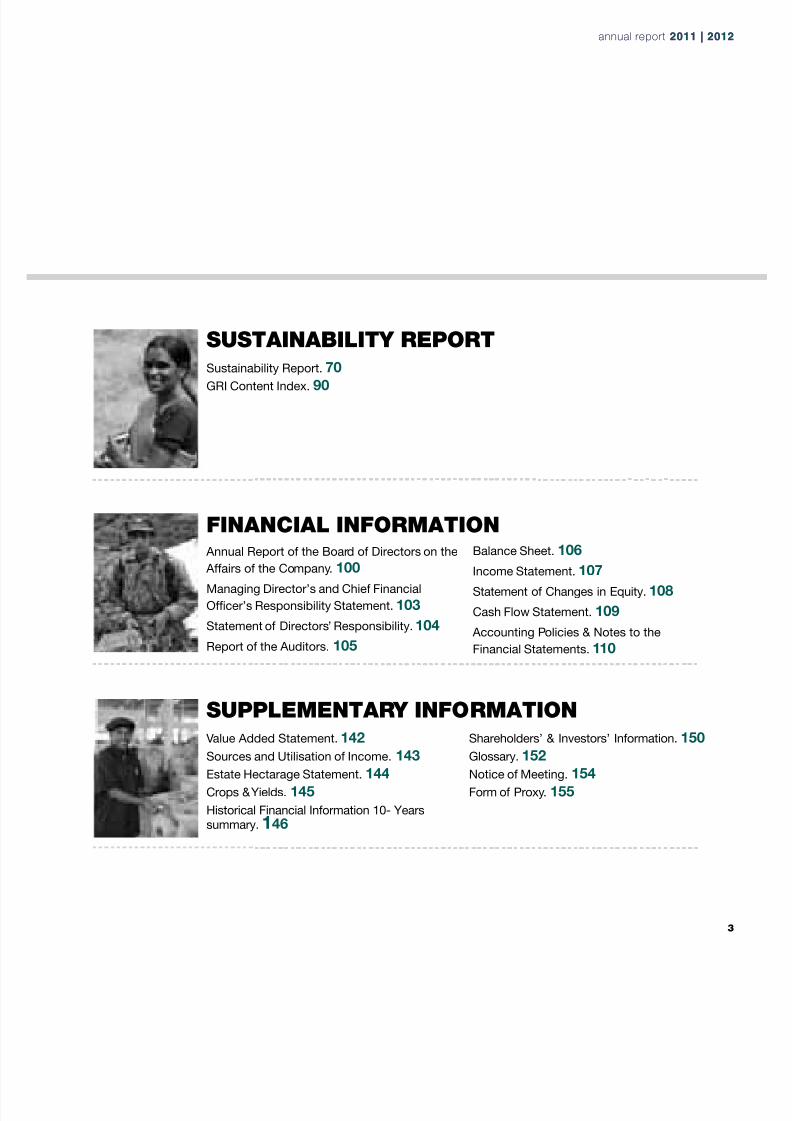
Value Added Statement. 142Sources and Utilisation of Income. 143
Estate Hectarage Statement. 144
Crops & Yields. 145
Historical Financial Information 10- Years
summary. 146
SUSTAINABILITY REPORT
FINANCIAL INFORMATION
SUPPLEMENTARY INFORMATION
Sustainability Report. 70GRI Content Index. 90
Annual Report of the Board of Directors on the Affairs of the Company. 100
Managing Director’s and Chief Financial
Ofcer’s Responsibility Statement. 103
Statement of Directors’ Responsibility. 104
Report of the Auditors. 105
Balance Sheet. 106Income Statement. 107
Statement of Changes in Equity. 108
Cash Flow Statement. 109
Accounting Policies & Notes to the
Financial Statements. 110
Shareholders’ & Investors’ Information. 150Glossary. 152
Notice of Meeting. 154
Form of Proxy. 155
annual report 2011 | 20annual report 2011 | 20
8/14/2019 Watawala Plantations 2011.2012.pdf
http://slidepdf.com/reader/full/watawala-plantations-20112012pdf 6/160
IMPROVING
INFRASTRUCTURE
8/14/2019 Watawala Plantations 2011.2012.pdf
http://slidepdf.com/reader/full/watawala-plantations-20112012pdf 7/160
Financial Highlights - Year at a Glance
Chairman’s Review
Group Managing Director’s Review
Board of Directors
Group Executive Committee
Management Team
MANAGEMENT
REPORTS

8/14/2019 Watawala Plantations 2011.2012.pdf
http://slidepdf.com/reader/full/watawala-plantations-20112012pdf 8/160
FinancialHighlights 2011/12
In Rs. Millions 2011/2012 2010/2011 YoY - %
OperationsRevenue 4,532 4,664 -2.8%
Gross Prot 246 683 -63.9%
Operating Prot 610 612 -0.2%
Prot before Tax 525 527 -0.3%
Net Prot for the year 521 532 -2.2%
EBITDA 493 900 -45.2%
Balance SheetNon Current Assets 4,337 4,327 0.2%
Current Assets 1,308 896 46.9%
Equity 2,830 2,511 12.7%
Non Current Liabilities 1,662 1,590 4.5%
Current Liabilities 1,153 1,122 2.8%
Per Share dataEarning per Share (Rs.) 2.20 2.25 -2.2%
Dividend per Share (Rs.) 0.35 0.85 -58.8%
Dividend Cover (Times) 6.29 6.43 -2.2%
Shareholders’ InterestStated Capital 310 310 0.0%
Shareholders’ Funds 2,830 2,511 12.7%
Shareholders’ Funds per Share (Rs) 11.96 10.61 12.7%
Return on Shareholders’ Funds (%) 18% 21% -13.2%
LeverageInterest cost 85 85 -
Interest Cover (Times) 7.1 7.2 -1%
Non Current Borrowings 211 305 -31%
Current Borrowings 546 437 25%
Borrowings as a % of Equity 27% 30% -9%
The Sri Lankan plantation
sector is paramount
to the economy with a
contribution of 18% to the
national export revenue.
However in 2011 the
major commercial crops
tea, rubber and coconut
showed a sluggish
performance. The tea
industry was under severe
pressure due to European
crisis and Middle East
political conicts. The
future of Ceylon tea
comes with the challenge
of productivity and facing
competition that will likely
to be imposed by China,
Kenya and north east Indiawith low cost production.
We at Watawala
plantations have set
our vision on taking a
path which no other
would have walked in
and contemporaneously
looking forward to
re-shape the future of the
company grasping fruitful
opportunities lying ahead
to remain as the best
plantation company while
diversifying and building
up on our key strengths
‘people’ and ultimately
safe guarding the planet.
Future Trends
Segmental Revenue
Management ReportsWatawala Plantations PLC
6

8/14/2019 Watawala Plantations 2011.2012.pdf
http://slidepdf.com/reader/full/watawala-plantations-20112012pdf 9/160
Company ata glance 2011/12
annual report 2011 | 20annual report 2011 | 20
8/14/2019 Watawala Plantations 2011.2012.pdf
http://slidepdf.com/reader/full/watawala-plantations-20112012pdf 10/160
Chairman’s Review
Global Economy
The world economy faced several signicant challenges during the year, due to
higher oil prices, a down turn in the Euro zone and an escalation of the geo political
tensions in the Middle East.
As per IMF’s latest estimates, world output is likely to grow by 3.25% in 2012compared to a 3.8% growth in 2011, whilst output in the Euro area is forecast to
decline by 0.5% in 2012 compared with a 1.6% increase in 2011. The strains felt by
the Euro economies began to intensify in the last quarter of 2011 and the area is
forecasted to be in mild recession in 2012, thus indicating that the demand from one
of Sri Lanka’s key export destinations would continue to remain inhibited. Economic
activity in the United States is seen as improving although factors such as a high
rate of unemployment and other downside risks indicate that recovery remains
fragile.
The economic meltdown is mostly forecasted to affect the Euro Zone but would
have signicant impact on developing nations due to their dependence on trade
and capital and credit inows from the Euro. According to IMF data, Asian regional
growth has already started to slow due to weaker export demand and 2012 is likely
to be a difcult year , although domestic factors such as tighter macroeconomic
policy stances have also played a role, especially in India and China. Asia is one of
the world’s most trade-dependent regions, exporting everything from commodities
such as metals and rice to sophisticated electronic products and cars; and external
demand will hence play a crucial role in determining Asia’s performance as a whole.
Domestic Economy
Sri Lanka’s economy sustained its post war growth momentum, surpassing last
year’s record high to grow by 8.3% in 2011. This was amidst several political andeconomic challenges on the world stage. Low interest rates and low ination-at
4.9% during the year also provided a growth facilitating environment. Per Capita
income increased to US Dollars 2,836 from previous year’s 2,400, whilst a further
decline in the unemployment rate, to reach the lowest level of 4.3% was another
positive indicator.
The downturn in Euro economies, higher energy prices, and the geo political
turbulence in the Middle Eastern region adversely impacted Sri Lanka during the
year, whilst an escalation in energy prices and a surge in imports placed signicant
strain on Sri Lanka’s Balance of Payments.
Your Company’s outlook on the potential of the Oil Palm
crop is buoyant. The crop’s productivity vis a vis other compet- ing cooking oils, such as Coconut, Corn and Soya Bean, is
signicantly higher. Furthermore, harvesting is considerably
less labour intensive compared to...
Management ReportsWatawala Plantations PLC
8

8/14/2019 Watawala Plantations 2011.2012.pdf
http://slidepdf.com/reader/full/watawala-plantations-20112012pdf 11/160

8/14/2019 Watawala Plantations 2011.2012.pdf
http://slidepdf.com/reader/full/watawala-plantations-20112012pdf 12/160
World oil prices are expected to remain high in 2012
and hence likely to continue to strain Sri Lanka’s
Balance of Payments. Estimate for Sri Lanka’s GDP
growth in 2012 has been revised downward to 7.2%
from an earlier projected 8%. The possibility of a
spread of global geo political hostilities is also a factor
which could impact Sri Lanka’s exports in 2012-2013.
Ination is projected to remain in single digit levels this
year despite the expected rise in commodity, fuel and
energy prices and the impact of the rupee depreciation
in 2012.
The Rupee depreciated at a sharper than expected rate
during the rst three months of 2012 resulting in marketvolatilities and adversely impacting importers. Although
the near term impact has been one of market volatility
and uncertainty, we are of the view that these recent
adjustment measures adopted by the government to
address the widening current account decit and the
decline in external reserves such as the tightening of
monetary and credit policy, and abolishment of the
rupee trading band to allow the exchange rate to adjust
more exibly should place the economy on a more
sustainable track in the medium to long term.
Sri Lanka’s agricultural sector grew marginally by 1.5%
in 2011 compared with a growth of 7% in 2010. This
was due to severe crop damage resulting in adverse
weather conditions during the rst half of the year;
but the sector made a remarkable recovery during the
second half of the year. The Tea sub sector declined
marginally whilst Rubber and Coconut both expanded
during the year.
In the External Sector, the growth of Exports which was
at 22.7 % was far outpaced by the growth of Imports
which was at 50.7% leading to an unprecedented risein the Trade Decit in 2011.
Sri Lanka’s high growth level has taken the country to a
higher growth trajectory and placed it amongst “Middle
Income” countries. As rightly suggested by the
Central Bank, improving demand for exports through
diversication of markets and products, strengthening
foreign inows and Foreign Direct Investments (FDIs)
through appropriate policies and a macroeconomic
environment, and improving labour productivity and
addressing structural rigidities in the labour market
would play a key role in overcoming some of the
challenges that Sri Lanka faces in maintaining its
high growth. Moreover, curtailing fuel expenses by
promoting energy efcient production technologies,
increasing the use of renewable energy sources and
energy conservation are other factors which are crucial
to sustaining the level of high growth.
Tea
Several economic, social and ecological factors
pose many challenges to hinder the growth andsustainability of the tea industry worldwide today.
However, a recognition of the critical need and
urgency to address these issues seem alarmingly low.
Amongst the issues that challenge the industry is one
of over supply as demand has failed to keep pace
with production increases. World production over the
last three decades has doubled. It is also noteworthy
that almost 56 percent of all tea produced worldwide is
consumed locally.
Global tea production reached 3,447.57 Mn. Kgs. in
2011 . While tea is produced in more than 35 countries,
only a handful - China, India, Sri Lanka and Kenya -
account for almost three-quarters of production. China
and India are today the world’s top tea producing as
well as consuming nations and as noted by the United
Nations Food and Agriculture Organisation (FAO), with
tea consumption in these two countries rising by 5.6%,
the global tea industry is being driven by these two
giants. China heads the list of producers contributing
33% of world production with an annual production of
1.4 million tonnes whilst India is expected to produce
around 1.1 Mn. Tonnes in 2011/12.
Sri Lanka’s tea production in 2011 fell by 0.19% to 328.37
Mn. Kgs. from 329 Mn. kgs. in 2010. Sri Lanka now
occupies fourth place in terms of production volumes
but remains the second largest exporter with Kenya
being the rst. However, Sri Lanka’s importance in the
world tea trade has declined considerably since 1970,
with share of world trade dropping from 40% in 1970 to
Management ReportsWatawala Plantations PLC
10

8/14/2019 Watawala Plantations 2011.2012.pdf
http://slidepdf.com/reader/full/watawala-plantations-20112012pdf 13/160
27.9% in 2000 and to 21.6% in 2011. Furthermore, its
production volume increase of 7.5% in the last 11 year
period is far below those of its competitors in Asia and
Africa which stand at 21% in India and 60% in Kenya.
The continuing downturn in the Euro economies
will continue to inhibit demand for tea imports into
the region. The turbulence in the Middle East could
continue impact demand for Sri Lanka’s Low Grown
teas in particular. In addition, FAO’s projections that
British, who are the world’s largest consumer of tea
per capita would reduce their consumption by 15%
compared with 15 years ago also exacerbates the
threat of reduced demand in the world for tea.
Rubber
Asia continued to be the world’s largest supplier of
natural rubber in 2011 with its share increasing to 93%
out of a total world production of 10.9 Mn. Tonnes in
2011. Indonesia, Thailand and Malayasia continued
to hold the top three producer slots respectively
accounting for 69% of total world production.
According to the February 2012 Report of the Association
of Natural Rubber Producing Countries’, the NaturalRubber market benetted from seasonal shortages of
supply and a marginal fall in the commodity’s stock in
China, and a rise in prices is being further supported
by the rise in crude oil prices, the depreciation of
Japanese Yen and an appreciation of the currencies of
some of the natural rubber exporting countries . Thus,
the current environment of short supply with expected
increase in demand augures well for natural rubber
prices in the year ahead.
Oil Palm According to Global Industry Analysts, world trade in
Palm Oil has seen a sharp increase over the last two
decades and the world market for Palm Oil is expected
to increase to 100 Mn. Tonnes by 2015. World production
volumes have been on the rise over the past few years as
a result of increases in extent of land cultivated, as well
as higher yields resulting from increased investments
in research and development. Moreover, the countries
which are at present the highest consumers of Palm Oil
such as India and China are not its key producers and
hence largely dependent on imports.
Your company’s outlook on the potential of the Oil
Palm crop is buoyant. The crop’s productivity vis a vis
other competing cooking oils, such as Coconut, Corn
and Soya Bean, is signicantly higher. Furthermore,
harvesting is considerably less labour intensive
compared to Tea and Rubber. These supply side factors
combined with an increasing demand for the product’s
value as a cooking oil, and as a raw material input in
soaps, detergents, cosmetics and pharmaceuticals as
well as a source for biofuel, underscore the viabilityand the immense potential for expansion of this crop
stream. Around 80% of the global palm oil output
at present is used by the food sector, but its use in
the above non food areas is increasing and would
contribute to a higher demand and prices worldwide in
the next few years.
Our Performance
Your Company’s Prots After Tax declined by 2.17% to
Rs. 520 Mn. compared with Rs. 532 Mn. in the previous
year and this was mainly due to a downturn in the tea
sector. Protability of the rubber and oil palm sectors
however, helped to more than offset the loss in the tea
sub sector.
Tea
The Tea sector made a loss Rs. 500 Mn compared
to a loss of 25 Mn. the previous year, and this was a
result of certain demand as well as supply side factors.
Protability reduced due to a lower National Sales
Average, and a 27% wage increase that came into
effect on 1st April 2011 which signicantly impacted
costs of production (COP).
Rubber
The rubber sector recorded a prot of Rs. 60 Mn
compared with a signicant prot of Rs. 139 Mn.
achieved during the previous year. This decline in prots
was mainly due to a fall in the National Sales Average
(NSA), by around 10% over the previous year; a decline
annual report 2011 | 20annual report 2011 | 20
8/14/2019 Watawala Plantations 2011.2012.pdf
http://slidepdf.com/reader/full/watawala-plantations-20112012pdf 14/160
in output, as well an increase in COP due to a wage
increase.
Oil Palm
The Oil Palm sector achieved excellent results during
the year and was the largest contributor to the sector,
with the highest ever after tax prot of Rs. 373 Mn.,
compared to Rs. 195 Mn. in 2010/11. A 28% increase
in crop output as a result of improved agricultural
practices, an increase in the extent cultivated and
a higher NSA, were factors which contributed to this
sharp increase in prots.
Issues and Strategies
The tea sector accounts for 70% of your Company’s
revenue and its rich asset base abounds with potential,
for your Company, the sector and the economy.
However a multitude of issues currently burden the
competitiveness of the industry and challenge the
sustainability of the industry for all its stakeholders.
Most signicant amongst them has been an increased
costs of production. This has mainly been due to the
successive wage increases mandated by the government
over the past seven years which have followed a
regressive model. The wage increase in 2011 resulted
in a Rs. 220Mn. increase on the Gratuity provision by
the company and increased costs of production by
Rs.100Mn. and was particularly regressive as it
contained no productivity component. We hope that a
model for wage increases that incorporates productivity
mind and has the sustainability of the industry in mind
will replace the current biennial ad hoc ones. A long
term strategy formulated with the involvement of all
stakeholders and mediated by the government is now
paramount and urgent.
Another factor that hinders the growth of the tea sector
is a reduction in the supply of labour at levels of middle
management as well as at a level of crop plucking.
The number of tea workers per family living on an
estate has reduced from 2.6% to 1.9% , and of a one
million population who live on estates only 400,000 are
engaged in estate employment. A difculty in attracting
the best managerial talent also challenges the industry.
A shortage of labour is also a factor which hinders
growth of the rubber sector, and the social disparity vis
a vis other sectors has been found to be a factor that
has made this sector relatively less attractive.
Another that the Plantations sector as a whole faces
is the vulnerability to world market conditions that is
characteristic of primary commodities. Business cycles
in major importing countries, developments in the
markets of competing products such as for exampleSoya Bean oil in the case of Oil Palm and Synthetic
rubber vis a vis Natural Rubber; and exogenous factors
such as wars and climatic changes impact commodity
markets.
Whilst we highlight the need for collective action to
address some of these issues and look at innovative
ways to address some of the exogenous factors, we
will also continue to develop strategies and invest in
measures that improve the efciency of production
factors such as land and labour which are within our
control. This year the Oil Palm crop became the main
stay of your company - the pioneers of this crop in Sri
Lanka. Crop diversication has proven to be a valuable
measure for regional plantation companies to improve
protability when exogenous factors have impacted
protability of the traditional crops. Thus, it is also
important that the government encourages practices
such crop diversication; and where traditional crops
cannot be cultivated- diversication into areas such as
forestry cultivation in order to maximize plantation land
productivity and facilitate sustainability.
Management ReportsWatawala Plantations PLC
12
8/14/2019 Watawala Plantations 2011.2012.pdf
http://slidepdf.com/reader/full/watawala-plantations-20112012pdf 15/160
Acknowledgement
I wish to express my sincere appreciation to our
Shareholders, the Managing Agents and Employees of
Watawala Plantations PLC, for their loyalty and utmost
co-operation.
I also wish to express my gratitude to our Buyers, our
Brokers and Suppliers for their unstinted support and
to my colleagues on the Board for their able guidance
and direction.
G. Sathasivam
Chairman
17/05/2012
annual report 2011 | 20annual report 2011 | 20

8/14/2019 Watawala Plantations 2011.2012.pdf
http://slidepdf.com/reader/full/watawala-plantations-20112012pdf 16/160
The Plantation Sector in Sri Lanka
The Plantation sector, albeit reducing in signicance
over the past three decades, still remains an important
sector in Sri Lanka’s socio-economic fabric, contributing
3.4% to the country’s GDP. Tea was Sri Lanka’s largest
export until it was replaced by garments in 1986,
and as early as 1950, plantation crops accounted
for about 70% of the country’s agricultural output,
declining to 51% in 1986 and to 25% by the late 80’s.
The importance and the potential of the sector in Sri
Lanka is also underscored by the large asset base of
both land and human, for which the Plantation sector
is the custodian. The total land extent utilized by this
sector in 2011 was in the region of 800,000 hectares,
whilst the number of direct and indirect employment
opportunities generated stands at about 1.5 million.
These reect the potential of the sector to be a key
contributor to achieving some of Sri Lanka’s key
economic objectives such as food security, employment
generation, environmental conservation and bridging of
the geographic disparities in income distribution in
the country. Thus, despite the down turn during the
year, your company remains buoyant on the potential
of its plantations, and because of the expertise and the
experience that the company possesses.
Sri Lanka’s Plantation sector faced a challenging year
due to a downturn in tea . Adverse weather conditions
during the rst half of the year resulted in a decline in
crop output whilst a 27% wage increase during the
year impacted costs of production. The impact of these
supply side factors were exacerbated by a reduced
demand from some of Sri Lanka’s key export markets
the Middle East, due to political turmoil in the region;
and the Euro zone due to an economic downturn that
intensied during the latter half of the year.
Company Performance
Your Company achieved a Prot After Tax of Rs. 520 Mn.
during the year which was a decline of 2.17%,compared with a Prot After Tax of Rs. 532 Mn. the
previous year. The prot made during the year includes
the net income of Rs. 387 Mn. earned on the disposal
of the fully owned subsidiary, Watawala Marketing
Ltd. The balance of Rs. 133 Mn. is the prots from the
company’s normal operations. The protability of the
Rubber and Oil Palm sectors helped to more than offset
the loss in the Tea sub sector, and Oil Palm became
the main stay of your Company during the year under
review.
Tea
Your Company’s tea crop production of 9.4 kg. mn
during the year reduced marginally by 4.4 % over the
previous year. The key contributor to this was the
reduction in the intake of bought leaf. Our own leaf
production increased by a marginal 0.34% despite a
climatic change that led to a prolonged drought during
the early part of the year; worker agitation for higher
Managing Director’s Review
...in the land extent as well as an increase in land/crop productivity. An output of2,858 Ha. by your company amounted to a productivity level in the region of 3,156
Kgs. of Oil per Ha; And this was a very commendable achievement surpassing last year’s
yield by 32.2%
30%Palm oil prod:
Management ReportsWatawala Plantations PLC
14

8/14/2019 Watawala Plantations 2011.2012.pdf
http://slidepdf.com/reader/full/watawala-plantations-20112012pdf 17/160
annual report 2011 | 20annual report 2011 | 20
8/14/2019 Watawala Plantations 2011.2012.pdf
http://slidepdf.com/reader/full/watawala-plantations-20112012pdf 18/160
wages and the lagged impact of the work disruption that
took place in mid and late 2011. Tea land productivity
remained almost constant with a yield of 1,345 Kg. per
Ha being the highest reported in the last seven years.
The Net Sales Average (NSA) received by the Company
also declined by 6.8 % in the reporting period, and
this was despite your company’s continuing focus on
quality.
The company continued to invest in best practices,
advanced scientic methodologies and technology
to boost protability in the tea sector. Some of the
measures include, soil management practices such as
recycling of pruning and other farm waste for compost,
company and eld specic fertilizer programmes,
“Shear Harvesting” and partial mechanized pruning.
Most of these are measures which will yield benets
with a time lag of two to three years, and hence reect
the long term perspective we adopt, and the focus on
investing in the sustainability of our business.
The Waltrim tea factory, your Company’s show piece
and one of the most modern tea factories in the country,
continued to perform exceptionally well. The most
salient feature during the year was the improvement itachieved in performance rankings- to 4th position, from
13th position the previous season. Securing 88 Top
Prices at the Colombo auctions, during the reporting
period, reected the uniqueness of Waltrim’s quality
assurance practices.
Your company’s majority of the estates in the Hatton/
Watawala region were placed within the top 10
rankings in the Western/ Medium Grown tea category.
Kenilworth secured the 5th position in overall rankings
and the highest average in John Keells catalogue,
Carolina secured 3rd highest average, whilst Strathdon
was ranked the 5th highest in the same catalogue.
Additionally, Kenilworth secured the highest number
of top prices of 98 in the Medium Grown category,
Carolina and Strathdon achieved the 2nd highest and
the 3rd highest number of top prices of, 25 and 20
respectively, in the same category.
Rubber
Despite the industry’s impressive progress over the last
few years, the Sri Lankan rubber industry, continues
to be challenged by a multitude of issues. A decline
in the extent cultivated, low land productivity, high
costs of production, a shortage of labour; low labour
productivity due to factors such as the age of workers;inadequacy of resources; wide social disparity vis a
vis other industries, and factors beyond our control
such as erratic weather patterns. Some of the above
mentioned issues adversely impacted your Company’s
as well, and made it difcult for us to sustain the
positive trend recorded elsewhere in the country. Your
Company’s Crop production, decreased by 4%, to
reach 0.64 mn. kg compared to a crop of 0.67 mn. kg.
recorded in the previous period. This amounted to an
decrease of 26,049 kg in terms of volume.
The land productivity improved during the year with
the company reporting a yield of 705 Kg per Ha., 9.3%
above last year’s yield but still below the yields of other
regional plantation companies. This productivity level
was achieved despite the fact that a signicant extent of
rubber trees are due for uprooting in the next few years.
The company also lost over 4,000 rubber trees during
the mini cyclone during the 3rd quarter of the nancial
year. The extent of unproductive rubber uprooted this
year amounted to around 185 Ha. Recognising the
need for substantial improvements to land and crop
productivity your company is making a concerted
effort to address this issue, such as via the adoption
of site specic agricultural technologies that would
ensure consistent and enhanced output despite erratic
weather patterns that have an increasing tendency to
disrupt eld agricultural practices. The NSA received
by your company during the year was on par with
domestic and international prices, but below what the
company achieved during the previous year. However,
9.3%Yield
Management ReportsWatawala Plantations PLC
16
8/14/2019 Watawala Plantations 2011.2012.pdf
http://slidepdf.com/reader/full/watawala-plantations-20112012pdf 19/160
skillful handling of processing and manufacturing
technologies by the company, enabled the prices to
remain remunerative to its natural rubber business.
The short-term outlook for the natural rubber
market has been weakened by signicant economic
uncertainty and risks regards the United States and
Euro economies, however the long term outlook is one
of protability for the business.
Oil Palm
Palm Oil - seen as a humble source of edible oil, and
heavily criticized for being unhealthy and un-t for
human consumption merely a few years ago has
transformed markets and its image at a pace few
would’ve foreseen, and is today substantiated to be
one of the most nutritious edible oils in the world.
Furthermore, Palm oil is also the least expensive in the
vegetable oil market whilst its value also extends beyond
the use as a cooking oil, as one of the few sources of
Bio-diesel – a renewable substitute for Petroleum driven
diesel. This is in addition to the demand for Palm Oil as
a raw material for soaps, detergents, Pharmaceuticals
and Nutraceutical products.
During the year under review, your Company’s Palm
oil production rose signicantly by 30% to 6.5 Mn
Kgs of CPO from 5 Mn. Kg in the previous year. This
is attributable to an increase in the land extent as wellas an increase in land/crop productivity. An output of
2,858 Ha. by your Company amounted to a productivity
level in the region of 3,156 Kg. of Oil per Ha; and this
was a very commendable achievement surpassing last
year’s yield by 32.2%. We intend further enhancing
productivity to 3,500kg/ha, in the near future.
The company also achieved a commendable NSA,
which saw an increase of 2.81% over the previous
year’s. The infusion of innovative and effective
agricultural and processing technologies, acquired
from global pioneers in the oil palm business, would
strengthen our operations and yield dividends in the
years to come. Your company who pioneered the oil
palm processing facility in Sri Lanka, looks to build on
its current market leadership position and to expand the
crop to harness the vast potential in the industry. WPL
also envisages playing an active role in supporting the
ambitious plans of the Ministry of Plantation Industries,
to expand Sri Lanka’s land extend under Oil Palm from
its current levels of 6,000 ha. to 25,000 ha.
Capital Investments
During the year under review, the Company implemented
a modernization programme of its Nakiyadeniya Palm
Oil Renery with a total investment of Rs 20.3 Mn. and
new machinery for the Renery constituted Rs. 17.8 Mn.
of that investment. The quality of the output from the
renery has improved since, enabling the marketing of
a better quality product.
Tea-Hatton/ Watawala
The company made two investments during the year to
increase the manufacturing capacities at two of its tea
factories. One was an investment of Rs 62.3 Mn in the
Carolina Tea Factory to increase production from 16,000
kg to 24,000 kgs of green leaf per day. The other was
an investment of approx 17.8 Mn in the Company’s
Dickoya estate, to increase the capacity from 15,000kg
to about 20,000Kg of green leaf. The company’s capital
investments during the year amounted to Rs. 573 Mn.
and this includes re planting, factory modernization,
buildings and vehicles amongst others. A more detailed
report on capital investment will appear elsewhere in
this report.
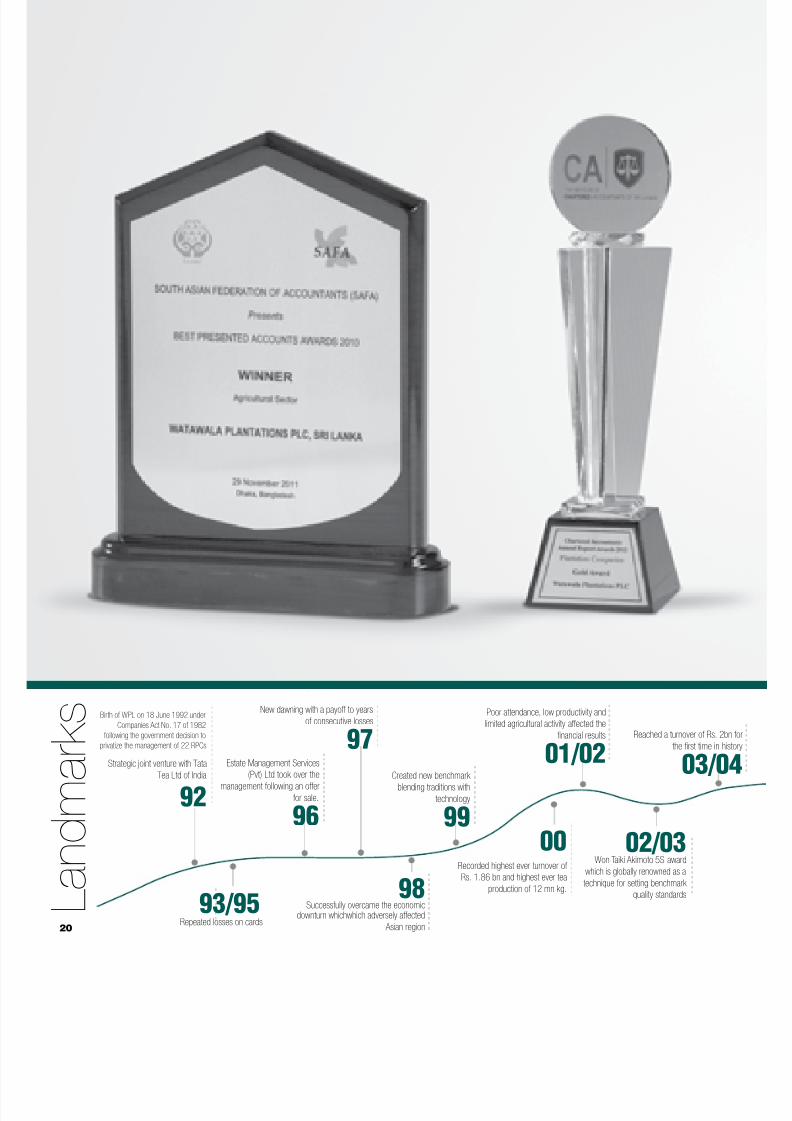
Accolades
We are pleased to have been honored for the best
presented accounts in South Asia, in the Agriculture
Sector, by the South Asian Federation of Accountants
(SAFA) in the year 2010, at a function held in Dhaka.
this was a very commendable
achievement surpassing last year’s yield by 32.2%. We intend further
enhancing productivity to 3,500kg/ha, in the near future.
annual report 2011 | 20annual report 2011 | 20
8/14/2019 Watawala Plantations 2011.2012.pdf
http://slidepdf.com/reader/full/watawala-plantations-20112012pdf 20/160
SAFA is an organization founded by the Institutes of
Chartered Accountants in India, Pakistan, Sri Lanka,
Bangladesh and Nepal and a few other accounting
bodies.
WPL also won the Gold Award for the 4th successiveyear for the Best Annual Report in the Plantation
sector category awarded by the Institute of Chartered
Accountants of Sri Lanka.
Lonach Dairy Farm
The dairy business, launched on Lonach Estate, as
part of the Group’s diversication strategy now has a
herd strength of 150 animals, and the milk production
capacity stands at 1,100 liters per day.
The cattle waste from the farm, continued to provideraw material for the manufacture of compost, a very
valuable source of fertiliser material, to re-develop the
degraded soil and to partially replace the chemical
fertilisers used on our plantations.
A Bio Gas generation system that is able to generate
140 units of electricity per day, and produce organic
slurry at a rate of 20,000liters per day, developed on the
farm are now being used by your Company’s estates.
Subsidiaries
The Board of Directors at an Extra Ordinary General
Meeting held on the 29th of February 2012 obtained
the approval of shareholders to divest its subsidiary
Watawala Marketing Ltd. The decision was taken as
a measure to address the difcult period that the
company underwent during the year, as a result of the
downturn in the tea sector. Rising interest costs and
the negative margins in the tea sector did not permit
the company to secure additional borrowings. The
Directors now intend using the funds raised from this
transaction to develop the company’s core business of
Tea and Palm Oil. A decision made by the Directors to
fund the gratuity provision has already resulted in an
unencumbered deposit of Rs. 46 Mn.
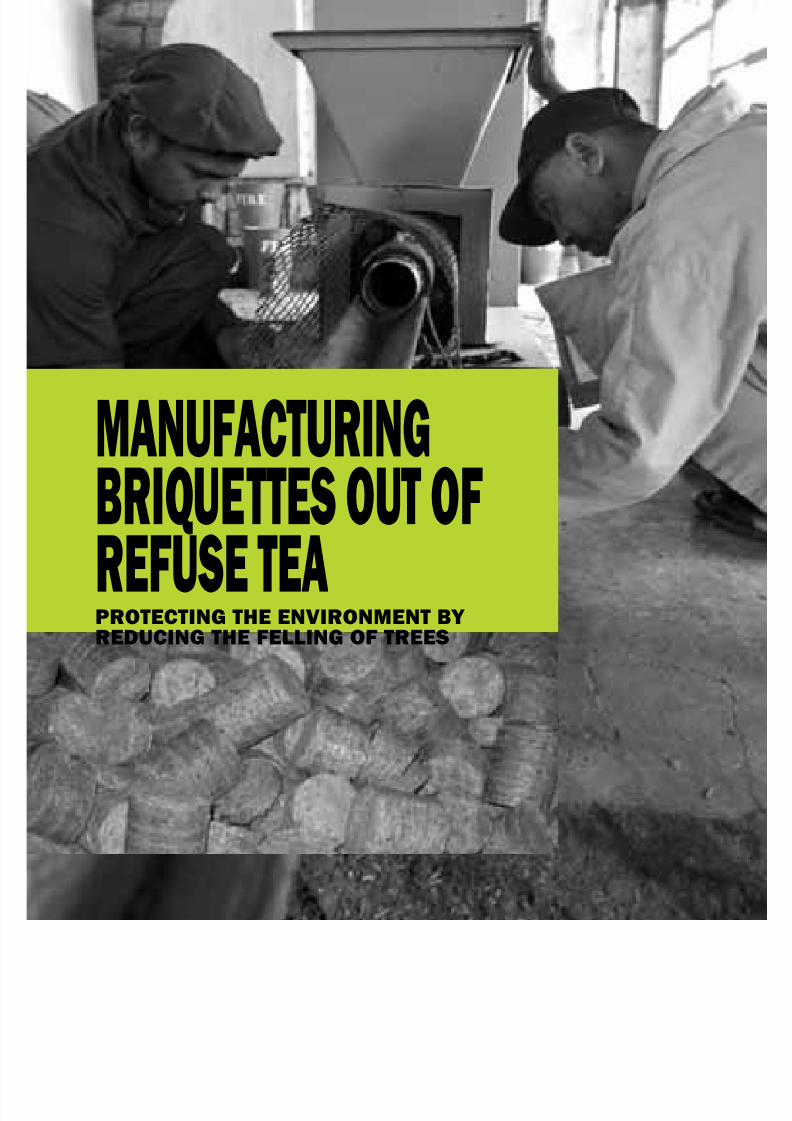
Energy Management
The escalation of world oil prices in the year under
review has further emphasized the need for energy
conservation and made more urgent the search for
alternate sources of energy.
It is also a key focus area for us as we see our costs
of production increasing due to higher energy prices.
The company has identied the opportunity to reduce
its energy costs by twenty percent via the adoption
of certain systems and substitute sources of energy.
Some of these initiatives carried out during the year
include the conversion of all fossil fuel powered tea
dryers to rewood ones; and the launch of an initiative
to replace rewood with the environmentally friendly
briquettes made out of refuse tea which is now being
implemented in the Lindula factories. An initiative
planned for next year include the implementation of the
ISO 50001 standards on energy management .
Issues and future Strategies
Rising costs of input, combined with rising costs of
labour due to ad hoc wage increases that have failed
to consider the nancial viability of the industry, remain
issues of critical concern to all stakeholders of the
industry.
These factors, when combined with price volatility
and market uctuations which are characteristic of
all primary commodities; pose signicant challenges
to the plantations business. Your company will look at
innovative ways in which it can reduce the vulnerability
of these primary commodities to global market
conditions. The year was one in which your Company’s
diversication helped it to benet from a “boom” in the
Oil Palm sector to offset the cyclical “bust” in Tea and
achieve a considerable prot.
The effects of climate change is making harvests
The year was one in which your
Company’s diversication helped it to
benet from a “boom” in the Oil Palm
sector to offset the cyclical “bust” in Tea
and achieve a considerable prot.
Management ReportsWatawala Plantations PLC
18

8/14/2019 Watawala Plantations 2011.2012.pdf
http://slidepdf.com/reader/full/watawala-plantations-20112012pdf 21/160
less predictable than ever and hence, developing
technologies to offset some of the harvest losses that
result from these erratic weather patterns would also
be a priority for WPL.
Your company will continue to expand its business
using the wealth of expertise and experience it
possesses. We would seek avenues to increase
protability via diversication both concentric as well
as conglomerate diversication; whilst investing in
harnessing the potential of our asset rich core business
of plantations.
Sustainable Growth
Sustainable Development, albeit a concept much
heard of , is an essential value that enlightens us that a
business cannot sustain its success in isolation and of
the need for a business entity to integrate its economic
objectives with those of the environment and society at
large. For instance, at your Company the development
of higher yielding crops is intertwined with measures to
sustain the environment. The Company’s sustainability
framework continues to cover Productivity and
Innovation, Care of the environment, Investing in
People and Returning to the community. Our initiatives
thus carried out during the year, for the upliftment of
communities and the environment, are presented
comprehensively in this report under the section on
Sustainability, which I am happy to note is presented
this year, in accordance with the prescribed framework
of the Global Reporting Initiatives (GRI) and reports on
our social, environmental and economic performance
using to the GRI indicators.
Commitment to quality, employee health and safety,
environmental responsibility and care, and ethical
behavior in all our dealings will continue to be priorities
and a part of your company’s ethos. The international
certications we have obtained and will continue
to seek for our many processes and locations are a
reection of our commitment to these values. These
certications are an outcome of stringent audits and
evaluations by globally reputed independent third
parties, and are hence endorsements that benet all
stakeholders of our company.
The certications obtained by Watawala Plantations
are as follows, Fair Trade certication by seven of our
tea gardens, The Ethical Tea Partnership certication
of twelve tea factories, and the Food Safety standardcertication - ISO 22000 by seven of our tea factories.
HACCP certication which is another on Food safety
has been obtained by seven of our factories; whilst
CQUi Certication has been obtained by Kenilworth
factory.
Appreciation
I would like to express my sincere appreciation to
the corporate and estate management teams, and
to all our Associates for their hard work, dedication
and commitment without which your company could
not have thrived during a challenging year. I would
also like to express my gratitude to the Board of
Directors for the condence placed in me and for
their unstinted guidance and support and to our
shareholders, customers, business associates and all
other stakeholders for their inspiration, and support.
V Govindasamy
Managing Director
17/05/2012
The Company’s sustainability framework
continues to cover Productivity and
Innovation, Care of the environment,
Investing in People and Returning to the
community.
annual report 2011 | 20annual report 2011 | 20
8/14/2019 Watawala Plantations 2011.2012.pdf
http://slidepdf.com/reader/full/watawala-plantations-20112012pdf 22/160
L a n d m a r k
sEstate Management Services
(Pvt) Ltd took over the
management following an offer
for sale.
96
New dawning with a payoff to years
of consecutive losses
97
98Successfully overcame the economic
downturn whichwhich adversely affected
Asian region
Created new benchmark
blending traditions with
technology
9900
Recorded highest ever turnover of
Rs. 1.86 bn and highest ever tea
production of 12 mn kg.
Poor attendance, low productivity and
limited agricultural activity affected the
financial results
01/02
02/03 Won Taiki Akimoto 5S award
which is globally renowned as a
technique for setting benchmark
quality standards
Reached a turnover of Rs. the first time in
03/0
92
Birth of WPL on 18 June 1992 under
Companies Act No. 17 of 1982
following the government decision toprivatize the management of 22 RPCs
Strategic joint venture with Tata
Tea Ltd of India
93/95
Repeated losses on cards20

8/14/2019 Watawala Plantations 2011.2012.pdf
http://slidepdf.com/reader/full/watawala-plantations-20112012pdf 23/160
04/05Collaboration with Tata Tetly in
the UK to spread the art of pure
Ceylon tea across the globe
Tea sourcing and supply chain to Tata Tea
and Tetley Group. Awarded the Silver at the Annual Reportcompetition held by the ICASL.
05/06
06/07First Runner -up in the best annual
reports awards competition held by
ICASL 2005/06
07/08 Achieved Business Super brand
status
Diversified in to Dairy Farming
Gold award for the best annual report in the plantation sector by ICASL
Recognized as an autho rized supplier to the ‘Ethical Tea Partnership’
08/09
09/10Gold award for the best annual report
in the plantation sector by ICASL for
the second time
Gold Award for Business Excellence in
the Agriculture and Plantations Sector
10/11Gold Award for the Annual
Report of the Plantation Sector
2009/10 by ICASL third time
in a row
Won National Quality Merit
Award, by Sri Lanka Standard
Institute in the medium scale
manufacturing company
11/12Won the Gold Award for the Be
Presented Accounts for 2010 in
Agriculture sector by South Asia
Federation of Accountants (SAF
held in Dhaka, Bangladesh
Bagged the Gold award for Ann
report in plantation sector 2010
by CA Sri Lanka for the 4th
consecutive year
Won National level awards pres
by National Agro Business Coun
Ceylon Chamber of Industries
8/14/2019 Watawala Plantations 2011.2012.pdf
http://slidepdf.com/reader/full/watawala-plantations-20112012pdf 24/160
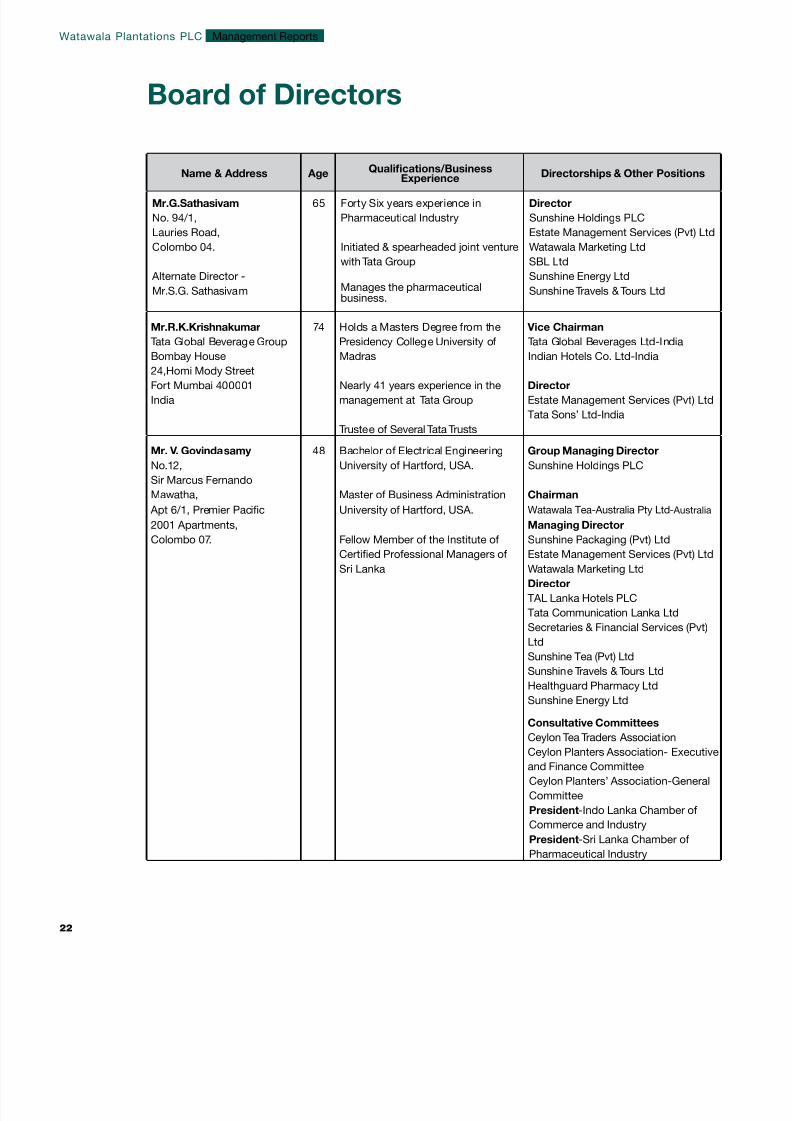
Name & Address Age Qualications/BusinessExperience Directorships & Other Positions
Mr.G.Sathasivam 65 Forty Six years experience in Director
No. 94/1, Pharmaceutical Industry Sunshine Holdings PLC
Lauries Road, Estate Management Services (Pvt) Ltd
Colombo 04. Initiated & spearheaded joint venture Watawala Marketing Ltd
with Tata Group SBL Ltd
Alternate Director -Manages the pharmaceuticalbusiness.
Sunshine Energy Ltd
Mr.S.G. Sathasivam Sunshine Travels & Tours Ltd
Mr.R.K.Krishnakumar 74 Holds a Masters Degree from the Vice Chairman
Tata Global Beverage Group Presidency College University of Tata Global Beverages Ltd-India
Bombay House Madras Indian Hotels Co. Ltd-India
24,Homi Mody StreetFort Mumbai 400001 Nearly 41 years experience in the Director
India management at Tata Group Estate Management Services (Pvt) Ltd
Tata Sons’ Ltd-India
Trustee of Several Tata Trusts
Mr. V. Govindasamy 48 Bachelor of Electrical Engineering Group Managing Director
No.12, University of Hartford, USA. Sunshine Holdings PLC
Sir Marcus Fernando
Mawatha, Master of Business Administration Chairman
Apt 6/1, Premier Pacic University of Hartford, USA. Watawala Tea-Australia Pty Ltd- Australia
2001 Apartments, Managing Director
Colombo 07. Fellow Member of the Institute of Sunshine Packaging (Pvt) Ltd
Certied Professional Managers of Estate Management Services (Pvt) LtdSri Lanka Watawala Marketing Ltd
Director
TAL Lanka Hotels PLC
Tata Communication Lanka Ltd
Secretaries & Financial Services (Pvt)
Ltd
Sunshine Tea (Pvt) Ltd
Sunshine Travels & Tours Ltd
Healthguard Pharmacy Ltd
Sunshine Energy Ltd
Consultative Committees
Ceylon Tea Traders AssociationCeylon Planters Association- Executive
and Finance Committee
Ceylon Planters’ Association-General
Committee
President-Indo Lanka Chamber of
Commerce and Industry
President-Sri Lanka Chamber of
Pharmaceutical Industry
Board of Directors
Management ReportsWatawala Plantations PLC
22

8/14/2019 Watawala Plantations 2011.2012.pdf
http://slidepdf.com/reader/full/watawala-plantations-20112012pdf 25/160
Name & Address Age Qualications/BusinessExperience Directorships & Other Positions
Mr.P.T.Siganporia 61 Holds a Bachelors Degree from Chairman
Tata Global Beverage Loyola College-Madras Mount Everest Mineral Water Ltd-India
Group
1,Bishop Lefroy Road Holds a Postgraduate Diploma in Managing Director
Kolkata- 700020 Business Marketing from XLRI- Tata Global Beverages Ltd-India
India Jamshedpur
Director
Tetly GB Limited-India
Estate Management Services (Pvt) Ltd
Watawala Marketing Ltd
Tata Coffee Ltd-India
Dr.D.V.Seevaratnam 64 Doctor of Science (Honoris Causa) Director
No11, Wayamba University -Sri Lanka Tea Research Board of Sri Lanka
Sangamitta Avenue, Plantation Human Development Trust
off Dharmapala Mawatha, Fellow member of Australian
Mt.Lavinia. Institute of Management Chairman
Ceylon Planters Provident Society
Fellow member of National Institute Consultative Committee on Estates
of Plantation Management and Advisory (Tea Research Institute)
Over 36 years of experience in Member of the Board of Governors
Plantations Sector - National Institute of Plantation
Management- Coconut Research Institute
Member
Standing Committee on Agriculture,
Veterinary,Medicine & Animal Sciences
Sciences of the University Grant
Commission
Consultative Committee on Research
(Tea Research Institute)
CARE International Advisory Board
A Representative of the Medical Wants
Committee
annual report 2011 | 20annual report 2011 | 20
8/14/2019 Watawala Plantations 2011.2012.pdf
http://slidepdf.com/reader/full/watawala-plantations-20112012pdf 26/160
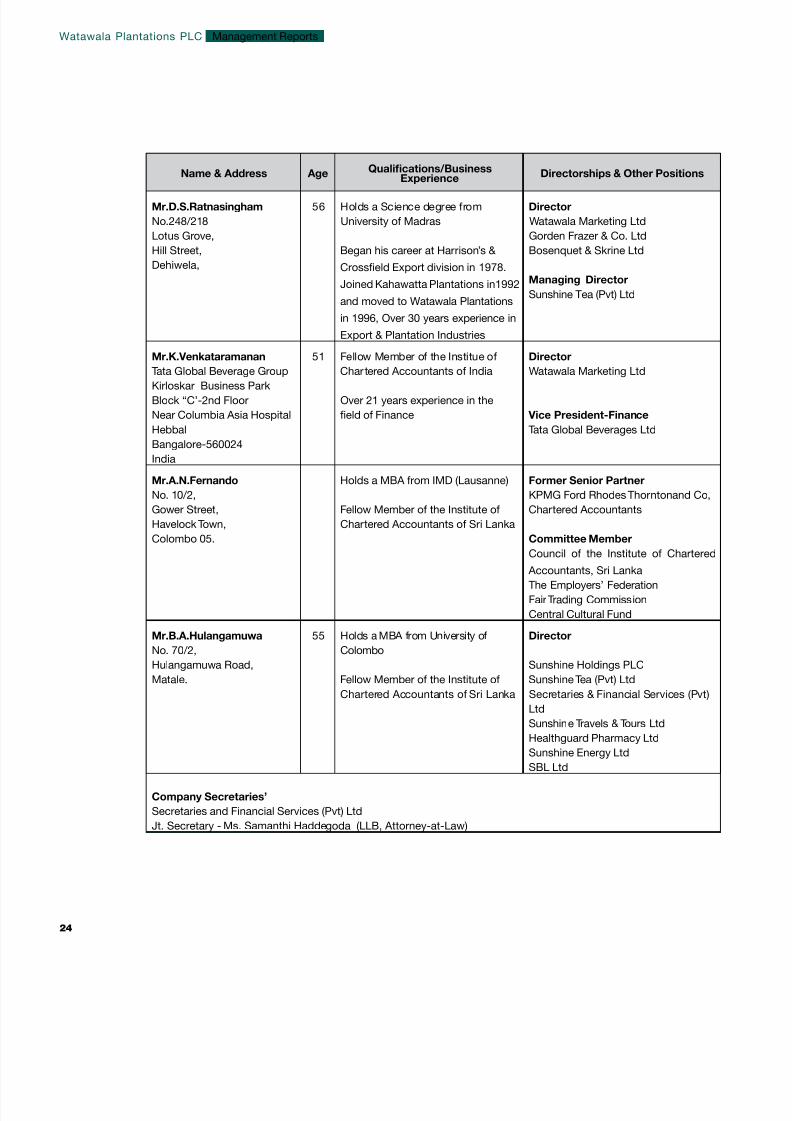
Name & Address Age Qualications/BusinessExperience Directorships & Other Positions
Mr.D.S.Ratnasingham 56 Holds a Science degree from Director
No.248/218 University of Madras Watawala Marketing Ltd
Lotus Grove, Gorden Frazer & Co. Ltd
Hill Street, Began his career at Harrison’s &
Crosseld Export division in 1978.
Joined Kahawatta Plantations in1992
and moved to Watawala Plantations
in 1996, Over 30 years experience in
Export & Plantation Industries
Bosenquet & Skrine Ltd
Dehiwela,
Managing Director
Sunshine Tea (Pvt) Ltd
Mr.K.Venkataramanan 51 Fellow Member of the Institue of Director
Tata Global Beverage Group Chartered Accountants of India Watawala Marketing LtdKirloskar Business Park
Block “C’-2nd Floor Over 21 years experience in the
Near Columbia Asia Hospital eld of Finance Vice President-Finance
Hebbal Tata Global Beverages Ltd
Bangalore-560024
India
Mr.A.N.Fernando Holds a MBA from IMD (Lausanne) Former Senior Partner
No. 10/2, KPMG Ford Rhodes Thorntonand Co,
Gower Street, Fellow Member of the Institute of Chartered Accountants
Havelock Town, Chartered Accountants of Sri Lanka
Colombo 05. Committee Member
Council of the Institute of Chartered Accountants, Sri Lanka
The Employers’ Federation
Fair Trading Commission
Central Cultural Fund
Mr.B.A.Hulangamuwa 55 Holds a MBA from University of Director
No. 70/2, Colombo
Hulangamuwa Road, Sunshine Holdings PLC
Matale. Fellow Member of the Institute of Sunshine Tea (Pvt) Ltd
Chartered Accountants of Sri Lanka Secretaries & Financial Services (Pvt)
Ltd
Sunshine Travels & Tours Ltd
Healthguard Pharmacy LtdSunshine Energy Ltd
SBL Ltd
Company Secretaries’
Secretaries and Financial Services (Pvt) Ltd
Jt. Secretary - Ms. Samanthi Haddegoda (LLB, Attorney-at-Law)
Management ReportsWatawala Plantations PLC
24

8/14/2019 Watawala Plantations 2011.2012.pdf
http://slidepdf.com/reader/full/watawala-plantations-20112012pdf 27/160
V Govindasamy - Managing Director (Page 22)
D V Seevaratnam - Director/CEO (Page 23)
D S Ratnasingham - Director (Page 24)
Lalith Cooray - Chief Financial Ofcer
A Fellow of the Institute of Chartered Accountants of Sr i Lanka
and a Fellow of the Institute of Certied Management Accountants
Sri Lanka. Counts almost 30 years of post qualifying experience
in Sri Lanka and overseas.
Ronnie Almeida - General Manager - Plantations
A Fellow Member of the National Institute of Plantation
Management with a Diploma in Plantation Management and
counts over 41 years experience in the industry. Served as the Asian representative in the Standards Committee of the Fairtrade
Labeling Organization of Germany.
Binesh Pananwala - Deputy General Manager, Plantations
Counts 20 years of experience in planting, joined JEDB and
continued with WPPLC, holds a MBA from Manipal ( Sikkim)
University.
Yajith de Silva - General Manager – South
Counts 31 years experience in the plantation sector, holds a
Degree in Plantation Management from Wayamba University of
Sri Lanka and a Diploma on Human Rights and Peace studiesfrom the Colombo University. Former regional Director of the
PHDT.
Ajantha Nugawela - General Manager - HR & Administration
Ajantha counts over 21 years of experience in Management and
Human Resources/ Administration both in Sri Lanka and overseas
and holds an MBA from the University of Delaware, USA. He
also has a Degree in Textile Technology from the University of
Moratuwa with many years of experience in the apparel industry.
B V Sinthaka Ruwan - Deputy General Manager - Finance
Sinthaka joined as the Finance Manager in 2008. He holds aBSc Special Degree in Finance and an Associate Member of the
Institute of Chartered Accountants of Sri Lanka. He has over 12
years of experience in a vide spectrum of organizations.
N. Vige Bede Johnpillai - General Manager – Marketing
Has over 39 years of experience in the Tea Plantations in Sri
Lanka working on plantations in the Uva and Western Regions.
Viji also served overseas as free-lance consultant to Gtz.
Management Team
Corporate Management Team
Rexy R Perera Manager – Internal Audit
Ms. Badra Jayadeva Manager – Exports & Sales
Gamini Wanasekara Manager – Purchasing
Estate Management Team
Watawala Region
Kenilworth Dinesh A S J Perera - Actg. Senior Manag
Carolina Alex C Samuel - Group Manager
Wigton K D Prasanjith Wetthewe - Manager
Lonach A Jayaram - Manager
Shannon Shameera Rathnayake - Manager
Hatton Region
Vellai Oya Madura H Medagamage - Actg. Senior Manag
Dickoya Gershon P Thevathason - Actg. Senior Manag
Abbotsleigh Robin Winter - Senior Manager
Strathdon P Udeni Wanigatunge - Senior Manager
Lindula Region
Henfold Chaminda Oliver - Manager(Resigned w.e.f 28/04/2012)
Waltrim M S A Akber - Senior Manager
Tangakelle Kapila Sumanarathne - Manager
Agrakande Channa D Ikiriwatte - Manager
Ouvahkelle Harsha P T Hulangamuwa - Manager
Lippakelle A P Premachandra - Actg. Manager
Udugama Region
Nakiyadeniya Rubber N P Chamika Naranapitiya - Actg.Senior Manage
Nakiyadeniya Oil Palm Ruwan Gunaratne - Actg. Manager
Talangaha Dhanushka Daswatte - Manager
Homadola Gamini N Ratnayake - Senior Manager
Palm Oil Mill H Milton Wijepala - General Manager
Prole of theExecutive Committee
annual report 2011 | 20annual report 2011 | 20

8/14/2019 Watawala Plantations 2011.2012.pdf
http://slidepdf.com/reader/full/watawala-plantations-20112012pdf 28/160
Dr D V SeevaratnamDirector/CEO
V Govindasamy Managing Director
D S RatnasinghamDirector
Lalith Cooray Chief Financial Ofcer
Executive Committee
Management ReportsWatawala Plantations PLC
26

8/14/2019 Watawala Plantations 2011.2012.pdf
http://slidepdf.com/reader/full/watawala-plantations-20112012pdf 29/160
8/14/2019 Watawala Plantations 2011.2012.pdf
http://slidepdf.com/reader/full/watawala-plantations-20112012pdf 30/160
MANUFACTURINGBRIQUETTES OUT OF
REFUSE TEAPROTECTING THE ENVIRONMENT BY REDUCING THE FELLING OF TREES

8/14/2019 Watawala Plantations 2011.2012.pdf
http://slidepdf.com/reader/full/watawala-plantations-20112012pdf 31/160
8/14/2019 Watawala Plantations 2011.2012.pdf
http://slidepdf.com/reader/full/watawala-plantations-20112012pdf 32/160
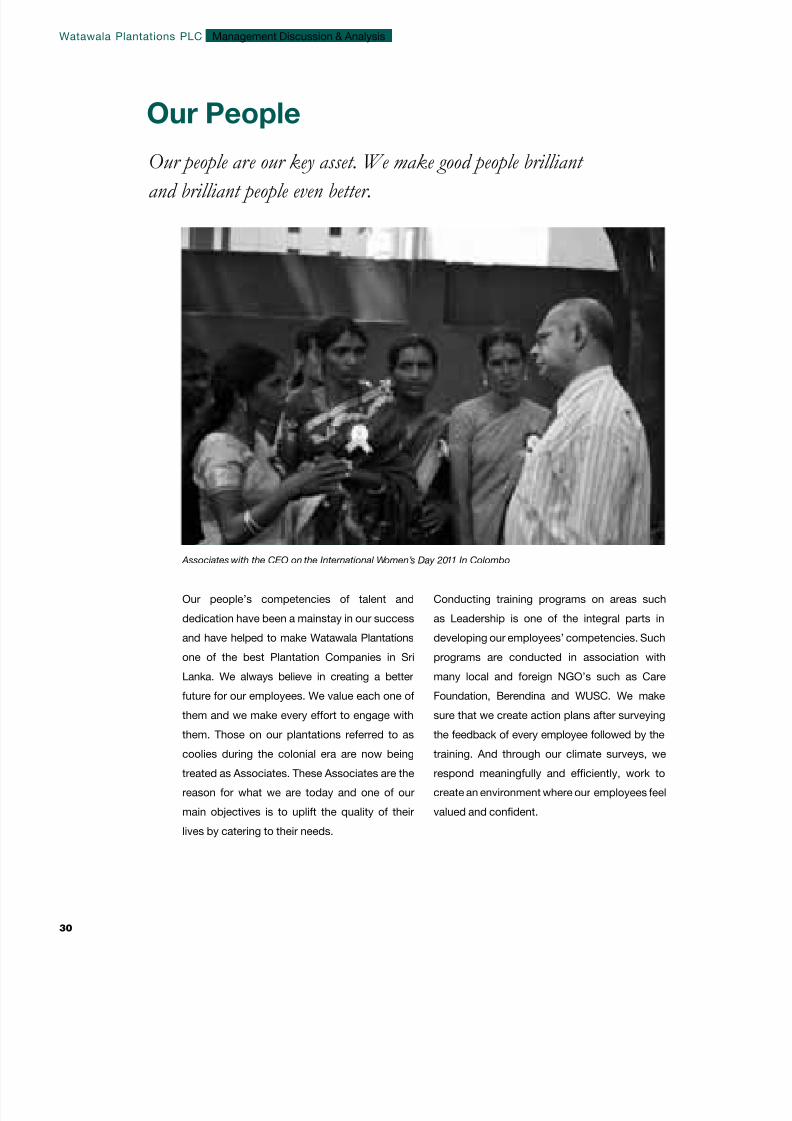
Our People
Our people’s competencies of talent and
dedication have been a mainstay in our success
and have helped to make Watawala Plantations
one of the best Plantation Companies in Sri
Lanka. We always believe in creating a better
future for our employees. We value each one of
them and we make every effort to engage with
them. Those on our plantations referred to ascoolies during the colonial era are now being
treated as Associates. These Associates are the
reason for what we are today and one of our
main objectives is to uplift the quality of their
lives by catering to their needs.
Associates with the CEO on the International Women’s Day 2011 In Colombo
Our people are our key asset. We make good people brilliant
and brilliant people even better.
Conducting training programs on areas such
as Leadership is one of the integral parts in
developing our employees’ competencies. Such
programs are conducted in association with
many local and foreign NGO’s such as Care
Foundation, Berendina and WUSC. We make
sure that we create action plans after surveying
the feedback of every employee followed by thetraining. And through our climate surveys, we
respond meaningfully and efciently, work to
create an environment where our employees feel
valued and condent.
Watawala Plantations PLC
30
Management Discussion & Analysis

8/14/2019 Watawala Plantations 2011.2012.pdf
http://slidepdf.com/reader/full/watawala-plantations-20112012pdf 33/160
Knowledge Inventory
To survive in this volatile industry, having adequate
paper qualications is a must. We have clearly dened
the career path of the executives starting from the
trainee level to Chief Executive Level. Our company
strongly persuades and encourages our team to follow
professional courses. Reimbursement of course fees
in full on successful completion of these courses
embarked upon is introduced as a motivating factor.
Knowledge Inventory - 2011/2012
2011/2012 2010/2011 2009/2010 2008/2009 2007/2008
Senior Management 8 17 10 10 10
Head Ofce Executives 26 27 54 69 55
Estate Managers & Executives 63 93 54 53 53
Head Ofce Staff and other Ofcers 21 37 88 79 86
Estate Staff and other ofcers 632 698 668 655 654
Sub Total 750 872 874 866 858
Associates 11,418 11,744 12,167 12,357 13,403
Total Employees 12,168 12,616 13,041 13,223 14,261
Turnover per Employee Rs.’000’ 372.74 488.13 430.31 309.25 302.48
Prot per Employee Rs.‘000’ 33.91 32.48 32.48 6.04 28.36
Assets per Employee Rs.’000’ 464.17 354.56 354.56 291.84 256.01
Human Resources
Staff Strength
annual report 2011 | 20annual report 2011 | 20
8/14/2019 Watawala Plantations 2011.2012.pdf
http://slidepdf.com/reader/full/watawala-plantations-20112012pdf 34/160
Age Analysis Of The Employees
Service Analysis Of The Employees
Age
Group
Senior
Mgt.
Head Ofce
Executives
Estate
Managers &
Executives
HeadOfce
Staff &
others
Estate
Staff &
others Associates
Total
2012
Total
2011
Above 55 4 5 3 3 84 865 964 1,222
45-54 2 4 7 6 204 2,769 2,992 3,361
35-44 2 8 18 7 147 3,362 3,544 3,442
25-34 - 9 34 5 165 3,464 3,677 3,478
Below 24 - - 1 - 32 958 991 1,113
Total 8 26 63 21 632 11,418 12,168 12,616
Age
Group
Senior
Mgt.
Head Ofce
Executives
Estate
Managers &
Executives
Head
Ofce
Staff &
others
Estate
Staff &
others Associates
Total
2012
Total
2011
Above 20 - 1 - - 165 3,402 3,568 3,688
16-20 2 2 3 1 60 982 1,051 1,131
11-15 - 1 1 - 84 2,001 2,086 2,062
06 -10 1 7 18 9 96 2,009 2,140 1,973
Below 05 5 15 41 11 227 3,024 3,323 3,762
Total 8 26 63 21 632 11,418 12,168 12,616
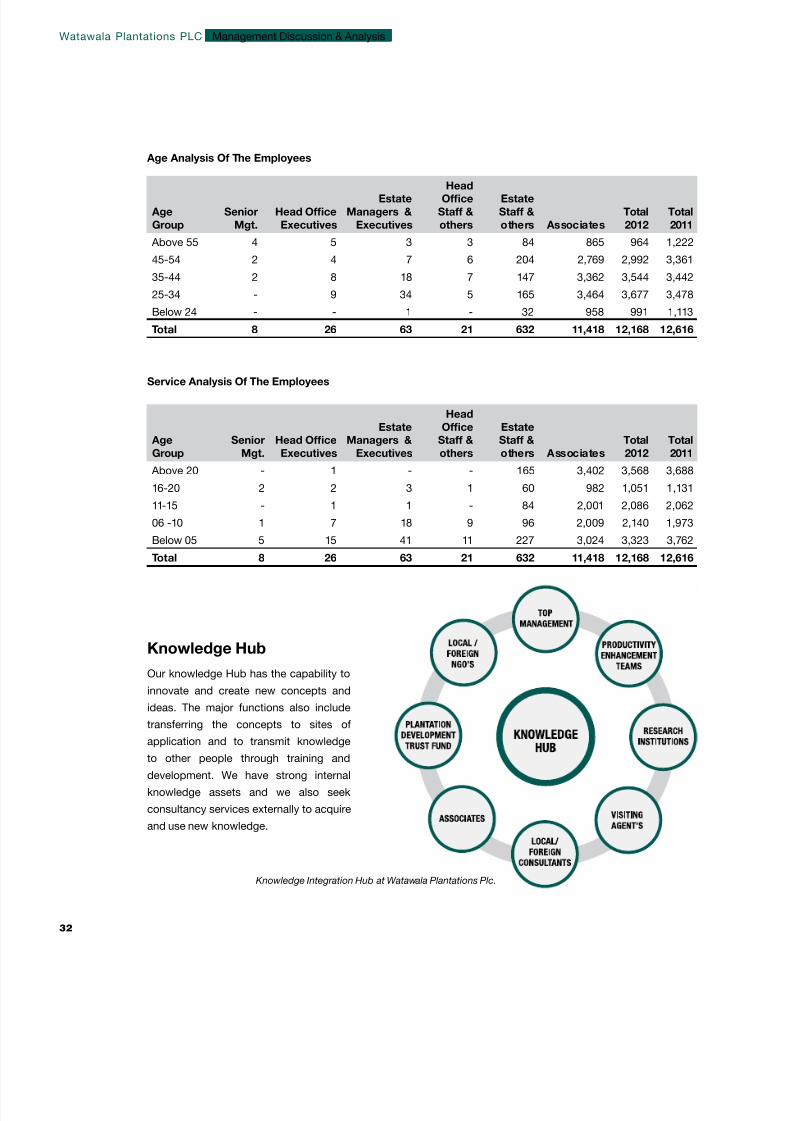
Knowledge Hub
Our knowledge Hub has the capability to
innovate and create new concepts and
ideas. The major functions also include
transferring the concepts to sites of
application and to transmit knowledge
to other people through training and
development. We have strong internal
knowledge assets and we also seek
consultancy services externally to acquire
and use new knowledge.
Knowledge Integration Hub at Watawala Plantations Plc.
Watawala Plantations PLC
32
Management Discussion & Analysis
8/14/2019 Watawala Plantations 2011.2012.pdf
http://slidepdf.com/reader/full/watawala-plantations-20112012pdf 35/160
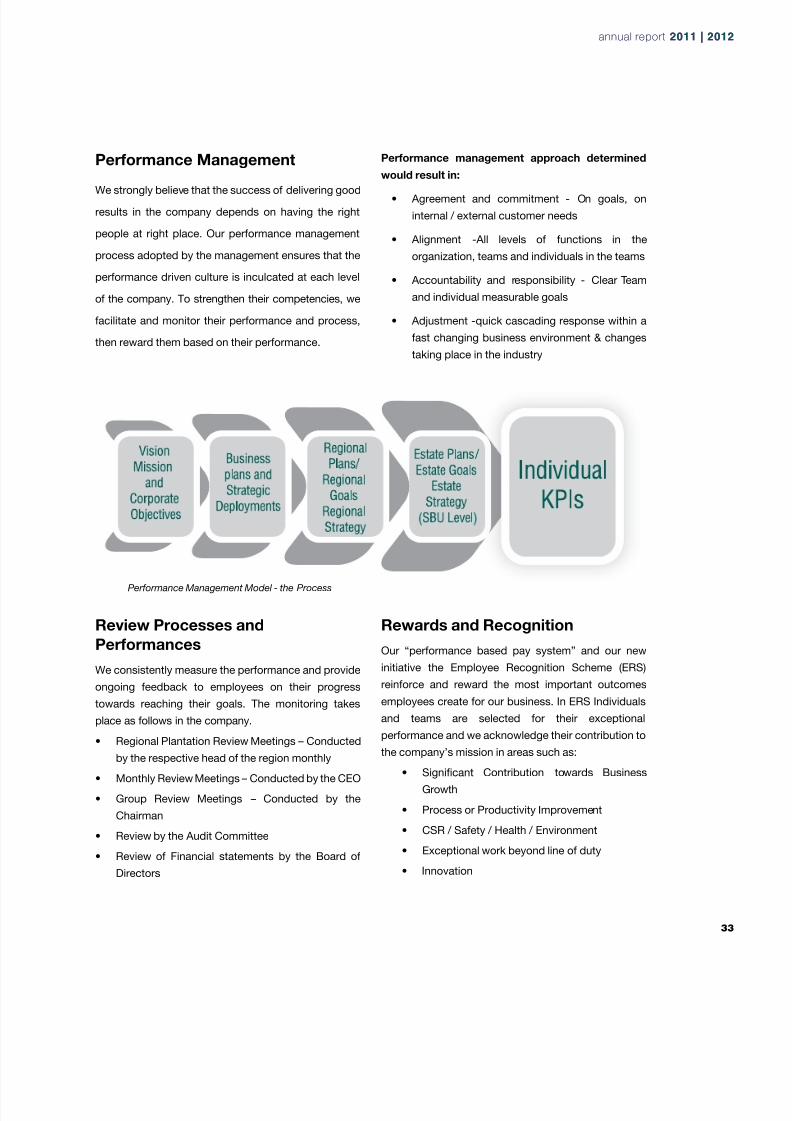
Performance Management
We strongly believe that the success of delivering good
results in the company depends on having the right
people at right place. Our performance management
process adopted by the management ensures that the
performance driven culture is inculcated at each level
of the company. To strengthen their competencies, we
facilitate and monitor their performance and process,
then reward them based on their performance.
Performance management approach determined
would result in:
• Agreement and commitment - On goals, on
internal / external customer needs
• Alignment -All levels of functions in the
organization, teams and individuals in the teams
• Accountability and responsibility - Clear Team
and individual measurable goals
• Adjustment -quick cascading response within a
fast changing business environment & changes
taking place in the industry
Performance Management Model - the Process
Review Processes and
Performances
We consistently measure the performance and provide
ongoing feedback to employees on their progress
towards reaching their goals. The monitoring takes
place as follows in the company.
• Regional Plantation Review Meetings – Conducted
by the respective head of the region monthly
• Monthly Review Meetings – Conducted by the CEO
• Group Review Meetings – Conducted by the
Chairman
• Review by the Audit Committee
• Review of Financial statements by the Board of
Directors
Rewards and Recognition
Our “performance based pay system” and our new
initiative the Employee Recognition Scheme (ERS)
reinforce and reward the most important outcomes
employees create for our business. In ERS Individuals
and teams are selected for their exceptional
performance and we acknowledge their contribution tothe company’s mission in areas such as:
• Signicant Contribution towards Business
Growth
• Process or Productivity Improvement
• CSR / Safety / Health / Environment
• Exceptional work beyond line of duty
• Innovation
annual report 2011 | 20annual report 2011 | 20
8/14/2019 Watawala Plantations 2011.2012.pdf
http://slidepdf.com/reader/full/watawala-plantations-20112012pdf 36/160
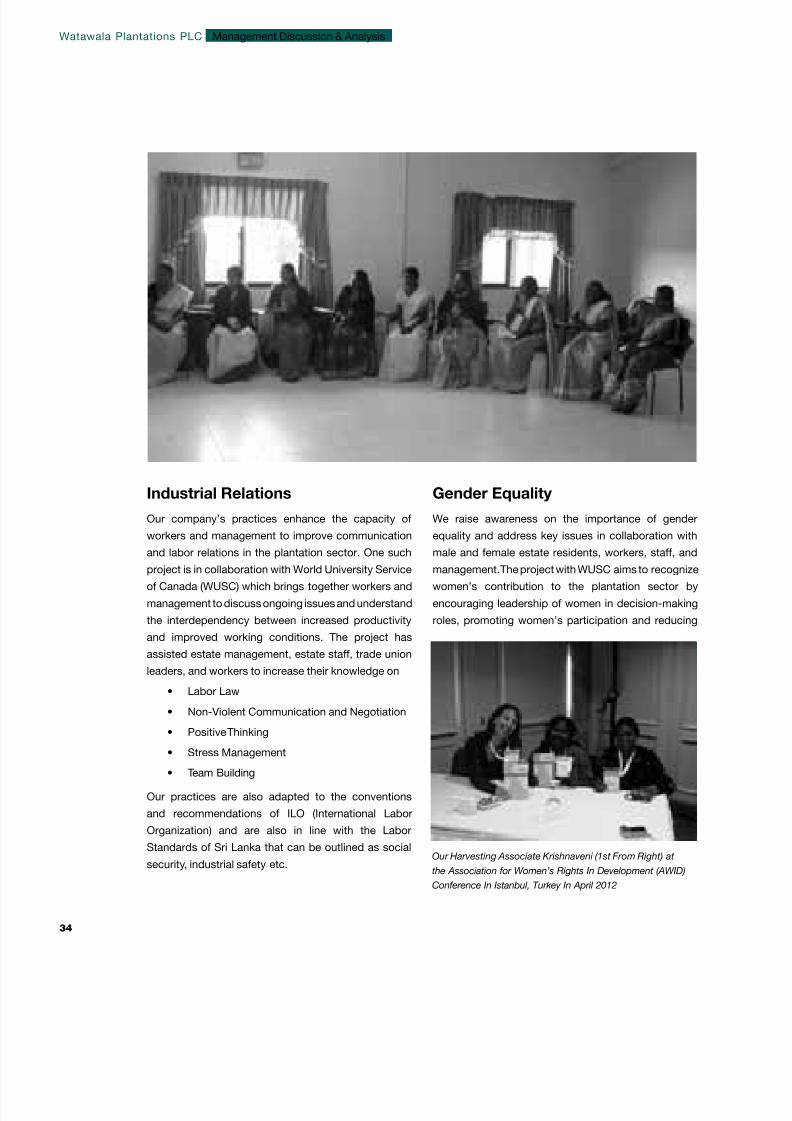
Industrial Relations
Our company’s practices enhance the capacity of
workers and management to improve communication
and labor relations in the plantation sector. One suchproject is in collaboration with World University Service
of Canada (WUSC) which brings together workers and
management to discuss ongoing issues and understand
the interdependency between increased productivity
and improved working conditions. The project has
assisted estate management, estate staff, trade union
leaders, and workers to increase their knowledge on
• Labor Law
• Non-Violent Communication and Negotiation
• Positive Thinking
• Stress Management
• Team Building
Our practices are also adapted to the conventions
and recommendations of ILO (International Labor
Organization) and are also in line with the Labor
Standards of Sri Lanka that can be outlined as social
security, industrial safety etc.Our Harvesting Associate Krishnaveni (1st From Right) at
the Association for Women’s Rights In Development (AWID)
Conference In Istanbul, Turkey In April 2012
Gender Equality
We raise awareness on the importance of gender
equality and address key issues in collaboration with
male and female estate residents, workers, staff, andmanagement. The project with WUSC aims to recognize
women’s contribution to the plantation sector by
encouraging leadership of women in decision-making
roles, promoting women’s participation and reducing
Watawala Plantations PLC
34
Management Discussion & Analysis
8/14/2019 Watawala Plantations 2011.2012.pdf
http://slidepdf.com/reader/full/watawala-plantations-20112012pdf 37/160
gender based violence.The main areas of focus include:
• Assisting Neighborhood Women’s Groups
(NWGs) as support system for Women
• Addressing gender based Violence
• Supporting Alcohol Harm Reduction
• Improving Women’s Health
The key goal of this is to support women to take up
leadership positions on the estate based community
and organizations.
Employer-Employee Relationship
The Community Development Forum (CDF) is yet
another of our innovations in the empowerment of
our associates. These we have established in 3 of our
estates and due to its success we are in the process
of extending this initiative in a further 3 of our estates.
Through the CDF the Management and Associates
meet at monthly intervals and put their heads together
to solve day today issues that occur in the estate.
Unlike in the otherwise considered conventional way
of problem solving, here each and every person is
given an opportunity to take part in the process of
solving matters by which they take pride not only by
contributing for decision making, but also are being
given due recognition. Apart from that there are a few
other benets that the community enjoys as a result
of being able to attract the operations and services of
government and other service providers, transparency
of welfare activities on the estate, channeling all the
welfare and operations by NGOs if any through the
CDF so that overlapping of activities would not occur,
discussion of productivity parameters, estate village
integration and training on various aspects.
annual report 2011 | 20annual report 2011 | 20
8/14/2019 Watawala Plantations 2011.2012.pdf
http://slidepdf.com/reader/full/watawala-plantations-20112012pdf 38/160
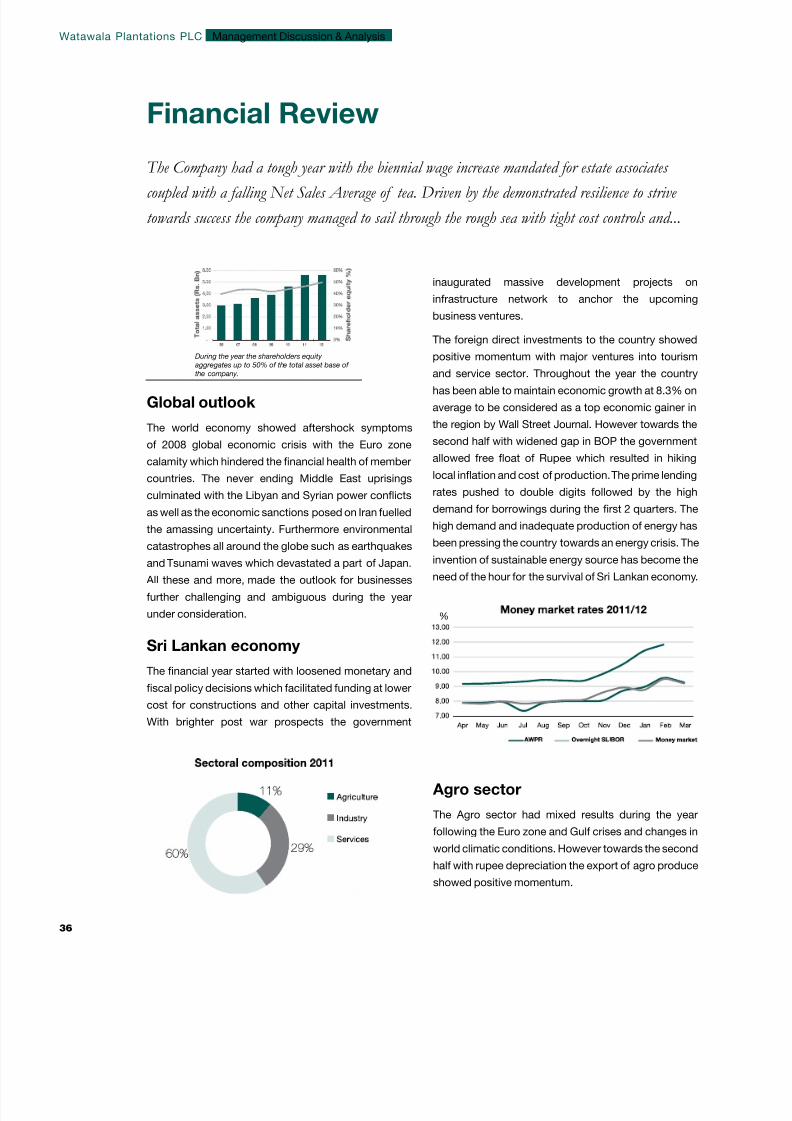
Financial Review
Global outlook
The world economy showed aftershock symptoms
of 2008 global economic crisis with the Euro zone
calamity which hindered the nancial health of member
countries. The never ending Middle East uprisings
culminated with the Libyan and Syrian power conicts
as well as the economic sanctions posed on Iran fuelled
the amassing uncertainty. Furthermore environmental
catastrophes all around the globe such as earthquakes
and Tsunami waves which devastated a part of Japan.
All these and more, made the outlook for businesses
further challenging and ambiguous during the year
under consideration.
Sri Lankan economy
The nancial year started with loosened monetary and
scal policy decisions which facilitated funding at lower
cost for constructions and other capital investments.
With brighter post war prospects the government
inaugurated massive development projects on
infrastructure network to anchor the upcoming
business ventures.
The foreign direct investments to the country showed
positive momentum with major ventures into tourism
and service sector. Throughout the year the country
has been able to maintain economic growth at 8.3% on
average to be considered as a top economic gainer in
the region by Wall Street Journal. However towards the
second half with widened gap in BOP the government
allowed free oat of Rupee which resulted in hiking
local ination and cost of production. The prime lending
rates pushed to double digits followed by the high
demand for borrowings during the rst 2 quarters. The
high demand and inadequate production of energy has
been pressing the country towards an energy crisis. The
invention of sustainable energy source has become the
need of the hour for the survival of Sri Lankan economy.
The Company had a tough year with the biennial wage increase mandated for estate associates
coupled with a falling Net Sales Average of tea. Driven by the demonstrated resilience to strive
towards success the company managed to sail through the rough sea with tight cost controls and...
Agro sector
The Agro sector had mixed results during the year
following the Euro zone and Gulf crises and changes in
world climatic conditions. However towards the second
half with rupee depreciation the export of agro produce
showed positive momentum.
During the year the shareholders equity
aggregates up to 50% of the total asset base of
the company.
%
Watawala Plantations PLC
36
Management Discussion & Analysis

8/14/2019 Watawala Plantations 2011.2012.pdf
http://slidepdf.com/reader/full/watawala-plantations-20112012pdf 39/160
8/14/2019 Watawala Plantations 2011.2012.pdf
http://slidepdf.com/reader/full/watawala-plantations-20112012pdf 40/160
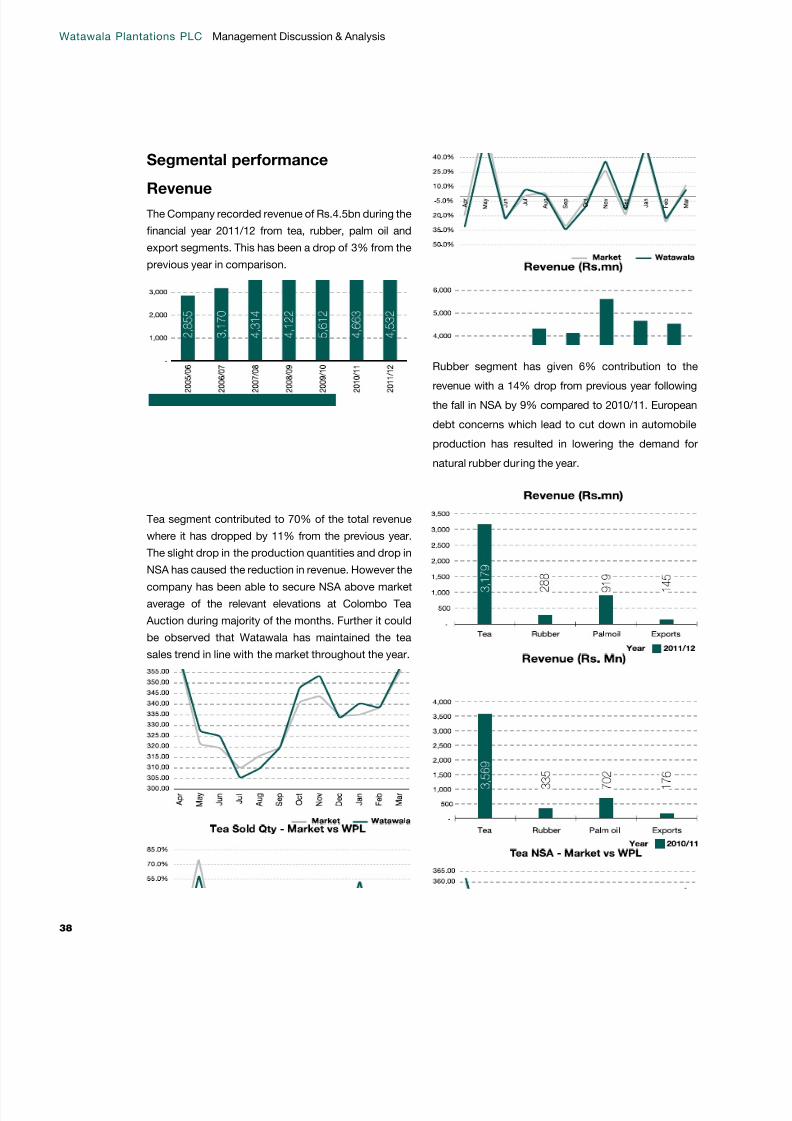
Segmental performance
Revenue
The Company recorded revenue of Rs.4.5bn during the
nancial year 2011/12 from tea, rubber, palm oil and
export segments. This has been a drop of 3% from the
previous year in comparison.
Tea segment contributed to 70% of the total revenue
where it has dropped by 11% from the previous year.
The slight drop in the production quantities and drop inNSA has caused the reduction in revenue. However the
company has been able to secure NSA above market
average of the relevant elevations at Colombo Tea
Auction during majority of the months. Further it could
be observed that Watawala has maintained the tea
sales trend in line with the market throughout the year.
Rubber segment has given 6% contribution to therevenue with a 14% drop from previous year following
the fall in NSA by 9% compared to 2010/11. European
debt concerns which lead to cut down in automobile
production has resulted in lowering the demand for
natural rubber during the year.
Watawala Plantations PLC
38
Management Discussion & Analysis

8/14/2019 Watawala Plantations 2011.2012.pdf
http://slidepdf.com/reader/full/watawala-plantations-20112012pdf 41/160
Palm Oil segment boosted its contribution with 20.2%
slice of revenue which is an increase of 31% from last
year being the only segment with a positive movement
from 2010/11. Increase in production by 28% with
better agricultural practices, improved processing
facilities at Nakiadeniya Mill and better prices achieved
has caused this positive outcome.
Protability
The Company completed a year with mixed results
following heavy cost and squeezed margins. The wage
increase had been the headline for the year in theplantation sector which had a net impact of 27% over
the pay in previous year.
On a quarterly basis the revenue and protability
showed an analogous trend except for Quarter 4, and
only Q3 and Q4 showing positive net results.
Prot before tax (PBT)
Tea segment ended up with a loss of Rs.501mn as a
consequence of additional cost tied to the wage hike.
This has been 20 times increase in the loss from the
previous year which recorded loss of Rs.25mn.
Rubber segment recorded a prot before tax of Rs.60mn
which has been a drop of 57% from the previous year.
This was as a result of lower prices in the market and
annual report 2011 | 20annual report 2011 | 20

8/14/2019 Watawala Plantations 2011.2012.pdf
http://slidepdf.com/reader/full/watawala-plantations-20112012pdf 42/160
the drop in rubber exposure during the year with more
emphasis given on palm oil segment.
Palm oil segment being the premier gainer of the year
was able to achieve Rs.373mn prot before tax. This
was an increase of 90% from the prior year. Extending
the palm oil cultivation land , better agricultural
practices and improved mill facilities followed by better
prices in the market tr iggered the improved protability.
Palm oil has contributed 71% of the total prots made
by the Company during the year.
Export segment had a sluggish outlook throughout theyear with adverse impact posed due to the crisis in
Euro zone and uncertainty in gulf region. The segment
showed a drop of almost 100% in protability with a
marginal loss reported during the year.
Return on equity (ROE)
The Group generated a return on equity of 15% for the
nancial year which has been 10% drop from the prior
year. Decline in the prots and increase in total equity
impelled the dip in ROE.
Return on assets (ROA)
The Group has been able to generate a return of 7%
using the total asset base during the nancial year. This
has been a drop of 4% compared to the previous year
due to lower protability.
Earnings per share (EPS)During the nancial year the Group has generated
Rs.1.74 prot for each unit of shares. (Total Ordinary
shares: 236.67mn). This has been a drop of 36%
compared to the previous year.
Moreover the cash generated from operations per
share was Rs.2.67 for the year where the same has
been Rs.3.64 in 2010/11.
Price earnings ratio (PER)
The nancial year ended 31/03/2012 recorded a PER of
5.74 for Watawala share. During the previous year this
has been 9.21. The year closed with a market price of
Rs.10 per share of the company traded on Colombo
Stocks Exchange. (Rs.24.50 as at 31/03/2011)
Watawala Plantations PLC
40
Management Discussion & Analysis
8/14/2019 Watawala Plantations 2011.2012.pdf
http://slidepdf.com/reader/full/watawala-plantations-20112012pdf 43/160
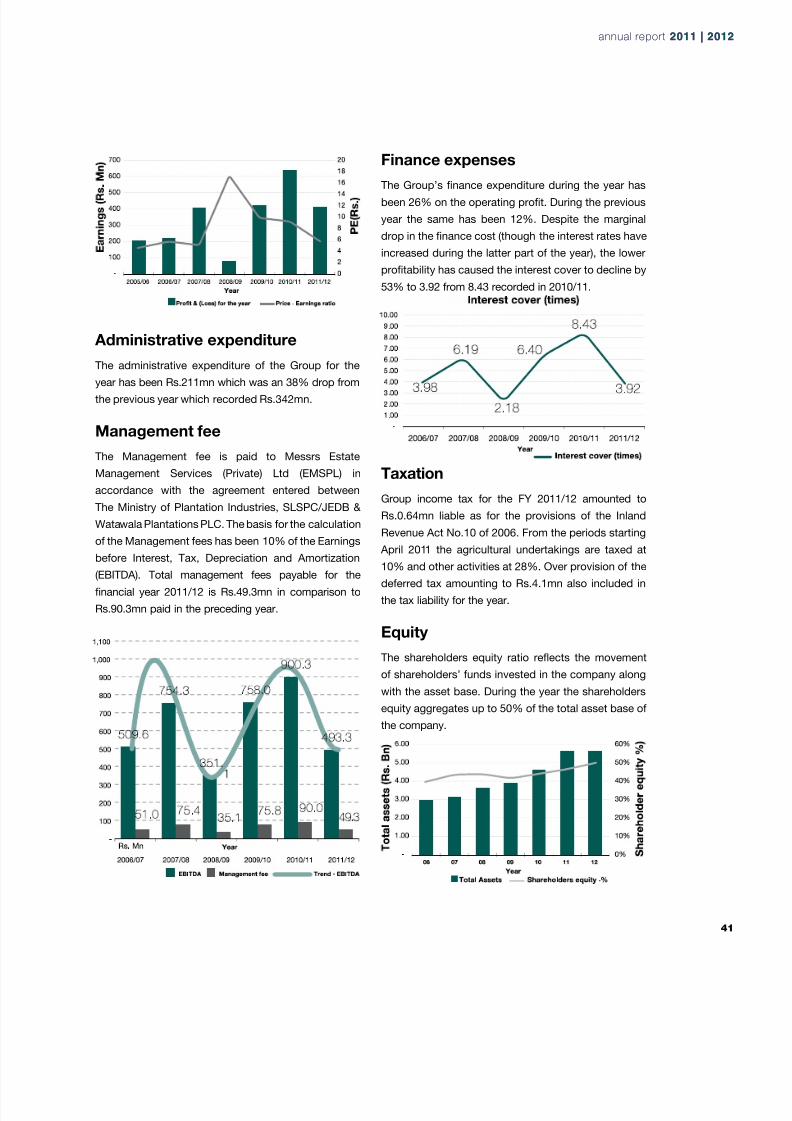
Administrative expenditure
The administrative expenditure of the Group for theyear has been Rs.211mn which was an 38% drop from
the previous year which recorded Rs.342mn.
Management fee
The Management fee is paid to Messrs Estate
Management Services (Private) Ltd (EMSPL) in
accordance with the agreement entered between
The Ministry of Plantation Industries, SLSPC/JEDB &
Watawala Plantations PLC. The basis for the calculation
of the Management fees has been 10% of the Earnings
before Interest, Tax, Depreciation and Amortization
(EBITDA). Total management fees payable for the
nancial year 2011/12 is Rs.49.3mn in comparison to
Rs.90.3mn paid in the preceding year.
Finance expenses
The Group’s nance expenditure during the year has
been 26% on the operating prot. During the previous
year the same has been 12%. Despite the marginal
drop in the nance cost (though the interest rates have
increased during the latter part of the year), the lower
protability has caused the interest cover to decline by
53% to 3.92 from 8.43 recorded in 2010/11.
Taxation
Group income tax for the FY 2011/12 amounted to
Rs.0.64mn liable as for the provisions of the Inland
Revenue Act No.10 of 2006. From the periods starting
April 2011 the agricultural undertakings are taxed at10% and other activities at 28%. Over provision of the
deferred tax amounting to Rs.4.1mn also included in
the tax liability for the year.
Equity
The shareholders equity ratio reects the movement
of shareholders’ funds invested in the company along
with the asset base. During the year the shareholders
equity aggregates up to 50% of the total asset base of
the company.
annual report 2011 | 20annual report 2011 | 20

8/14/2019 Watawala Plantations 2011.2012.pdf
http://slidepdf.com/reader/full/watawala-plantations-20112012pdf 44/160
Market value added (MVA)
MVA is an indication of the value addition ability of a
Company to the shareholders’ funds invested. MVA is
arrived at by subtracting the shareholder funds from
the market value of shares. During the nancial year
2011/12 the market value addition has deteriorated by
Rs.465mn following the drop in market price of share
to Rs.10 from Rs.24.5 recorded the year before. This
has been 114% drop in MVA from Rs.3.3bn recorded
in 2010/11.
Enterprise value (EV)
Enterprise value is considered as potential takeover
price of company hence it is derived from the market
capitalization. During the year EV of the company has
dropped substantially to Rs.3.05bn from Rs.6.6bn
recorded in 2010/11. This was as a consequence of
drop in market price of a share by 59%.
Enterprise multiple (EM)
Enterprise Multiple is arrived at by dividing the
Enterprise value by EBITDA of the Company where it
could be used to compare value across companies.
During the year EM has dropped to 6.2 times in
comparison to 7.34 times marked in 2010/11. This was
as a result of lower earnings and lower market price of
shares traded.
Dividends
The Board of Directors have recommended a rst
and nal dividend of Rs.0.35 per share amounting to
Rs. 82.8mn out of the prot arising from the nancial
year 2011/12 (FY 2010/11 – Rs. 201mn), which is to be
approved by the shareholders at the Annual General
Meeting to be held on 6 July 2012.
The Cumulative Average Dividend Payout (DPO) of
the company from 1996 to nancial year 2011/12 is
approximately 18%.
Borrowings
Watawala Plantations PLC
42
Management Discussion & Analysis
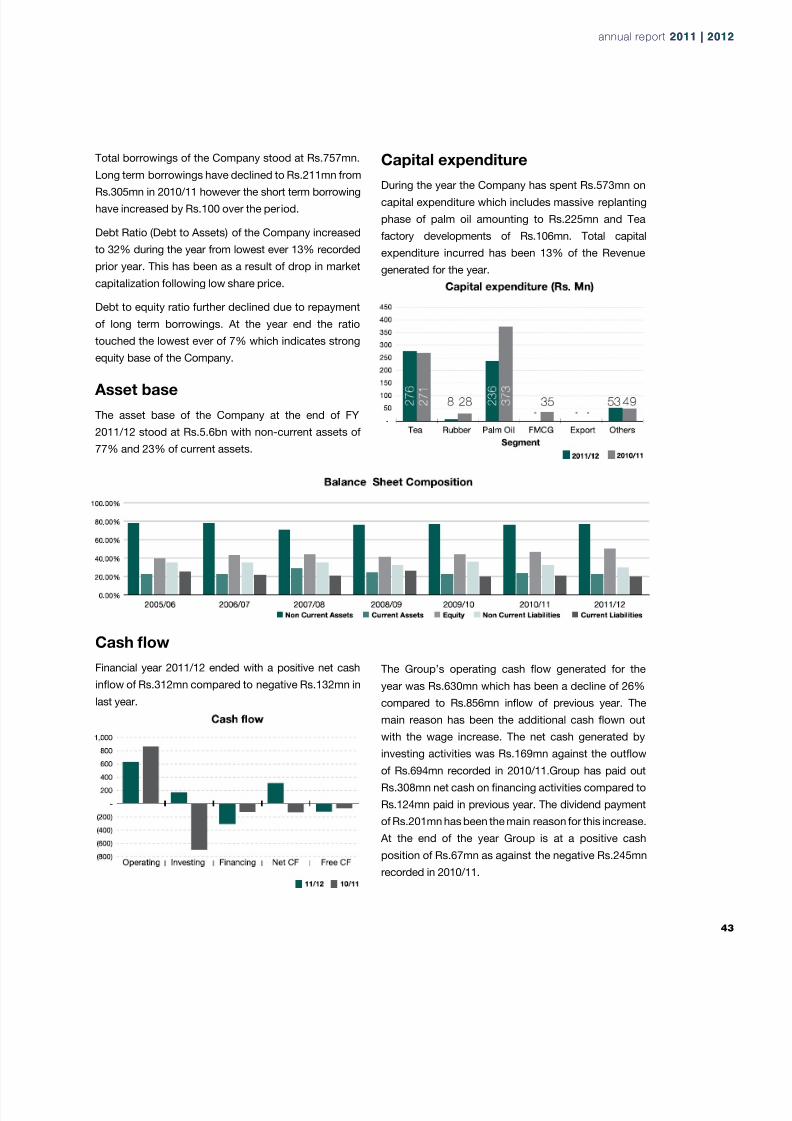
8/14/2019 Watawala Plantations 2011.2012.pdf
http://slidepdf.com/reader/full/watawala-plantations-20112012pdf 45/160
Total borrowings of the Company stood at Rs.757mn.
Long term borrowings have declined to Rs.211mn from
Rs.305mn in 2010/11 however the short term borrowing
have increased by Rs.100 over the period.
Debt Ratio (Debt to Assets) of the Company increased
to 32% during the year from lowest ever 13% recorded
prior year. This has been as a result of drop in market
capitalization following low share price.
Debt to equity ratio further declined due to repayment
of long term borrowings. At the year end the ratio
touched the lowest ever of 7% which indicates strong
equity base of the Company.
Asset base
The asset base of the Company at the end of FY
2011/12 stood at Rs.5.6bn with non-current assets of
77% and 23% of current assets.
Capital expenditure
During the year the Company has spent Rs.573mn on
capital expenditure which includes massive replanting
phase of palm oil amounting to Rs.225mn and Tea
factory developments of Rs.106mn. Total capital
expenditure incurred has been 13% of the Revenue
generated for the year.
Cash ow
Financial year 2011/12 ended with a positive net cash
inow of Rs.312mn compared to negative Rs.132mn in
last year.
The Group’s operating cash ow generated for the
year was Rs.630mn which has been a decline of 26%
compared to Rs.856mn inow of previous year. The
main reason has been the additional cash own out
with the wage increase. The net cash generated byinvesting activities was Rs.169mn against the outow
of Rs.694mn recorded in 2010/11.Group has paid out
Rs.308mn net cash on nancing activities compared to
Rs.124mn paid in previous year. The dividend payment
of Rs.201mn has been the main reason for this increase.
At the end of the year Group is at a positive cash
position of Rs.67mn as against the negative Rs.245mn
recorded in 2010/11.
annual report 2011 | 20annual report 2011 | 20

8/14/2019 Watawala Plantations 2011.2012.pdf
http://slidepdf.com/reader/full/watawala-plantations-20112012pdf 46/160
Free cash ow (FCF)
The free cash ow is the net cash generated by a
company after providing funds for enhancement of
the asset base by way of capital expenditure. For the
nancial year 2011/12 the FCF for the Group is negative
Rs.122mn in comparison to net outow of Rs.70mn
in the previous year. In spite of the decline in capital
expenditure by 24% the FCF has got weakened during
the period. This has been due to the drop in cash
generated from the operations as a consequence of
the wage impact.
Working capital
During the year the working capital cycle has speeded
up by 33% with improved inventory and cash ow
management. The average cycle is recorded as 20days
in comparison to 33 days in the previous year. Group
has been able to reduce the days tied in inventory
to 44 which is a 25% improvement from 59 days in
comparison.
31/Mar/12 31/Mar/11
Total current assets 1,312,040 1,326,548
Less: Total current liabilities 1,153,964 1,198,267
Working capital 158,076 128,281
Current ratio (times) 1.14 1.11
Followed by the improvement in WC cycle, Group
recorded a current ratio of 1.14 times during the year in
comparison to 1.11 times in 2010/11.
In to the future
The Sri Lankan plantation sector is paramount to the
economy with a contribution of 18% to the national
export revenue. However in 2011 the major commercial
crops tea, rubber and coconut showed sluggish
performance. The tea industry was under severe
pressure due to European crisis and Middle East
political conicts.
The future of Ceylon tea comes with the challenge of
productivity and facing competition that will likely to be
imposed by China, Kenya and north east India with low
cost of production.
The rubber market is expected to pick up as the Asian
manufacturers of automobile will increase demand
for natural rubber such as China and India. However
the margins will be thinner compared to US and EU
markets.
The future of local plantation sector will be reshaped
with increased importance of growing oil palm as a
commercial crop. Currently only 4 RPCs have invested
on Oil palm however in time to come this sector is
expected to replace the traditional coconut sector with
government sustenance.
Further the government is looking forward to self-
sufciency in Milk requirement of the country where
the investments in to Dairy production is expected to
incline.
Above all the challenges, inventing a sustainable
energy source has become critical and will be of equal
importance to all the sectors in the economy. With
crude oil prices swelling across nding substitute
energy sources and investing in to mini hydro projects
are becoming increasingly important.
We at Watawala plantations have set our vision on
taking a path which no other would have walked in and
contemporaneously looking forward to re-shape the
future of the company grasping fruitful opportunities
lying ahead to remain as the best plantation company
while diversifying and building up on our key strengths
‘people’ and ultimately safe guarding the planet.
Watawala Plantations PLC
44
Management Discussion & Analysis

8/14/2019 Watawala Plantations 2011.2012.pdf
http://slidepdf.com/reader/full/watawala-plantations-20112012pdf 47/160
8/14/2019 Watawala Plantations 2011.2012.pdf
http://slidepdf.com/reader/full/watawala-plantations-20112012pdf 48/160
MECHANIZATION -MACHINE PRUNINGIMPROVE EFFICIENCY & REDUCE COST
8/14/2019 Watawala Plantations 2011.2012.pdf
http://slidepdf.com/reader/full/watawala-plantations-20112012pdf 49/160
Corporate Governance
Remuneration Committee Report
Audit Committee Report
Risk Management
CORPORATEGOVERNANCE
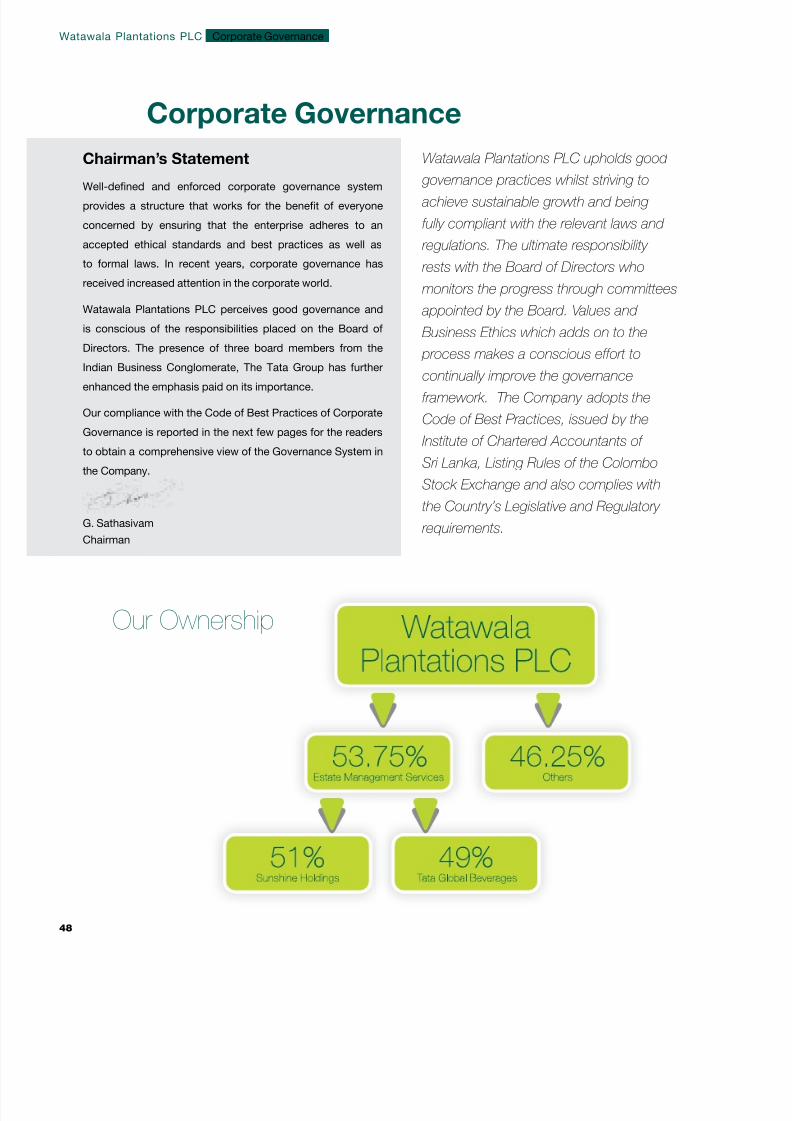
8/14/2019 Watawala Plantations 2011.2012.pdf
http://slidepdf.com/reader/full/watawala-plantations-20112012pdf 50/160
Chairman’s Statement
Well-dened and enforced corporate governance system
provides a structure that works for the benet of everyone
concerned by ensuring that the enterprise adheres to an
accepted ethical standards and best practices as well as
to formal laws. In recent years, corporate governance has
received increased attention in the corporate world.
Watawala Plantations PLC perceives good governance and
is conscious of the responsibilities placed on the Board of
Directors. The presence of three board members from the
Indian Business Conglomerate, The Tata Group has further
enhanced the emphasis paid on its importance.
Our compliance with the Code of Best Practices of Corporate
Governance is reported in the next few pages for the readers
to obtain a comprehensive view of the Governance System in
the Company.
G. Sathasivam
Chairman
Corporate Governance
Watawala Plantations PLC upholds good
governance practices whilst striving to achieve sustainable growth and being
fully compliant with the relevant laws and
regulations. The ultimate responsibility
rests with the Board of Directors who
monitors the progress through committees
appointed by the Board. Values and
Business Ethics which adds on to the
process makes a conscious effort to
continually improve the governance
framework. The Company adopts the
Code of Best Practices, issued by the
Institute of Chartered Accountants of
Sri Lanka, Listing Rules of the Colombo
Stock Exchange and also complies with
the Country’s Legislative and Regulatory
requirements.
Our Ownership
Watawala Plantations PLC
48
Corporate Governance
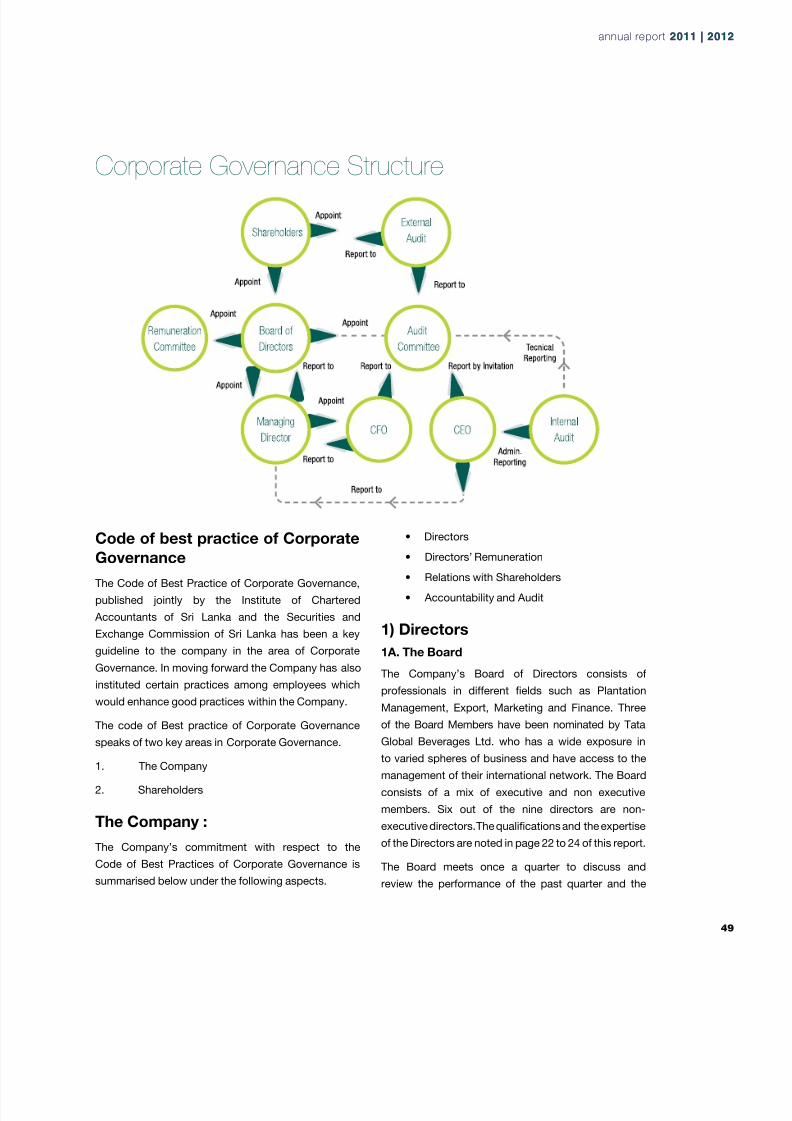
8/14/2019 Watawala Plantations 2011.2012.pdf
http://slidepdf.com/reader/full/watawala-plantations-20112012pdf 51/160
8/14/2019 Watawala Plantations 2011.2012.pdf
http://slidepdf.com/reader/full/watawala-plantations-20112012pdf 52/160

8/14/2019 Watawala Plantations 2011.2012.pdf
http://slidepdf.com/reader/full/watawala-plantations-20112012pdf 53/160
stakeholders’ requirements as important in taking
corporate decisions. Diversication into Exports,
Dairy Farming etc. has been carried out to have
sustainable prots and to enhance the stake holder
value. The Company has also embarked on several
cost reduction methods which are highlighted in
the “Sector Separators” of this Annual Report.
• Values and standards of the Company are
set with emphasis on adopting appropriate
accounting policies and complying with
nancial regulations.
The accounting policies are reviewed regularly
and the Audit Committee keeps abreast with the
new pronouncements of accounting standards
and nancial regulations. The Company has been
adopting Sri Lanka Accounting Standards (SLAS)
throughout the years which is also certied by the
Auditors PriceWaterhouseCoopers. The Company
is also now geared to migrate to International
Financial Reporting Standard (IFRS) in the current
period.
• Fullling other Board Functions as relevant to
the Organization
Board makes every endeavor to fulll their
obligation to the stakeholders.
(ii) Need to act in accordance with the relevant
laws and seek Independent Professional
Advice.
Board ensures compliance with the applicable laws
wherever required obtains professional advise from
outside parties. The Company’s legal consultants
are F. J. & G De Saram. The company also obtains
advice on other issues such as taxation, product
development and technology development
from local and overseas consultants, wherever
necessary. Any Director may obtain independent
professional advice that may be required in
discharging his responsibilities effectively, at
Company’s expense.
(iii) Company Secretary
The Company Secretaries are Secretaries and
Financial Services (Private) Ltd who acts as
Secretaries to the Board and make their presence
at every board meeting. The Company Secretaries
advises the board on all regulatory matters
pertaining to Colombo Stock Exchange, Securities
& Exchange Commission. The Secretaries also
record minutes which are tabled for approval at the
next meeting for effective follow-up on decisions
taken.
(iv) Independent Judgment of Directors
The Directors use their independent judgments
in making decisions. Six of the nine Directors are
non-executive and two are independent.
(v) Directors dedication of time and effort
In addition to the attendance and participation at
the Board Meetings, the Board Members make
their time available for consultation if and whenever
it becomes necessary. All Board papers are sent
to the Members of the Board well in advance and
all queries raised by them are answered before or
even after the meetings.
(vi) Training for Directors
The Executive Directors participated in several
study tours of Plantations outside Sri Lanka.
2A. Chariman and Chief Executive Ofcer
The Chairman is a non-executive member of the
Board. The Chief Executive Ofcer is responsible for
the management of the plantations and the nancial
responsibility is with the Chief Finanacial Ofcer, both
of whom report to the Managing Director thus enabling
the Board to have a clear segregation of duties between
the Chairman and Managing Director.
3A. Chairman’s Role
The Chairman conducts all board meetings and the
Managing Director presents all detail operating results
to the board along with other Executive Directors and
the Chief Financial Ofcer.
The board comprises of nine directors of whom six are
non-executive. Three of the non-executive directors are
annual report 2011 | 20annual report 2011 | 20
8/14/2019 Watawala Plantations 2011.2012.pdf
http://slidepdf.com/reader/full/watawala-plantations-20112012pdf 54/160

8/14/2019 Watawala Plantations 2011.2012.pdf
http://slidepdf.com/reader/full/watawala-plantations-20112012pdf 55/160
8/14/2019 Watawala Plantations 2011.2012.pdf
http://slidepdf.com/reader/full/watawala-plantations-20112012pdf 56/160
physically present at this meeting.
The adoption of the Audited Financial Statementsforms a part of the Agenda.
The Company also maintains a website for information
of the shareholders and other parties addressed as
www.zestatea.com
1C. Major Transactions and Price Sensitive
Information
There were no Major Transactions during the year as
specied by Sec. 185 of the Companies Act No. 7 of
2007.
D. Accountability and Audit
1D. Financial Reporting
In the preparation of the annual and quarterly nancial
statements, the company complies to the requirements
of the
• Companies Act No. 07 of 2007.
• Sri Lanka Accounting Standards.
• Listing rules of the Colombo Stock Exchange.
The table below depicts the dates the quarterly
accounts were published within the prescribed time of
the listing rules.
1st Quarter 01 August 2011
2nd Quarter 20 October 2011
3rd Quarter 26 January 2012
4th Quarter 29 May 2012
This Annual Report covers the following areas in
detail.
• The Chairman’s Review along with the Managing
Director’s report gives a full overview of the
company.
• Directors Report is presented on pages 100 to 102
of this report.
• Statement of Directors Responsibilities as given by
the Company Secretaries is on page 104.
• Auditors report is appended on page 105 of this
report.
• Management discussion and analysis is presented
on pages 30 to 44 of this report.
• Directors report on going concern is given on page
100 to 102 of this report.
• Risk Assessment on pages 63 to 67.
• Sustainability Report on pages 70 to 97.
• Audit Committee Report 61.
2D. Internal Control
The Board is overall responsible in establishing a
good system of internal control in the company and
delegated much of it to the Audit Committee. Thiscommittee in turn reviews all management accounts,
directs the Internal Audit Team to carry out checks on
areas of verication other than their normal checks.
The Audit Committee reviews all Internal Audit
Reports which are circulated to them quarterly and
discusses the salient features at the Audit Committee
Meeting with the Internal Auditor the CFO and the
Finance Manager. At the end of the second quarter a
limited review is carried out by the external auditors
M/s PriceWaterhouseCoopers and their reports are
discussed in length at the Audit Committee Meetings.
The year end Management Letter submitted by the
External Auditor is also discussed at the nal Audit
Committee Meeting during the Financial year.
3D. Audit Committee
The Audit Committee of the company consists of three
Non-executive Directors :
Mr. B.A. Hulangamuwa, Mr. K. Venkataramanan and Mr.
A.N. Fernando.
Mr. Hulangamuwa is a Fellow Member of the Institute
of Chartered Accountants of Sri Lanka and Mr.
Venkataramanan who is a Vice President of Tata Global
Beverages Ltd. of India is a Fellow Member of the
Insitute of Chartered Accountsnts of India.Mr. A. N.
Fernando who joined the Audit Committee in May
this year is also a Fellow Member of the Institute of
Chartered Accountants of Sri Lanka.
The Audit Committee views at different intervals the
Watawala Plantations PLC
54
Corporate Governance

8/14/2019 Watawala Plantations 2011.2012.pdf
http://slidepdf.com/reader/full/watawala-plantations-20112012pdf 57/160
independence of the External Auditors. The External
Auditors on the other hand discusses with the
Management before taking up any other assignment in
the company and would take over such assignments if
it relates to work involving Assurance.
The Audit Committee functions on clear guidelines
given to them by the Board of Directors.
• Reviews the accounts whether they are prepared
in accordance with the Sri Lanka Accounting
Standards and in accordance with the Companies
Act.
• Asses Controls by reviewing Internal Audit Reports.
• Make recommendations to the Board on the re
appointing of the External Auditors.
• Recommends quarterly and annual accounts to
the Board for adoption.
• Reviews Risk Assessments and its mitigation
process.
The Report of the Audit Committee is on page 61 & 62
of this report.
4D. Code of Business Conduct and Ethics
Although there is no inhouse written code of conduct of
the Directors, they are conscious of the duties required
of them. Where ever there are transactions with
connected companies such transactions are disclosed
under the related party transactions. The Company is
compliant with the Code of Best Practice on Corporate
Governance jointly issued by the Securities and
Exchange Commission of Sri Lanka and the Institute of
Chartered Accountants of Sri Lanka.
The company has published the best businesses
practices and ethics in the form of an employee hand
book and have distributed to all the employees of
the organization. This covers a wide area of activity
including policies and business ethics of the company.
These policies are regularly reviewed and updated by
the Human Resource Division of the organization.
5D. Corporate Governance Disclosures
The Company has been publishing quarterly nancial
statements with the necessary explanatory notes as
required by the Rules of the Colombo Stock Exchange
and the Securities and Exchange Commission of Sri
Lanka to all stakeholders. Any other nancial and
non-nancial information, which is price sensitive or
warrants the shareholders and stakeholders’ attention
and consideration, is promptly disclosed to the
Colombo Stock Exchange.
Shareholders
The Company through company Secretary, Secretarial
& Financial Services maintains an active dialog with the
shareholders, potential investors, investment banks
etc.
The Shareholders are encouraged to attend Annual
General Meetings and clarify doubts with the Board
of Directors. The Annual Report of the Company is
circulate among all the shareholders giving them the
stipulated number of days as recommended in the
company’s articles of association ahead of the AGM
for the Investors to study the companied performance
prior to attending the meeting.
annual report 2011 | 20annual report 2011 | 20
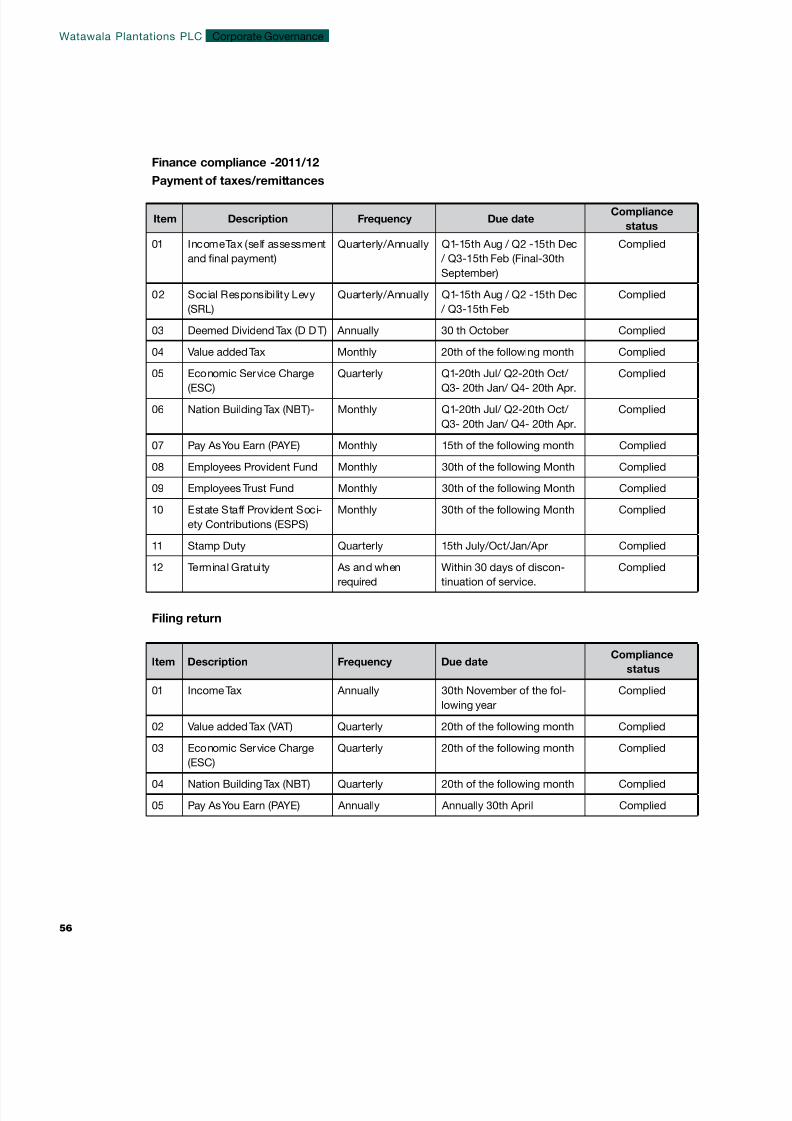
8/14/2019 Watawala Plantations 2011.2012.pdf
http://slidepdf.com/reader/full/watawala-plantations-20112012pdf 58/160
Finance compliance -2011/12
Payment of taxes/remittances
Item Description Frequency Due dateCompliance
status
01 Income Tax (self assessment
and nal payment)
Quarterly/Annually Q1-15th Aug / Q2 -15th Dec
/ Q3-15th Feb (Final-30th
September)
Complied
02 Social Responsibility Levy
(SRL)
Quarterly/Annually Q1-15th Aug / Q2 -15th Dec
/ Q3-15th Feb
Complied
03 Deemed Dividend Tax (D D T) Annually 30 th October Complied
04 Value added Tax Monthly 20th of the following month Complied
05 Economic Service Charge
(ESC)
Quarterly Q1-20th Jul/ Q2-20th Oct/
Q3- 20th Jan/ Q4- 20th Apr.
Complied
06 Nation Building Tax (NBT)- Monthly Q1-20th Jul/ Q2-20th Oct/
Q3- 20th Jan/ Q4- 20th Apr.
Complied
07 Pay As You Earn (PAYE) Monthly 15th of the following month Complied
08 Employees Provident Fund Monthly 30th of the following Month Complied
09 Employees Trust Fund Monthly 30th of the following Month Complied
10 Estate Staff Provident Soci-
ety Contributions (ESPS)
Monthly 30th of the following Month Complied
11 Stamp Duty Quarterly 15th July/Oct/Jan/Apr Complied
12 Terminal Gratuity As and when
required
Within 30 days of discon-
tinuation of service.
Complied
Filing return
Item Description Frequency Due dateCompliance
status
01 Income Tax Annually 30th November of the fol-
lowing year
Complied
02 Value added Tax (VAT) Quarterly 20th of the following month Complied
03 Economic Service Charge
(ESC)
Quarterly 20th of the following month Complied
04 Nation Building Tax (NBT) Quarterly 20th of the following month Complied
05 Pay As You Earn (PAYE) Annually Annually 30th April Complied
Watawala Plantations PLC
56
Corporate Governance
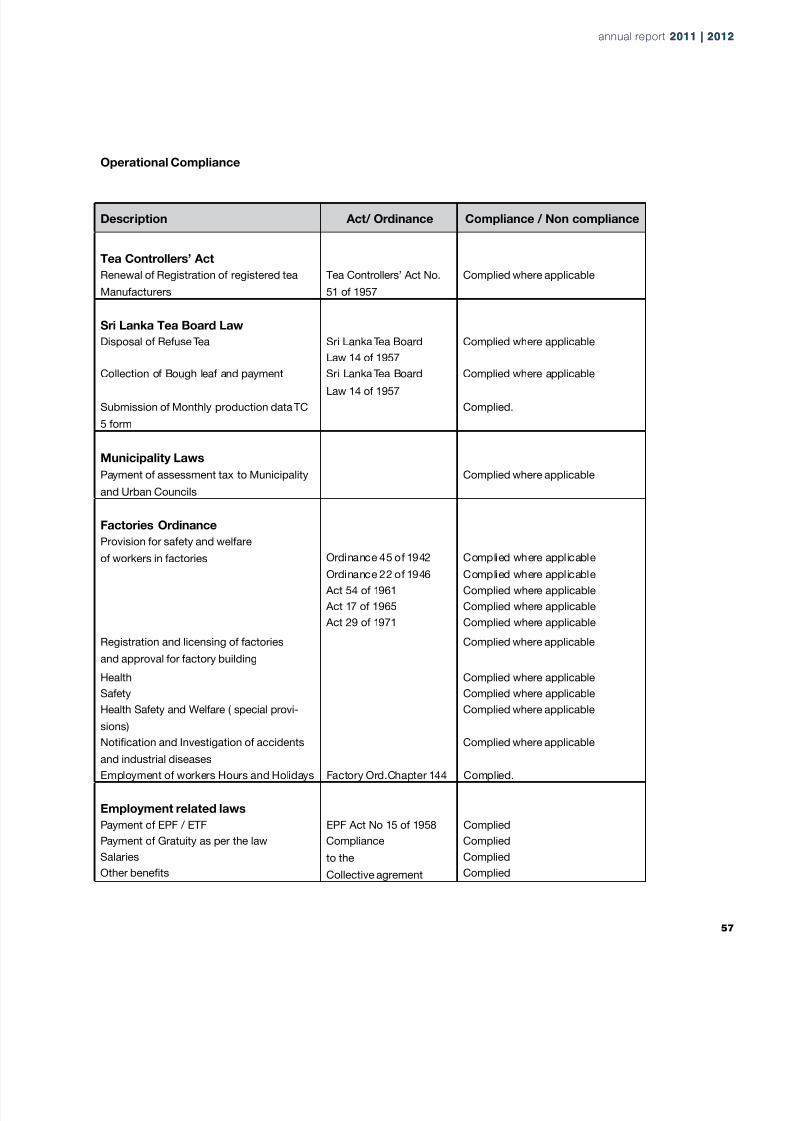
8/14/2019 Watawala Plantations 2011.2012.pdf
http://slidepdf.com/reader/full/watawala-plantations-20112012pdf 59/160
Operational Compliance
Description Act/ Ordinance Compliance / Non compliance
Tea Controllers’ Act
Renewal of Registration of registered tea
Manufacturers
Tea Controllers’ Act No.
51 of 1957
Complied where applicable
Sri Lanka Tea Board Law
Disposal of Refuse Tea Sri Lanka Tea Board Complied where applicable
Law 14 of 1957
Collection of Bough leaf and payment Sri Lanka Tea Board Complied where applicable
Law 14 of 1957
Submission of Monthly production data TC
5 form
Complied.
Municipality Laws
Payment of assessment tax to Municipality
and Urban Councils
Complied where applicable
Factories Ordinance
Provision for safety and welfare
of workers in factories Ordinance 45 of 1942 Complied where applicable
Ordinance 22 of 1946 Complied where applicable
Act 54 of 1961 Complied where applicable
Act 17 of 1965 Complied where applicable
Act 29 of 1971 Complied where applicable
Registration and licensing of factories
and approval for factory building
Complied where applicable
Health Complied where applicable
Safety Complied where applicable
Health Safety and Welfare ( special provi-
sions)
Complied where applicable
Notication and Investigation of accidents
and industrial diseases
Complied where applicable
Employment of workers Hours and Holidays Factory Ord.Chapter 144 Complied.
Employment related laws
Payment of EPF / ETF EPF Act No 15 of 1958 Complied
Payment of Gratuity as per the law Compliance
to the
Collective agrement
Complied
Salaries Complied
Other benets Complied
annual report 2011 | 20annual report 2011 | 20
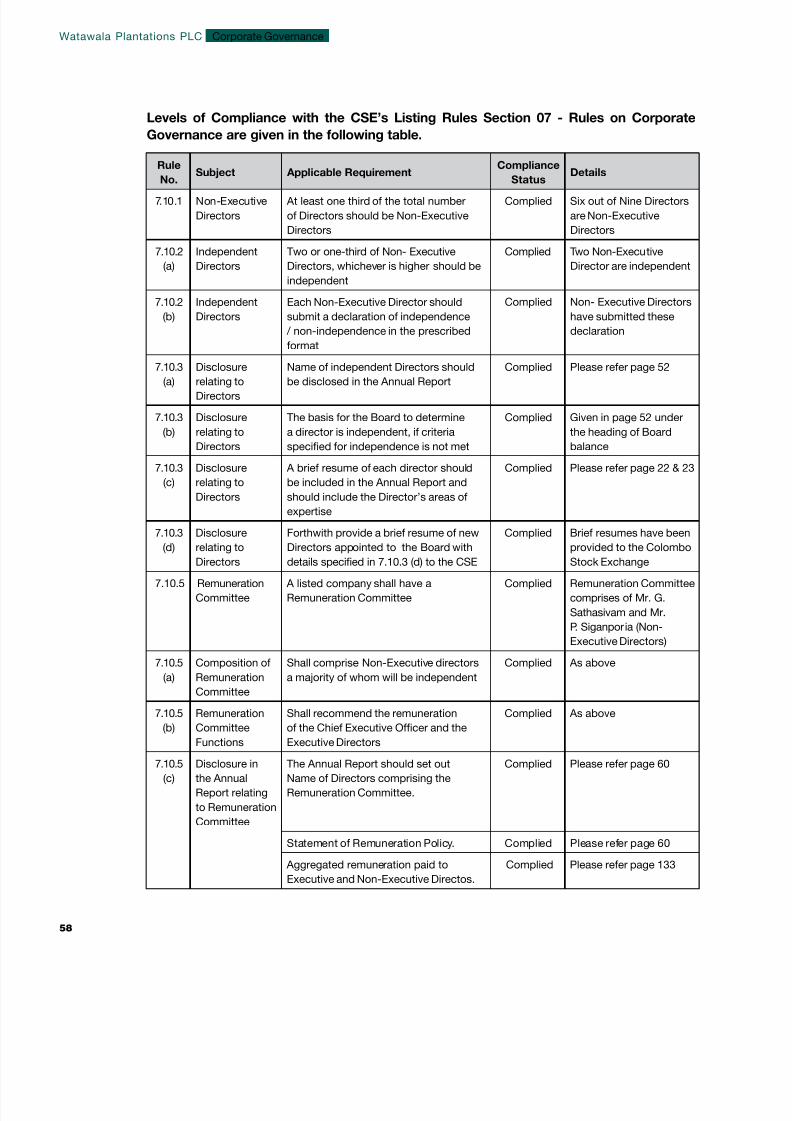
8/14/2019 Watawala Plantations 2011.2012.pdf
http://slidepdf.com/reader/full/watawala-plantations-20112012pdf 60/160
Rule
No.
Subject Applicable RequirementCompliance
Status
Details
7.10.1 Non-Executive
Directors
At least one third of the total number
of Directors should be Non-Executive
Directors
Complied Six out of Nine Directors
are Non-Executive
Directors
7.10.2
(a)
Independent
Directors
Two or one-third of Non- Executive
Directors, whichever is higher should be
independent
Complied Two Non-Executive
Director are independent
7.10.2
(b)
Independent
Directors
Each Non-Executive Director should
submit a declaration of independence
/ non-independence in the prescribed
format
Complied Non- Executive Directors
have submitted these
declaration
7.10.3(a)
Disclosurerelating to
Directors
Name of independent Directors shouldbe disclosed in the Annual Report
Complied Please refer page 52
7.10.3
(b)
Disclosure
relating to
Directors
The basis for the Board to determine
a director is independent, if criteria
specied for independence is not met
Complied Given in page 52 under
the heading of Board
balance
7.10.3
(c)
Disclosure
relating to
Directors
A brief resume of each director should
be included in the Annual Report and
should include the Director’s areas of
expertise
Complied Please refer page 22 & 23
7.10.3
(d)
Disclosure
relating to
Directors
Forthwith provide a brief resume of new
Directors appointed to the Board with
details specied in 7.10.3 (d) to the CSE
Complied Brief resumes have been
provided to the Colombo
Stock Exchange
7.10.5 Remuneration
Committee
A listed company shall have a
Remuneration Committee
Complied Remuneration Committee
comprises of Mr. G.
Sathasivam and Mr.
P. Siganporia (Non-
Executive Directors)
7.10.5
(a)
Composition of
Remuneration
Committee
Shall comprise Non-Executive directors
a majority of whom will be independent
Complied As above
7.10.5
(b)
Remuneration
Committee
Functions
Shall recommend the remuneration
of the Chief Executive Ofcer and the
Executive Directors
Complied As above
7.10.5
(c)
Disclosure in
the Annual
Report relating
to Remuneration
Committee
The Annual Report should set out
Name of Directors comprising the
Remuneration Committee.
Complied Please refer page 60
Statement of Remuneration Policy. Complied Please refer page 60
Aggregated remuneration paid to
Executive and Non-Executive Directos.
Complied Please refer page 133
Levels of Compliance with the CSE’s Listing Rules Section 07 - Rules on Corporate
Governance are given in the following table.
Corporate GovernanceWatawala Plantations PLC
58
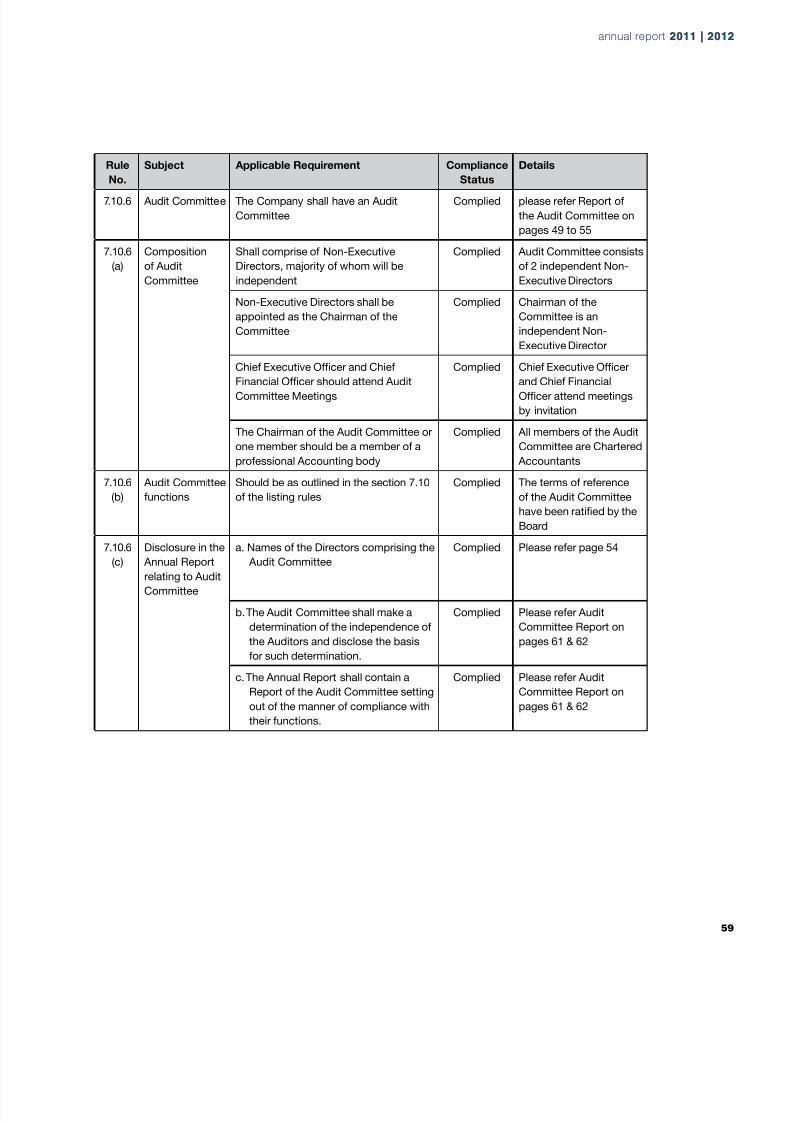
8/14/2019 Watawala Plantations 2011.2012.pdf
http://slidepdf.com/reader/full/watawala-plantations-20112012pdf 61/160
Rule
No.
Subject Applicable Requirement Compliance
Status
Details
7.10.6 Audit Committee The Company shall have an Audit
Committee
Complied please refer Report of
the Audit Committee on
pages 49 to 55
7.10.6
(a)
Composition
of Audit
Committee
Shall comprise of Non-Executive
Directors, majority of whom will be
independent
Complied Audit Committee consists
of 2 independent Non-
Executive Directors
Non-Executive Directors shall be
appointed as the Chairman of the
Committee
Complied Chairman of the
Committee is an
independent Non-
Executive Director
Chief Executive Ofcer and ChiefFinancial Ofcer should attend Audit
Committee Meetings
Complied Chief Executive Ofcerand Chief Financial
Ofcer attend meetings
by invitation
The Chairman of the Audit Committee or
one member should be a member of a
professional Accounting body
Complied All members of the Audit
Committee are Chartered
Accountants
7.10.6
(b)
Audit Committee
functions
Should be as outlined in the section 7.10
of the listing rules
Complied The terms of reference
of the Audit Committee
have been ratied by the
Board
7.10.6
(c)
Disclosure in the
Annual Report
relating to Audit
Committee
a. Names of the Directors comprising the
Audit Committee
Complied Please refer page 54
b. The Audit Committee shall make a
determination of the independence of
the Auditors and disclose the basis
for such determination.
Complied Please refer Audit
Committee Report on
pages 61 & 62
c. The Annual Report shall contain a
Report of the Audit Committee setting
out of the manner of compliance with
their functions.
Complied Please refer Audit
Committee Report on
pages 61 & 62
annual report 2011 | 20annual report 2011 | 20

8/14/2019 Watawala Plantations 2011.2012.pdf
http://slidepdf.com/reader/full/watawala-plantations-20112012pdf 62/160

8/14/2019 Watawala Plantations 2011.2012.pdf
http://slidepdf.com/reader/full/watawala-plantations-20112012pdf 63/160
Report of the Audit Committee
The Audit Committee was established in 2004. The
Committee consists entirely of three Non Executive
Directors who are senior Chartered Accountants and
the Committee is chaired by Mr. K. Venkataramanan.
Secretaries and Financial Services (Pvt) Ltd, the
Company Secretaries functions as the Secretaries
to the Audit Committee. The Managing Director and
Chief Executive Ofcer attend meetings by invitation.
The Charter for the Audit Committee is in line with
the international best practices frame work. The Audit
Committee reviews the charter quarterly and updates
to reect the views that the members of the audit
committee express in the independent discharge of
their duties. As specied in rule 7. 10. 06 of the listing
rules of the Colombo Stock Exchange, the board is of
the opinion that the members of the Audit Committee
are independent. Mr. A.N. Fernando, a non Executive,
Independatent Director was appointed to the committee
w.e.f 17 May 2012.
Meetings
The Audit Committee met four times during the year.
Attendances by the Committee members at each of
these meetings are as follows. The Head of Internal Audit also attended as and when required by the
Committee.
Mr. K. Venkataramanan - Chairman
Attended 4 of 4 meetings
Mr. B. A. Hulangamuwa - Director
Attended 4 of 4 meetings
The Audit Committee and it’s
ResponsibilitiesThe main objective of the Audit Committee is to ensure
that the Company complies with applicable nancial
standards and laws and execute the responsibilities
given in the Audit Committee Charter. It sets out
high standards of corporate disclosure, corporate
responsibility, integrity and accountability to the
shareholders.
The Audit Committee obtained representations from
the Chief Financial Ofcer on the adequacy and
effectiveness of internal control systems. That review
the statutory accounts and publish nancial statements,
assess compliance with regulatory requirements,
considered the contents of Internal Audit Reports and
recommend the appointment and remuneration of the
external auditors.
The Report of the Audit Committee to the Board of
Directors of Watawala Plantations PLC
Watawala Plantations PLC management is responsible
for it’s internal control and nancial reporting including
the preparation of consolidated nancial statements.
Independent Auditors are responsible for auditing
the annual consolidated nancial statements in
accordance with generally accepted auditing standards
and ensuring that the nancial statements are truly and
fairly present the results of operations and nancial
position of the Company. The independent auditors
are also responsible for issuing a report on those
nancial statements. The Audit Committee monitors
and oversee these processes. The Audit Committee
annually recommends to the Board for its approval an
independent accounting rm to be appointed as the
Company’s independent auditors.
To full its obligations the Audit Committee carried out
the following activities.
- Reviewed and discussed with the Company’s
management and the independent auditors,
the consolidated nancial statements for the
accounting year ended 31 March 2012.
- Reviewed management’s representations that the
consolidated nancial statements are prepared in
accordance with generally accepted accounting
principals truly and fairly present the results of
operations and nancial position of the Company.
- Recommended that the Board select
PriceWaterhouse Coopers, Chartered Accountants
as independent auditors to audit and report on the
annual consolidated nancial statements of the
company and forward copies of the Annual Report
to the Colombo Stock Exchange prior to the Annual
General Meeting.
annual report 2011 | 20annual report 2011 | 20

8/14/2019 Watawala Plantations 2011.2012.pdf
http://slidepdf.com/reader/full/watawala-plantations-20112012pdf 64/160
- Reviewed the procedures for identifying business
risks and management of the impact on the group.
- Reviewed the policies, procedures and internal
controls for detecting and preventing fraud.
- Reviewed the operational effectiveness and internal
controls of the policies, systems and procedures.
- Reviewed, and discussed with the Management, the
annual and the quarterly nancial statements prior
to their release, including the extent of compliance
with the Sri Lanka Accounting Standards and the
Com panies Act, No.7 of 2007.
- Reviewed the procedures established by
Management for compliance with the requirements
of regulatory bodies. Chief Financial Ofcer
submitted to the Audit Committee on a quarterly
basis, a report on the extent to which the Company
was in compliance with mandatory statutory
requirements.
Conclusion
The Committee is of the view that adequate controls
and procedures are in place to provide reasonable
assurance that the Company’s assets are safeguarded
and the nancial position of the Company is well
monitored. The Audit Committee concurs that
the adoption of the going concern premise in the
preparation of the Financial Statement is appropriate.
The Audit Committee recommends to the Board of
Directors that the nancial statements as submitted be
approved.
On behalf of the Audit Committee;
K.Venkataramanan B. A. Hulangamuwa
17/05/2012
Corporate GovernanceWatawala Plantations PLC
62

8/14/2019 Watawala Plantations 2011.2012.pdf
http://slidepdf.com/reader/full/watawala-plantations-20112012pdf 65/160
The Company operates in an evolving environment
which exposes it to different types of risks especially
being in the Agricultural Sector which is very sensitive
to weather patterns. An effective Risk Management
system is an Important Area of Business Management
which would attempt to prevent many events which
would otherwise have adverse effects on the business.
At Watawala Plantations Plc with the guidance of the
Audit Committee the Management has identied the
several areas of activity in assessing and mitigation of
risks. The main areas of business of Watawala Group
are appended below.
Risk Management
Watawala Plantations PLC
• Cultivation and Manufacture of Tea
• Cultivation and Manufacture of Rubber
• Cultivation and Manufacture of Crude Palm Oil
• Export of bulk and value added tea
• Extraction of Olein from Crude Palm Oil
• Dairy Farming
Risk Category Risk Rating Risk Assessment Risk Mitigating Strategies
Changes due to Global
Recession or change in
International Markets
Moderate Would lead to loss in
Prots.
Spread the risk by attempting to
market the teas in different global
markets.
Every attempt is being made to
spread the company’s dependence
on a range of products rather than
a few.
Adverse Action by foreign
governments such as
sanctions on Iran
Moderate Would lead to loss of
prots
Continues attempt in nding new
markets
Major natural or Man
made disasters
Low Such as destruction of a
factory which would lead to
Revenue and Capital loss
Adequate Insurance Cover on
Capital items, loss of prots etc.
Economic Risk
annual report 2011 | 20annual report 2011 | 20
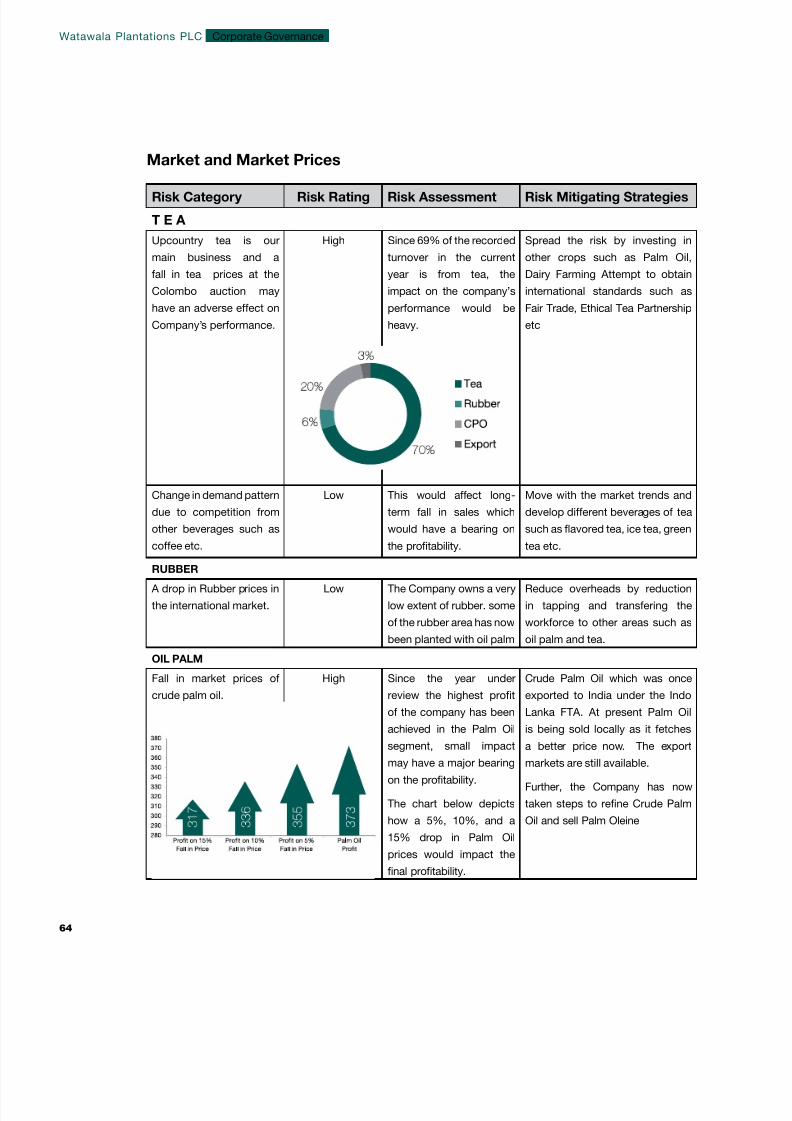
8/14/2019 Watawala Plantations 2011.2012.pdf
http://slidepdf.com/reader/full/watawala-plantations-20112012pdf 66/160
Risk Category Risk Rating Risk Assessment Risk Mitigating Strategies
T E A
Upcountry tea is our
main business and a
fall in tea prices at the
Colombo auction may
have an adverse effect on
Company’s performance.
High Since 69% of the recorded
turnover in the current
year is from tea, the
impact on the company’s
performance would be
heavy.
Spread the risk by investing in
other crops such as Palm Oil,
Dairy Farming Attempt to obtain
international standards such as
Fair Trade, Ethical Tea Partnership
etc
Change in demand pattern
due to competition from
other beverages such as
coffee etc.
Low This would affect long-
term fall in sales which
would have a bearing on
the protability.
Move with the market trends and
develop different beverages of tea
such as avored tea, ice tea, green
tea etc.
RUBBER
A drop in Rubber prices in
the international market.
Low The Company owns a very
low extent of rubber. some
of the rubber area has now
been planted with oil palm
Reduce overheads by reduction
in tapping and transfering the
workforce to other areas such as
oil palm and tea.
OIL PALM
Fall in market prices of
crude palm oil.
High Since the year under
review the highest prot
of the company has been
achieved in the Palm Oil
segment, small impact
may have a major bearing
on the protability.
The chart below depicts
how a 5%, 10%, and a
15% drop in Palm Oil
prices would impact the
nal protability.
Crude Palm Oil which was once
exported to India under the Indo
Lanka FTA. At present Palm Oil
is being sold locally as it fetches
a better price now. The export
markets are still available.
Further, the Company has now
taken steps to rene Crude Palm
Oil and sell Palm Oleine
Market and Market Prices
Corporate GovernanceWatawala Plantations PLC
64
8/14/2019 Watawala Plantations 2011.2012.pdf
http://slidepdf.com/reader/full/watawala-plantations-20112012pdf 67/160

8/14/2019 Watawala Plantations 2011.2012.pdf
http://slidepdf.com/reader/full/watawala-plantations-20112012pdf 68/160
Risk Category Risk Rating Risk Assessment Risk Mitigating Strategies
T E A / RUBBER / OIL PALM
Migration of works to
others areas
Moderate Migration of skilled, semiskilled
and unskilled workers to the
non plantation sector would
effect productivity of the
organization.
Recognize efciency with
reward, mechanization of certain
activities such as pruning, holing,
plucking etc.
Labour disruptions and
outside interferences
Moderate Work stoppages and trade
union action could result in a
loss of production, overgrowing
of tea bushes, untapped rubber
trees, unplucked palm oil
bunches which could reduce
production and even slowdown
on out put.
Entering in to a collective
agreement with the trade unions
,also the company maintains a
good rapport with trade unions.
Migration of Managers
and executives to other
industries.
Low Disruption of the smooth ow
of activities which has an
impact on the performance of
the company
Need to have a good succession
plan. Regular training sessions
and motivation programmes
would have an impact on the staff
turnover.
Inability to attract and retain
skilled staff at Middle andSenior Management Level.
Low/ Moderate Possibility of the High
Performing Executives tomove to companies within the
same industry, migrate.
Have a development path for all
employees.Performance based remuneration
schems.
Finance and Liquidity
The plantation sector
rests on several external
uncontrollable factors such
as erratic weather patterns
etc. Liquidity problems are
bound to arise under these
circumstances.
Moderate The company may be
compelled to go in to
additional borrowings or draw
up of reserves.
Efcient cash management and
building up of reserves would be a
crucial area. Assistance was made
available from the Sri Lanka Tea
Board and the Plantations Trust
Fund with regard to borrowings at
nominal interest rates at a time of
need.
High Interest rates levied
by lending institutions
Moderate High interest levied by banks
would erode the protability of
the company. The graph below
depicts the Interest Spread
offered to the company.
Attempt to negotiate the
best interest rate with (i) Own
credibility (ii) Using the reputation
of the Foreign Partners (iii) With
the assistance of Govt Agencies.
Human Resources
Corporate GovernanceWatawala Plantations PLC
66
8/14/2019 Watawala Plantations 2011.2012.pdf
http://slidepdf.com/reader/full/watawala-plantations-20112012pdf 69/160
Risk Category Risk Rating Risk Assessment Risk Mitigating Strategies
T E A / RUBBER / OIL PALM
Non availability of the latest
Information Technology
low The company presently
operates on a fully
computerized accounting
and MIS system. Since this
software is over 13 years
old it would have an impact
on performance. The staff
in estates and head ofce
are quite conversant with
the present system thus
the security has become a
concern.
The Management is now
implementing a new software
package developed on Dot Net
platform providing better security
and faster response.
Since the Company
operates in a fully
computerized environment
and any break down
would cause a loss of data
which would disrupt the
ow of information
low Loss of information would
lead to delays in decision
making and result in
nancial losses.
The Company makes two daily
backups which are stored outside
the ofce premises.
Weekly and monthly backups are
taken and stored in the bank wallet
Other Risks
Compliance with laws and
other statutory obligations
and risks arising from
litigation -
low Law suits against the
company may lead to loss
of reputation and penalties
being imposed
Statutory obligations are regularly
reviewed by the Head of Finance
and reported to the Audit
Committee. The company also has
its legal consultants in FJ & G De
Saram
Credit Risks - low Company is exposed to
a large amount of credit
given out in sale of tea,
rubber, retail marketingand exports.
Tea / Rubber – Sold via brokers
where one week is given for
settlement on the selling brokers
assurance.
Information Technology
annual report 2011 | 20annual report 2011 | 20
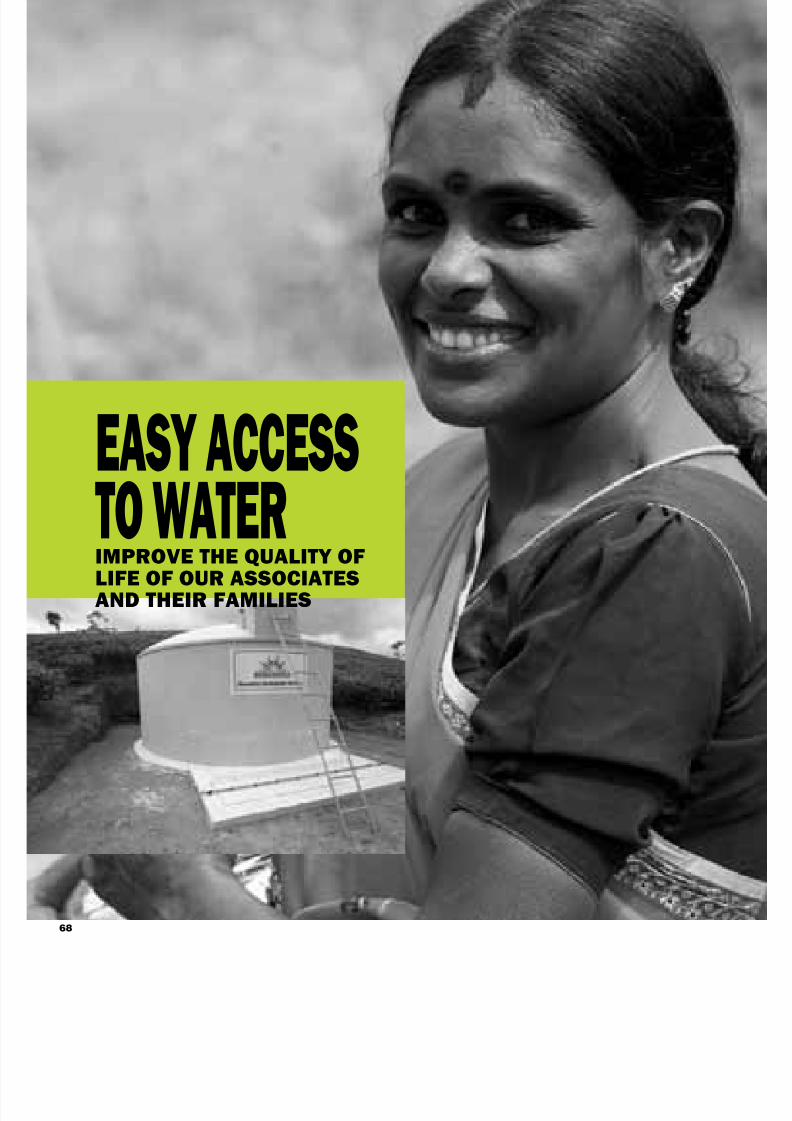
8/14/2019 Watawala Plantations 2011.2012.pdf
http://slidepdf.com/reader/full/watawala-plantations-20112012pdf 70/160
EASY ACCESSTO WATERIMPROVE THE QUALITY OFLIFE OF OUR ASSOCIATESAND THEIR FAMILIES
68
8/14/2019 Watawala Plantations 2011.2012.pdf
http://slidepdf.com/reader/full/watawala-plantations-20112012pdf 71/160
SUSTAINABILITY REPORT
“The mutual dependence and reciprocal interest which man has upon
man, and all the parts of a civilized community upon each other,
create that great chain of connection which holds it together.”
-Thomas Paine
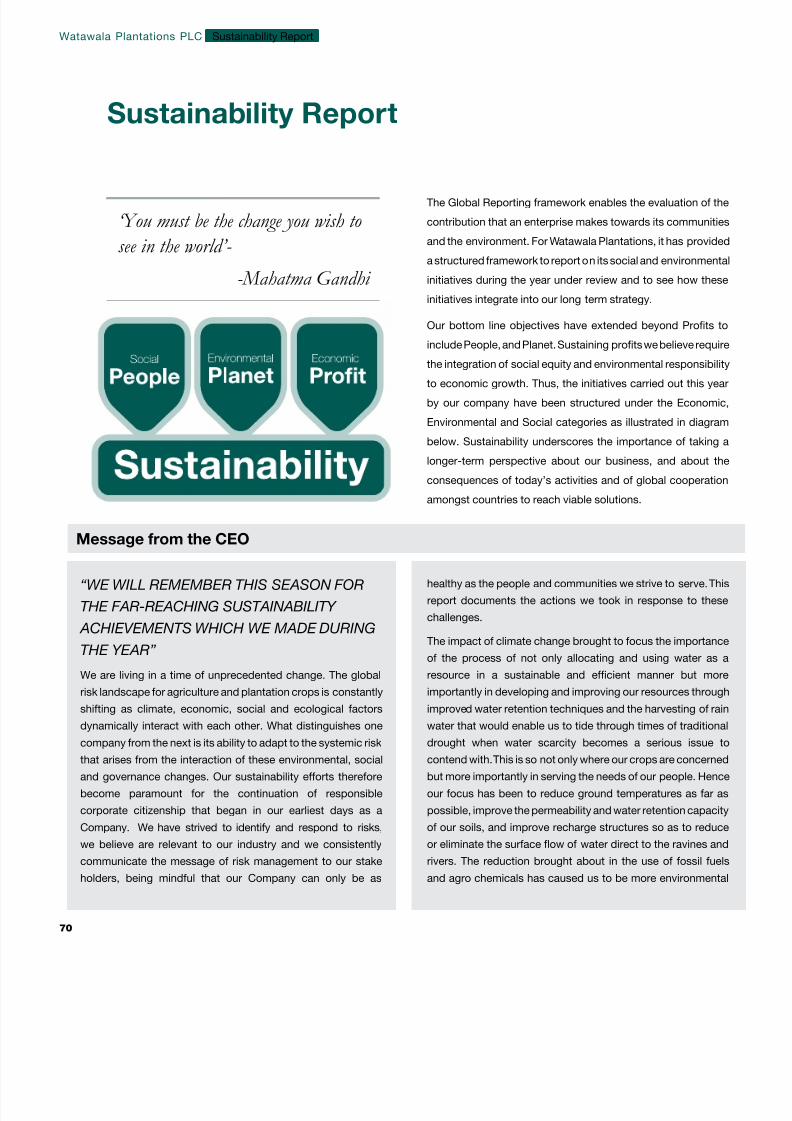
8/14/2019 Watawala Plantations 2011.2012.pdf
http://slidepdf.com/reader/full/watawala-plantations-20112012pdf 72/160
Message from the CEO
“WE WILL REMEMBER THIS SEASON FOR
THE FAR-REACHING SUSTAINABILITY
ACHIEVEMENTS WHICH WE MADE DURING
THE YEAR”
We are living in a time of unprecedented change. The global
risk landscape for agriculture and plantation crops is constantly
shifting as climate, economic, social and ecological factors
dynamically interact with each other. What distinguishes one
company from the next is its ability to adapt to the systemic risk
that arises from the interaction of these environmental, social
and governance changes. Our sustainability efforts therefore
become paramount for the continuation of responsible
corporate citizenship that began in our earliest days as a
Company. We have strived to identify and respond to risks,
we believe are relevant to our industry and we consistently
communicate the message of risk management to our stake
holders, being mindful that our Company can only be as
healthy as the people and communities we strive to serve. Th
report documents the actions we took in response to thes
challenges.
The impact of climate change brought to focus the importanc
of the process of not only allocating and using water as
resource in a sustainable and efcient manner but mo
importantly in developing and improving our resources throug
improved water retention techniques and the harvesting of ra
water that would enable us to tide through times of tradition
drought when water scarcity becomes a serious issue
contend with. This is so not only where our crops are concerne
but more importantly in serving the needs of our people. Henc
our focus has been to reduce ground temperatures as far a
possible, improve the permeability and water retention capaci
of our soils, and improve recharge structures so as to reduc
or eliminate the surface ow of water direct to the ravines an
rivers. The reduction brought about in the use of fossil fue
and agro chemicals has caused us to be more environment
The Global Reporting framework enables the evaluation of th
contribution that an enterprise makes towards its communitie
and the environment. For Watawala Plantations, it has provide
a structured framework to report on its social and environment
initiatives during the year under review and to see how thes
initiatives integrate into our long term strategy.
Our bottom line objectives have extended beyond Prots t
include People, and Planet. Sustaining prots we believe requi
the integration of social equity and environmental responsibilito economic growth. Thus, the initiatives carried out this ye
by our company have been structured under the Economi
Environmental and Social categories as illustrated in diagra
below. Sustainability underscores the importance of taking
longer-term perspective about our business, and about th
consequences of today’s activities and of global cooperatio
amongst countries to reach viable solutions.
‘You must be the change you wish to
see in the world’-
-Mahatma Gandhi
Sustainability Report
Watawala Plantations PLC
70
Sustainability Report

8/14/2019 Watawala Plantations 2011.2012.pdf
http://slidepdf.com/reader/full/watawala-plantations-20112012pdf 73/160
friendly. So has the establishment of Short Rotation
Coppice Plantations in our efforts to be self-sufcient in
our solid fuel requirement without the elimination of trees.
Our journey from good to great brought to focus our
People, Planet and Processes. Getting the right people
to the correct position and having the best for our
greatest opportunities has been our quest. Our workers
earlier referred to as coolies, then laborers came to be
recognized as our “Associates”. Through our performance
management system we were able to strengthen the
culture of the “Management by objectives” throughout
the organization. Appraisal of all our Executives and
Staff have and continue to be the order of the day
whereby measurable objectives, signicant performance
dimensions, management and supervisory performancedimensions, performance and training and development
for personal growth are discussed, evaluated and
implemented. Product and process development came
to be more and more customer oriented and from being
just a supplier and marketer of crude oil we did move to
producing and marketing rened oil.
Our pursuit of excellence brought us to adopt business
practices that go even beyond the best practices with
constant innovation.
We have continued with Fairtrade certication on seven
of our plantations by which people come to identify our
teas as meeting international environmental, labour and
development standards. We continueed with ISO 22000
Food Safety Management Systems. This assures our
valuable customers of the proper management of food
safety risks across the food supply chain and will continue
to do so till all gardens fall in line. Continuing to have our
gardens as members of the Ethical Tea Partnership gives
condence to the tea consumers of the world that the tea
in their cup has been produced in an environmentally and
socially sustainable way. ETP collaborates with a rangeof organizations to achieve these objectives. Productivity
Enhancement Teams, Small group activities and Quality
Circles come very much into play in all these certication
processes and the many awards we have achieved and
detailed in this report is a manifestation of all these efforts.
Our Human Capital has been our driving force and we
are engaged in creating a culture that respects, accepts
and recognizes employee contribution to the success
of the organization. The introduction of the two way
communication system has brought about yet another
paradigm shift that came to be strengthened by the
introduction of the Community Development Forum in
empowering our associates.
Our belief that the success of an organization depends
on the value created through the implementation of HR
policies, systems and processes brought to surface
many HR Strategies that were introduced throughout
the organization. These covered ‘Man power planning’,
‘Recruitment and Selection’, ‘Performance Management’,
Employee Reward Management’, Training and
Development’ and ‘Employee Relations and Industrial
Relations’. In doing so, we have not lost sight of ultimately
achieving our corporate objectives of being a LOW COST
HIGH QUALITY producer, thus satisfying the needs
of stakeholders, which necessarily includes all of its
employees as well.
In addressing our future challenges resulting from worker
shortages we have as detailed in this report taken steps to
improve productivity and reduce absenteeism through the
process of ‘Lean Management’, increasing mechanization
and automation of activities as far as practical, motivation
of our associates, increased social welfare activities and
the training and empowering of the associates.
We know that sustainability relates to our people and the
planet at every level of our company and that the long
term economic prosperity of our company is important.
Therefore, sustainability is valued and implemented across
the board.
I would personally like to thank and extend my gratitude
to the sustainability management teams for driving and
monitoring our sustainability strategy and the sustainability
issue owners for implementing our plans.
I also acknowledge the WPL associates at all levels
for their enthusiastic support of our initiatives. We will
remember this season for the far-reaching sustainability
achievements which we made during the year. Driven by
our talented and passionate associates, we will continue
turning challenges into opportunities in the year ahead.
Dr. Dan SeevaratnamDirector / Chief Executive Ofcer
17/05/2012
annual report 2011 | 20annual report 2011 | 20

8/14/2019 Watawala Plantations 2011.2012.pdf
http://slidepdf.com/reader/full/watawala-plantations-20112012pdf 74/160

8/14/2019 Watawala Plantations 2011.2012.pdf
http://slidepdf.com/reader/full/watawala-plantations-20112012pdf 75/160
report, the Company plans to embark upon an annual
sustainability monitoring and reporting cycle. While
our Annual Report for the year ending 31st March
2011 included a sustainability supplement, this report
provided a brief overview of our practices with an
emphasis on community investment, and was not a
structured report based on the GRI Guidelines.
Being a key player in the agriculture industry, Watawala
Plantations has signicant impacts on the environment
in which it operates while in turn being intrinsically
dependent on favourable environmental conditions, not
least of which are climate conditions, for the survival
and growth of its business. Further, with its closeinterconnection with rural communities and extensive
workforce living and working on its plantations,
employee and estate community welfare is also a key
material aspect to be considered by the company.
It is for this reason that report content in this rst
structured Sustainability Report of Watawala Plantations
covers employee wellbeing including health and safety,
development, gender equity and empowerment, child
labour, and community investment and welfare, as
well as energy management, waste management, and
water conservation, together with practices in relation
to biodiversity and agricultural land productivity.
The boundary of this rst GRI based Sustainability
Report of Watawala Plantations is limited to all
operations of the Company across Sri Lanka, including
19 estates and the Company Headquarters in Colombo.
Operations arising from joint ventures, subsidiaries,
leased facilities or operations that are outsourced are
not included within the boundary of this report.
A signicant change from our previous report
applied in the current report is the structuring of our
reporting efforts in line with the GRI Guidelines. The
present scope and boundary of this report as well as
measurement methods applied in data monitoring, are
herein established in our sustainability reporting for the
rst time. There are no re-statements of information
provided in any previous reports.
Any questions on this Sustainability Report or
its content can be directed to:
Mr.Ajantha Nugawala
General Manager – HR & Administration
No 60, Dharmapala Mawatha, Colombo 03
[email protected] / Tel - 07773457967
Governance and StakeholderEngagement
Our company has given high priority to a strong
framework of corporate governance. For further
information on how it’s governed, please refer to the
page no 48.
Watawala Plantations recognizes the following groups
as being key stakeholders of the Company, and
engaged with these groups accordingly:
Shareholders, employees, customers, brokers,
suppliers, banks, Inland Revenue Department, Labour
Department, Employers Federation of Ceylon, trade
unions, and industry experts
These stakeholder groups in particular are engaged bythe company in order to:
• Ensure the sustainability of the business
• Create value to the shareholders and employees
of the Company
• Maintain a harmonious relationship
• Adhere & comply with legitimate standards
• Demonstrate professionalism and corporate
governance
Sustainability Performance
Economic
The Tea plantations business in the country faced
many challenges during the year under review, and the
envisaged loss prompted the forecast of a loss at the
beginning of the nancial year. However, your company
was able overcome the forecast loss to achieve a pretax
annual report 2011 | 20annual report 2011 | 20

8/14/2019 Watawala Plantations 2011.2012.pdf
http://slidepdf.com/reader/full/watawala-plantations-20112012pdf 76/160
prot of Rs.520Mn. compared with a prot of Rs.532Mn.
during the previous year. Improved productivity, driven
by the effective and efcient utilization of resources
was a key factor that enabled us to make this prot
despite unfavorable market conditions that prevailed
during the year.
As per the plantation collective agreement, the wage
revisions which take place every 2 years have been
amongst the most signicant challenges to the
plantations industry. A wage increase that took place
during the year under review impacted your Company’s
bottom line by Rs.320Mn. Once again improved
productivity and our strategy of crop diversication
adopted several years ago yielded dividends in enabling
the company to offset this loss to end the year with a
prot of Rs.133Mn.
The total value generated by the Company for the
year 2011/12 is Rs.3.7Bn, compared to Rs.3.1Bn, in
the previous year. The summary of value addition for
the period is given below. The total value addition has
increased by 21% over the previous year of which the
largest share of 73% has been distributed among our
employees. We were able to re-invest 14% of the value
addition amounting to Rs.544Mn. The re-investment
will facilitate the future expansion and growth of the
company, and contribute to its sustainability.
Group Company
2011/2012 2010/2011 2011/2012 2010/2011
To Employees 75% 65% 73% 68%
To Providers of funds 2% 3% 2% 3%
To Government 5% 6% 5% 5%
To providers of capital 6% 2% 5% 2%
To Expansion and growth 12% 24% 16% 22%
100% 100% 100% 100%
Summary of value addition for the period is given below.
(Pleas refer page 142 for detailed analysis)
Watawala Plantations PLC
74
Sustainability Report

8/14/2019 Watawala Plantations 2011.2012.pdf
http://slidepdf.com/reader/full/watawala-plantations-20112012pdf 77/160
Gratuity is one of the company’s key liabilities, an
obligation towards employees for their service rendered
for the company. At the end of this nancial year, liability
that arose from the gratuity was around Rs.873Mn. The
forecast amount within a couple of years would be
Rs.1Bn. Henceforth, in order to minimize the potential
impact of gratuity payment on the nancial performance
of the Company, especially with regard to the cash ow
movements, the Company has made an initiative to
maintain a separate investment which will secure the
Contributions (In Rs.) 2011/12 2010/11
EPF (12%) 146,846,375 125,347,711
ETF (3%) 38,661,551 33,234,750
ESPS 8,851,797 8,474,785
Gratuity 93,653,000 60,826,000
gratuity payment for employees. The initial investment
made was Rs.46Mn. Company intends funding the
gratuity provision at a future date to ensure the payment
of employee claims and thus ultimately add to the value
generated by the company. The generated income will
be re-invested for future gratuity payments. An extra
ordinary resolution has been passed to invest more
funds and the proceeds earned during the year from
the sale of Watawala Marketing Ltd. would be invested.
Production
Company Volumes (kg) National Volumes (kg) Increase/
decrease
Company
Volumes
Increase/
decrease
National
Volumes2012/11 2010/11 2012/11 2010/11
High Grown 3,811,330 3,850,453 72,146,812 78,376,740 -1.0% -8.0%
Medium Grown 1,790,032 1,721,894 50,241,640 54,753,937 4.0% -8.2%
Low Grown 246,211 254,960 190,074,959 195,655,528 -3.4% -2.9%
5,847,573 5,827,307 312,463,411 328,786,205 0.3% -5.0%
Our Tea production recorded a better performance
in comparison to the national tea production. During
the concerned nancial year, national crop volume
declined from 328,786, 205 kg to 312,463,411 kg
by accounting for a 4.96% decrease in National Tea
Volume. Whereas our own tea crop production of
5,847,573 kg in the reporting period was 0.3% higher
than the previous year’s crop production of 5,827,307
Kg. The agricultural processes we have adopted made
a considerable contribution to this growth. National
volumes of high grown tea declined by 7.95% and we
were able to minimize the decrease in crop to 1%.
Our Medium grown tea volumes increased by 3.96%
compared with National Medium grown tea volumes
which decreased by 8.25 %.
EPF/ ETF Contributions
annual report 2011 | 20annual report 2011 | 20
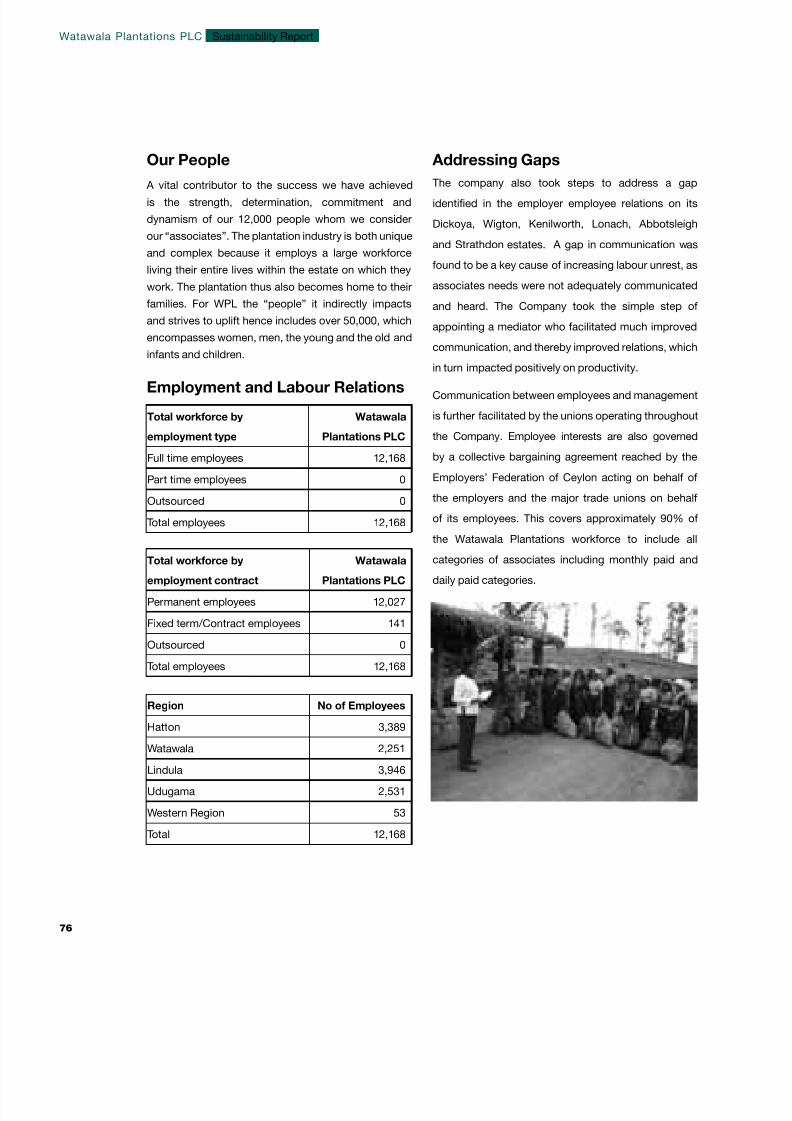
8/14/2019 Watawala Plantations 2011.2012.pdf
http://slidepdf.com/reader/full/watawala-plantations-20112012pdf 78/160
Our People
A vital contributor to the success we have achieved
is the strength, determination, commitment and
dynamism of our 12,000 people whom we consider
our “associates”. The plantation industry is both unique
and complex because it employs a large workforce
living their entire lives within the estate on which they
work. The plantation thus also becomes home to their
families. For WPL the “people” it indirectly impacts
and strives to uplift hence includes over 50,000, which
encompasses women, men, the young and the old and
infants and children.
Employment and Labour Relations
Total workforce by
employment type
Watawala
Plantations PLC
Full time employees 12,168
Part time employees 0
Outsourced 0
Total employees 12,168
Total workforce by
employment contract
Watawala
Plantations PLC
Permanent employees 12,027
Fixed term/Contract employees 141
Outsourced 0
Total employees 12,168
Region No of Employees
Hatton 3,389
Watawala 2,251
Lindula 3,946
Udugama 2,531
Western Region 53
Total 12,168
The company also took steps to address a gap
identied in the employer employee relations on its
Dickoya, Wigton, Kenilworth, Lonach, Abbotsleigh
and Strathdon estates. A gap in communication was
found to be a key cause of increasing labour unrest, as
associates needs were not adequately communicated
and heard. The Company took the simple step of
appointing a mediator who facilitated much improved
communication, and thereby improved relations, which
in turn impacted positively on productivity.
Communication between employees and management
is further facilitated by the unions operating throughout
the Company. Employee interests are also governed
by a collective bargaining agreement reached by the
Employers’ Federation of Ceylon acting on behalf of
the employers and the major trade unions on behalf
of its employees. This covers approximately 90% of
the Watawala Plantations workforce to include all
categories of associates including monthly paid and
daily paid categories.
Addressing Gaps
Watawala Plantations PLC
76
Sustainability Report
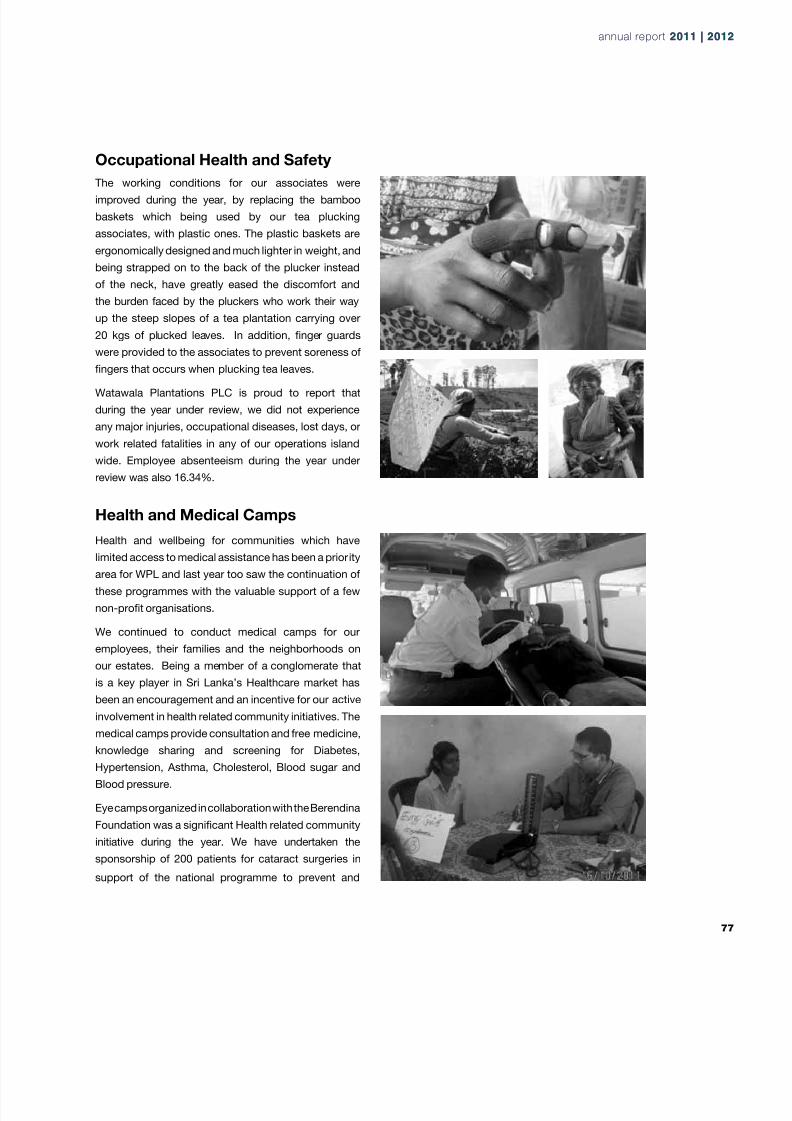
8/14/2019 Watawala Plantations 2011.2012.pdf
http://slidepdf.com/reader/full/watawala-plantations-20112012pdf 79/160
Occupational Health and Safety
The working conditions for our associates wereimproved during the year, by replacing the bamboo
baskets which being used by our tea plucking
associates, with plastic ones. The plastic baskets are
ergonomically designed and much lighter in weight, and
being strapped on to the back of the plucker instead
of the neck, have greatly eased the discomfort and
the burden faced by the pluckers who work their way
up the steep slopes of a tea plantation carrying over
20 kgs of plucked leaves. In addition, nger guards
were provided to the associates to prevent soreness of
ngers that occurs when plucking tea leaves.
Watawala Plantations PLC is proud to report that
during the year under review, we did not experience
any major injuries, occupational diseases, lost days, or
work related fatalities in any of our operations island
wide. Employee absenteeism during the year under
review was also 16.34%.
Health and Medical Camps
Health and wellbeing for communities which have
limited access to medical assistance has been a priority
area for WPL and last year too saw the continuation of
these programmes with the valuable support of a few
non-prot organisations.
We continued to conduct medical camps for our
employees, their families and the neighborhoods on
our estates. Being a member of a conglomerate that
is a key player in Sri Lanka’s Healthcare market has
been an encouragement and an incentive for our active
involvement in health related community initiatives. The
medical camps provide consultation and free medicine,knowledge sharing and screening for Diabetes,
Hypertension, Asthma, Cholesterol, Blood sugar and
Blood pressure.
Eye camps organized in collaboration with the Berendina
Foundation was a signicant Health related community
initiative during the year. We have undertaken the
sponsorship of 200 patients for cataract surgeries in
support of the national programme to prevent and
annual report 2011 | 20annual report 2011 | 20

8/14/2019 Watawala Plantations 2011.2012.pdf
http://slidepdf.com/reader/full/watawala-plantations-20112012pdf 80/160
control avoidable blindness under the “Vision 2020”
programme of the Ministry of Health. Cataract is a
priority area under the national Health care programme.
During the year under review, we were able to conduct
eyes camps in the district of Nuwara Eliya. The
Company provided intraocular lenses, accessories,
and the required drugs and other consumables, with
the support of our sister company Swiss Biogenics.
The camp in Nuwara eliya attended to 89 individuals with
vision problems out of whom 59 were recommended
for cataract surgery. The surgeries were conducted by
Dr. Kala Sivayoganathan at General Hospital, Nuwara
Eliya.
The Company also helped provide nourishment to
pregnant mothers as well as Diabetic patients; in
collaboration with our sister company SBL Ltd 7,500
free Glucerna, Formance milk sachets were distributed
amongst would be mothers as well as Diabetic patients
living on our estates. Additionally, we also distributed
baby care items in association with the Sri Lanka Red
Cross Society amongst pregnant mothers on our
Company’s Shannon estate.
Amongst the other health related initiatives during
the year were programs to increase awareness on
prevention of HIV /AIDS and Dengue.
Similarly an awareness program on the proper
management of serpent bites was conducted in
partnership with the Wild Life Conservation Society
of Sri Lanka. Given the high vulnerability of estate
populations in some of the regions to snake bites,
the program has been found to be very useful in
these areas which have a high rate of vulnerability
to venomous snake bites. The topics covered by the
program included the identication of snakes- which
is important as misidentication is often found to be a
cause of death of a bite victim, and the ‘what not to” in
the immediate care of a victim.
Watawala Plantations PLC
78
Sustainability Report
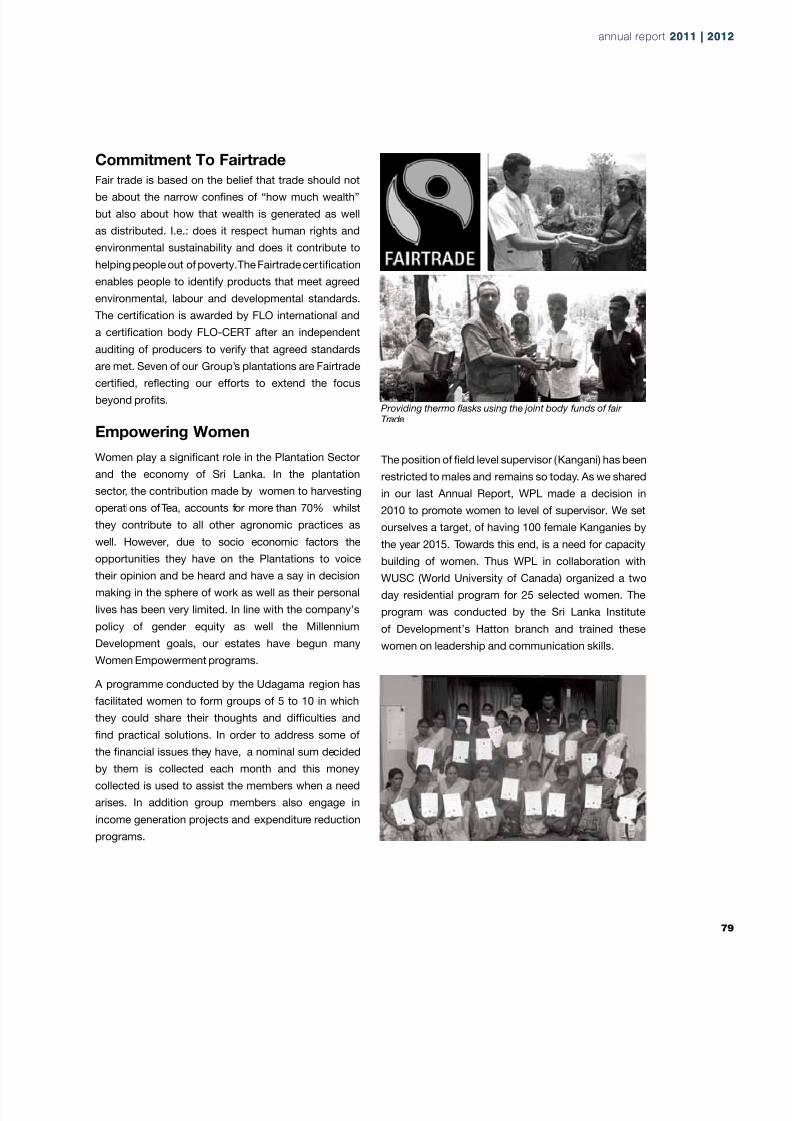
8/14/2019 Watawala Plantations 2011.2012.pdf
http://slidepdf.com/reader/full/watawala-plantations-20112012pdf 81/160
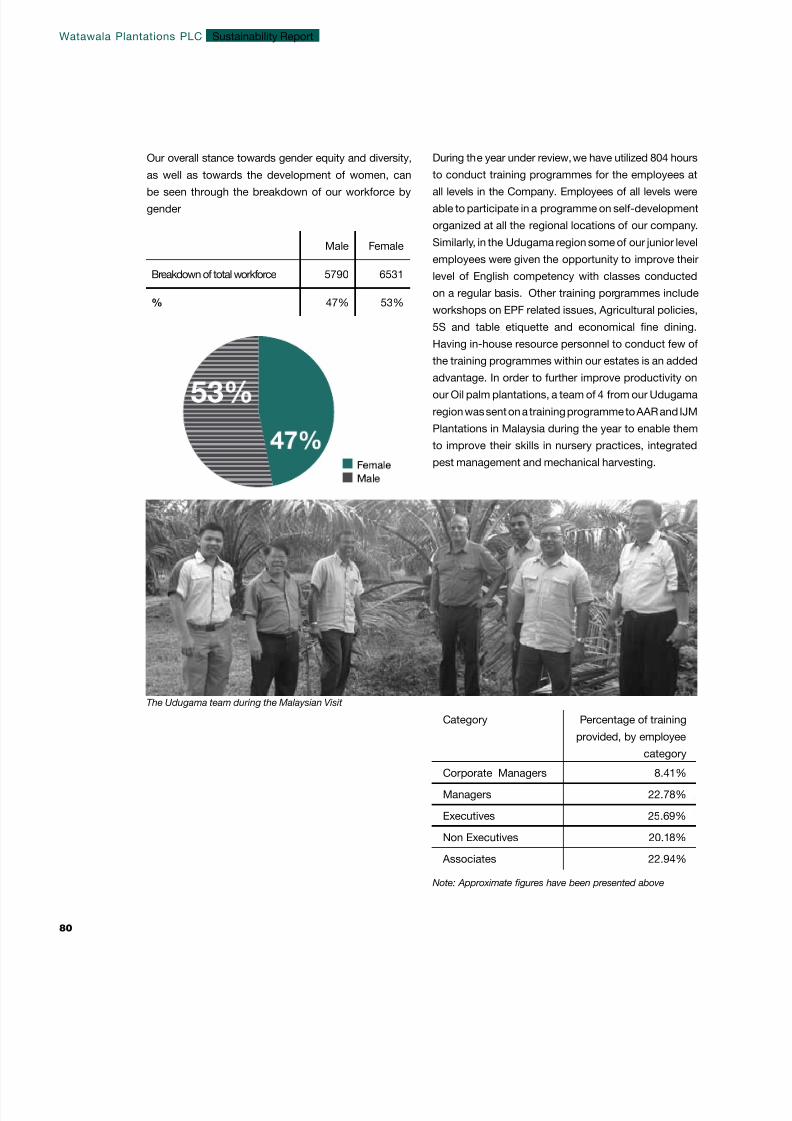
8/14/2019 Watawala Plantations 2011.2012.pdf
http://slidepdf.com/reader/full/watawala-plantations-20112012pdf 82/160
Male Female
Breakdown of total workforce 5790 6531
% 47% 53%
During the year under review, we have utilized 804 hours
to conduct training programmes for the employees at
all levels in the Company. Employees of all levels were
able to participate in a programme on self-development
organized at all the regional locations of our company.
Similarly, in the Udugama region some of our junior level
employees were given the opportunity to improve their
level of English competency with classes conducted
on a regular basis. Other training porgrammes include
workshops on EPF related issues, Agricultural policies,
5S and table etiquette and economical ne dining.
Having in-house resource personnel to conduct few of
the training programmes within our estates is an added
advantage. In order to further improve productivity on
our Oil palm plantations, a team of 4 from our Udugama
region was sent on a training programme to AAR and IJM
Plantations in Malaysia during the year to enable them
to improve their skills in nursery practices, integrated
pest management and mechanical harvesting.
Category Percentage of training
provided, by employeecategory
Corporate Managers 8.41%
Managers 22.78%
Executives 25.69%
Non Executives 20.18%
Associates 22.94%
Note: Approximate gures have been presented above
The Udugama team during the Malaysian Visit
Our overall stance towards gender equity and diversity,
as well as towards the development of women, can
be seen through the breakdown of our workforce by
gender
Watawala Plantations PLC
80
Sustainability Report
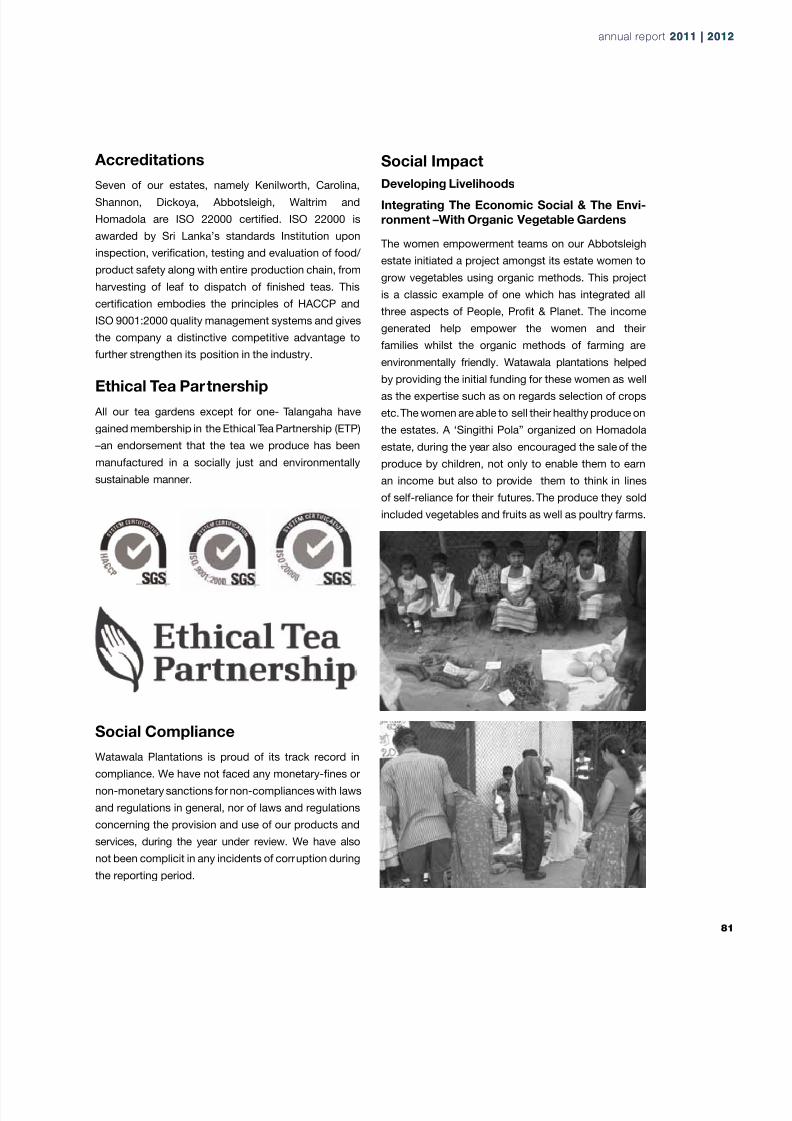
8/14/2019 Watawala Plantations 2011.2012.pdf
http://slidepdf.com/reader/full/watawala-plantations-20112012pdf 83/160
Accreditations
Seven of our estates, namely Kenilworth, Carolina,
Shannon, Dickoya, Abbotsleigh, Waltrim and
Homadola are ISO 22000 certied. ISO 22000 is
awarded by Sri Lanka’s standards Institution upon
inspection, verication, testing and evaluation of food/
product safety along with entire production chain, from
harvesting of leaf to dispatch of nished teas. This
certication embodies the principles of HACCP and
ISO 9001:2000 quality management systems and gives
the company a distinctive competitive advantage to
further strengthen its position in the industry.
Ethical Tea Partnership
All our tea gardens except for one- Talangaha have
gained membership in the Ethical Tea Partnership (ETP)
–an endorsement that the tea we produce has been
manufactured in a socially just and environmentally
sustainable manner.
Social ComplianceWatawala Plantations is proud of its track record in
compliance. We have not faced any monetary-nes or
non-monetary sanctions for non-compliances with laws
and regulations in general, nor of laws and regulations
concerning the provision and use of our products and
services, during the year under review. We have also
not been complicit in any incidents of corruption during
the reporting period.
Social Impact
Developing Livelihoods
Integrating The Economic Social & The Envi-
ronment –With Organic Vegetable Gardens
The women empowerment teams on our Abbotsleigh
estate initiated a project amongst its estate women to
grow vegetables using organic methods. This project
is a classic example of one which has integrated all
three aspects of People, Prot & Planet. The income
generated help empower the women and their
families whilst the organic methods of farming are
environmentally friendly. Watawala plantations helped
by providing the initial funding for these women as well
as the expertise such as on regards selection of crops
etc. The women are able to sell their healthy produce on
the estates. A ‘Singithi Pola” organized on Homadola
estate, during the year also encouraged the sale of the
produce by children, not only to enable them to earn
an income but also to provide them to think in lines
of self-reliance for their futures. The produce they sold
included vegetables and fruits as well as poultry farms.
annual report 2011 | 20annual report 2011 | 20

8/14/2019 Watawala Plantations 2011.2012.pdf
http://slidepdf.com/reader/full/watawala-plantations-20112012pdf 84/160
Community Involvement
Recognizing the right of every child to food, shelter,
clothing and education, and the need for assistance to
help their families provide these basic needs, WP over
the years have continued to initiate a range of socialupliftment projects. Some of the initiatives during the
year under reported are presented below.
During the year, the company adopted a novel
approach to help the communities with greater focus,
and involvement by the company. Identied under the
concept ‘Happy Family”, the project was pioneered
in the Udugama region. It involves the evaluation
of households that make up a community, on a set
Fresh Water Fish Release
We continued our project to develop inland sheries
which was launched during the previous year. More
than 2000 Fresh Water Fish ngerlings were released to
a Lake in the Panmure Division of Strathdon Estate and
to a lake on Shannon estate in Korangumaley Division.
Live Stock and Estate Infrastructure Development
Minister Hon. Arumugam Thondaman, and ofcial of
the PHDT graced this occasion.
These lakes are now home to different species of fresh
water sh which include Thilapia, Red Cats and red
Thilapia. The project has proved to be a success by
facilitating additional incomes for villagers who can
engage in shing, as well as by enhancing nutrition
to employee families and children in our creches. For
instance, the harvesting of more than 5000 prawns
in the Udugama region during the year under review
benetted its community considerably.
Infrastructure Investment
Building Houses On Homadola Estate
During the year the company partnered with “Padem”
a nonprot organization from France to help build 20
houses for our plantation workers. We provided the
land and the required timber for the construction.
Each house valued at Rs.1 million comprises all basic
facilities including an in-house bathroom.
Renovation Of The Nakiyadeniya Temple
The management and associates on the Nakiyadeniya
Rubber Estate contributed a sum of Rs.120, 000 to
renovate the historic Nakiyadeniya Temple that was in
a dilapidated condition.
Watawala Plantations PLC
82
Sustainability Report
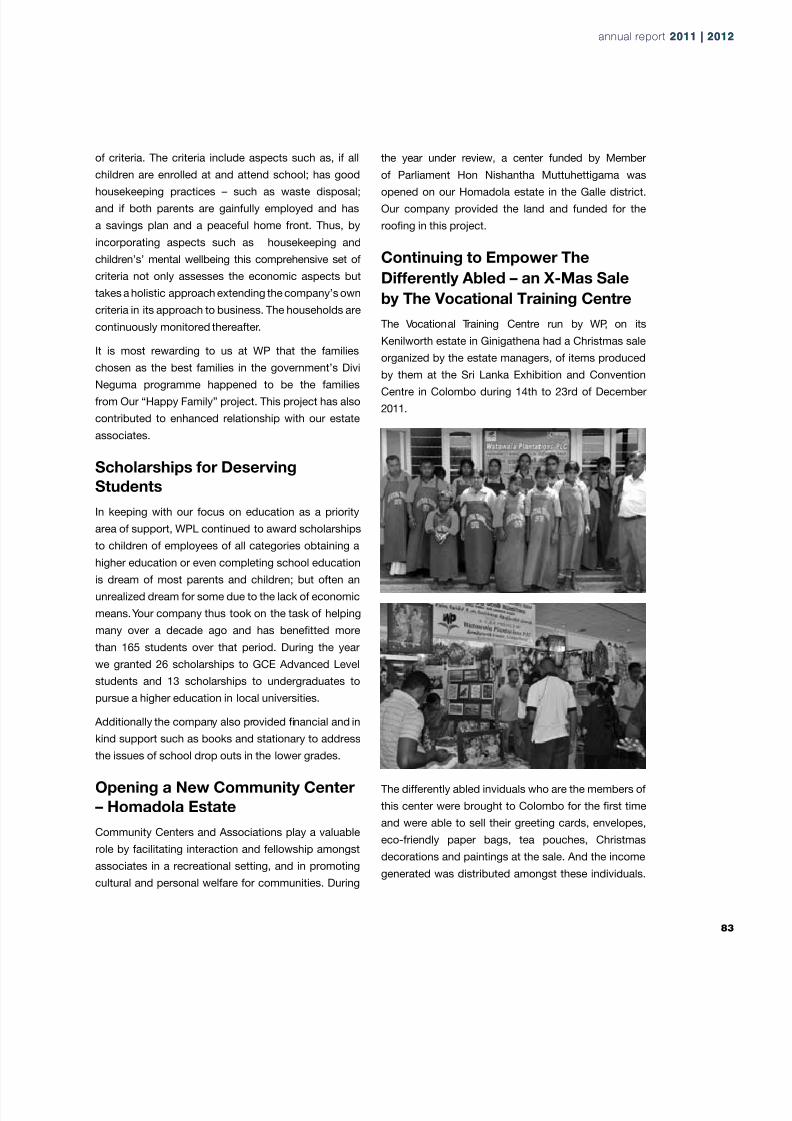
8/14/2019 Watawala Plantations 2011.2012.pdf
http://slidepdf.com/reader/full/watawala-plantations-20112012pdf 85/160
of criteria. The criteria include aspects such as, if all
children are enrolled at and attend school; has good
housekeeping practices – such as waste disposal;
and if both parents are gainfully employed and has
a savings plan and a peaceful home front. Thus, by
incorporating aspects such as housekeeping and
children’s’ mental wellbeing this comprehensive set of
criteria not only assesses the economic aspects but
takes a holistic approach extending the company’s own
criteria in its approach to business. The households are
continuously monitored thereafter.
It is most rewarding to us at WP that the families
chosen as the best families in the government’s DiviNeguma programme happened to be the families
from Our “Happy Family” project. This project has also
contributed to enhanced relationship with our estate
associates.
Scholarships for Deserving
Students
In keeping with our focus on education as a priority
area of support, WPL continued to award scholarships
to children of employees of all categories obtaining a
higher education or even completing school education
is dream of most parents and children; but often an
unrealized dream for some due to the lack of economic
means. Your company thus took on the task of helping
many over a decade ago and has benetted more
than 165 students over that period. During the year
we granted 26 scholarships to GCE Advanced Level
students and 13 scholarships to undergraduates to
pursue a higher education in local universities.
Additionally the company also provided nancial and in
kind support such as books and stationary to addressthe issues of school drop outs in the lower grades.
Opening a New Community Center
– Homadola Estate
Community Centers and Associations play a valuable
role by facilitating interaction and fellowship amongst
associates in a recreational setting, and in promoting
cultural and personal welfare for communities. During
the year under review, a center funded by Member
of Parliament Hon Nishantha Muttuhettigama was
opened on our Homadola estate in the Galle district.
Our company provided the land and funded for the
roong in this project.
Continuing to Empower The
Differently Abled – an X-Mas Sale
by The Vocational Training Centre
The Vocational Training Centre run by WP, on its
Kenilworth estate in Ginigathena had a Christmas sale
organized by the estate managers, of items produced
by them at the Sri Lanka Exhibition and Convention
Centre in Colombo during 14th to 23rd of December
2011.
The differently abled inviduals who are the members of
this center were brought to Colombo for the rst time
and were able to sell their greeting cards, envelopes,
eco-friendly paper bags, tea pouches, Christmas
decorations and paintings at the sale. And the income
generated was distributed amongst these individuals.
annual report 2011 | 20annual report 2011 | 20
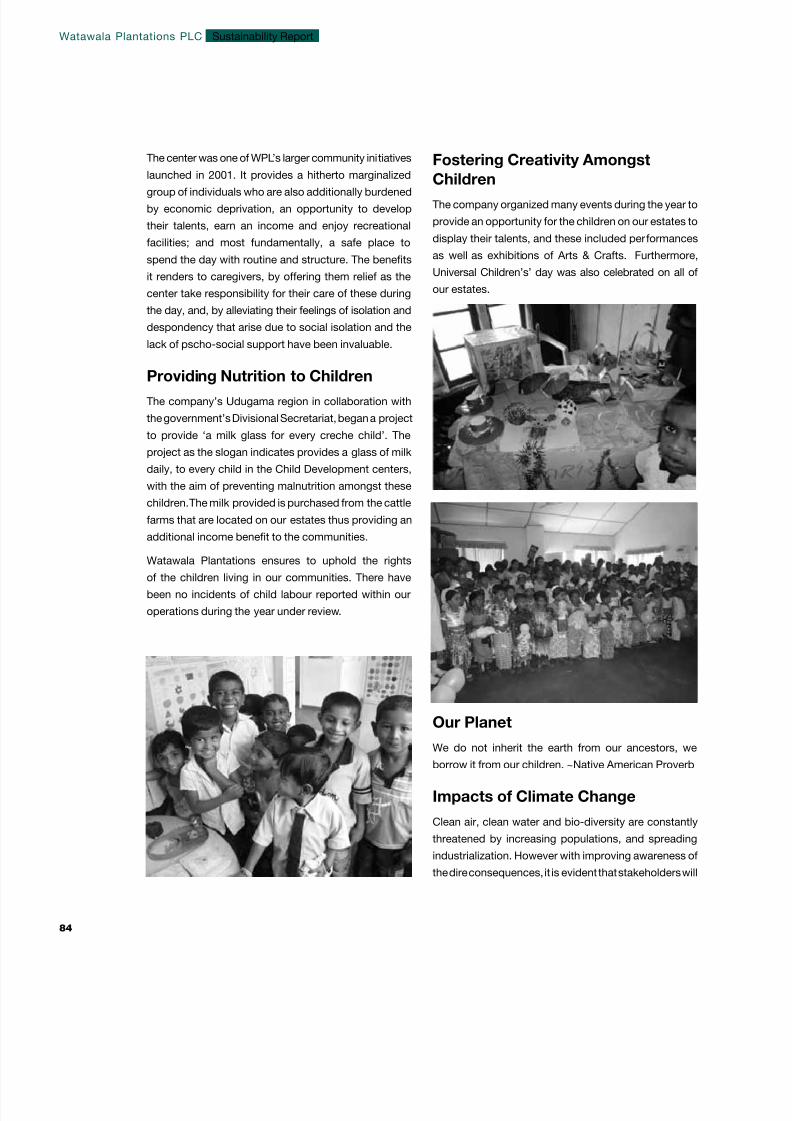
8/14/2019 Watawala Plantations 2011.2012.pdf
http://slidepdf.com/reader/full/watawala-plantations-20112012pdf 86/160
Fostering Creativity Amongst
ChildrenThe company organized many events during the year to
provide an opportunity for the children on our estates to
display their talents, and these included performances
as well as exhibitions of Arts & Crafts. Furthermore,
Universal Children’s’ day was also celebrated on all of
our estates.
Our Planet
We do not inherit the earth from our ancestors, we
borrow it from our children. ~Native American Proverb
Impacts of Climate Change
Clean air, clean water and bio-diversity are constantly
threatened by increasing populations, and spreading
industrialization. However with improving awareness of
the dire consequences, it is evident that stakeholders will
The center was one of WPL’s larger community initiatives
launched in 2001. It provides a hitherto marginalized
group of individuals who are also additionally burdened
by economic deprivation, an opportunity to develop
their talents, earn an income and enjoy recreational
facilities; and most fundamentally, a safe place to
spend the day with routine and structure. The benets
it renders to caregivers, by offering them relief as the
center take responsibility for their care of these during
the day, and, by alleviating their feelings of isolation and
despondency that arise due to social isolation and the
lack of pscho-social support have been invaluable.
Providing Nutrition to Children
The company’s Udugama region in collaboration with
the government’s Divisional Secretariat, began a project
to provide ‘a milk glass for every creche child’. The
project as the slogan indicates provides a glass of milk
daily, to every child in the Child Development centers,
with the aim of preventing malnutrition amongst these
children. The milk provided is purchased from the cattle
farms that are located on our estates thus providing an
additional income benet to the communities.
Watawala Plantations ensures to uphold the rights
of the children living in our communities. There have
been no incidents of child labour reported within our
operations during the year under review.
Watawala Plantations PLC
84
Sustainability Report
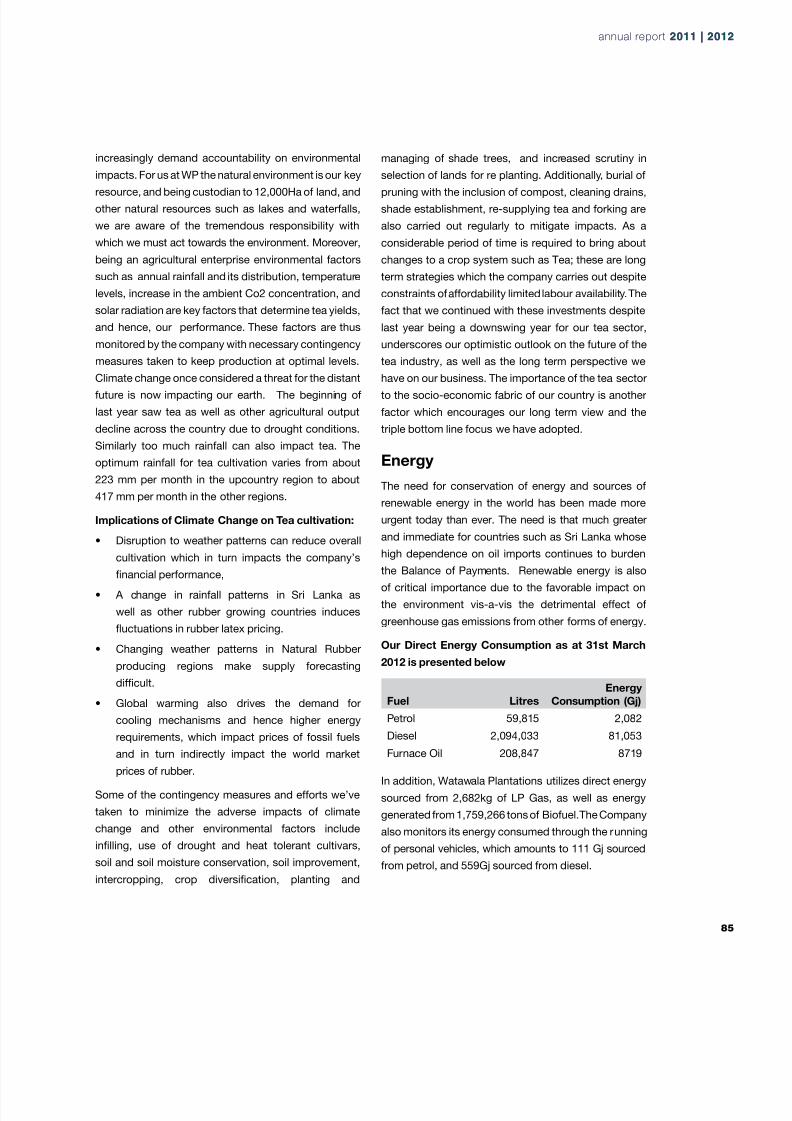
8/14/2019 Watawala Plantations 2011.2012.pdf
http://slidepdf.com/reader/full/watawala-plantations-20112012pdf 87/160
increasingly demand accountability on environmental
impacts. For us at WP the natural environment is our key
resource, and being custodian to 12,000Ha of land, and
other natural resources such as lakes and waterfalls,
we are aware of the tremendous responsibility with
which we must act towards the environment. Moreover,
being an agricultural enterprise environmental factors
such as annual rainfall and its distribution, temperature
levels, increase in the ambient Co2 concentration, and
solar radiation are key factors that determine tea yields,
and hence, our performance. These factors are thus
monitored by the company with necessary contingency
measures taken to keep production at optimal levels.
Climate change once considered a threat for the distant
future is now impacting our earth. The beginning of
last year saw tea as well as other agricultural output
decline across the country due to drought conditions.
Similarly too much rainfall can also impact tea. The
optimum rainfall for tea cultivation varies from about
223 mm per month in the upcountry region to about
417 mm per month in the other regions.
Implications of Climate Change on Tea cultivation:
• Disruption to weather patterns can reduce overall
cultivation which in turn impacts the company’s
nancial performance,
• A change in rainfall patterns in Sri Lanka as
well as other rubber growing countries induces
uctuations in rubber latex pricing.
• Changing weather patterns in Natural Rubber
producing regions make supply forecasting
difcult.
• Global warming also drives the demand for
cooling mechanisms and hence higher energy
requirements, which impact prices of fossil fuelsand in turn indirectly impact the world market
prices of rubber.
Some of the contingency measures and efforts we’ve
taken to minimize the adverse impacts of climate
change and other environmental factors include
inlling, use of drought and heat tolerant cultivars,
soil and soil moisture conservation, soil improvement,
intercropping, crop diversication, planting and
managing of shade trees, and increased scrutiny in
selection of lands for re planting. Additionally, burial of
pruning with the inclusion of compost, cleaning drains,
shade establishment, re-supplying tea and forking are
also carried out regularly to mitigate impacts. As a
considerable period of time is required to bring about
changes to a crop system such as Tea; these are long
term strategies which the company carries out despite
constraints of affordability limited labour availability. The
fact that we continued with these investments despite
last year being a downswing year for our tea sector,
underscores our optimistic outlook on the future of the
tea industry, as well as the long term perspective we
have on our business. The importance of the tea sector
to the socio-economic fabric of our country is another
factor which encourages our long term view and the
triple bottom line focus we have adopted.
Energy
The need for conservation of energy and sources of
renewable energy in the world has been made more
urgent today than ever. The need is that much greater
and immediate for countries such as Sri Lanka whose
high dependence on oil imports continues to burdenthe Balance of Payments. Renewable energy is also
of critical importance due to the favorable impact on
the environment vis-a-vis the detrimental effect of
greenhouse gas emissions from other forms of energy.
Our Direct Energy Consumption as at 31st March
2012 is presented below
In addition, Watawala Plantations utilizes direct energy
sourced from 2,682kg of LP Gas, as well as energy
generated from 1,759,266 tons of Biofuel. The Company
also monitors its energy consumed through the running
of personal vehicles, which amounts to 111 Gj sourced
from petrol, and 559Gj sourced from diesel.
Fuel Litres
Energy
Consumption (Gj)
Petrol 59,815 2,082
Diesel 2,094,033 81,053Furnace Oil 208,847 8719
annual report 2011 | 20annual report 2011 | 20

8/14/2019 Watawala Plantations 2011.2012.pdf
http://slidepdf.com/reader/full/watawala-plantations-20112012pdf 88/160
kWh
Energy
Consumption (Gj)
Electricity
Consumption 2,713,758 9,769
Indirect energy consumed by the Company during
the year under review, through the use of electricity is
presented below
Your company’s efforts to explore and produce alternate
sources of renewable energy is one that integrates the
triple bottom line focus, by generating prots for the
company whilst contributing to the environment andthe nation’s progress. Our hydro power generating
schemes and the renewable fuel wood plantations are
efforts which have begun to make a contribution.
WP’s rst hydro power plant commissioned during the
year under review, now adds 1.6 Mega Watts of power
to the national grid; whilst two more plants expected to
come on board during the next nancial year.
For a third world country like Sri Lanka, Biomass is
one of the most viable and appropriate sources of
renewable energy. Our palm oil mill has invested in
a bio gas project which will generate electricity using
its mill efuent. The energy thus generated will help
to reduce the organization’s carbon footprint and its
reliance on Diesel -red generators.
Similarly our bio gas project in the Lonach Dairy Farm
produces bio gas and organic manure using cow waste.
Even though we are in the initial phase of this project,
this initiative has helped us to eliminate methane
emission thereby reducing GHG emission. The natural
fertilizer is used in the elds. Installation of a bio gas
generator is in progress since the farm generates about
100 m3 of bio gas per day which could generate 140
kWH electricity per day.
Tree Planting Campaign
He who plants a tree, Plants a hope. ~Lucy Larcom.
In 2011, we planted more than 1.1 million tree saplings
on an extent of 460 Hectares within our estates under
a tree planting campaign. Moreover, we invested
approximately Rs.38 million in the planting of Caliandra,
Rs.12 million in Eucalyptus and Rs.4 million in grass
planting. We will continue to increase the extent of
Calliandra – a short rotation crop and Eucalyptus as a
high value timber.
Bio gas project in Udugama
Bio gas project in Lonach estate
Watawala Plantations PLC
86
Sustainability Report

8/14/2019 Watawala Plantations 2011.2012.pdf
http://slidepdf.com/reader/full/watawala-plantations-20112012pdf 89/160
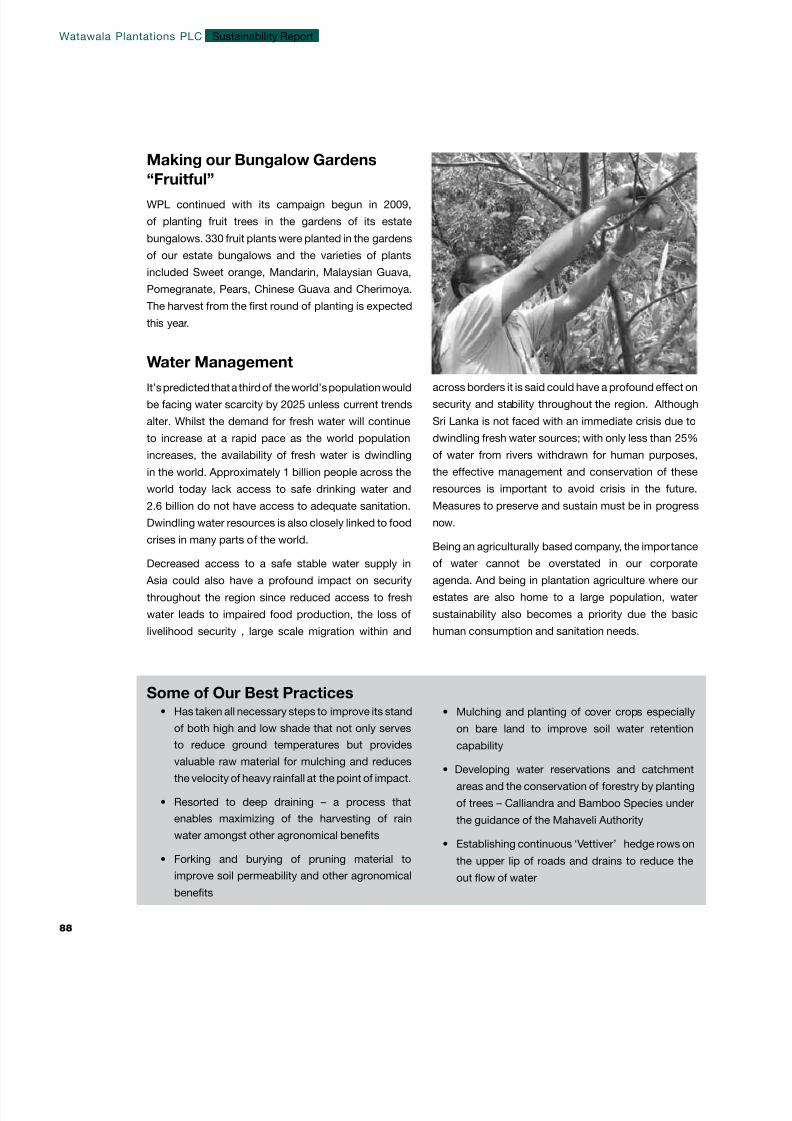
8/14/2019 Watawala Plantations 2011.2012.pdf
http://slidepdf.com/reader/full/watawala-plantations-20112012pdf 90/160
Making our Bungalow Gardens
“Fruitful”WPL continued with its campaign begun in 2009,
of planting fruit trees in the gardens of its estate
bungalows. 330 fruit plants were planted in the gardens
of our estate bungalows and the varieties of plants
included Sweet orange, Mandarin, Malaysian Guava,
Pomegranate, Pears, Chinese Guava and Cherimoya.
The harvest from the rst round of planting is expected
this year.
Water ManagementIt’s predicted that a third of the world’s population would
be facing water scarcity by 2025 unless current trends
alter. Whilst the demand for fresh water will continue
to increase at a rapid pace as the world population
increases, the availability of fresh water is dwindling
in the world. Approximately 1 billion people across the
world today lack access to safe drinking water and
2.6 billion do not have access to adequate sanitation.
Dwindling water resources is also closely linked to food
crises in many parts of the world.
Decreased access to a safe stable water supply in
Asia could also have a profound impact on security
throughout the region since reduced access to fresh
water leads to impaired food production, the loss of
livelihood security , large scale migration within and
across borders it is said could have a profound effect on
security and stability throughout the region. Although
Sri Lanka is not faced with an immediate crisis due to
dwindling fresh water sources; with only less than 25%
of water from rivers withdrawn for human purposes,
the effective management and conservation of these
resources is important to avoid crisis in the future.
Measures to preserve and sustain must be in progress
now.
Being an agriculturally based company, the importance
of water cannot be overstated in our corporate
agenda. And being in plantation agriculture where our
estates are also home to a large population, water
sustainability also becomes a priority due the basic
human consumption and sanitation needs.
Some of Our Best Practices• Has taken all necessary steps to improve its stand
of both high and low shade that not only serves
to reduce ground temperatures but provides
valuable raw material for mulching and reduces
the velocity of heavy rainfall at the point of impact.
• Resorted to deep draining – a process that
enables maximizing of the harvesting of rain
water amongst other agronomical benets
• Forking and burying of pruning material to
improve soil permeability and other agronomical
benets
• Mulching and planting of cover crops especially
on bare land to improve soil water retention
capability
• Developing water reservations and catchment
areas and the conservation of forestry by planting
of trees – Calliandra and Bamboo Species under
the guidance of the Mahaveli Authority
• Establishing continuous ‘Vettiver’ hedge rows on
the upper lip of roads and drains to reduce the
out ow of water
Watawala Plantations PLC
88
Sustainability Report
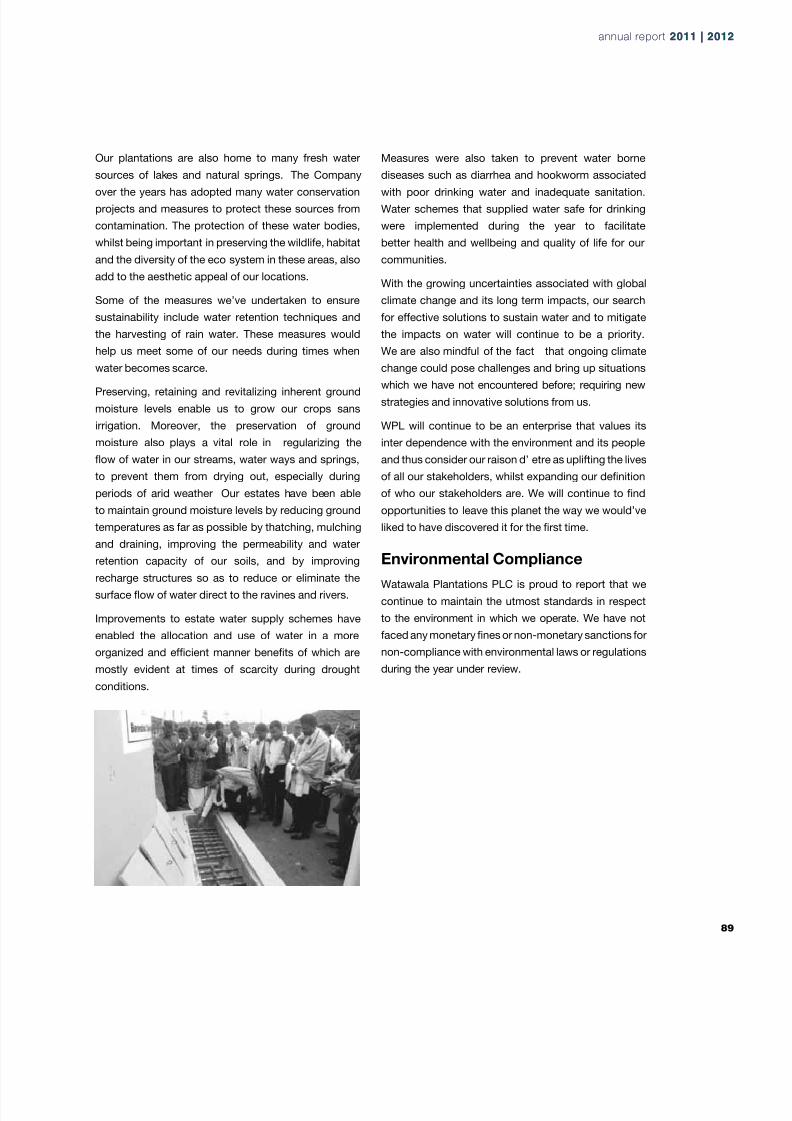
8/14/2019 Watawala Plantations 2011.2012.pdf
http://slidepdf.com/reader/full/watawala-plantations-20112012pdf 91/160
Our plantations are also home to many fresh water
sources of lakes and natural springs. The Company
over the years has adopted many water conservation
projects and measures to protect these sources from
contamination. The protection of these water bodies,
whilst being important in preserving the wildlife, habitat
and the diversity of the eco system in these areas, also
add to the aesthetic appeal of our locations.
Some of the measures we’ve undertaken to ensure
sustainability include water retention techniques and
the harvesting of rain water. These measures would
help us meet some of our needs during times when
water becomes scarce.
Preserving, retaining and revitalizing inherent ground
moisture levels enable us to grow our crops sans
irrigation. Moreover, the preservation of ground
moisture also plays a vital role in regularizing the
ow of water in our streams, water ways and springs,
to prevent them from drying out, especially during
periods of arid weather Our estates have been able
to maintain ground moisture levels by reducing ground
temperatures as far as possible by thatching, mulching
and draining, improving the permeability and water
retention capacity of our soils, and by improving
recharge structures so as to reduce or eliminate the
surface ow of water direct to the ravines and rivers.
Improvements to estate water supply schemes have
enabled the allocation and use of water in a more
organized and efcient manner benets of which are
mostly evident at times of scarcity during drought
conditions.
Measures were also taken to prevent water borne
diseases such as diarrhea and hookworm associated
with poor drinking water and inadequate sanitation.
Water schemes that supplied water safe for drinking
were implemented during the year to facilitate
better health and wellbeing and quality of life for our
communities.
With the growing uncertainties associated with global
climate change and its long term impacts, our search
for effective solutions to sustain water and to mitigate
the impacts on water will continue to be a priority.
We are also mindful of the fact that ongoing climate
change could pose challenges and bring up situationswhich we have not encountered before; requiring new
strategies and innovative solutions from us.
WPL will continue to be an enterprise that values its
inter dependence with the environment and its people
and thus consider our raison d’ etre as uplifting the lives
of all our stakeholders, whilst expanding our denition
of who our stakeholders are. We will continue to nd
opportunities to leave this planet the way we would’ve
liked to have discovered it for the rst time.
Environmental Compliance
Watawala Plantations PLC is proud to report that we
continue to maintain the utmost standards in respect
to the environment in which we operate. We have not
faced any monetary nes or non-monetary sanctions for
non-compliance with environmental laws or regulations
during the year under review.
annual report 2011 | 20annual report 2011 | 20
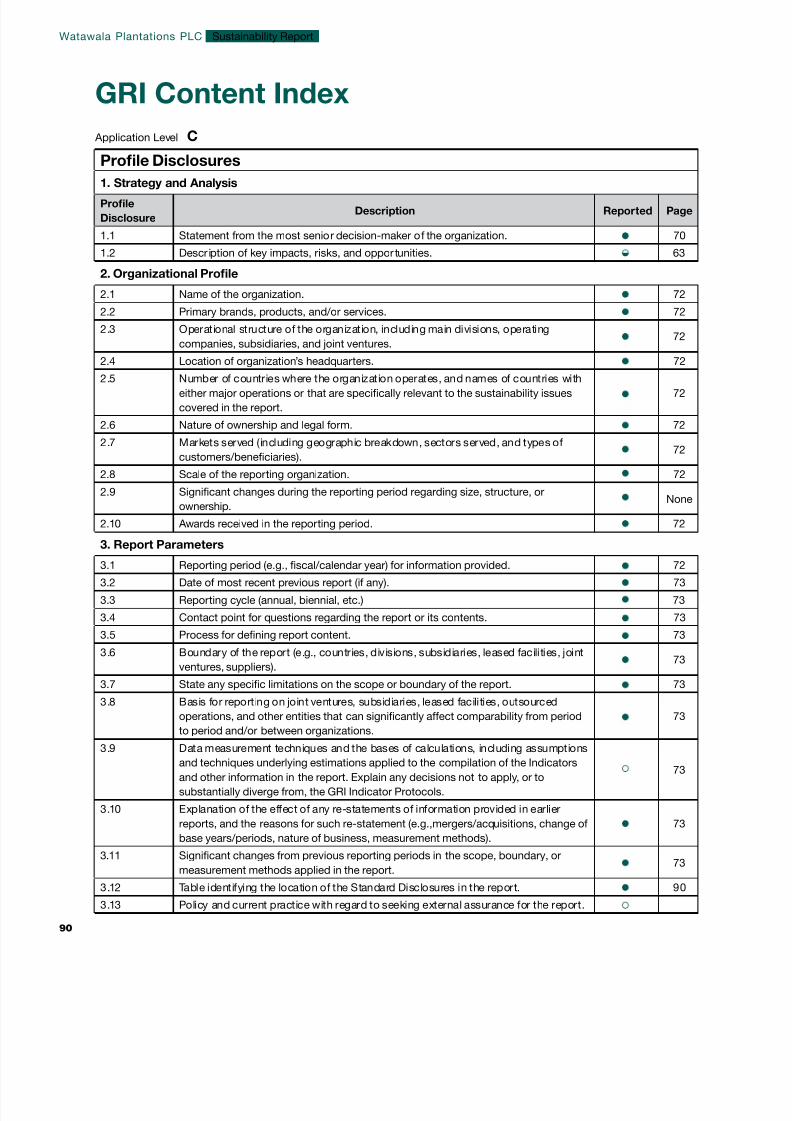
8/14/2019 Watawala Plantations 2011.2012.pdf
http://slidepdf.com/reader/full/watawala-plantations-20112012pdf 92/160
Prole Disclosures
1. Strategy and AnalysisProle
DisclosureDescription Reported Page
1.1 Statement from the most senior decision-maker of the organization. 70
1.2 Descr iption of key impacts, risks, and opportunities. 63
2. Organizational Prole
2.1 Name of the organization. 72
2.2 Primary brands, products, and/or services. 72
2.3 Operational structure of the organization, including main divisions, operating
companies, subsidiaries, and joint ventures.72
2.4 Location of organization’s headquarters. 72
2.5 Number of countries where the organization operates, and names of countries with
either major operations or that are specically relevant to the sustainability issues
covered in the report.
72
2.6 Nature of ownership and legal form. 72
2.7 Markets served (including geographic breakdown, sectors served, and types of
customers/beneciaries).72
2.8 Scale of the reporting organization. 72
2.9 Signicant changes during the reporting period regarding size, structure, or
ownership.None
2.10 Awards received in the reporting period. 72
3. Report Parameters
3.1 Reporting period (e.g., scal/calendar year) for information provided. 72
3.2 Date of most recent previous report (if any). 73
3.3 Reporting cycle (annual, biennial, etc.) 73
3.4 Contact point for questions regarding the report or its contents. 73
3.5 Process for dening report content. 73
3.6 Boundary of the report (e.g., countries, divisions, subsidiaries, leased facilities, joint
ventures, suppliers).73
3.7 State any specic limitations on the scope or boundary of the report. 73
3.8 Basis for reporting on joint ventures, subsidiaries, leased facilities, outsourced
operations, and other entities that can signicantly affect comparability from period
to period and/or between organizations.
73
3.9 Data measurement techniques and the bases of calculations, including assumptions
and techniques underlying estimations applied to the compilation of the Indicators
and other information in the report. Explain any decisions not to apply, or to
substantially diverge from, the GRI Indicator Protocols.
73
3.10 Explanation of the effect of any re-statements of information provided in earlier
reports, and the reasons for such re-statement (e.g.,mergers/acquisitions, change of
base years/periods, nature of business, measurement methods).
73
3.11 Signicant changes from previous reporting periods in the scope, boundary, or
measurement methods applied in the report.73
3.12 Table identifying the location of the Standard Disclosures in the report. 90
3.13 Policy and current practice with regard to seeking external assurance for the report.
GRI Content Index
Application Level C
Watawala Plantations PLC
90
Sustainability Report
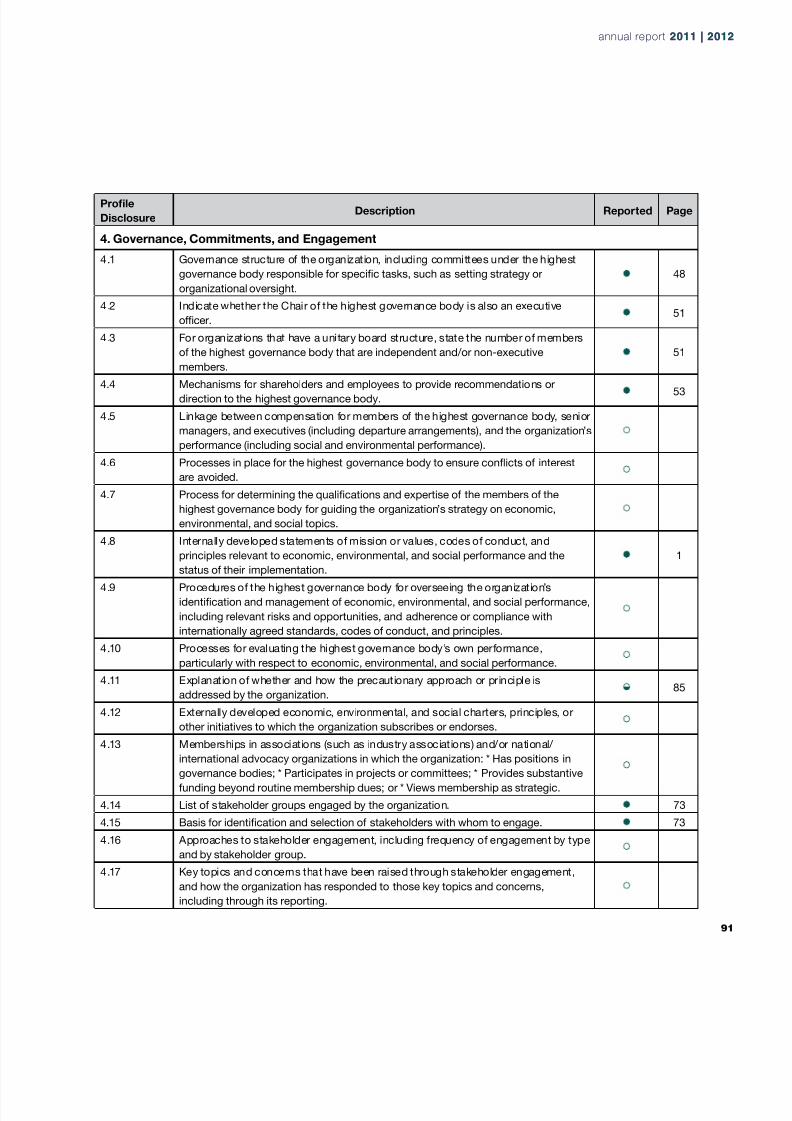
8/14/2019 Watawala Plantations 2011.2012.pdf
http://slidepdf.com/reader/full/watawala-plantations-20112012pdf 93/160
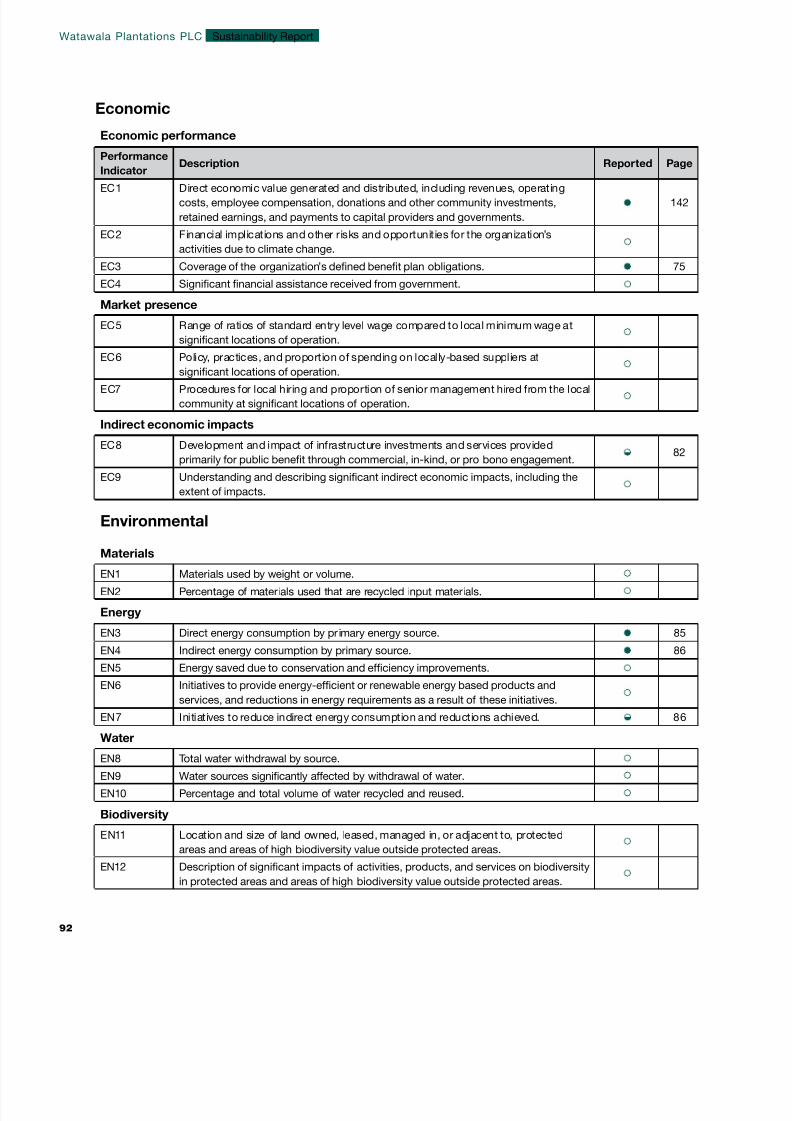
8/14/2019 Watawala Plantations 2011.2012.pdf
http://slidepdf.com/reader/full/watawala-plantations-20112012pdf 94/160
Economic performance
Performance
IndicatorDescription Reported Page
EC1 Direct economic value generated and distributed, including revenues, operating
costs, employee compensation, donations and other community investments,
retained earnings, and payments to capital providers and governments.
142
EC2 Financial implications and other risks and opportunities for the organization’s
activities due to climate change.
EC3 Coverage of the organization’s dened benet plan obligations. 75
EC4 Signicant nancial assistance received from government.
Market presence
EC5 Range of ratios of standard entry level wage compared to local minimum wage at
signicant locations of operation.
EC6 Policy, practices, and proportion of spending on locally-based suppliers at
signicant locations of operation.
EC7 Procedures for local hiring and proportion of senior management hired from the local
community at signicant locations of operation.
Indirect economic impacts
EC8 Development and impact of infrastructure investments and services provided
primarily for public benet through commercial, in-kind, or pro bono engagement.82
EC9 Understanding and describing signicant indirect economic impacts, including the
extent of impacts.
Environmental
Materials
EN1 Materials used by weight or volume.
EN2 Percentage of materials used that are recycled input materials.
Energy
EN3 Direct energy consumption by pr imary energy source. 85
EN4 Indirect energy consumption by primary source. 86
EN5 Energy saved due to conservation and efciency improvements.
EN6 Initiatives to provide energy-efcient or renewable energy based products and
services, and reductions in energy requirements as a result of these initiatives.
EN7 Initiatives to reduce indirect energy consumption and reductions achieved. 86
Water
EN8 Total water withdrawal by source.
EN9 Water sources signicantly affected by withdrawal of water.
EN10 Percentage and total volume of water recycled and reused.
Biodiversity
EN11 Location and size of land owned, leased, managed in, or adjacent to, protected
areas and areas of high biodiversity value outside protected areas.
EN12 Description of signicant impacts of activities, products, and services on biodiversity
in protected areas and areas of high biodiversity value outside protected areas.
Economic
Watawala Plantations PLC
92
Sustainability Report
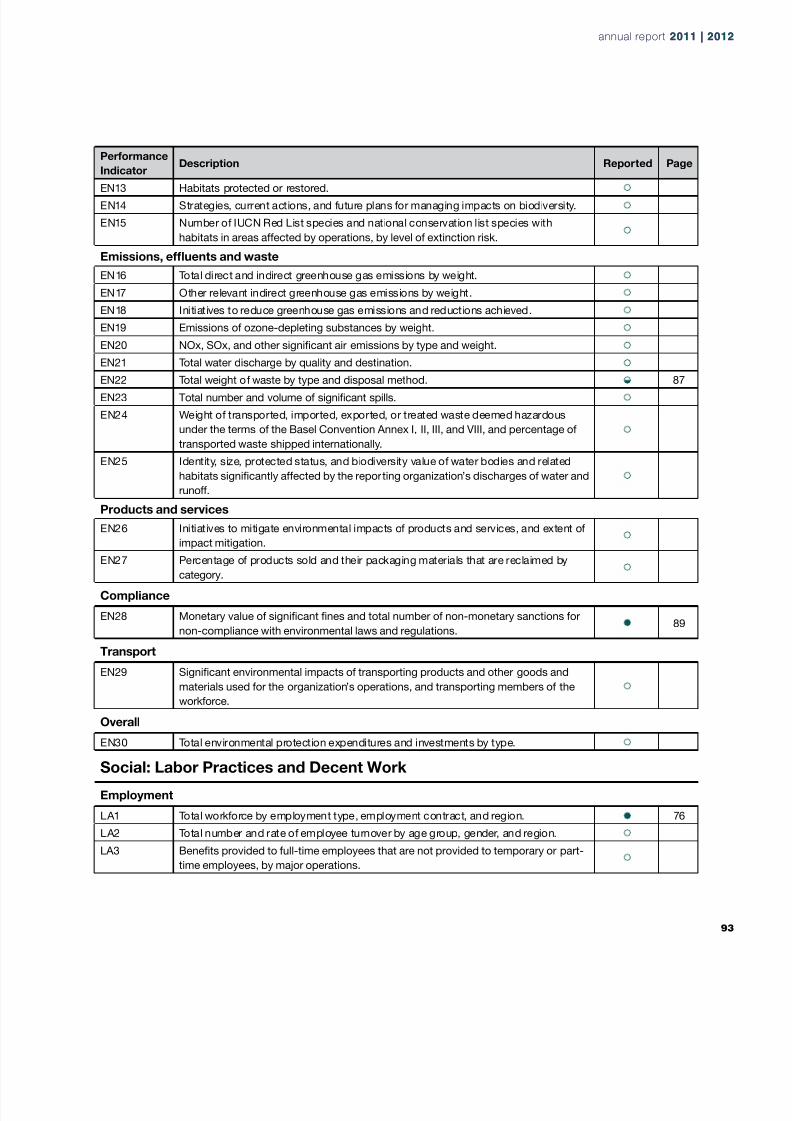
8/14/2019 Watawala Plantations 2011.2012.pdf
http://slidepdf.com/reader/full/watawala-plantations-20112012pdf 95/160
Performance
IndicatorDescription Reported Page
EN13 Habitats protected or restored.
EN14 Strategies, current actions, and future plans for managing impacts on biodiversity.
EN15 Number of IUCN Red List species and national conservation list species with
habitats in areas affected by operations, by level of extinction risk.
Emissions, efuents and waste
EN16 Total direct and indirect greenhouse gas emissions by weight.
EN17 Other relevant indirect greenhouse gas emissions by weight.
EN18 Initiatives to reduce greenhouse gas emissions and reductions achieved.
EN19 Emissions of ozone-depleting substances by weight.
EN20 NOx, SOx, and other signicant air emissions by type and weight.
EN21 Total water discharge by quality and destination.
EN22 Total weight of waste by type and disposal method. 87
EN23 Total number and volume of signicant spills.
EN24 Weight of transported, imported, exported, or treated waste deemed hazardous
under the terms of the Basel Convention Annex I, II, III, and VIII, and percentage of
transported waste shipped internationally.
EN25 Identity, size, protected status, and biodiversity value of water bodies and related
habitats signicantly affected by the reporting organization’s discharges of water and
runoff.
Products and services
EN26 Initiatives to mitigate environmental impacts of products and services, and extent of
impact mitigation.
EN27 Percentage of products sold and their packaging materials that are reclaimed by
category.
Compliance
EN28 Monetary value of signicant nes and total number of non-monetary sanctions for
non-compliance with environmental laws and regulations.89
Transport
EN29 Signicant environmental impacts of transporting products and other goods and
materials used for the organization’s operations, and transporting members of the
workforce.
Overall
EN30 Total environmental protection expenditures and investments by type.
Social: Labor Practices and Decent Work
Employment
LA1 Total workforce by employment type, employment contract, and region. 76
LA2 Total number and rate of employee turnover by age group, gender, and region.
LA3 Benets provided to full-time employees that are not provided to temporary or part-
time employees, by major operations.
annual report 2011 | 20annual report 2011 | 20
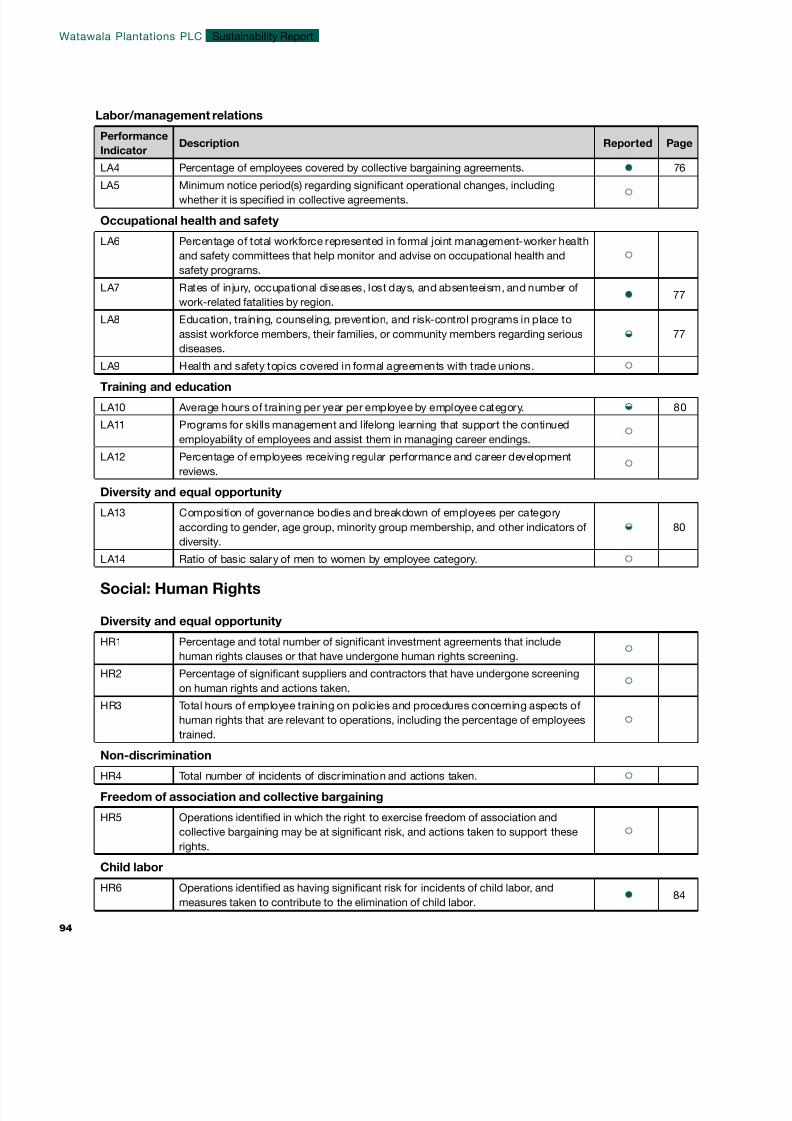
8/14/2019 Watawala Plantations 2011.2012.pdf
http://slidepdf.com/reader/full/watawala-plantations-20112012pdf 96/160
Labor/management relations
Performance
IndicatorDescription Reported Page
LA4 Percentage of employees covered by collective bargaining agreements. 76
LA5 Minimum notice period(s) regarding signicant operational changes, includingwhether it is specied in collective agreements.
Occupational health and safety
LA6 Percentage of total workforce represented in formal joint management-worker health
and safety committees that help monitor and advise on occupational health and
safety programs.
LA7 Rates of injury, occupational diseases, lost days, and absenteeism, and number of
work-related fatalities by region.77
LA8 Education, training, counseling, prevention, and risk-control programs in place to
assist workforce members, their families, or community members regarding serious
diseases.
77
LA9 Health and safety topics covered in formal agreements with trade unions.
Training and education
LA10 Average hours of training per year per employee by employee category. 80
LA11 Programs for skills management and lifelong learning that support the continued
employability of employees and assist them in managing career endings.
LA12 Percentage of employees receiving regular performance and career development
reviews.
Diversity and equal opportunity
LA13 Composition of governance bodies and breakdown of employees per category
according to gender, age group, minority group membership, and other indicators of
diversity.
80
LA14 Ratio of basic salary of men to women by employee category.
Social: Human Rights
Diversity and equal opportunity
HR1 Percentage and total number of signicant investment agreements that include
human rights clauses or that have undergone human rights screening.
HR2 Percentage of signicant suppliers and contractors that have undergone screening
on human rights and actions taken.
HR3 Total hours of employee training on policies and procedures concerning aspects of
human rights that are relevant to operations, including the percentage of employees
trained.Non-discrimination
HR4 Total number of incidents of discrimination and actions taken.
Freedom of association and collective bargaining
HR5 Operations identied in which the right to exercise freedom of association and
collective bargaining may be at signicant risk, and actions taken to support these
rights.
Child labor
HR6 Operations identied as having signicant risk for incidents of child labor, and
measures taken to contribute to the elimination of child labor.84
Watawala Plantations PLC
94
Sustainability Report
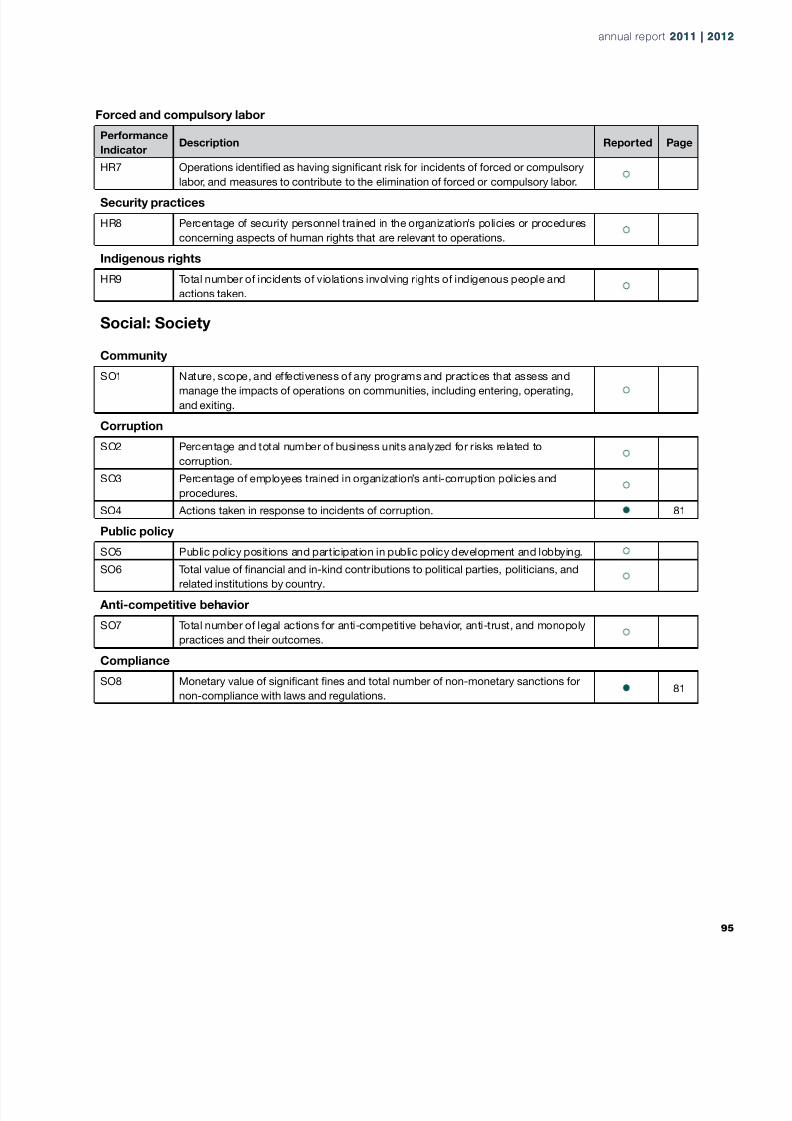
8/14/2019 Watawala Plantations 2011.2012.pdf
http://slidepdf.com/reader/full/watawala-plantations-20112012pdf 97/160
Forced and compulsory labor
Performance
IndicatorDescription Reported Page
HR7 Operations identied as having signicant risk for incidents of forced or compulsory
labor, and measures to contribute to the elimination of forced or compulsory labor.
Security practices
HR8 Percentage of security personnel trained in the organization’s policies or procedures
concerning aspects of human rights that are relevant to operations.
Indigenous rights
HR9 Total number of incidents of violations involving rights of indigenous people and
actions taken.
Social: Society
Community
SO1 Nature, scope, and effectiveness of any programs and practices that assess and
manage the impacts of operations on communities, including entering, operating,
and exiting.
Corruption
SO2 Percentage and total number of business units analyzed for risks related to
corruption.
SO3 Percentage of employees trained in organization’s anti-corruption policies and
procedures.
SO4 Actions taken in response to incidents of corruption. 81
Public policy
SO5 Public policy positions and participation in public policy development and lobbying.SO6 Total value of nancial and in-kind contributions to political parties, politicians, and
related institutions by country.
Anti-competitive behavior
SO7 Total number of legal actions for anti-competitive behavior, anti-trust, and monopoly
practices and their outcomes.
Compliance
SO8 Monetary value of signicant nes and total number of non-monetary sanctions for
non-compliance with laws and regulations.81
annual report 2011 | 20annual report 2011 | 20
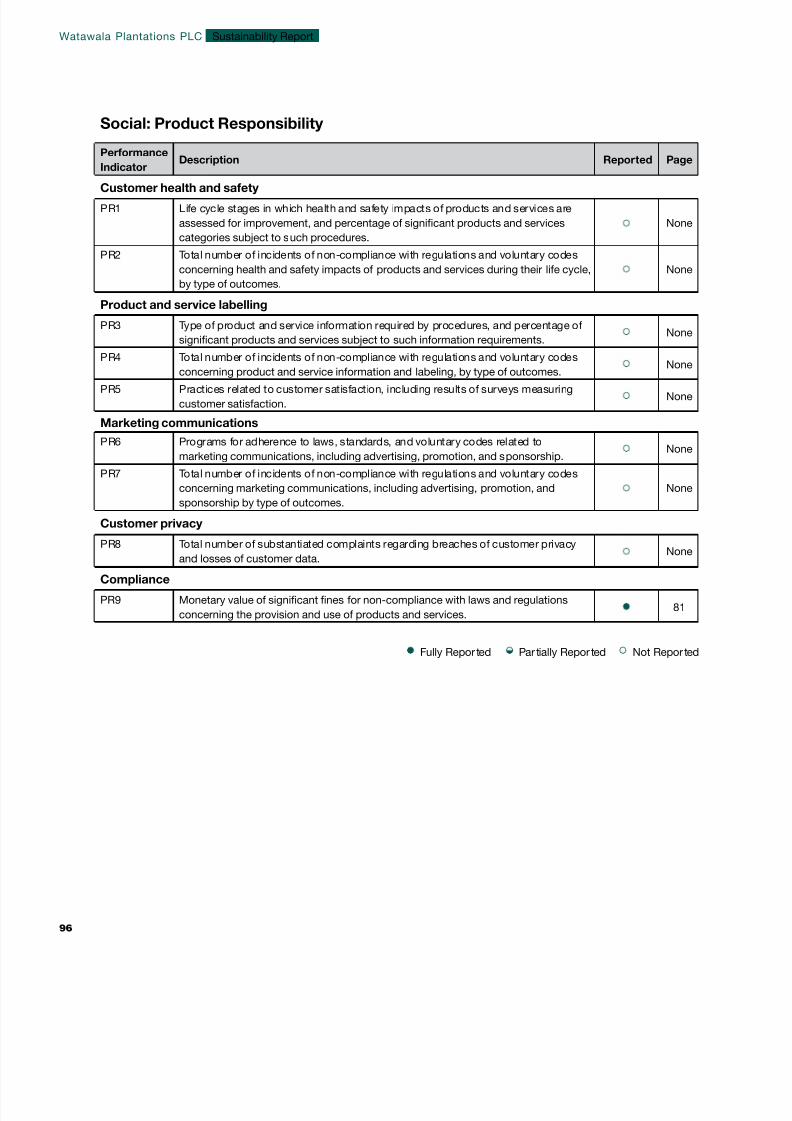
8/14/2019 Watawala Plantations 2011.2012.pdf
http://slidepdf.com/reader/full/watawala-plantations-20112012pdf 98/160
Social: Product Responsibility
Performance
IndicatorDescription Reported Page
Customer health and safety
PR1 Life cycle stages in which health and safety impacts of products and services are
assessed for improvement, and percentage of signicant products and services
categories subject to such procedures.
None
PR2 Total number of incidents of non-compliance with regulations and voluntary codes
concerning health and safety impacts of products and services during their life cycle,
by type of outcomes.
None
Product and service labelling
PR3 Type of product and service information required by procedures, and percentage of
signicant products and services subject to such information requirements.None
PR4 Total number of incidents of non-compliance with regulations and voluntary codes
concerning product and service information and labeling, by type of outcomes. None
PR5 Practices related to customer satisfaction, including results of surveys measuring
customer satisfaction.None
Marketing communications
PR6 Programs for adherence to laws, standards, and voluntary codes related to
marketing communications, including advertising, promotion, and sponsorship.None
PR7 Total number of incidents of non-compliance with regulations and voluntary codes
concerning marketing communications, including advertising, promotion, and
sponsorship by type of outcomes.
None
Customer privacy
PR8 Total number of substantiated complaints regarding breaches of customer privacy
and losses of customer data. None
Compliance
PR9 Monetary value of signicant nes for non-compliance with laws and regulations
concerning the provision and use of products and services.81
Fully Repor ted Par tially Repor ted Not Repor ted
Watawala Plantations PLC
96
Sustainability Report
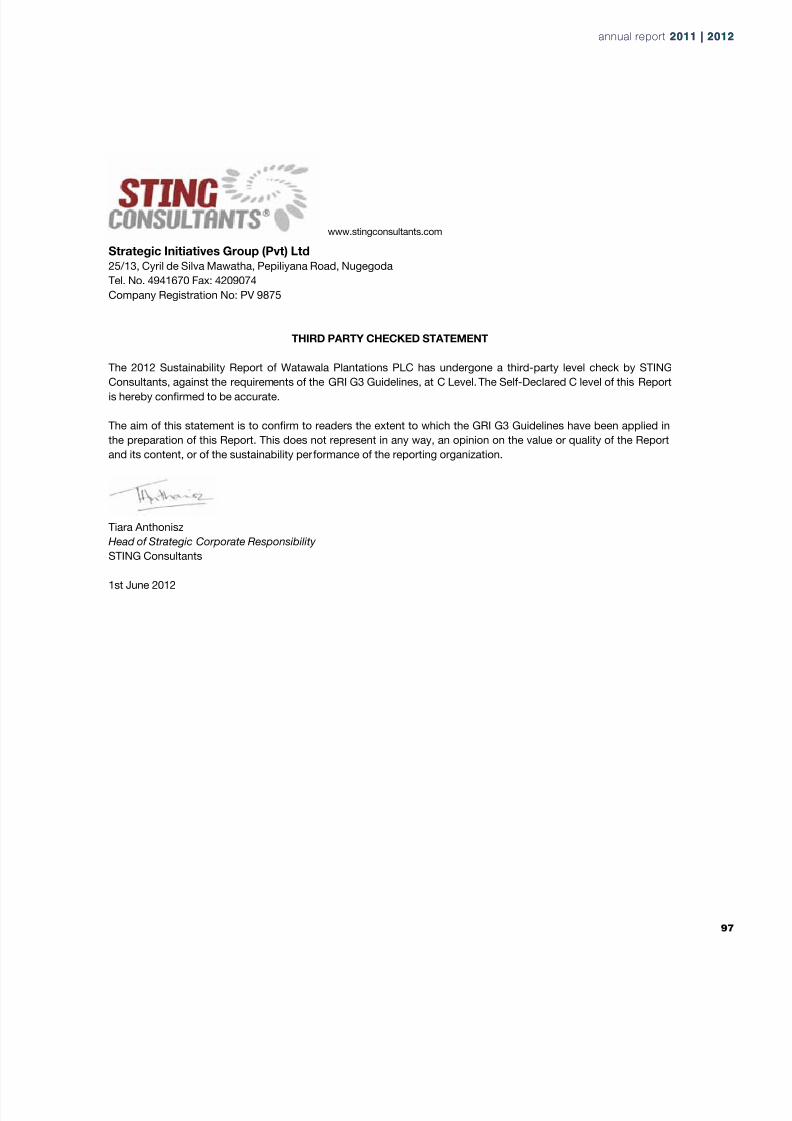
8/14/2019 Watawala Plantations 2011.2012.pdf
http://slidepdf.com/reader/full/watawala-plantations-20112012pdf 99/160
Strategic Initiatives Group (Pvt) Ltd
25/13, Cyril de Silva Mawatha, Pepiliyana Road, Nugegoda
Tel. No. 4941670 Fax: 4209074
Company Registration No: PV 9875
THIRD PARTY CHECKED STATEMENT
The 2012 Sustainability Report of Watawala Plantations PLC has undergone a third-party level check by STINGConsultants, against the requirements of the GRI G3 Guidelines, at C Level. The Self-Declared C level of this Report
is hereby conrmed to be accurate.
The aim of this statement is to conrm to readers the extent to which the GRI G3 Guidelines have been applied in
the preparation of this Report. This does not represent in any way, an opinion on the value or quality of the Report
and its content, or of the sustainability performance of the reporting organization.
Tiara Anthonisz
Head of Strategic Corporate Responsibility
STING Consultants
1st June 2012
www.stingconsultants.com
annual report 2011 | 20annual report 2011 | 20
8/14/2019 Watawala Plantations 2011.2012.pdf
http://slidepdf.com/reader/full/watawala-plantations-20112012pdf 100/160
IMPROVING
PRODUCTIVITY THROUGH MECHANISATION
8/14/2019 Watawala Plantations 2011.2012.pdf
http://slidepdf.com/reader/full/watawala-plantations-20112012pdf 101/160
Annual Report of the Board of Directors on the Affairs of the Company
Managing Director’s and Chief Financial Ofcer’s Responsibility Statement
Statement of Directors’ Responsibility
Report of the Auditors
Balance Sheet
Income Statement
Statement of Changes in Equity
Cash Flow Statement
Accounting Policies & Notes to the Financial Statements
FINANCIALINFORMATION
8/14/2019 Watawala Plantations 2011.2012.pdf
http://slidepdf.com/reader/full/watawala-plantations-20112012pdf 102/160
Annual Report of the Board of Directorson the Affairs of the Company
The details set out provide the pertinent information
required by the Companies Act No.07 of 2007, listing
rules of the Colombo Stock Exchange and are guided
by recommended best accounting practices.
Principal Activities, Business
Review, Future Developments
The principal activities of the Company and it’s
subsidiary during the year under review were cultivation,
manufacturing and sale of Tea, Rubber, Palm Oil and
direct exports of bulk and value added tea.
Review of OperationsThe Chairman’s and the Managing Director’s reviews
described briey the Group’s activities during the year
under review. The nancial results for the year are set
out in the income statement.
The Directors, to the best of their knowledge and belief,
conrm that the Group has not engaged in any activities
that contravene laws and regulations.
Financial Statements
The nancial statements of the Company and it’ssubsidiary are stated on page no. 106 to 139 in the
Annual Report.
Auditor’s Report
The auditor’s report on the nancial statements is
stated on page no. 105 in the Annual report.
Accounting Policies
The accounting policies adopted by the Company and
it’s subsidiary in the preparation of nancial statements
are stated on pages 110 to 116. There were no changes
in the accounting policies adopted from previous
nancial year other than the ones that are disclosed.
Interest Register
In compliance with the Companies Act No. 07 of 2007,
the Company and it’s subsidiary maintained the Interest
Registers. Particulars of entries in the interest register
are detailed below.
Directors’ Interest in transactionsThe Directors of the Group made the general disclo-
sures provided for in Section 192 (2) of the Companies
Act No.07 of 2007. Note 31 to the nancial statements
has dealt with related party disclosures and include de-
tails of their interests in transactions.
Directors’ Interest in Shares as at as at
31/03/12 31/03/11
G.Sathasivam - -
R.K.Krishnakumar - -
V.Govindasamy - -
D.V.Seevaratnam 23,000 3000
P.T.Siganporia - -
D.S.Ratnasingham 5,000 5000
K.Venkataramanan - -
B.A.Hulangamuwa - -
Directors’ Emoluments
Directors’ emoluments, in respect of the Company
and the Group for the nancial year 2011/2012 areRs. 19,700,000 (2010/2011: Rs. 16,234,000) and Rs.
19,700,000 (2010/2011: Rs. 33,358,000) respectively,
as given in Note 22 to the nancial statements on page
133.
Corporate Donations
During the year 2011/2012 the Group has not made any
donations.(2010/2011: Rs. 5,000,000)
Directorate
Names of the Directors who held ofce during the
nancial year are given below and their brief proles
are appeared on pages 22 to 24 of the Annual report.
Executive Directors
V.Govindasamy
D.S.Ratnasingham
D.V.Seevaratnam
Watawala Plantations PLC
100
Financial Information

8/14/2019 Watawala Plantations 2011.2012.pdf
http://slidepdf.com/reader/full/watawala-plantations-20112012pdf 103/160
Non-Executive DirectorsR.K.Krishnakumar
G.Sathasivam
P.T.Siganporia
K.Venkataramanan
B.A.Hulangamuwa
A.N.Fernando
Special notice is given of the intention to propose
an ordinary resolution for re-appointment of
Mr.R.K.Krishnakumar,who attained the age of seventy
four years notwithstanding the age limit of 70 years
stipulated by section 210 of the Companies Act No. 07
of 2007.
Mr. D.V. Seevaratnam retires by rotation and being
eligible offers himself for re-election.
Mr. K. Venkataramanan retires by rotation and being
eligible offers himself for re-election.
Auditors
Messes. PriceWaterhouseCoopers,(PWC) Chartered
Accountants are deemed to be re-appointed as
auditors in terms of Section 158 of the Companies Act
No. 07 of 2007.
The audit fees paid to PWC during the year under
review by the Company and the Group amounted
to Rs.1,696,000. (2010/2011: Rs.1,200,000) and
Rs.1,962,000 (2010/2011 Rs.1,600,000) respectively.
Further the Group has paid Rs.200,000 (2010/2011:
Rs.138,000) for reimbusement of expenses.
As far as the Directors are aware, the Auditors do not
have any relationship (other than that of an auditor)
with the Company or of its subsidiary other than those
disclosed above. The auditors also do not have any
interests in the Company or of its subsidiary.
Turnover
The revenue of the Group for 2011/2012 was
Rs.4,535,486,000 (2010/2011: Rs. 6,158,246,000)
while the Company’s revenue was Rs.4,532,269,000
(2010/2011:Rs. 4,663,744,000). An analysis of income
is given note 19 to the nancial statements.
Results of Operations
The Group’s prot for the year amounted to Rs.
412,585,000.(2010/2011: Rs.642,472,000) while the
Company recorded a net prot of Rs.520,839,000
(2010/2011:Rs.532,400,000).
The Consolidated Income Statement along with the
Company’s Income Statement for the year are given
on page 107. Details of transfer to / from reserves in
respect of the Group and the company are shown in the
Statement of Changes in Equity on page 108.
Capital Expenditure
The total capital expenditure on purchase and
construction of property, plant & equipment and
expenditure incured on immature plantations by the
Company and the Group amounted to Rs. 573,292,000
(2010/2011: Company-Rs. 715,159,000 and Group-
Rs.742,657,000). The movement in property, plant
& equipment is set out in note no 5 to the nancial
statements page on 117 and 120.
Stated Capital and Reserves
The stated capital of the Company as at 31 March
2012 is Rs. 310,000,000/- comprising of 236,666,670
ordinary shares. and 1 Golden share. There were no
changes in the stated capital during the year from
previous nancial year.
The capital and reserves of the Group and the Company
as at 31 March 2012 amounts to Rs 2,832,104,000/-
and Rs. 2,830,286,000 (2010/2011 - Group Rs.
2,620,686,000/- and Company Rs.2,510,614,000)
Share InformationInformation relating to earnings, dividends per share
and share trading is stated in the Financial Statements
on the pages 128, 142 and 143.
annual report 2011 | 20annual report 2011 | 20
1
8/14/2019 Watawala Plantations 2011.2012.pdf
http://slidepdf.com/reader/full/watawala-plantations-20112012pdf 104/160
8/14/2019 Watawala Plantations 2011.2012.pdf
http://slidepdf.com/reader/full/watawala-plantations-20112012pdf 105/160
Manging Director’s and Chief FinancialOfcer’s Responsibility Statement
The Financial Statements of the Watawala Plantations
PLC are prepared in compliance with the Sri Lanka
Accounting Standards issued by the Institute of
Chartered Accountants of Sri Lanka, Companies Act,
No 07 of 2007, Sri Lanka Accounting and Auditing
Standards Act No.15 of 1995, and the Listing Rules of
the Colombo Stock Exchange. The Accounting Policies
used in the preparation of the nancial statements
are appropriate and are consistently applied by the
Company. There are no departures from the prescribed
Accounting Standards in their adoption. Comparative
information is reclassied wherever necessary to
comply with the current presentation.
The signicant accounting policies and estimates that
involve a high degree of judgment and complexity were
discussed with our External Auditors and the Audit
Committee.
The Board of Directors and Chief Financial Ofcer of
the Company accept responsibility for the integrity and
objectivity of these nancial statements. The estimates
and judgments relating to the nancial statements
were made on a prudent and reasonable basis, in order
that the nancial statements give a true and fair view
of the state of affairs, the forms and substance of
transactions and that the Company’s state of affairs is
reasonably presented. To ensure this, the Company has
taken proper and sufcient care in installing a system of
internal control and accounting records, for safeguarding
assets and for preventing and detecting frauds as well
as other irregularities, which is reviewed, evaluated and
updated on an ongoing basis. Our internal auditors
have conducted periodic audits to provide reasonable
assurance that the established policies and procedures
of the Company were consistently followed. However,
there are inherent limitations that should be recognized
in weighing the assurance provided by any system of
internal controls and accounting.
The nancial statements of the company were audited
by Messrs PriceWaterhouseCoopers, Chartered
Accountants and their report is given on page 101 of
the Annual Report.
The Audit Committee of the company meets periodically
with the internal audit team and the external auditors to
review their audit plans, assess the manner in which
these auditors are performing their responsibilities
and to discuss their reports on, internal controls
and nancial reporting issues. To ensure complete
independence, the external auditors and the internal
auditor have full and free access to the members of the
Audit Committee to discuss any matters of substance.
We conrm that the Company have complied with all
applicable laws and regulations and guidelines and that
there are no material litigations that are pending against
the Company.
V. Govindasamy N.A.L.Cooray
Managing Director Chief Financial Ofcer
17/05/2012
annual report 2011 | 20annual report 2011 | 20
1

8/14/2019 Watawala Plantations 2011.2012.pdf
http://slidepdf.com/reader/full/watawala-plantations-20112012pdf 106/160
Statement of Directors’ Reponsibility
The following statement, which should be read in
conjunction with the Auditors’ Statement of their
responsibilities set out in their report, is made with a
view to distinguish the respective responsibilities of the
Directors and of the Auditors, in relation to the nancial
statements.
The Directors are required by the Companies Act No.
07 of 2007, to prepare nancial statements for each
nancial year, which give a true and fair view of the state
of affairs of the Company as at the end of the nancial
year and of the prot and loss for the nancial year.
The Directors are required to prepare these nancial
statements on going concern basis, unless it is notappropriate.
Since the Directors are satised that the Company has
resources to continue in business for the foreseeable
future, the nancial statements continue to be prepared
on the said basis.
The Directors consider that in preparing the nancial
statements on pages 102 to 131 the Company used
appropriate accounting policies, consistently applied
and supported by reasonable and prudent judgments
and estimated that all accounting standards, whichthey consider to be applicable, are followed.
The Directors are responsible for ensuring that the
Company keeps accounting records, which will disclose
with reasonable accuracy the nancial position of the
Company and which will enable them to ensure that
nancial statements comply with the Companies Act.
No. 07 of 2007.
The Directors are generally responsible for taking such
steps that are reasonably for them to safeguard the
assets of the Company and to prevent and detect fraud
and other irregularities.
The Directors are condent that they discharged their
responsibility as set out in this statement. They also
conrm that to the best of their knowledge all statutory
payments payable by the Company as at the Balance
Sheet date, are paid or where relevant, provided for.
By Order of the Board
V. Govindasamy D.V. Seevaratnam
Managing Director Director/CEO
17/05/2012
Watawala Plantations PLC
104
Financial Information
8/14/2019 Watawala Plantations 2011.2012.pdf
http://slidepdf.com/reader/full/watawala-plantations-20112012pdf 107/160
Independent Auditors’ Report
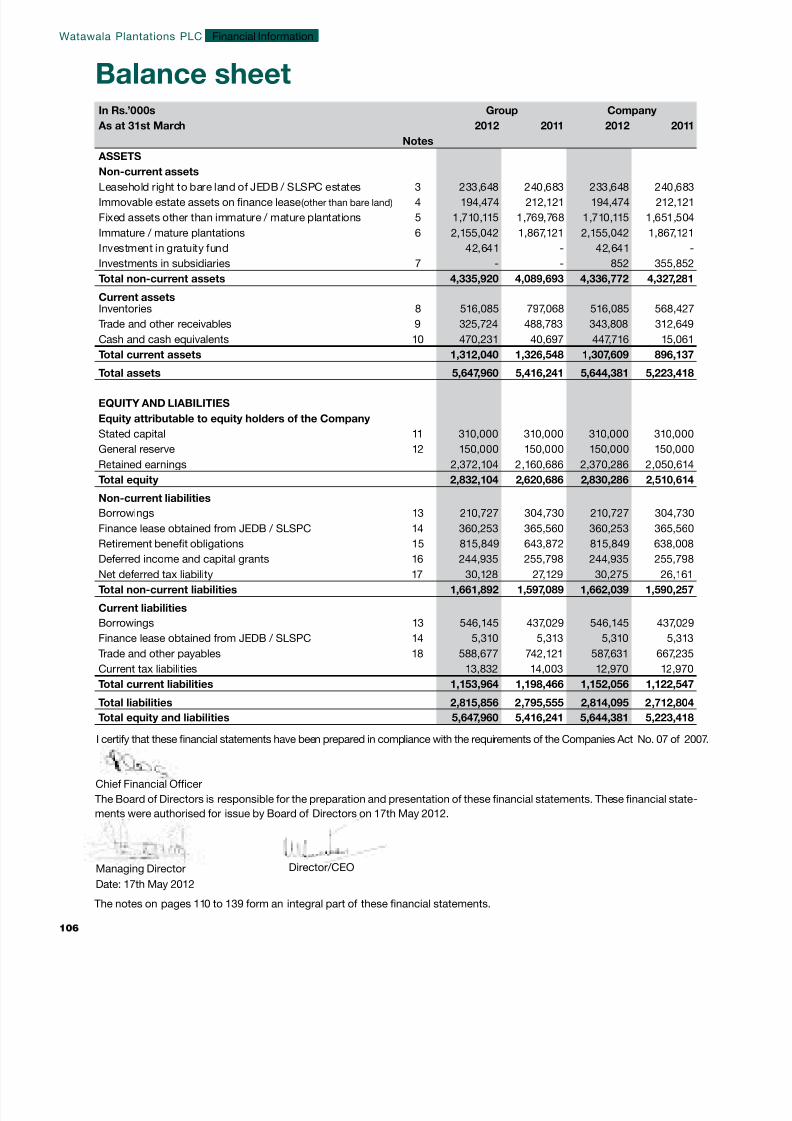
8/14/2019 Watawala Plantations 2011.2012.pdf
http://slidepdf.com/reader/full/watawala-plantations-20112012pdf 108/160
Balance sheetIn Rs.’000s Group Company
As at 31st March 2012 2011 2012 2011
Notes
ASSETS
Non-current assets
Leasehold right to bare land of JEDB / SLSPC estates 3 233,648 240,683 233,648 240,683
Immovable estate assets on nance lease(other than bare land) 4 194,474 212,121 194,474 212,121
Fixed assets other than immature / mature plantations 5 1,710,115 1,769,768 1,710,115 1,651,504
Immature / mature plantations 6 2,155,042 1,867,121 2,155,042 1,867,121
Investment in gratuity fund 42,641 - 42,641 -
Investments in subsidiaries 7 - - 852 355,852
Total non-current assets 4,335,920 4,089,693 4,336,772 4,327,281
Current assetsInventories 8 516,085 797,068 516,085 568,427
Trade and other receivables 9 325,724 488,783 343,808 312,649
Cash and cash equivalents 10 470,231 40,697 447,716 15,061
Total current assets 1,312,040 1,326,548 1,307,609 896,137
Total assets 5,647,960 5,416,241 5,644,381 5,223,418
EQUITY AND LIABILITIES
Equity attributable to equity holders of the Company
Stated capital 11 310,000 310,000 310,000 310,000
General reserve 12 150,000 150,000 150,000 150,000
Retained earnings 2,372,104 2,160,686 2,370,286 2,050,614
Total equity 2,832,104 2,620,686 2,830,286 2,510,614
Non-current liabilities
Borrowings 13 210,727 304,730 210,727 304,730
Finance lease obtained from JEDB / SLSPC 14 360,253 365,560 360,253 365,560
Retirement benet obligations 15 815,849 643,872 815,849 638,008
Deferred income and capital grants 16 244,935 255,798 244,935 255,798
Net deferred tax liability 17 30,128 27,129 30,275 26,161
Total non-current liabilities 1,661,892 1,597,089 1,662,039 1,590,257
Current liabilities
Borrowings 13 546,145 437,029 546,145 437,029
Finance lease obtained from JEDB / SLSPC 14 5,310 5,313 5,310 5,313
Trade and other payables 18 588,677 742,121 587,631 667,235
Current tax liabilities 13,832 14,003 12,970 12,970
Total current liabilities 1,153,964 1,198,466 1,152,056 1,122,547
Total liabilities 2,815,856 2,795,555 2,814,095 2,712,804
Total equity and liabilities 5,647,960 5,416,241 5,644,381 5,223,418
I certify that these nancial statements have been prepared in compliance with the requirements of the Companies Act No. 07 of 2007.
The Board of Directors is responsible for the preparation and presentation of these nancial statements. These nancial state-
ments were authorised for issue by Board of Directors on 17th May 2012.
The notes on pages 110 to 139 form an integral part of these nancial statements.
Managing Director
Date: 17th May 2012
Director/CEO
Chief Financial Ofcer
Watawala Plantations PLC
106
Financial Information
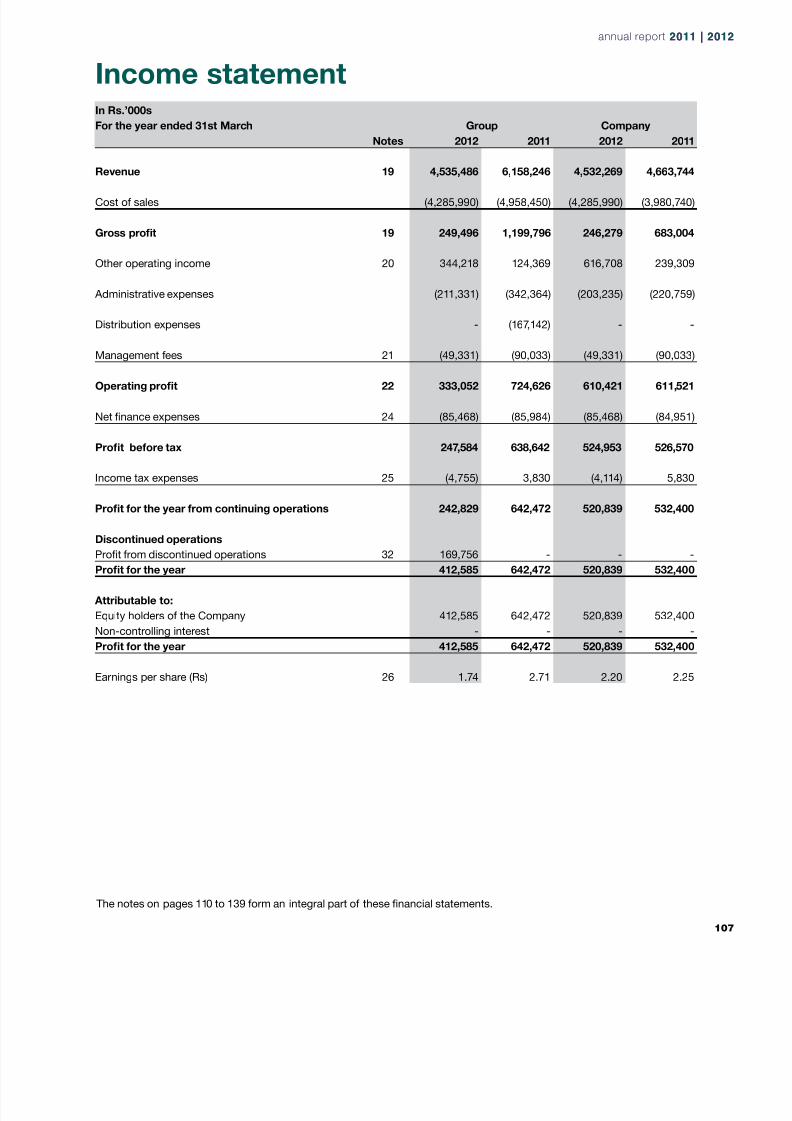
8/14/2019 Watawala Plantations 2011.2012.pdf
http://slidepdf.com/reader/full/watawala-plantations-20112012pdf 109/160
The notes on pages 110 to 139 form an integral part of these nancial statements.
Income statementIn Rs.’000s
For the year ended 31st March Group Company
Notes 2012 2011 2012 2011
Revenue 19 4,535,486 6,158,246 4,532,269 4,663,744
Cost of sales (4,285,990) (4,958,450) (4,285,990) (3,980,740)
Gross prot 19 249,496 1,199,796 246,279 683,004
Other operating income 20 344,218 124,369 616,708 239,309
Administrative expenses (211,331) (342,364) (203,235) (220,759)
Distribution expenses - (167,142) - -
Management fees 21 (49,331) (90,033) (49,331) (90,033)
Operating prot 22 333,052 724,626 610,421 611,521
Net nance expenses 24 (85,468) (85,984) (85,468) (84,951)
Prot before tax 247,584 638,642 524,953 526,570
Income tax expenses 25 (4,755) 3,830 (4,114) 5,830
Prot for the year from continuing operations 242,829 642,472 520,839 532,400
Discontinued operations
Prot from discontinued operations 32 169,756 - - -Prot for the year 412,585 642,472 520,839 532,400
Attributable to:
Equity holders of the Company 412,585 642,472 520,839 532,400
Non-controlling interest - - - -
Prot for the year 412,585 642,472 520,839 532,400
Earnings per share (Rs) 26 1.74 2.71 2.20 2.25
annual report 2011 | 20annual report 2011 | 20
1
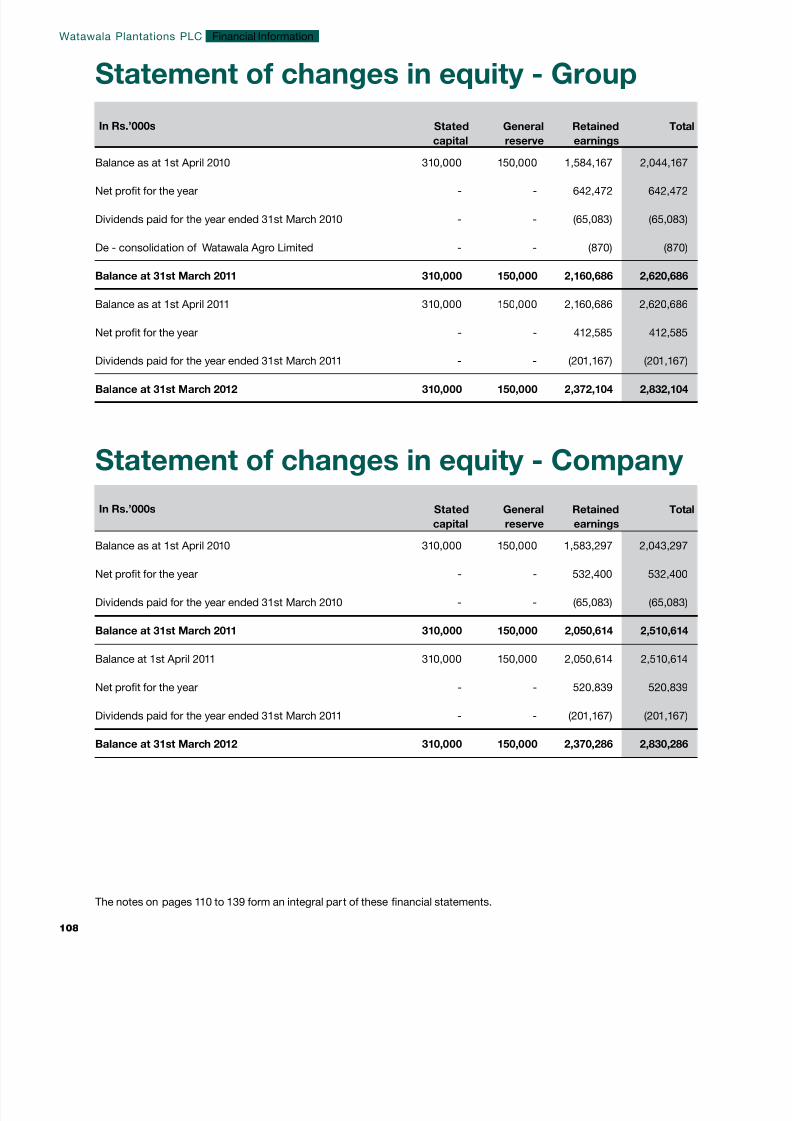
8/14/2019 Watawala Plantations 2011.2012.pdf
http://slidepdf.com/reader/full/watawala-plantations-20112012pdf 110/160
Statement of changes in equity - Group
Statement of changes in equity - Company
In Rs.’000s Stated
capital
General
reserve
Retained
earnings
Total
Balance as at 1st April 2010 310,000 150,000 1,583,297 2,043,297
Net prot for the year - - 532,400 532,400
Dividends paid for the year ended 31st March 2010 - - (65,083) (65,083)
Balance at 31st March 2011 310,000 150,000 2,050,614 2,510,614
Balance at 1st April 2011 310,000 150,000 2,050,614 2,510,614
Net prot for the year - - 520,839 520,839
Dividends paid for the year ended 31st March 2011 - - (201,167) (201,167)
Balance at 31st March 2012 310,000 150,000 2,370,286 2,830,286
In Rs.’000s Stated
capital
General
reserve
Retained
earnings
Total
Balance as at 1st April 2010 310,000 150,000 1,584,167 2,044,167
Net prot for the year - - 642,472 642,472
Dividends paid for the year ended 31st March 2010 - - (65,083) (65,083)
De - consolidation of Watawala Agro Limited - - (870) (870)
Balance at 31st March 2011 310,000 150,000 2,160,686 2,620,686
Balance as at 1st April 2011 310,000 150,000 2,160,686 2,620,686
Net prot for the year - - 412,585 412,585
Dividends paid for the year ended 31st March 2011 - - (201,167) (201,167)
Balance at 31st March 2012 310,000 150,000 2,372,104 2,832,104
The notes on pages 110 to 139 form an integral part of these nancial statements.
Watawala Plantations PLC
108
Financial Information

8/14/2019 Watawala Plantations 2011.2012.pdf
http://slidepdf.com/reader/full/watawala-plantations-20112012pdf 111/160
Cash ow statementIn Rs.’000s Group Company
For the year ended 31st March 2012 2011 2012 2011
Notes
Cash ows from operating activities
Cash generated from operations 30 630,936 856,487 565,362 981,602
Interest paid 24 (86,492) (86,317) (86,492) (85,227)
Tax paid - (23,511) - (23,511)
Retirement benet obligations paid 15 (93,653) (60,826) (93,653) (60,114)
Interest received 24 1,024 333 1,024 276
Net cash generated from operating activities 451,815 686,166 386,241 813,026
Investing activities
Grants received 16 - 38,554 - 38,554
Field development expenditure 6 (350,484) (317,363) (350,484) (317,363)
Purchase of property, plant and equipment 5 (222,808) (425,294) (222,808) (397,796)
Proceeds from sale of property, plant and equipment 43,422 9,348 43,422 186,275
Proceeds from disposal of subsidiary 20 ( c ) 741,595 - 741,595 -
Dividend received 20 - - 68,693 -
Investment in gratuity fund (42,641) - (42,641) -
Investment in subsidiaries 7 - - - (355,852)
Net cash ows from/(used in) investing activities 169,084 (694,755) 237,777 (846,182)
Financing activities
Dividends paid 27 (201,167) (65,083) (201,167) (65,083)
Proceeds from bank borrowings 13 186,909 626,920 186,909 626,924
Repayment of bank borrowings 13 (276,214) (671,755) (276,212) (671,755)
Repayment of lease principal 13 & 14 (18,308) (14,007) (18,308) (14,007)
Net cash ows from /(used in) nancing activities (308,780) (123,925) (308,778) (123,921)
Net increase/(decrease) in cash and cash equivalents 312,119 (132,514) 315,240 (157,077)
Movement in cash and cash equivalents
At the beginning of year (244,907) (112,393) (270,543) (113,466)
Increase/(decrease) 312,119 (132,514) 315,240 (157,077)
At end of year 10 67,212 (244,907) 44,697 (270,543)
The notes on pages 110 to 139 form an integral part of these nancial statements.
annual report 2011 | 20annual report 2011 | 20
1
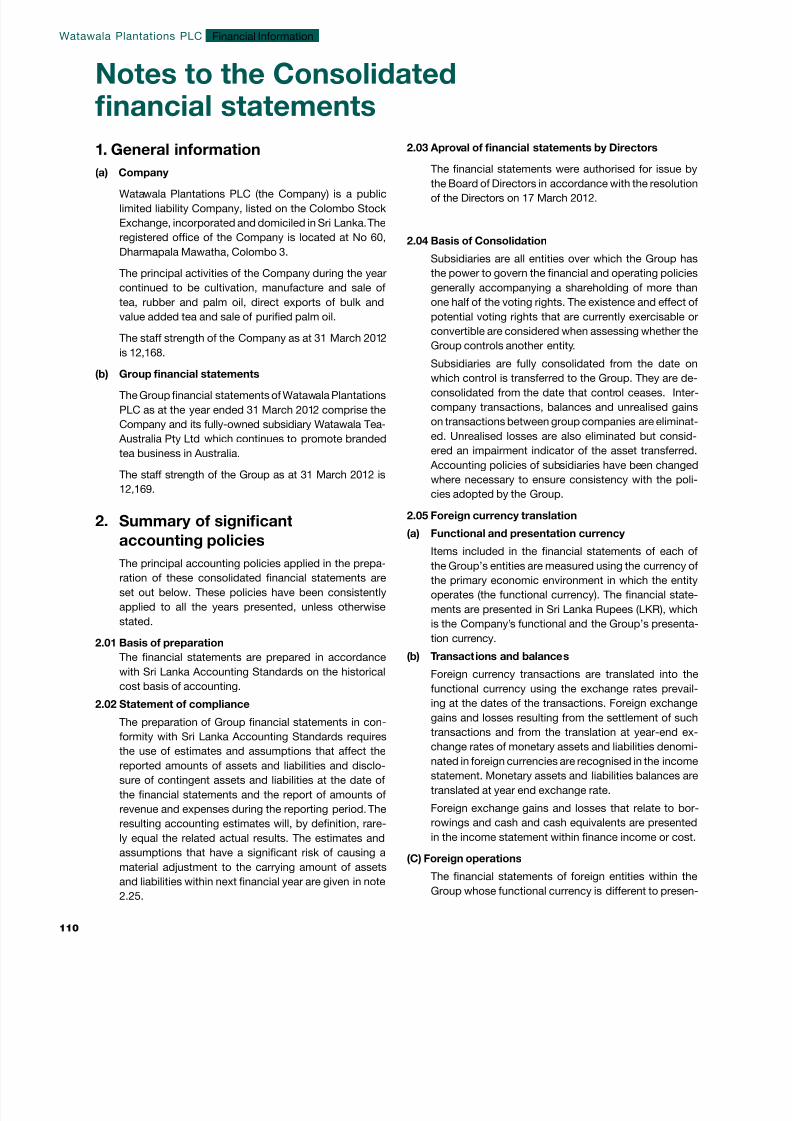
8/14/2019 Watawala Plantations 2011.2012.pdf
http://slidepdf.com/reader/full/watawala-plantations-20112012pdf 112/160
Notes to the Consolidatednancial statements
1. General information
(a) Company
Watawala Plantations PLC (the Company) is a public
limited liability Company, listed on the Colombo Stock
Exchange, incorporated and domiciled in Sri Lanka. The
registered ofce of the Company is located at No 60,
Dharmapala Mawatha, Colombo 3.
The principal activities of the Company during the year
continued to be cultivation, manufacture and sale of
tea, rubber and palm oil, direct exports of bulk and
value added tea and sale of puried palm oil.
The staff strength of the Company as at 31 March 2012
is 12,168.
(b) Group nancial statements
The Group nancial statements of Watawala Plantations
PLC as at the year ended 31 March 2012 comprise the
Company and its fully-owned subsidiary Watawala Tea-
Australia Pty Ltd which continues to promote branded
tea business in Australia.
The staff strength of the Group as at 31 March 2012 is
12,169.
2. Summary of signicant
accounting policies
The principal accounting policies applied in the prepa-
ration of these consolidated nancial statements are
set out below. These policies have been consistently
applied to all the years presented, unless otherwise
stated.
2.01 Basis of preparation
The nancial statements are prepared in accordance
with Sri Lanka Accounting Standards on the historical
cost basis of accounting.
2.02 Statement of compliance
The preparation of Group nancial statements in con-
formity with Sri Lanka Accounting Standards requiresthe use of estimates and assumptions that affect the
reported amounts of assets and liabilities and disclo-
sure of contingent assets and liabilities at the date of
the nancial statements and the report of amounts of
revenue and expenses during the reporting period. The
resulting accounting estimates will, by denition, rare-
ly equal the related actual results. The estimates and
assumptions that have a signicant risk of causing a
material adjustment to the carrying amount of assets
and liabilities within next nancial year are given in note
2.25.
2.03 Aproval of nancial statements by Directors
The nancial statements were authorised for issue by
the Board of Directors in accordance with the resolutionof the Directors on 17 March 2012.
2.04 Basis of Consolidation
Subsidiaries are all entities over which the Group has
the power to govern the nancial and operating policies
generally accompanying a shareholding of more than
one half of the voting rights. The existence and effect of
potential voting rights that are currently exercisable or
convertible are considered when assessing whether the
Group controls another entity.
Subsidiaries are fully consolidated from the date onwhich control is transferred to the Group. They are de-
consolidated from the date that control ceases. Inter-
company transactions, balances and unrealised gains
on transactions between group companies are eliminat-
ed. Unrealised losses are also eliminated but consid-
ered an impairment indicator of the asset transferred.
Accounting policies of subsidiaries have been changed
where necessary to ensure consistency with the poli-
cies adopted by the Group.
2.05 Foreign currency translation
(a) Functional and presentation currency
Items included in the nancial statements of each ofthe Group’s entities are measured using the currency of
the primary economic environment in which the entity
operates (the functional currency). The nancial state-
ments are presented in Sri Lanka Rupees (LKR), which
is the Company’s functional and the Group’s presenta-
tion currency.
(b) Transactions and balances
Foreign currency transactions are translated into the
functional currency using the exchange rates prevail-
ing at the dates of the transactions. Foreign exchange
gains and losses resulting from the settlement of such
transactions and from the translation at year-end ex-
change rates of monetary assets and liabilities denomi-
nated in foreign currencies are recognised in the income
statement. Monetary assets and liabilities balances are
translated at year end exchange rate.
Foreign exchange gains and losses that relate to bor-
rowings and cash and cash equivalents are presented
in the income statement within nance income or cost.
(C) Foreign operations
The nancial statements of foreign entities within the
Group whose functional currency is different to presen-
Watawala Plantations PLC
110
Financial Information
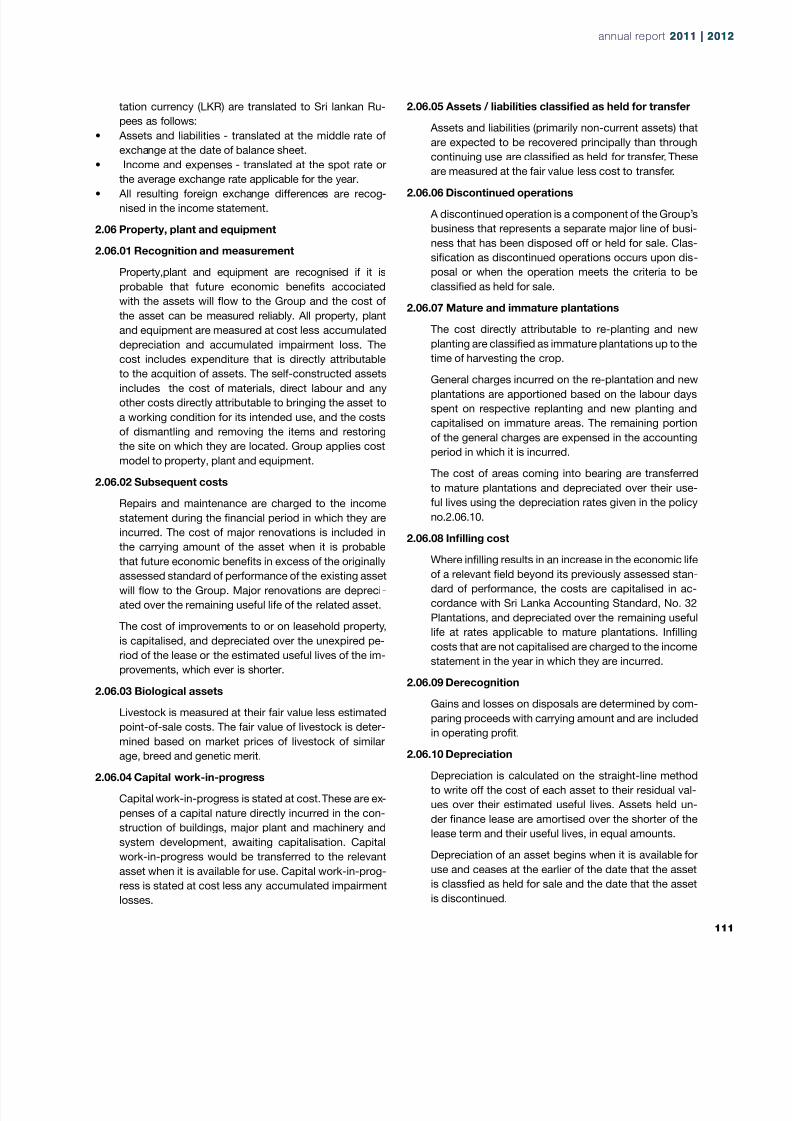
8/14/2019 Watawala Plantations 2011.2012.pdf
http://slidepdf.com/reader/full/watawala-plantations-20112012pdf 113/160
tation currency (LKR) are translated to Sri lankan Ru-
pees as follows:
• Assets and liabilities - translated at the middle rate of
exchange at the date of balance sheet.
• Income and expenses - translated at the spot rate or
the average exchange rate applicable for the year.• All resulting foreign exchange differences are recog-
nised in the income statement.
2.06 Property, plant and equipment
2.06.01 Recognition and measurement
Property,plant and equipment are recognised if it is
probable that future economic benets accociated
with the assets will ow to the Group and the cost of
the asset can be measured reliably. All property, plant
and equipment are measured at cost less accumulated
depreciation and accumulated impairment loss. The
cost includes expenditure that is directly attributable
to the acquition of assets. The self-constructed assets
includes the cost of materials, direct labour and any
other costs directly attributable to bringing the asset to
a working condition for its intended use, and the costs
of dismantling and removing the items and restoring
the site on which they are located. Group applies cost
model to property, plant and equipment.
2.06.02 Subsequent costs
Repairs and maintenance are charged to the income
statement during the nancial period in which they are
incurred. The cost of major renovations is included in
the carrying amount of the asset when it is probable
that future economic benets in excess of the originally
assessed standard of performance of the existing asset
will ow to the Group. Major renovations are depreci-
ated over the remaining useful life of the related asset.
The cost of improvements to or on leasehold property,
is capitalised, and depreciated over the unexpired pe-
riod of the lease or the estimated useful lives of the im-
provements, which ever is shorter.
2.06.03 Biological assets
Livestock is measured at their fair value less estimated
point-of-sale costs. The fair value of livestock is deter-
mined based on market prices of livestock of similar
age, breed and genetic merit.
2.06.04 Capital work-in-progress
Capital work-in-progress is stated at cost. These are ex-
penses of a capital nature directly incurred in the con-
struction of buildings, major plant and machinery and
system development, awaiting capitalisation. Capital
work-in-progress would be transferred to the relevant
asset when it is available for use. Capital work-in-prog-
ress is stated at cost less any accumulated impairment
losses.
2.06.05 Assets / liabilities classied as held for transfer
Assets and liabilities (primarily non-current assets) that
are expected to be recovered principally than through
continuing use are classied as held for transfer. These
are measured at the fair value less cost to transfer.
2.06.06 Discontinued operations
A discontinued operation is a component of the Group’s
business that represents a separate major line of busi-
ness that has been disposed off or held for sale. Clas-
sication as discontinued operations occurs upon dis-
posal or when the operation meets the criteria to be
classied as held for sale.
2.06.07 Mature and immature plantations
The cost directly attributable to re-planting and new
planting are classied as immature plantations up to the
time of harvesting the crop.
General charges incurred on the re-plantation and new
plantations are apportioned based on the labour days
spent on respective replanting and new planting and
capitalised on immature areas. The remaining portion
of the general charges are expensed in the accounting
period in which it is incurred.
The cost of areas coming into bearing are transferred
to mature plantations and depreciated over their use-
ful lives using the depreciation rates given in the policy
no.2.06.10.
2.06.08 Inlling cost
Where inlling results in an increase in the economic life
of a relevant eld beyond its previously assessed stan-
dard of performance, the costs are capitalised in ac-
cordance with Sri Lanka Accounting Standard, No. 32
Plantations, and depreciated over the remaining useful
life at rates applicable to mature plantations. Inlling
costs that are not capitalised are charged to the income
statement in the year in which they are incurred.
2.06.09 Derecognition
Gains and losses on disposals are determined by com-
paring proceeds with carrying amount and are included
in operating prot.2.06.10 Depreciation
Depreciation is calculated on the straight-line method
to write off the cost of each asset to their residual val-
ues over their estimated useful lives. Assets held un-
der nance lease are amortised over the shorter of the
lease term and their useful lives, in equal amounts.
Depreciation of an asset begins when it is available for
use and ceases at the earlier of the date that the asset
is classed as held for sale and the date that the asset
is discontinued.
annual report 2011 | 20annual report 2011 | 20
1
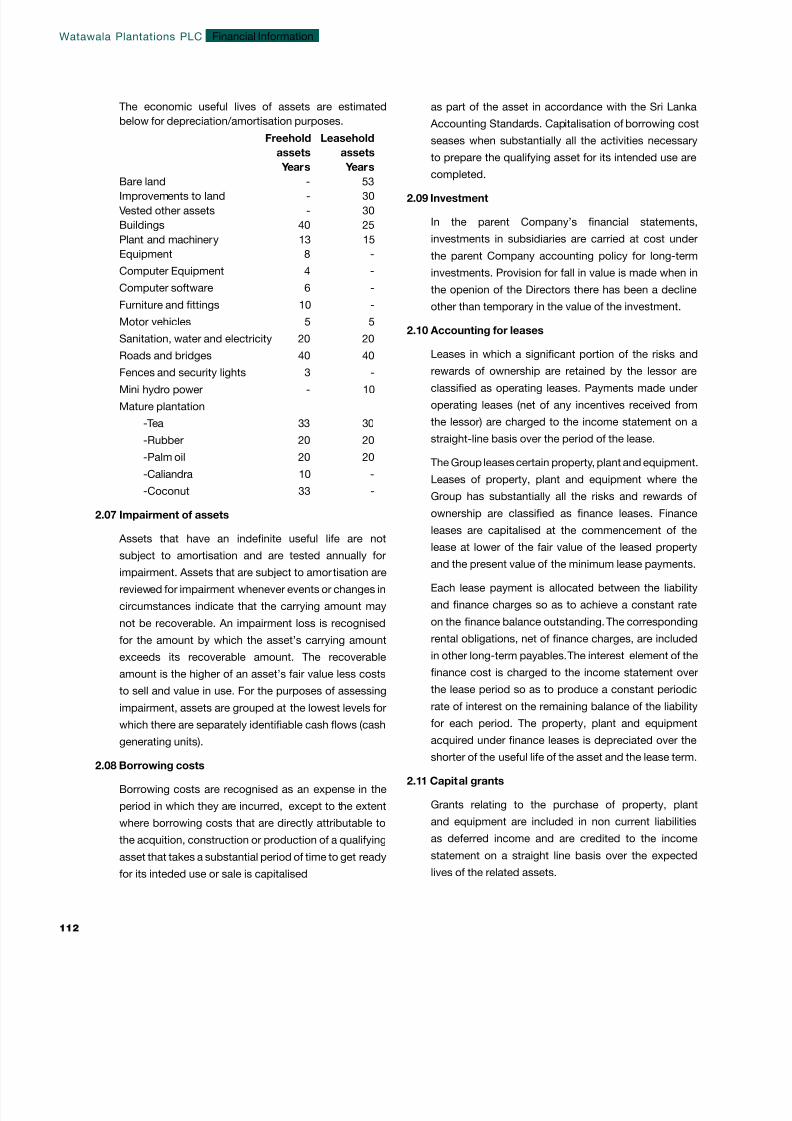
8/14/2019 Watawala Plantations 2011.2012.pdf
http://slidepdf.com/reader/full/watawala-plantations-20112012pdf 114/160
The economic useful lives of assets are estimated
below for depreciation/amortisation purposes.
Freehold Leasehold
assets assets
Years Years
Bare land - 53 Improvements to land - 30
Vested other assets - 30
Buildings 40 25
Plant and machinery 13 15
Equipment 8 -
Computer Equipment 4 -
Computer software 6 -
Furniture and ttings 10 -
Motor vehicles 5 5
Sanitation, water and electricity 20 20
Roads and bridges 40 40
Fences and security lights 3 -
Mini hydro power - 10
Mature plantation
-Tea 33 30
-Rubber 20 20
-Palm oil 20 20
-Caliandra 10 -
-Coconut 33 -
2.07 Impairment of assets
Assets that have an indenite useful life are not
subject to amortisation and are tested annually for
impairment. Assets that are subject to amortisation are
reviewed for impairment whenever events or changes in
circumstances indicate that the carrying amount may
not be recoverable. An impairment loss is recognised
for the amount by which the asset’s carrying amount
exceeds its recoverable amount. The recoverable
amount is the higher of an asset’s fair value less costs
to sell and value in use. For the purposes of assessing
impairment, assets are grouped at the lowest levels for
which there are separately identiable cash ows (cash
generating units).
2.08 Borrowing costs
Borrowing costs are recognised as an expense in the
period in which they are incurred, except to the extent
where borrowing costs that are directly attributable to
the acquition, construction or production of a qualifying
asset that takes a substantial period of time to get ready
for its inteded use or sale is capitalised
as part of the asset in accordance with the Sri Lanka
Accounting Standards. Capitalisation of borrowing cost
seases when substantially all the activities necessary
to prepare the qualifying asset for its intended use are
completed.
2.09 Investment
In the parent Company’s nancial statements,
investments in subsidiaries are carried at cost under
the parent Company accounting policy for long-term
investments. Provision for fall in value is made when in
the openion of the Directors there has been a decline
other than temporary in the value of the investment.
2.10 Accounting for leases
Leases in which a signicant portion of the risks and
rewards of ownership are retained by the lessor are
classied as operating leases. Payments made under
operating leases (net of any incentives received from
the lessor) are charged to the income statement on a
straight-line basis over the period of the lease.
The Group leases certain property, plant and equipment.
Leases of property, plant and equipment where the
Group has substantially all the risks and rewards of
ownership are classied as nance leases. Finance
leases are capitalised at the commencement of the
lease at lower of the fair value of the leased property
and the present value of the minimum lease payments.
Each lease payment is allocated between the liability
and nance charges so as to achieve a constant rate
on the nance balance outstanding. The corresponding
rental obligations, net of nance charges, are included
in other long-term payables. The interest element of the
nance cost is charged to the income statement over
the lease period so as to produce a constant periodic
rate of interest on the remaining balance of the liability
for each period. The property, plant and equipment
acquired under nance leases is depreciated over the
shorter of the useful life of the asset and the lease term.
2.11 Capital grants
Grants relating to the purchase of property, plant
and equipment are included in non current liabilities
as deferred income and are credited to the income
statement on a straight line basis over the expected
lives of the related assets.
Watawala Plantations PLC
112
Financial Information
8/14/2019 Watawala Plantations 2011.2012.pdf
http://slidepdf.com/reader/full/watawala-plantations-20112012pdf 115/160
2.12 Inventories
Inventories other than produce stock and nurseries are
stated at lower of cost and net realisable value. Net
realisable value is the price at which inventories can be
sold in the ordinary course of business.
The Group has valued unsold produce stock
(tea,rubber,palm oil) at since realised prices. The
balance unsold stock remained as at the balance sheet
date valued at an estimated selling prices based on
most recent selling prices available subsequent to the
year end.
Nurseries are valued at the cost of direct materials,
direct labour and an appropriate proportion of other
directly attributable overheads or the net realisable
value whichever is lower.
2.13 Trade receivables
Trade receivables are carried at anticipated realisable
value. A provision for impairment of trade receivables
is established when there is objective evidence that
the Group will not be able to collect all amounts due
according to the original terms of the receivables.
Signicant nancial difculties of the debtor, probability
that the debtor will enter bankruptcy or nancial
reorganisation and default payments are considered
indicators that the trade receivable is impaired. The
carrying amount of the asset is reduced through the use
of an allowance account, and the amount of the loss is
recognised in the income statement within distribution
cost. When a trade receivable is uncollectible, it is written
off against the allowance account for trade receivable.
Subsequent recoveries of amounts previously written-
off are credited against distribution cost in the income
statement.
2.14 Cash and cash equivalents
For the purposes of the cash ow statement, cash and
cash equivalents comprise cash in hand, deposits held
at call with banks, net of bank overdrafts. In the balance
sheet, bank overdrafts are included in borrowings under
current liabilities.
2.15 Stated Capital
Ordinary shares are classied as stated capital. The
details are given in note 11.
2.16 Liabilities and provisions
Liabilities classied as current liabilities in the balance
sheet are those which fall due for payment on demand
or within one year from the reporting date. Non-current
liabilities that fall due for payment later than one yearfrom the reporting date.
Provisions are recognised when the Group has a
present legal or constructive obligation as a result of
past events, it is probable that an outow of resources
embodying economic benets will be required to settle
the obligation, and a reliable estimate of the amount of
the obligation can be measured reliably.
All known liabilities and provisions have been accounted
for in preparing the nancial statements.
Trade payables are recognised initially at cost.
2.17 Employee retirement benets
2.17.01 Dened contribution plans
Dened contribution plan is a post employment plan
under which an entity pays xed contribution into a
separate entity and will have no legal or constructive
obligation to pay a further amount. Obligations
for contributions to dened contribution plans are
recognised as an expense in the income statement as
and when they are due.
a) Employees’ Providend Fund
Estate Staff Provident Society
Ceylon Planters’ Provident Fund
All employees of the Group are members of the
Employees’ Provident Fund or the Estate Staff Provident
Society or Ceylon Planters’ Provident Fund to which the
Group contributes 12% of the salary of each employee.
(b) Employees’ Trust Fund
The Group contributes 3% of the salary of each
employee.
2.17.02 Dened benet plan - retiring gratuity
Dened benet plans dene an amount of benet
that an employee will receive on retirement, usually
dependent on one or more factors such as age, years
of service and compensation.
The Group has adopted the benet plan as required
under the Payment of Gratuity Act No. 12 of 1983 for all
annual report 2011 | 20annual report 2011 | 20
1
8/14/2019 Watawala Plantations 2011.2012.pdf
http://slidepdf.com/reader/full/watawala-plantations-20112012pdf 116/160
2.17.02 Dened benet plan - retiring gratuity (Cont.)
eligible employees. The benet plan is patially funded.
Provision for gratuity is made by the Group taking
account of the recommendation of an independent
qualied actuaries rm, Messrs Actuarial & ManagementConsultants (Private) Limited.
The liability recognized in the balance sheet in respect of
dened benet plans is the present value of the dened
benet obligation at the balance sheet date together
with adjustments for unrecognized past service cost.
The dened benet obligation is calculated annually by
the Company using the projected unit credit method
prescribed in Sri Lanka Accounting Standard 16;
Employee Benets. The present value of the dened
benet obligation is determined by discounting the
estimated future cash ows using the interest rates
of Government bonds that are denominated in the
currency in which the benets will be paid, and that
have terms to maturity approximating to the terms of
the related pension liability.
Gains and losses arising from experience adjustments
and changes in actuarial assumptions are charged or
credited to income statement in the period in which
they arise.
Past service costs are recognized immediately in
income statement, unless the changes to the plan are
conditional on the employees remaining in service for a
specic period of time (the vesting period). In this case,
the past service costs are amortised on a straight-line
basis over the vesting period.
Under the Payment of Gratuity Act No.12 of 1983, the
liability to an employee arises only on completion of 5
years of continued service.
2.17.03 Gratuity investment fund
The Board of Directors has decided to fund the
gratutity liability proportionately based on the Group’s
performance each year.
2.18 Income tax
The tax expense for the period comprises current
and deferred tax. Tax is recognised in the income statement,
except to the extent that it relates to items recognised in
other comprehensive income or directly in equity. In this case
the tax is also recognised in other comprehensive income or
directly in equity, respectively.
2.18.01 Current income tax
The current income tax charge is calculated on
the basis of the tax laws enacted or substantively
enacted by end of the reporting period in the countries
where the Company and subsidiaries operate andgenerate taxable income. Management periodically
evaluates positions taken in tax returns with respect to
situations in which applicable tax regulation is subject
to interpretation. It establishes provisions where
appropriate on the basis of amounts expected to be
paid to the tax authorities.
2.18.02 Deferred tax
Deferred income tax is recognised, using the liability
method, on temporary differences arising between the
tax bases of assets and liabilities and their carryingamounts in the consolidated nancial statements.
However, the deferred income tax is not accounted for
if it arises from initial recognition of an asset or liability
in a transaction other than a business combination
that at the time of the transaction affects neither
accounting nor taxable prot or loss. Deferred income
tax is determined using tax rates (and laws) that have
been enacted or substantially enacted by the end of
reporting period and are expected to apply when the
related deferred income tax asset is realised or the
deferred income tax liability is settled.
Deferred income tax assets are recognised only to the
extent that it is probable that future taxable prot will be
available against which the temporary differences can
be utilised.
Deferred income tax assets and liabilities are offset
when there is a legally enforceable right to offset current
tax assets against current tax liabilities and when the
deferred income taxes assets and liabilities relate to
income taxes levied by the same taxation authority
on either the taxable entity or different taxable entities
where there is an intention to settle the balances on a
net basis.
2.19 Revenue recognition
The Group has adopted following policies and methods
to determine the point in time at which the entity
transfers the signicant risks and rewards of ownership
of goods and to determine the stage of completion of
the service.
Watawala Plantations PLC
114
Financial Information
8/14/2019 Watawala Plantations 2011.2012.pdf
http://slidepdf.com/reader/full/watawala-plantations-20112012pdf 117/160
2.19.01 Perennial crops
Revenue and prot or losses on perennial crops are
recognised in the year of harvesting. Revenue comprises
the invoiced value of sales, net of brokerage, public sale
expenses, and other levies related to turnover.
a) Sale of tea at auction
As per the Tea By-Laws & Conditions issued by the
Ceylon Tea Traders’ Association (Section 17) the highest
bidder(buyer) is accepted and a sale shall be completed
at the fall of the hammer. The sale is valued at the price
and quantity agreed upon and raising the Sale Note.
b) Sale of rubber at auction
As per the Rubber By-Laws & Conditions issued by
the Colombo Rubber Traders’ Association the highest
bidder(buyer) is accepted and a sale shall be completed
at the fall of the hammer. The sale is valued at the price
and quantity agreed upon and raising the Sale Note.
c) Sale of palm oil
The revenue is recognised when the cash is received
and the oil is ready for delivery to the buyer. Usaully,
buyer arranges the transport while acknowledging the
quantity.
2.19.02 Other income
Other income is recognised on an accruel basis.
2.19.03 Prot/loss from disposal of property,plant and
equipment
Prot/loss from sale of property,plant and equipment is
recognised in the period in which the sale occures and
the delivery order is issued.
2.19.04 Income on harvesting of matured trees (as part
of reforestation program)
Income is recognised when the cash is received and the
delivery order is issued.
2.19.05 Interest income
Interest income is recognised on an accruel basis.
2.19.06 Dividend income
Dividend income is recognised in the income statement
on an accruel basis when the Group’s right to receive
the dividend is established.
2.20 Segment information
The segmental information has been prepared in
accordance with the “management approach”, which
requires presentation of the segments on the basis of
the internal reports about components of the entitywhich are regularly reviewed by the chief operating
decision maker in order to allocate resources to a
segment and to assess its performance.
The Group comprises the following major business
segments.
Tea
Rubber
Palm oil
Exports
Measurement of segment assets,liabilities ,segmentrevenue and results is based on the accounting policies
set out above. Segment expenses are expenses that are
directly attributed to a segment or a relevant portion of
expenses that can be allocated on a reasonable basis
as determined by the management. Inter-segment
pricing is determined on an arms length basis based
on fair market prices. Considering the activities of the
operations, segment information based on geographical
segments does not arise.
The segments information is given in the note 19 to the
nancial statements.
2.21 Commitments and contingencies
Contingencies are possible assets or obligations that
arise from a past event and would be conrmed only on
the occurrence or non-occurrence of uncertain future
events, which are beyond the control of Group.
Contingent liabilities are not recognised, instead,
disclose the existence of contingent liability,unless the
possibility of payment is remote, as set out in note 28
and 29.
2.22 Events after the reporting period
Events after the reporting period are events, favourable
and unfavourable, that occur between the end of
the reporting period and the date when the nancial
statements are authorised for issue as given in note 33.
2.23 Dividends
If the dividends are declared after the reporting period
but before the nancial statements are authorised for
annual report 2011 | 20annual report 2011 | 20
1

8/14/2019 Watawala Plantations 2011.2012.pdf
http://slidepdf.com/reader/full/watawala-plantations-20112012pdf 118/160
issue, the dividends are not recognised as a liability
at the end of the reporting period. The provision for
dividends is recognised at the time the dividend
recommended and declared by the Board of Directors
is aproved by the Shareholders. The details of dividends
are detailed in note 27.
2.24 Comparatives
Where necessary, comparative gures have been
adjusted to conform with changes in presentation in the
current year.
2.25 Critical accounting estimates and judgements
a) Income taxes
The Group is subject to income taxes in numerous
jurisdictions. Signicant judgement is required in
determining the worldwide provision for income taxes.
There are many transactions and calculations for which
the ultimate tax determination is uncertain. The group
recognises liabilities for anticipated tax audit issues
based on estimates of whether additional taxes will be
due. Where the nal tax outcome of these matters is
different from the amounts that were initially recorded,
such differences will impact the current and deferred
income tax assets and liabilities in the period in which
such determination is made.
b)Pension benets - gratuity
The present value of the pension obligations depends
on a number of factors that are determined on an
actuarial basis using a number of assumptions. The
assumptions used in determining the net cost (income)for pensions include the discount rate. Any changes in
these assumptions will impact the carrying amount of
pension obligations.
The Group determines the appropriate discount rate at
the end of each year. This is the interest rate that should
be used to determine the present value of estimated
future cash outows expected to be required to settle
the pension obligations. In determining the appropriate
discount rate, the group considers the interest rates of
high-quality corporate bonds that are denominated in
the currency in which the benets will be paid, and that
have terms to maturity approximating the terms of the
related pension liability.
Other key assumptions for pension obligations are
based in part on current market conditions.
3. Leasehold right to bare land of JEDB/SLSPC estates
In Rs.’000s Group Company
2012 2011 2012 2011
Revaluation as at 18 June 1992 372,840 372,840 372,840 372,840
Cost
At the 31st March 372,840 372,840 372,840 372,840
Accumulated amortization
At the 31st March 132,157 125,122 132,157 125,122
Amortization for the year 7,035 7,035 7,035 7,035
At the 31st March 139,192 132,157 139,192 132,157
Carrying value
As at 31st March 233,648 240,683 233,648 240,683
Watawala Plantations PLC
116
Financial Information
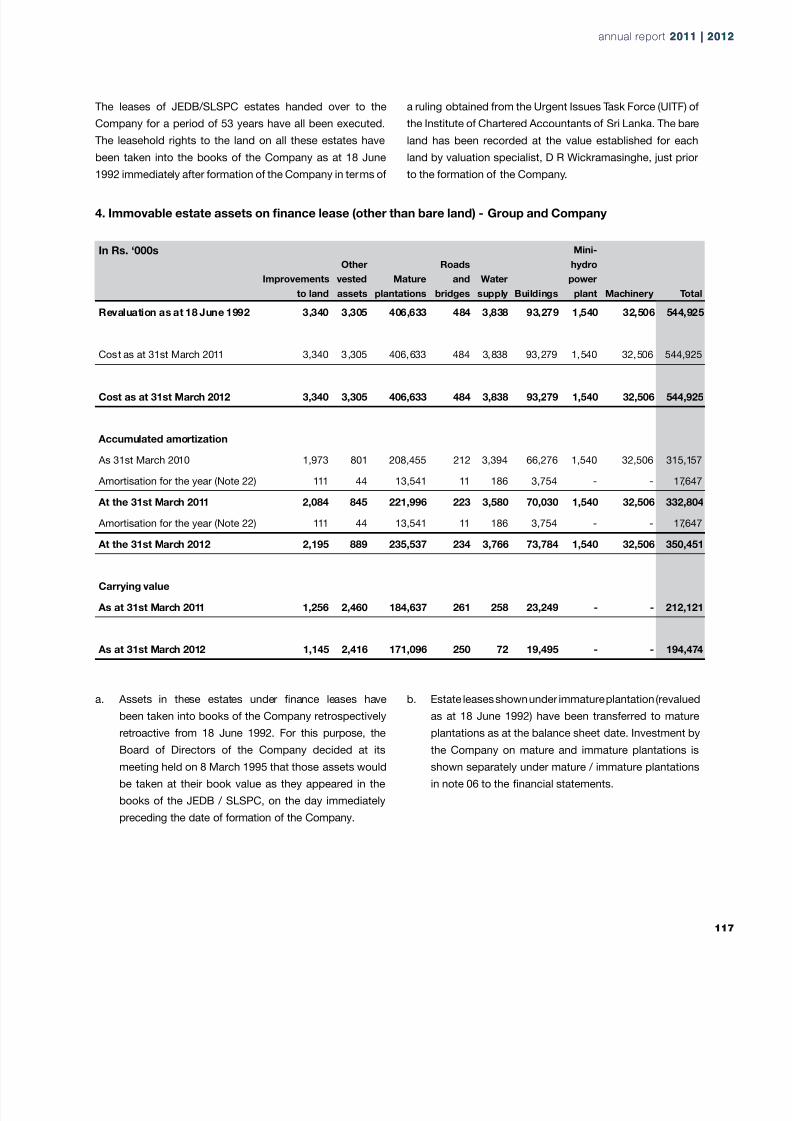
8/14/2019 Watawala Plantations 2011.2012.pdf
http://slidepdf.com/reader/full/watawala-plantations-20112012pdf 119/160
4. Immovable estate assets on nance lease (other than bare land) - Group and Company
The leases of JEDB/SLSPC estates handed over to the
Company for a period of 53 years have all been executed.
The leasehold rights to the land on all these estates have
been taken into the books of the Company as at 18 June
1992 immediately after formation of the Company in terms of
a ruling obtained from the Urgent Issues Task Force (UITF) of
the Institute of Chartered Accountants of Sri Lanka. The bare
land has been recorded at the value established for each
land by valuation specialist, D R Wickramasinghe, just prior
to the formation of the Company.
a. Assets in these estates under nance leases have
been taken into books of the Company retrospectively
retroactive from 18 June 1992. For this purpose, theBoard of Directors of the Company decided at its
meeting held on 8 March 1995 that those assets would
be taken at their book value as they appeared in the
books of the JEDB / SLSPC, on the day immediately
preceding the date of formation of the Company.
b. Estate leases shown under immature plantation (revalued
as at 18 June 1992) have been transferred to mature
plantations as at the balance sheet date. Investment bythe Company on mature and immature plantations is
shown separately under mature / immature plantations
in note 06 to the nancial statements.
In Rs. ‘000s
Improvements
to land
Other
vested
assets
Mature
plantations
Roads
and
bridges
Water
supply Buildings
Mini-
hydro
power
plant Machinery Total
Revaluation as at 18 June 1992 3,340 3,305 406,633 484 3,838 93,279 1,540 32,506 544,925
Cost as at 31st March 2011 3,340 3,305 406,633 484 3,838 93,279 1,540 32,506 544,925
Cost as at 31st March 2012 3,340 3,305 406,633 484 3,838 93,279 1,540 32,506 544,925
Accumulated amortization
As 31st March 2010 1,973 801 208,455 212 3,394 66,276 1,540 32,506 315,157
Amortisation for the year (Note 22) 111 44 13,541 11 186 3,754 - - 17,647
At the 31st March 2011 2,084 845 221,996 223 3,580 70,030 1,540 32,506 332,804
Amortisation for the year (Note 22) 111 44 13,541 11 186 3,754 - - 17,647
At the 31st March 2012 2,195 889 235,537 234 3,766 73,784 1,540 32,506 350,451
Carrying value
As at 31st March 2011 1,256 2,460 184,637 261 258 23,249 - - 212,121
As at 31st March 2012 1,145 2,416 171,096 250 72 19,495 - - 194,474
annual report 2011 | 20annual report 2011 | 20
1
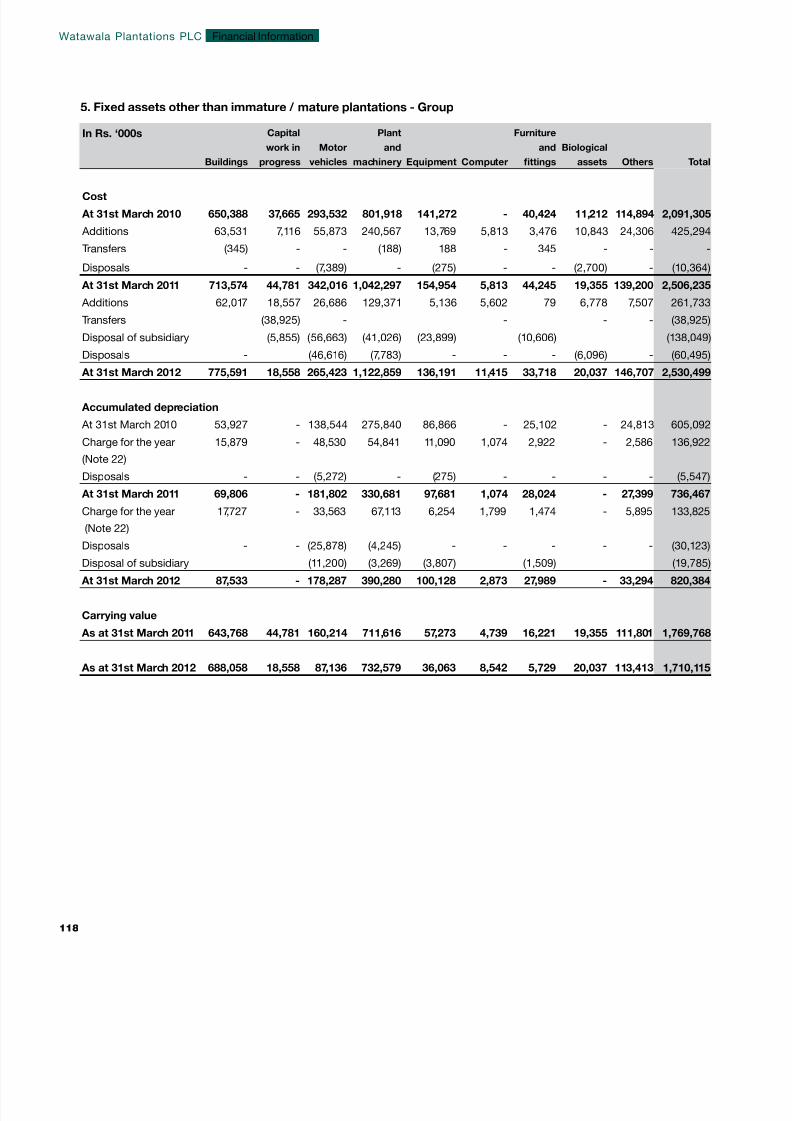
8/14/2019 Watawala Plantations 2011.2012.pdf
http://slidepdf.com/reader/full/watawala-plantations-20112012pdf 120/160
5. Fixed assets other than immature / mature plantations - Group
In Rs. ‘000s
Buildings
Capital
work in
progress
Motor
vehicles
Plant
and
machinery Equipment Computer
Furniture
and
ttings
Biological
assets Others Total
Cost
At 31st March 2010 650,388 37,665 293,532 801,918 141,272 - 40,424 11,212 114,894 2,091,305
Additions 63,531 7,116 55,873 240,567 13,769 5,813 3,476 10,843 24,306 425,294
Transfers (345) - - (188) 188 - 345 - - -
Disposals - - (7,389) - (275) - - (2,700) - (10,364)
At 31st March 2011 713,574 44,781 342,016 1,042,297 154,954 5,813 44,245 19,355 139,200 2,506,235
Additions 62,017 18,557 26,686 129,371 5,136 5,602 79 6,778 7,507 261,733
Transfers (38,925) - - - - (38,925)
Disposal of subsidiary (5,855) (56,663) (41,026) (23,899) (10,606) (138,049)
Disposals - (46,616) (7,783) - - - (6,096) - (60,495)
At 31st March 2012 775,591 18,558 265,423 1,122,859 136,191 11,415 33,718 20,037 146,707 2,530,499
Accumulated depreciation
At 31st March 2010 53,927 - 138,544 275,840 86,866 - 25,102 - 24,813 605,092
Charge for the year
(Note 22)
15,879 - 48,530 54,841 11,090 1,074 2,922 - 2,586 136,922
Disposals - - (5,272) - (275) - - - - (5,547)
At 31st March 2011 69,806 - 181,802 330,681 97,681 1,074 28,024 - 27,399 736,467
Charge for the year
(Note 22)
17,727 - 33,563 67,113 6,254 1,799 1,474 - 5,895 133,825
Disposals - - (25,878) (4,245) - - - - - (30,123)
Disposal of subsidiary (11,200) (3,269) (3,807) (1,509) (19,785)
At 31st March 2012 87,533 - 178,287 390,280 100,128 2,873 27,989 - 33,294 820,384
Carrying value
As at 31st March 2011 643,768 44,781 160,214 711,616 57,273 4,739 16,221 19,355 111,801 1,769,768
As at 31st March 2012 688,058 18,558 87,136 732,579 36,063 8,542 5,729 20,037 113,413 1,710,115
Watawala Plantations PLC
118
Financial Information
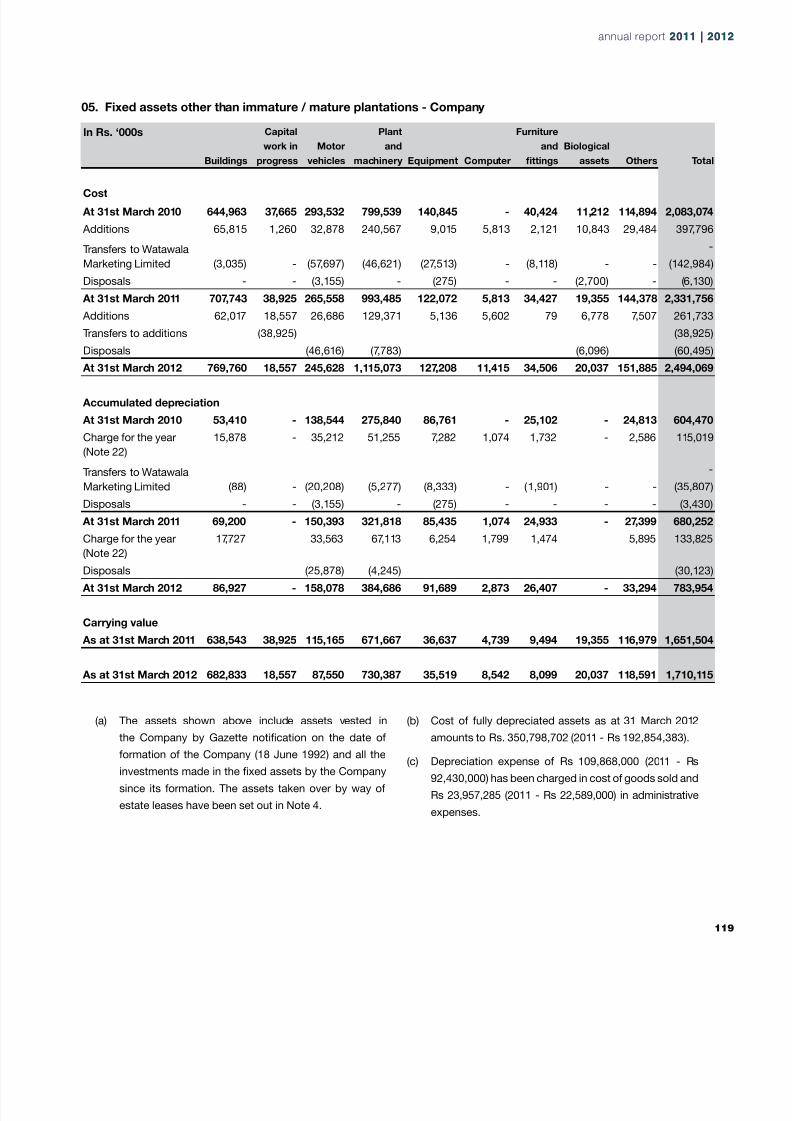
8/14/2019 Watawala Plantations 2011.2012.pdf
http://slidepdf.com/reader/full/watawala-plantations-20112012pdf 121/160
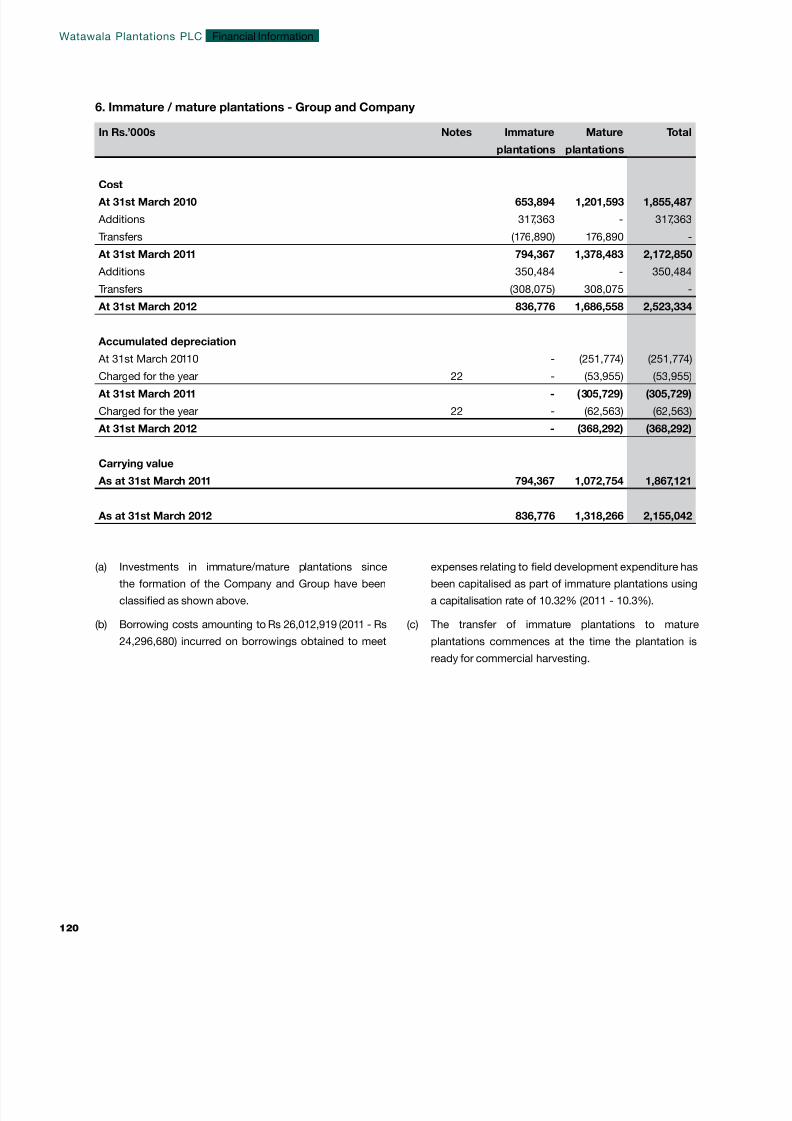
8/14/2019 Watawala Plantations 2011.2012.pdf
http://slidepdf.com/reader/full/watawala-plantations-20112012pdf 122/160
6. Immature / mature plantations - Group and Company
(a) Investments in immature/mature plantations since
the formation of the Company and Group have been
classied as shown above.
(b) Borrowing costs amounting to Rs 26,012,919 (2011 - Rs
24,296,680) incurred on borrowings obtained to meet
expenses relating to eld development expenditure has
been capitalised as part of immature plantations using
a capitalisation rate of 10.32% (2011 - 10.3%).
(c) The transfer of immature plantations to mature
plantations commences at the time the plantation is
ready for commercial harvesting.
In Rs.’000s Notes Immature Mature Total
plantations plantations
Cost
At 31st March 2010 653,894 1,201,593 1,855,487
Additions 317,363 - 317,363
Transfers (176,890) 176,890 -
At 31st March 2011 794,367 1,378,483 2,172,850
Additions 350,484 - 350,484
Transfers (308,075) 308,075 -
At 31st March 2012 836,776 1,686,558 2,523,334
Accumulated depreciation
At 31st March 20110 - (251,774) (251,774)
Charged for the year 22 - (53,955) (53,955)
At 31st March 2011 - (305,729) (305,729)
Charged for the year 22 - (62,563) (62,563)
At 31st March 2012 - (368,292) (368,292)
Carrying value
As at 31st March 2011 794,367 1,072,754 1,867,121
As at 31st March 2012 836,776 1,318,266 2,155,042
Watawala Plantations PLC
120
Financial Information
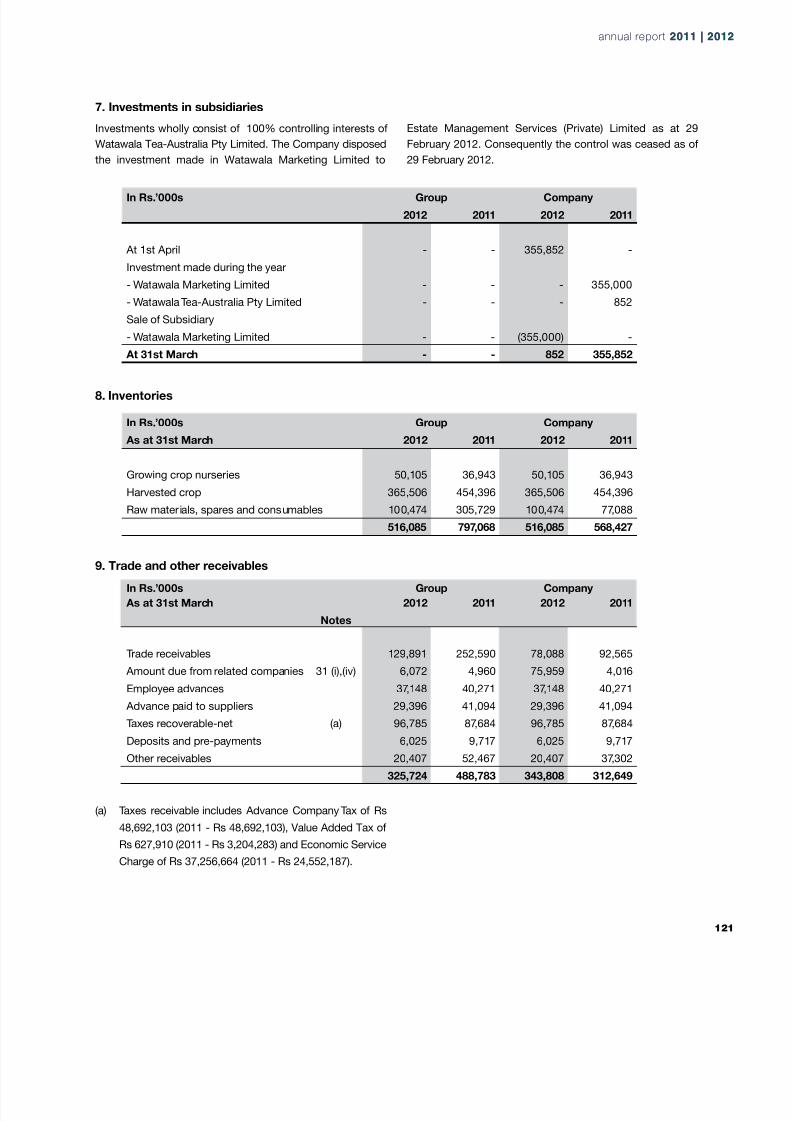
8/14/2019 Watawala Plantations 2011.2012.pdf
http://slidepdf.com/reader/full/watawala-plantations-20112012pdf 123/160
7. Investments in subsidiaries
8. Inventories
9. Trade and other receivables
Investments wholly consist of 100% controlling interests of
Watawala Tea-Australia Pty Limited. The Company disposed
the investment made in Watawala Marketing Limited to
Estate Management Services (Private) Limited as at 29
February 2012. Consequently the control was ceased as of
29 February 2012.
In Rs.’000s Group Company
2012 2011 2012 2011
At 1st April - - 355,852 -
Investment made during the year
- Watawala Marketing Limited - - - 355,000
- Watawala Tea-Australia Pty Limited - - - 852
Sale of Subsidiary
- Watawala Marketing Limited - - (355,000) -
At 31st March - - 852 355,852
In Rs.’000s Group Company
As at 31st March 2012 2011 2012 2011
Growing crop nurseries 50,105 36,943 50,105 36,943
Harvested crop 365,506 454,396 365,506 454,396
Raw materials, spares and consumables 100,474 305,729 100,474 77,088
516,085 797,068 516,085 568,427
In Rs.’000s Group Company
As at 31st March 2012 2011 2012 2011
Notes
Trade receivables 129,891 252,590 78,088 92,565
Amount due from related companies 31 (i),(iv) 6,072 4,960 75,959 4,016
Employee advances 37,148 40,271 37,148 40,271
Advance paid to suppliers 29,396 41,094 29,396 41,094
Taxes recoverable-net (a) 96,785 87,684 96,785 87,684
Deposits and pre-payments 6,025 9,717 6,025 9,717
Other receivables 20,407 52,467 20,407 37,302
325,724 488,783 343,808 312,649
(a) Taxes receivable includes Advance Company Tax of Rs
48,692,103 (2011 - Rs 48,692,103), Value Added Tax of
Rs 627,910 (2011 - Rs 3,204,283) and Economic Service
Charge of Rs 37,256,664 (2011 - Rs 24,552,187).
annual report 2011 | 20annual report 2011 | 20
1
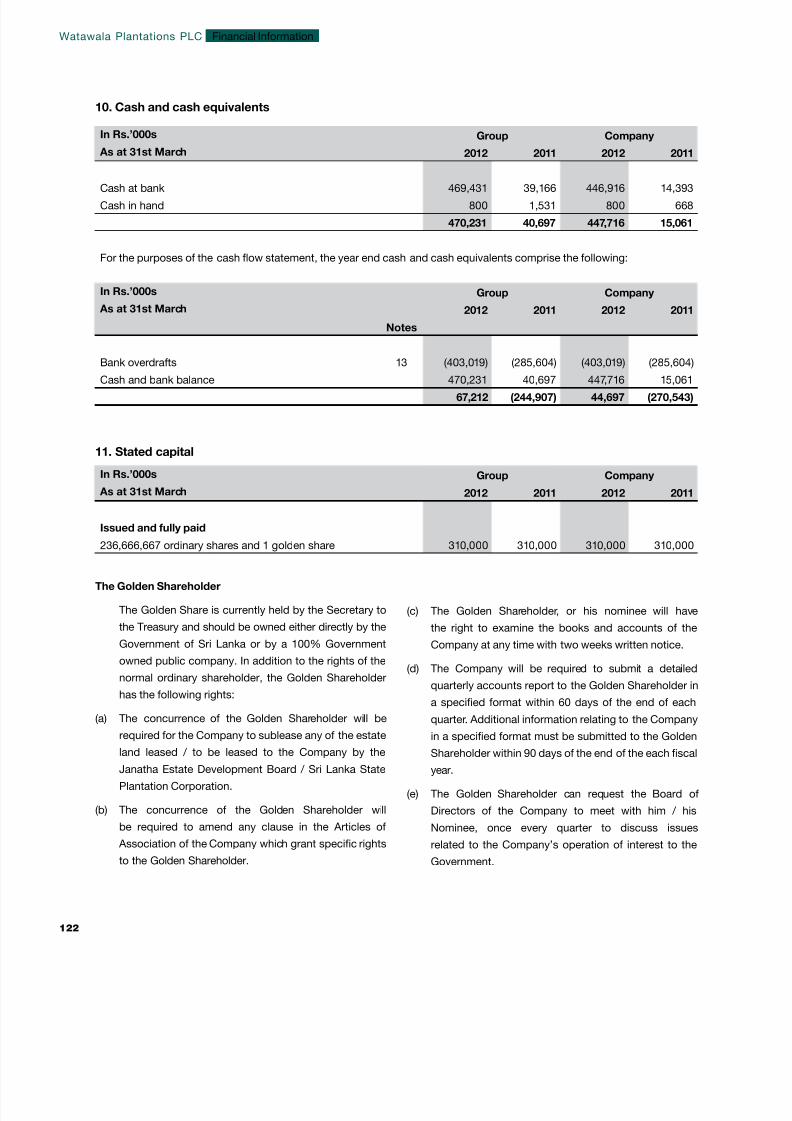
8/14/2019 Watawala Plantations 2011.2012.pdf
http://slidepdf.com/reader/full/watawala-plantations-20112012pdf 124/160
10. Cash and cash equivalents
11. Stated capital
In Rs.’000s Group Company
As at 31st March 2012 2011 2012 2011
Cash at bank 469,431 39,166 446,916 14,393
Cash in hand 800 1,531 800 668
470,231 40,697 447,716 15,061
For the purposes of the cash ow statement, the year end cash and cash equivalents comprise the following:
In Rs.’000s Group Company
As at 31st March 2012 2011 2012 2011
Notes
Bank overdrafts 13 (403,019) (285,604) (403,019) (285,604)
Cash and bank balance 470,231 40,697 447,716 15,061
67,212 (244,907) 44,697 (270,543)
In Rs.’000s Group Company
As at 31st March 2012 2011 2012 2011
Issued and fully paid
236,666,667 ordinary shares and 1 golden share 310,000 310,000 310,000 310,000
The Golden Shareholder
The Golden Share is currently held by the Secretary to
the Treasury and should be owned either directly by the
Government of Sri Lanka or by a 100% Government
owned public company. In addition to the rights of the
normal ordinary shareholder, the Golden Shareholder
has the following rights:
(a) The concurrence of the Golden Shareholder will be
required for the Company to sublease any of the estateland leased / to be leased to the Company by the
Janatha Estate Development Board / Sri Lanka State
Plantation Corporation.
(b) The concurrence of the Golden Shareholder will
be required to amend any clause in the Articles of
Association of the Company which grant specic rights
to the Golden Shareholder.
(c) The Golden Shareholder, or his nominee will have
the right to examine the books and accounts of the
Company at any time with two weeks written notice.
(d) The Company will be required to submit a detailed
quarterly accounts report to the Golden Shareholder in
a specied format within 60 days of the end of each
quarter. Additional information relating to the Company
in a specied format must be submitted to the GoldenShareholder within 90 days of the end of the each scal
year.
(e) The Golden Shareholder can request the Board of
Directors of the Company to meet with him / his
Nominee, once every quarter to discuss issues
related to the Company’s operation of interest to the
Government.
Watawala Plantations PLC
122
Financial Information

8/14/2019 Watawala Plantations 2011.2012.pdf
http://slidepdf.com/reader/full/watawala-plantations-20112012pdf 125/160
12. General reserve
13. Borrowings
In Rs.’000s Group Company
As at 31st March 2012 2011 2012 2011
At the beginning of the year 150,000 150,000 150,000 150,000
At the end of the year 150,000 150,000 150,000 150,000
In Rs.’000s Group Company
As at 31st March 2012 2011 2012 2011
Notes
Repayable within one year
Term loans 13.1 96,089 100,763 96,089 100,763
Other assets obtained on leases 13.6 2,037 5,662 2,037 5,662
Money market loans 45,000 45,000 45,000 45,000
Bank overdrafts 13.5 403,019 285,604 403,019 285,604
546,145 437,029 546,145 437,029
Repayable after one year
Term loans 13.1 206,131 294,536 206,131 294,536
Other assets obtained on leases 13.6 4,596 10,194 4,596 10,194
210,727 304,730 210,727 304,730
Total borrowings 756,872 741,759 756,872 741,759
Total borrowings as at 31 March 2012 can be analysed as follows :
Short term loans are secured on leasehold rights on specic estates.
In Rs.’000s Less than
one year
1 - 2
years
2 - 5
years
More than
5 years Total
Term loans 96,089 92,076 114,055 - 302,220
Money market loans 45,000 - - - 45,000
Other assets obtained on leases 2,037 2,255 2,341 - 6,633
Bank overdrafts 403,019 - - - 403,019
As at 31st March 2012 546,145 94,331 116,397 - 756,872
As at 31st March 2011 437,029 86,264 151,517 66,949 741,759
annual report 2011 | 20annual report 2011 | 20
1

8/14/2019 Watawala Plantations 2011.2012.pdf
http://slidepdf.com/reader/full/watawala-plantations-20112012pdf 126/160
13.1.1 Term loans - Commercial Bank of Ceylon PLC
Purpose : For eld development activities from commercial banks under ADB re-nance scheme:
Purpose : For processing development, vehicles and equipment from commercial banks under ADB re-nance scheme:
In Rs.’000s 2011 / 2012 2010 / 2011
Year Loan Original Interest Repayable Repayable Balance Repayable Repayable Balance Repayment
number amount rate within after as at within after as at terms
% p.a. one year one year 31/03/2012 one year one year 31/03/2011
1996 37321 19,510 11.5 - - - 1,951 - 1,951 40 equal quarterly instalments
commencing from June 2002
1997 56134 &
62148
29,684 11.5 2,968 451 3,419 2,968 3,419 6,387 40 equal quarterly instalments
commencing from June 2003
2000 68675 60,052 11.5 6,005 6,005 12,010 6,005 12,010 18,015 40 equal quarterly instalments
commencing from May 2004
2000 77841 25,067 11.5 2,507 3,760 6,267 2,507 6,267 8,774 40 equal quarterly instalments
commencing from September 2004
2001 88285 46,663 11.5 4,666 10,500 15,166 4,666 15,166 19,832 40 equal quarterly instalments
commencing from September 2004
Sub total 180,976 16,146 20,716 36,862 18,097 36,862 54,959
In Rs.’000s 2011 / 2012 2010 / 2011
Year Loan Original Interest Repayable Repayable Balance Repayable Repayable Balance Repayment
number amount rate within after as at within after as at terms
% p.a. one year one year 31/03/2012 one year one year 31/03/2011
1996 35531 18,391 11.5 - - - 1,839 - 1,839 40 equal quarterly instalments com-
mencing from June 2002
2006 369491&
369487
50,340 9.74 6,804 24,939 31,743 6,804 31,743 38,547 96 equal monthly instalments
commencing from October 2008
2007 375394&
375396
48,479 9.74 6,606 29,193 35,799 6,606 35,799 42,405 96 equal monthly instalments
commencing from June 2009
2008 501241 1,181 9.74 148 701 849 148 849 997 96 equal quarterly instalments
commencing from January 2010
Sub total 118,391 13,558 54,833 68,391 15,397 68,391 83,788
13. Borrowings
In Rs.’000s Outstanding liability Outstanding liability Security
Nature of liability Repayable Repayable Balance Repayable Repayable Balance
within after as at within after as at
one year one year 31/03/2012 one year one year 31/03/2011
Commercial Bank of Ceylon PLC
(Note 13.1.1)
66,507 124,695 191,202 71,474 191,203 262,677 Leasehold rights on specied estates
and machinerypurchased under
Environmental Friendly Scheme.
Hatton National Bank PLC
(Note 13.1.2)
8,333 16,667 25,000 9,289 25,000 34,289 Machinery purchased under
Environmental Friendly Scheme and
leasehold rights on specied estates.
ICICI Bank Limited
(Note 13.1.3)
20,000 58,334 78,334 20,000 78,333 98,333 Unsecured.
Public Bank Berhad
(Note 13.1.4)
1,249 6,435 7,684 - - -
Total 96,089 206,131 302,220 100,763 294,536 395,299
Short term loans are secured on leasehold rights on specic estates
13.1 Term loans - Group and Company
Watawala Plantations PLC
124
Financial Information
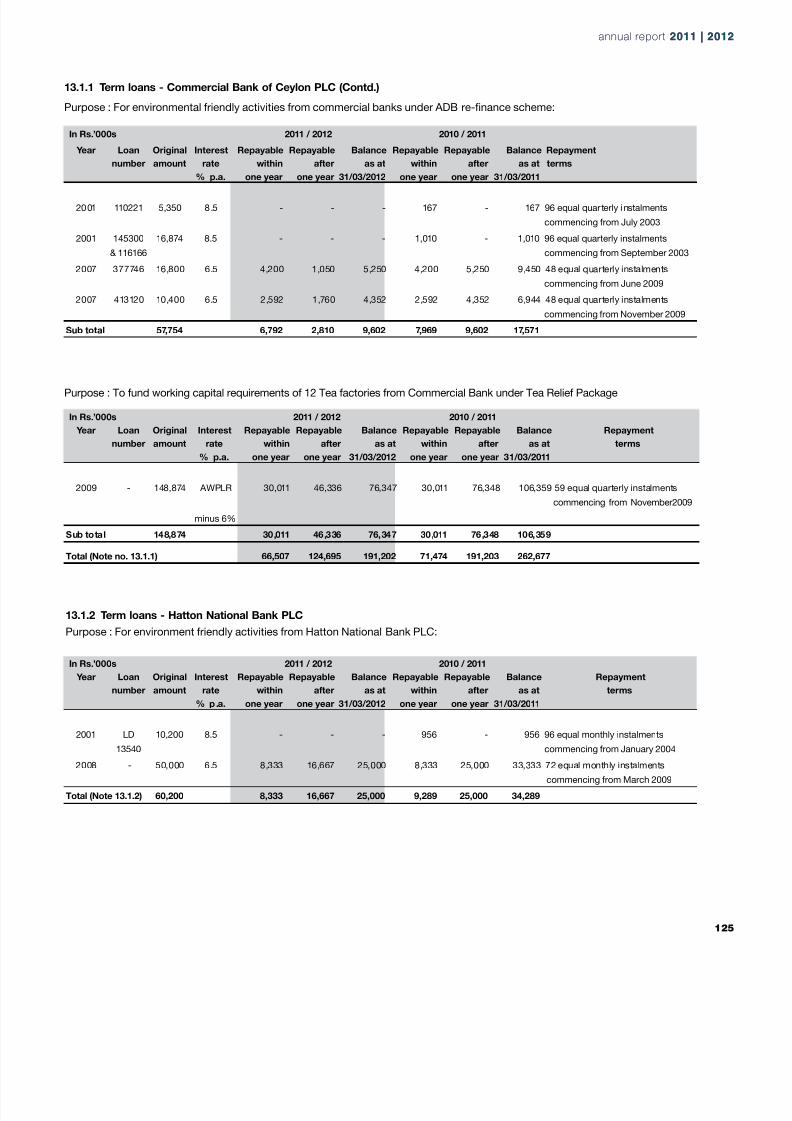
8/14/2019 Watawala Plantations 2011.2012.pdf
http://slidepdf.com/reader/full/watawala-plantations-20112012pdf 127/160
13.1.1 Term loans - Commercial Bank of Ceylon PLC (Contd.)
Purpose : For environmental friendly activities from commercial banks under ADB re-nance scheme:
13.1.2 Term loans - Hatton National Bank PLC
Purpose : For environment friendly activities from Hatton National Bank PLC:
Purpose : To fund working capital requirements of 12 Tea factories from Commercial Bank under Tea Relief Package
In Rs.’000s 2011 / 2012 2010 / 2011
Year Loan Original Interest Repayable Repayable Balance Repayable Repayable Balance Repayment
number amount rate within after as at within after as at terms
% p.a. one year one year 31/03/2012 one year one year 31/03/2011
2001 110221 5,350 8.5 - - - 167 - 167 96 equal quarterly instalments
commencing from July 2003
2001 145300
& 116166
16,874 8.5 - - - 1,010 - 1,010 96 equal quarterly instalments
commencing from September 2003
2007 377746 16,800 6.5 4,200 1,050 5,250 4,200 5,250 9,450 48 equal quarterly instalments
commencing from June 2009
2007 413120 10,400 6.5 2,592 1,760 4,352 2,592 4,352 6,944 48 equal quarterly instalments
commencing from November 2009
Sub total 57,754 6,792 2,810 9,602 7,969 9,602 17,571
In Rs.’000s 2011 / 2012 2010 / 2011
Year Loan Original Interest Repayable Repayable Balance Repayable Repayable Balance Repayment
number amount rate within after as at within after as at terms
% p.a. one year one year 31/03/2012 one year one year 31/03/2011
2009 - 148,874 AWPLR 30,011 46,336 76,347 30,011 76,348 106,359 59 equal quarterly instalments
commencing from November2009
minus 6%
Sub total 148,874 30,011 46,336 76,347 30,011 76,348 106,359
Total (Note no. 13.1.1) 66,507 124,695 191,202 71,474 191,203 262,677
In Rs.’000s 2011 / 2012 2010 / 2011
Year Loan Original Interest Repayable Repayable Balance Repayable Repayable Balance Repayment
number amount rate within after as at within after as at terms
% p.a. one year one year 31/03/2012 one year one year 31/03/2011
2001 LD13540
10,200 8.5 - - - 956 - 956 96 equal monthly instalmentscommencing from January 2004
2008 - 50,000 6.5 8,333 16,667 25,000 8,333 25,000 33,333 72 equal monthly instalments
commencing from March 2009
Total (Note 13.1.2) 60,200 8,333 16,667 25,000 9,289 25,000 34,289
annual report 2011 | 20annual report 2011 | 20
1

8/14/2019 Watawala Plantations 2011.2012.pdf
http://slidepdf.com/reader/full/watawala-plantations-20112012pdf 128/160
13.1.3 Term loans - ICICI Bank Limited
Purpose - For purchase of xed assets in factories
13.1.4 Term loans - Public Bank Berhad
Purpose - For purchase of vehicle
In Rs.’000s 2011 / 2012 2010 / 2011
Year Loan Original Interest Repayable Repayable Balance Repayable Repayable Balance Repayment
number amount rate within after as at within after as at terms
% p.a. one year one year 31/03/2012 one year one year 31/03/2011
2011 180 50,000 SLIBOR
+ 5%
10,000 29,167 39,167 10,000 39,167 49,167 60 equal monthly instalments
commencing from March 2011
1 year
2011 181 50,000 SLIBOR
+ 5%
10,000 29,167 39,167 10,000 39,167 49,167 60 equal monthly instalments
commencing from March 2011
2 to 5
years
Total(Note 13.1.3) 100,000 20,000 58,334 78,334 20,000 78,334 98,334
In Rs.’000s 2011 / 2012 2010 / 2011
Year Loan Original Interest Repayable Repayable Balance Repayable Repayable Balance Repayment
number amount rate within after as at within after as at terms
% p.a. one year one year 31/03/2012 one year one year 31/03/2011
2012 - 5,850 11% 939 4,835 5,774 - - - 60 equal monthly instalments
commencing from March 2012
2012 - 1,935 11% 311 1,599 1,910 - - - 60 equal monthly instalments
commencing from March 2012
Total(Note 13.1.4) 7,785 1,249 6,435 7,684 - - -
13. Borrowings
Watawala Plantations PLC
126
Financial Information
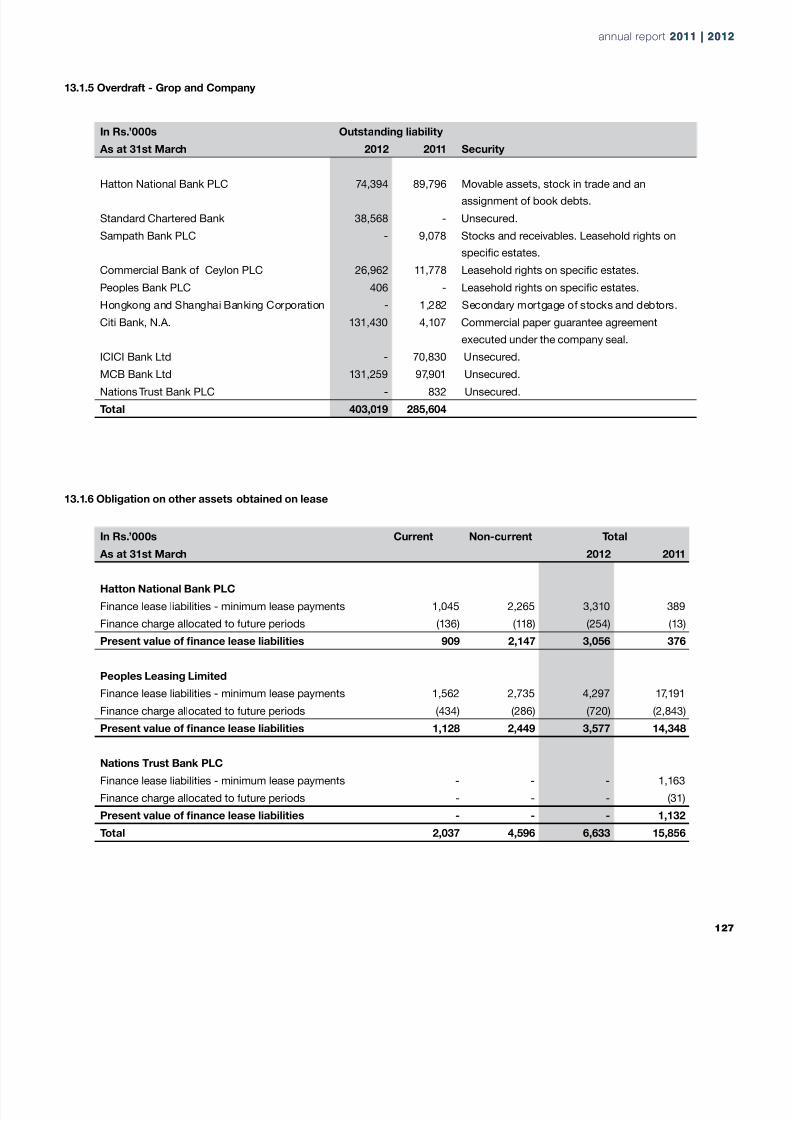
8/14/2019 Watawala Plantations 2011.2012.pdf
http://slidepdf.com/reader/full/watawala-plantations-20112012pdf 129/160
13.1.5 Overdraft - Grop and Company
13.1.6 Obligation on other assets obtained on lease
In Rs.’000s Outstanding liability
As at 31st March 2012 2011 Security
Hatton National Bank PLC 74,394 89,796 Movable assets, stock in trade and anassignment of book debts.
Standard Chartered Bank 38,568 - Unsecured.
Sampath Bank PLC - 9,078 Stocks and receivables. Leasehold rights on
specic estates.
Commercial Bank of Ceylon PLC 26,962 11,778 Leasehold rights on specic estates.
Peoples Bank PLC 406 - Leasehold rights on specic estates.
Hongkong and Shanghai Banking Corporation - 1,282 Secondary mortgage of stocks and debtors.
Citi Bank, N.A. 131,430 4,107 Commercial paper guarantee agreement
executed under the company seal.
ICICI Bank Ltd - 70,830 Unsecured.
MCB Bank Ltd 131,259 97,901 Unsecured.
Nations Trust Bank PLC - 832 Unsecured.
Total 403,019 285,604
In Rs.’000s Current Non-current Total
As at 31st March 2012 2011
Hatton National Bank PLC
Finance lease liabilities - minimum lease payments 1,045 2,265 3,310 389
Finance charge allocated to future periods (136) (118) (254) (13)
Present value of nance lease liabilities 909 2,147 3,056 376
Peoples Leasing Limited
Finance lease liabilities - minimum lease payments 1,562 2,735 4,297 17,191
Finance charge allocated to future periods (434) (286) (720) (2,843)
Present value of nance lease liabilities 1,128 2,449 3,577 14,348
Nations Trust Bank PLC
Finance lease liabilities - minimum lease payments - - - 1,163
Finance charge allocated to future periods - - - (31)
Present value of nance lease liabilities - - - 1,132
Total 2,037 4,596 6,633 15,856
annual report 2011 | 20annual report 2011 | 20
1
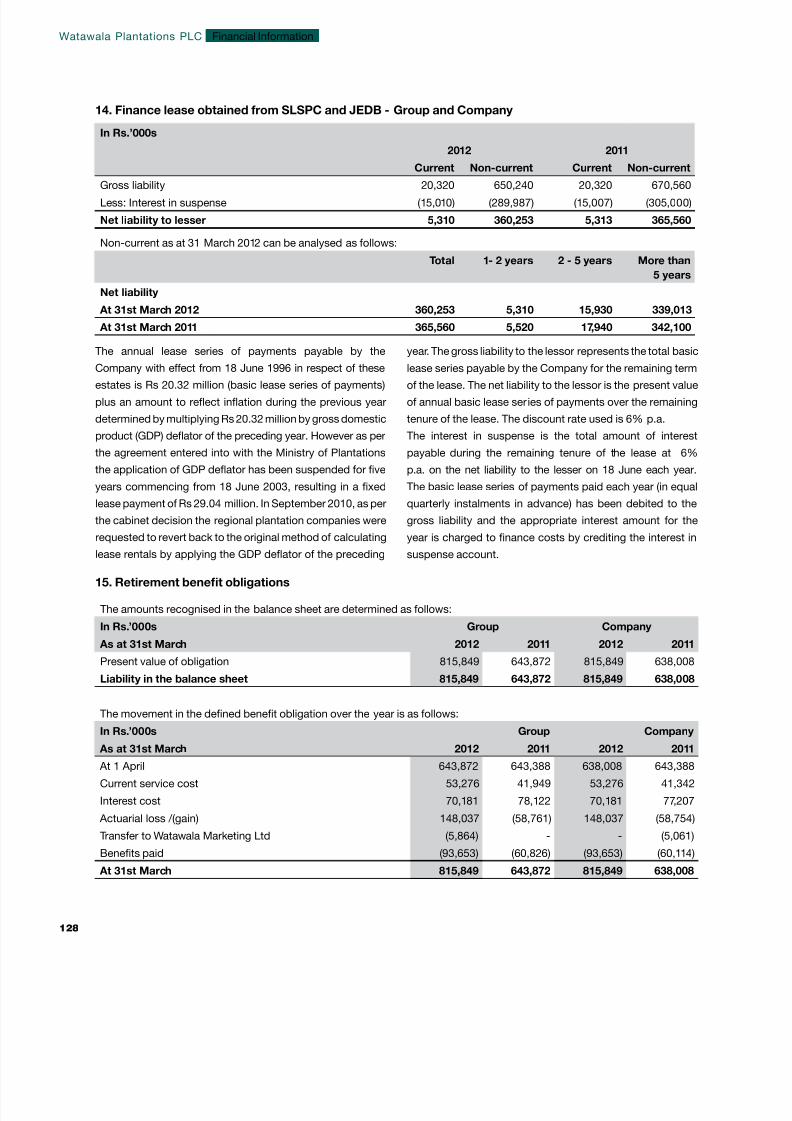
8/14/2019 Watawala Plantations 2011.2012.pdf
http://slidepdf.com/reader/full/watawala-plantations-20112012pdf 130/160
14. Finance lease obtained from SLSPC and JEDB - Group and Company
15. Retirement benet obligations
In Rs.’000s
2012 2011
Current Non-current Current Non-current
Gross liability 20,320 650,240 20,320 670,560
Less: Interest in suspense (15,010) (289,987) (15,007) (305,000)
Net liability to lesser 5,310 360,253 5,313 365,560
Non-current as at 31 March 2012 can be analysed as follows:
Total 1- 2 years 2 - 5 years More than
5 years
Net liability
At 31st March 2012 360,253 5,310 15,930 339,013
At 31st March 2011 365,560 5,520 17,940 342,100
The annual lease series of payments payable by the
Company with effect from 18 June 1996 in respect of theseestates is Rs 20.32 million (basic lease series of payments)
plus an amount to reect ination during the previous year
determined by multiplying Rs 20.32 million by gross domestic
product (GDP) deator of the preceding year. However as per
the agreement entered into with the Ministry of Plantations
the application of GDP deator has been suspended for ve
years commencing from 18 June 2003, resulting in a xed
lease payment of Rs 29.04 million. In September 2010, as per
the cabinet decision the regional plantation companies were
requested to revert back to the original method of calculating
lease rentals by applying the GDP deator of the preceding
year. The gross liability to the lessor represents the total basic
lease series payable by the Company for the remaining termof the lease. The net liability to the lessor is the present value
of annual basic lease series of payments over the remaining
tenure of the lease. The discount rate used is 6% p.a.
The interest in suspense is the total amount of interest
payable during the remaining tenure of the lease at 6%
p.a. on the net liability to the lesser on 18 June each year.
The basic lease series of payments paid each year (in equal
quarterly instalments in advance) has been debited to the
gross liability and the appropriate interest amount for the
year is charged to nance costs by crediting the interest in
suspense account.
The amounts recognised in the balance sheet are determined as follows:
In Rs.’000s Group Company
As at 31st March 2012 2011 2012 2011
Present value of obligation 815,849 643,872 815,849 638,008
Liability in the balance sheet 815,849 643,872 815,849 638,008
The movement in the dened benet obligation over the year is as follows:
In Rs.’000s Group Company
As at 31st March 2012 2011 2012 2011
At 1 April 643,872 643,388 638,008 643,388
Current service cost 53,276 41,949 53,276 41,342
Interest cost 70,181 78,122 70,181 77,207
Actuarial loss /(gain) 148,037 (58,761) 148,037 (58,754)
Transfer to Watawala Marketing Ltd (5,864) - - (5,061)
Benets paid (93,653) (60,826) (93,653) (60,114)
At 31st March 815,849 643,872 815,849 638,008
Watawala Plantations PLC
128
Financial Information
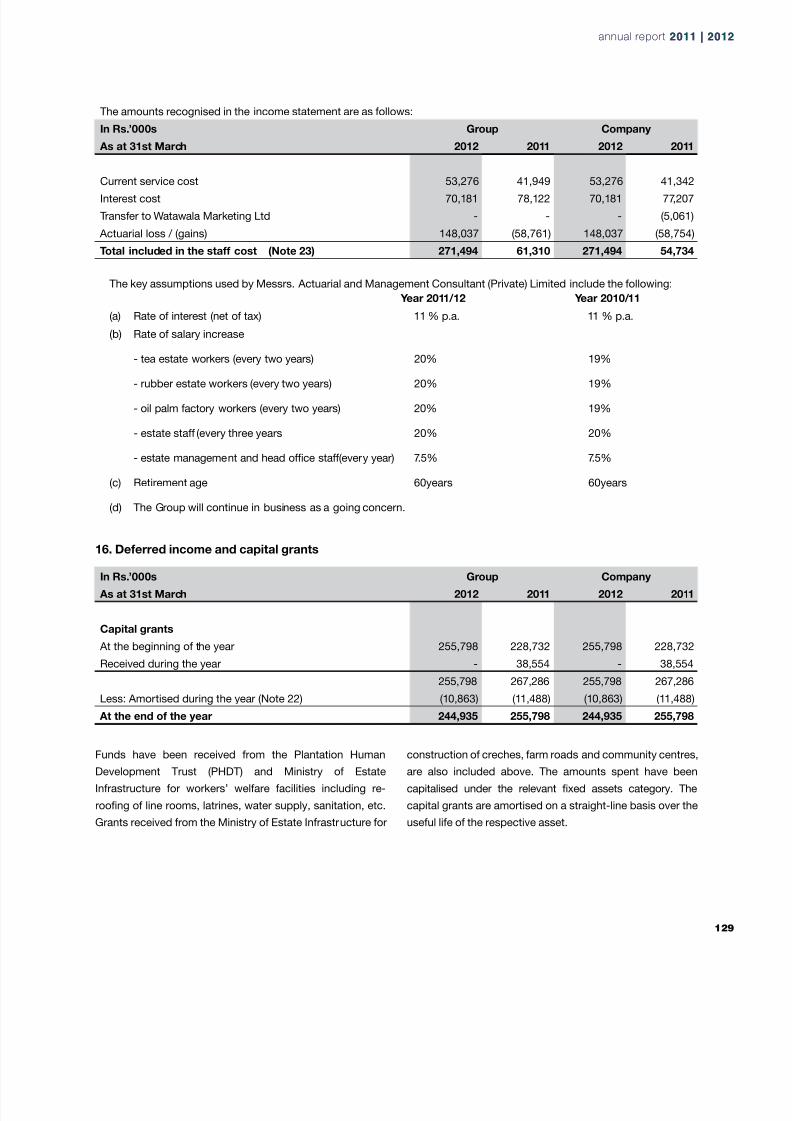
8/14/2019 Watawala Plantations 2011.2012.pdf
http://slidepdf.com/reader/full/watawala-plantations-20112012pdf 131/160
16. Deferred income and capital grants
The amounts recognised in the income statement are as follows:
In Rs.’000s Group Company
As at 31st March 2012 2011 2012 2011
Current service cost 53,276 41,949 53,276 41,342Interest cost 70,181 78,122 70,181 77,207
Transfer to Watawala Marketing Ltd - - - (5,061)
Actuarial loss / (gains) 148,037 (58,761) 148,037 (58,754)
Total included in the staff cost (Note 23) 271,494 61,310 271,494 54,734
The key assumptions used by Messrs. Actuarial and Management Consultant (Private) Limited include the following:
Year 2011/12 Year 2010/11
(a) Rate of interest (net of tax) 11 % p.a. 11 % p.a.
(b) Rate of salary increase
- tea estate workers (every two years) 20% 19%
- rubber estate workers (every two years) 20% 19%
- oil palm factory workers (every two years) 20% 19%
- estate staff (every three years 20% 20%
- estate management and head ofce staff(every year) 7.5% 7.5%
(c) Retirement age 60years 60years
(d) The Group will continue in business as a going concern.
In Rs.’000s Group Company
As at 31st March 2012 2011 2012 2011
Capital grants
At the beginning of the year 255,798 228,732 255,798 228,732
Received during the year - 38,554 - 38,554
255,798 267,286 255,798 267,286
Less: Amortised during the year (Note 22) (10,863) (11,488) (10,863) (11,488)
At the end of the year 244,935 255,798 244,935 255,798
Funds have been received from the Plantation Human
Development Trust (PHDT) and Ministry of Estate
Infrastructure for workers’ welfare facilities including re-
roong of line rooms, latrines, water supply, sanitation, etc.
Grants received from the Ministry of Estate Infrastructure for
construction of creches, farm roads and community centres,
are also included above. The amounts spent have been
capitalised under the relevant xed assets category. The
capital grants are amortised on a straight-line basis over the
useful life of the respective asset.
annual report 2011 | 20annual report 2011 | 20
1

8/14/2019 Watawala Plantations 2011.2012.pdf
http://slidepdf.com/reader/full/watawala-plantations-20112012pdf 132/160
17. Deferred income tax
In Rs.’000s Group Company
As at 31st March 2012 2011 2012 2011
Beginning of the year 27,129 - 26,161 -Charge for the year 2,999 27,129 4,114 26,161
At the end of the year 30,128 27,129 30,275 26,161
Deferred tax is calculated on temporary differences between
carrying value of xed assets and tax written down value of
such assets as analysed by each taxable activity.
The reconciliation of timing differences related to carrying
amounts of assets and liabilities of the balance sheet is as
follows.
Deferred income tax - Group
Deferred income tax - Company
Deferred tax assets and liabilities shall be measured based on the the tax rates that have been enacted or substantially
enacted by the end of the reporting period. Accordingly, the Group has used following tax rates in assessing the
deferred tax asset/liability for the current nancial year.
(a) Agricultural undertakings - 10%
(b) Exports - 12%
(c) Other - 28%
In Rs.’000s 2012 2011
Deferred Deferred Net Deferred Deferred Net
tax tax deferred tax tax deferred
asset liability tax liability asset liability tax liability
Tangible xed assets 147 (68,073) (67,926) - (41,688) (41,688)
Immature / mature plantation - (289,868) (289,868) - (210,647) (210,647)
Retirement benet obligations 127,900 - 127,900 95,103 - 95,103
Capital grants 68,582 - 68,582 71,623 - 71,623
Tax losses carried forward 131,184 - 131,184 58,480 - 58,480
Liability / (asset) at 31st March 327,813 (357,941) (30,128) 225,206 (252,335) (27,129)
In Rs.’000s 2012 2011
Deferred Deferred Net Deferred Deferred Net
tax tax deferred tax tax deferred
asset liability tax liability asset liability tax liability
Tangible xed assets - (68,073) (68,073) - (40,016) (40,016)
Immature / mature plantation - (289,868) (289,868) - (210,647) (210,647)
Retirement benet obligations 127,900 - 127,900 94,399 - 94,399
Capital grants 68,582 - 68,582 71,623 - 71,623
Tax losses carr ied forward 131,184 - 131,184 58,480 - 58,480
Liability / (asset) at 31st March 327,666 (357,941) (30,275) 224,502 (250,663) (26,161)
Watawala Plantations PLC
130
Financial Information

8/14/2019 Watawala Plantations 2011.2012.pdf
http://slidepdf.com/reader/full/watawala-plantations-20112012pdf 133/160
18. Trade and other payables
19. Segmental analysis by principal activities-
In Rs.’000s Notes Group Company
As at 31st March 2012 2011 2012 2011
Trade payables 206,580 282,696 205,534 260,507
Employee related creditors 128,161 124,102 128,161 124,102
Provisions and accruals 136,145 173,185 136,145 173,185
Other payables 43,402 94,158 43,402 42,949
Amount due to related companies 31 (l) (iii) 74,389 67,980 74,389 66,492
588,677 742,121 587,631 667,235
Accrued expenses and other payables mainly comprise of lease rent payable to Ministry of Plantations on SLSPC/
JEDB lease amounting to Rs 54,840,833 (2011-Rs 36,950,441).
The analysis by the principal activities, is as follows:
In Rs.’000s Group Company
For the year ended 31st March 2012 2011 2012 2011
Revenue
Tea 3,183,034 3,558,239 3,179,817 3,569,495
Rubber 288,228 334,721 288,228 334,721
Palm oil 919,096 701,679 919,096 701,679
Exports 145,128 176,125 145,128 57,849
FMCG - 1,387,482 - -
Total 4,535,486 6,158,246 4,532,269 4,663,744
Gross prot/(loss)
Tea (354,711) 189,218 (354,711) 199,050
Rubber 81,786 173,680 81,786 173,680
Palm oil 520,356 276,956 520,356 308,082
Exports 2,065 60,866 (1,152) 2,192
FMCG - 499,076 - -
Total 249,496 1,199,796 246,279 683,004
annual report 2011 | 20annual report 2011 | 20
1
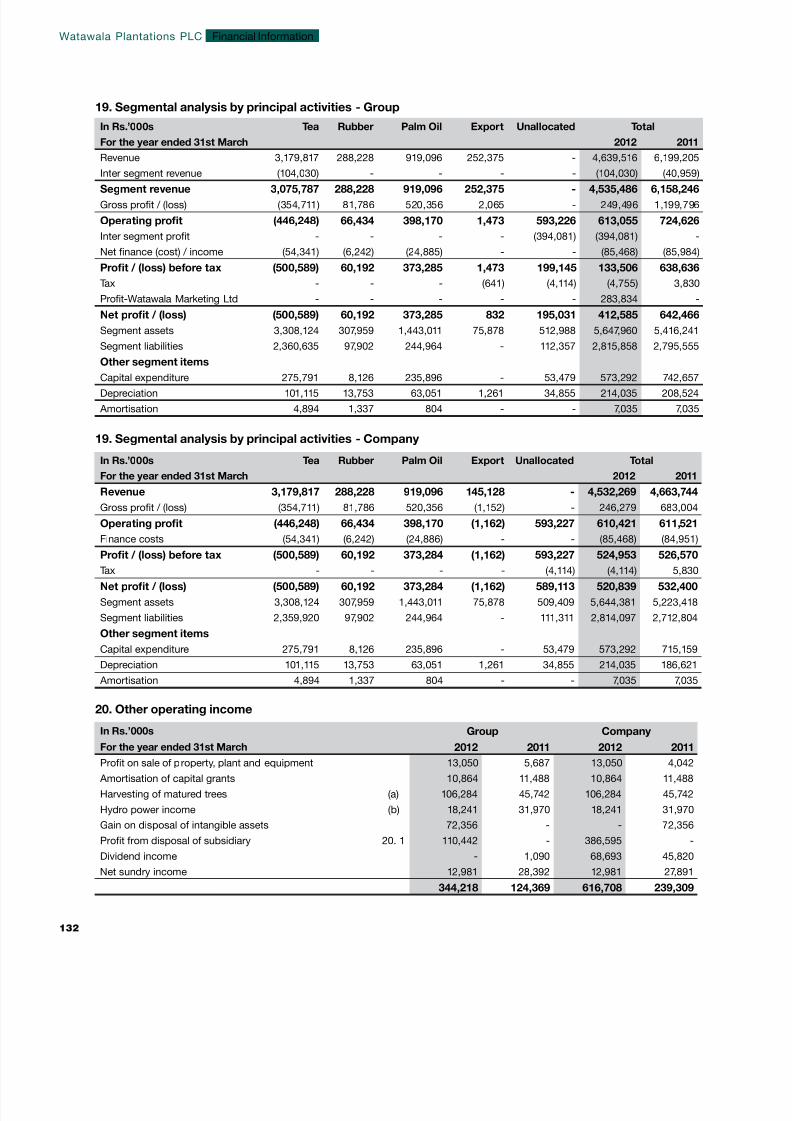
8/14/2019 Watawala Plantations 2011.2012.pdf
http://slidepdf.com/reader/full/watawala-plantations-20112012pdf 134/160
19. Segmental analysis by principal activities - Group
19. Segmental analysis by principal activities - Company
20. Other operating income
In Rs.’000s Tea Rubber Palm Oil Export Unallocated Total
For the year ended 31st March 2012 2011
Revenue 3,179,817 288,228 919,096 252,375 - 4,639,516 6,199,205
Inter segment revenue (104,030) - - - - (104,030) (40,959)
Segment revenue 3,075,787 288,228 919,096 252,375 - 4,535,486 6,158,246
Gross prot / (loss) (354,711) 81,786 520,356 2,065 - 249,496 1,199,796
Operating prot (446,248) 66,434 398,170 1,473 593,226 613,055 724,626
Inter segment prot - - - - (394,081) (394,081) -
Net nance (cost) / income (54,341) (6,242) (24,885) - - (85,468) (85,984)
Prot / (loss) before tax (500,589) 60,192 373,285 1,473 199,145 133,506 638,636
Tax - - - (641) (4,114) (4,755) 3,830
Prot-Watawala Marketing Ltd - - - - - 283,834 -
Net prot / (loss) (500,589) 60,192 373,285 832 195,031 412,585 642,466
Segment assets 3,308,124 307,959 1,443,011 75,878 512,988 5,647,960 5,416,241
Segment liabilities 2,360,635 97,902 244,964 - 112,357 2,815,858 2,795,555
Other segment items
Capital expenditure 275,791 8,126 235,896 - 53,479 573,292 742,657
Depreciation 101,115 13,753 63,051 1,261 34,855 214,035 208,524
Amortisation 4,894 1,337 804 - - 7,035 7,035
In Rs.’000s Tea Rubber Palm Oil Export Unallocated Total
For the year ended 31st March 2012 2011
Revenue 3,179,817 288,228 919,096 145,128 - 4,532,269 4,663,744
Gross prot / (loss) (354,711) 81,786 520,356 (1,152) - 246,279 683,004
Operating prot (446,248) 66,434 398,170 (1,162) 593,227 610,421 611,521
Finance costs (54,341) (6,242) (24,886) - - (85,468) (84,951)
Prot / (loss) before tax (500,589) 60,192 373,284 (1,162) 593,227 524,953 526,570Tax - - - - (4,114) (4,114) 5,830
Net prot / (loss) (500,589) 60,192 373,284 (1,162) 589,113 520,839 532,400
Segment assets 3,308,124 307,959 1,443,011 75,878 509,409 5,644,381 5,223,418
Segment liabilities 2,359,920 97,902 244,964 - 111,311 2,814,097 2,712,804
Other segment items
Capital expenditure 275,791 8,126 235,896 - 53,479 573,292 715,159
Depreciation 101,115 13,753 63,051 1,261 34,855 214,035 186,621
Amortisation 4,894 1,337 804 - - 7,035 7,035
In Rs.’000s Group Company
For the year ended 31st March 2012 2011 2012 2011
Prot on sale of property, plant and equipment 13,050 5,687 13,050 4,042
Amortisation of capital grants 10,864 11,488 10,864 11,488
Harvesting of matured trees (a) 106,284 45,742 106,284 45,742
Hydro power income (b) 18,241 31,970 18,241 31,970
Gain on disposal of intangible assets 72,356 - - 72,356
Prot from disposal of subsidiary 20. 1 110,442 - 386,595 -
Dividend income - 1,090 68,693 45,820
Net sundry income 12,981 28,392 12,981 27,891
344,218 124,369 616,708 239,309
Watawala Plantations PLC
132
Financial Information

8/14/2019 Watawala Plantations 2011.2012.pdf
http://slidepdf.com/reader/full/watawala-plantations-20112012pdf 135/160
21. Management fees
22. Operating prot
(a) Tree income has been recognised as per Urgent
Issues Task Force (UITF) ruling No. 14, Accounting for
Sale Proceeds of Perennial Plantation Trees, dated 31
December 2001.
20.1 Prot from disposal of subsidiary
In Rs.’000s Group Company
For the year ended 31st March 2012 2011 2012 2011
Consideration received 741,595 - 741,595 -
Carrying value of assets/
investments sold ( Note 32 and Note 7 ) (631,153) - (355,000) -
110,442 - 386,595 -
Management fee is payable as per the understanding with
the Ministry of Plantation Industries and in agreement with
the managing agent Messrs Estate Management Services
(Private) Limited. The management fee is calculated on
The following items have been charged / (credited) in arriving at operating prot:
In Rs.’000s Notes Group Company
For the year ended 31st March 2012 2011 2012 2011
Auditors’ remuneration
- Audit 1,962 1,600 1,696 1,200
- Non audit 200 138 200 138
Amortisation
- leasehold right to bare land 3 7,035 7,035 7,035 7,035
Depreciation
- Immovable leased assets 4 17,647 17,647 17,647 17,647
- Fixed assets (other than
immature / mature plantations) 5 133,825 136,922 133,825 115,019
- Mature plantations 6 62,563 53,955 62,563 53,955
Directors’ emoluments 19,700 33,358 19,700 16,234
Workers prot share bonus 6,393 22,000 6,393 20,000
Prot on sale of
property, plant and equipment 20 13,050 5,687 13,050 4,042
Staff costs 23 2,744,397 2,173,009 2,744,397 2,124,301
Amortisation of grants received 16 (10,863) (11,488) (10,863) (11,488)
EBITDA (Earnings before interest, tax, depreciation and
land amortization). The rate applicable for the current year is
10% of EBITDA, Rs 49,331,477 (2011 - 10% of EBITDA, Rs
90,033,000).
(b) Hydro power income include income from Mark Hydro
(Private) Limited - Rs 3,159,799 (2011 - Rs 6,553,766),
Unit Energy Lanka (Private) Limited - Rs 9,287,770
(2011 - Rs 14,754,562) , Upper Agaraoya Hydro Power
Limited - Rs 5,793,433 (2011 - 10,61,805).
annual report 2011 | 20annual report 2011 | 20
1
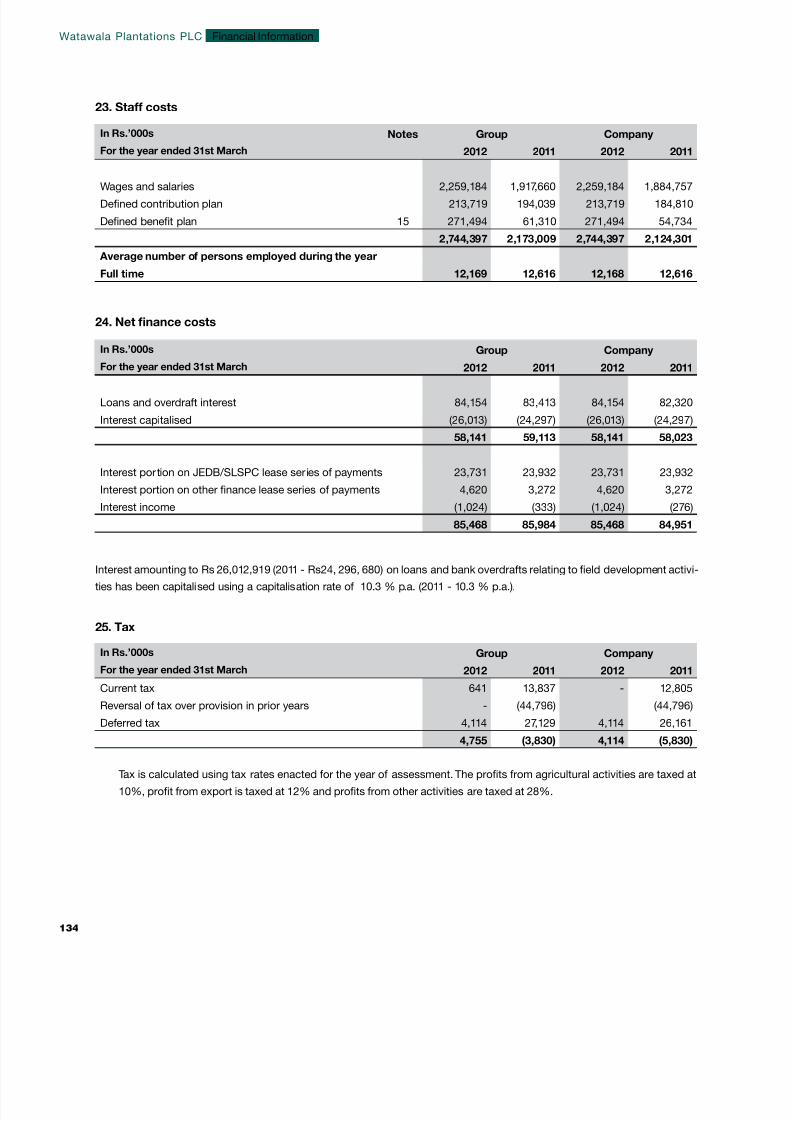
8/14/2019 Watawala Plantations 2011.2012.pdf
http://slidepdf.com/reader/full/watawala-plantations-20112012pdf 136/160
23. Staff costs
24. Net nance costs
25. Tax
In Rs.’000s Notes Group Company
For the year ended 31st March 2012 2011 2012 2011
Wages and salaries 2,259,184 1,917,660 2,259,184 1,884,757
Dened contribution plan 213,719 194,039 213,719 184,810
Dened benet plan 15 271,494 61,310 271,494 54,734
2,744,397 2,173,009 2,744,397 2,124,301
Average number of persons employed during the year
Full time 12,169 12,616 12,168 12,616
In Rs.’000s Group Company
For the year ended 31st March 2012 2011 2012 2011
Loans and overdraft interest 84,154 83,413 84,154 82,320
Interest capitalised (26,013) (24,297) (26,013) (24,297)
58,141 59,113 58,141 58,023
Interest portion on JEDB/SLSPC lease series of payments 23,731 23,932 23,731 23,932
Interest portion on other nance lease series of payments 4,620 3,272 4,620 3,272
Interest income (1,024) (333) (1,024) (276)
85,468 85,984 85,468 84,951
Interest amounting to Rs 26,012,919 (2011 - Rs24, 296, 680) on loans and bank overdrafts relating to eld development activi-
ties has been capitalised using a capitalisation rate of 10.3 % p.a. (2011 - 10.3 % p.a.).
In Rs.’000s Group Company
For the year ended 31st March 2012 2011 2012 2011
Current tax 641 13,837 - 12,805
Reversal of tax over provision in prior years - (44,796) (44,796)
Deferred tax 4,114 27,129 4,114 26,161
4,755 (3,830) 4,114 (5,830)
Tax is calculated using tax rates enacted for the year of assessment. The prots from agricultural activities are taxed at
10%, prot from export is taxed at 12% and prots from other activities are taxed at 28%.
Watawala Plantations PLC
134
Financial Information
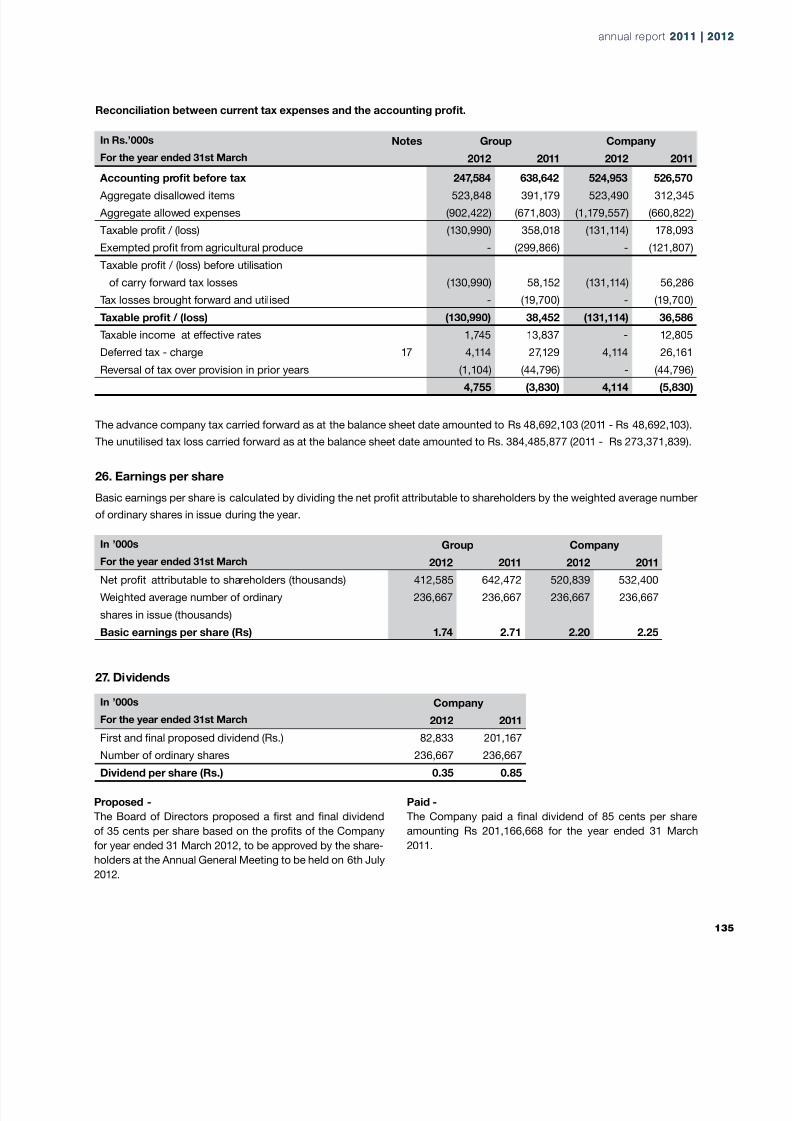
8/14/2019 Watawala Plantations 2011.2012.pdf
http://slidepdf.com/reader/full/watawala-plantations-20112012pdf 137/160
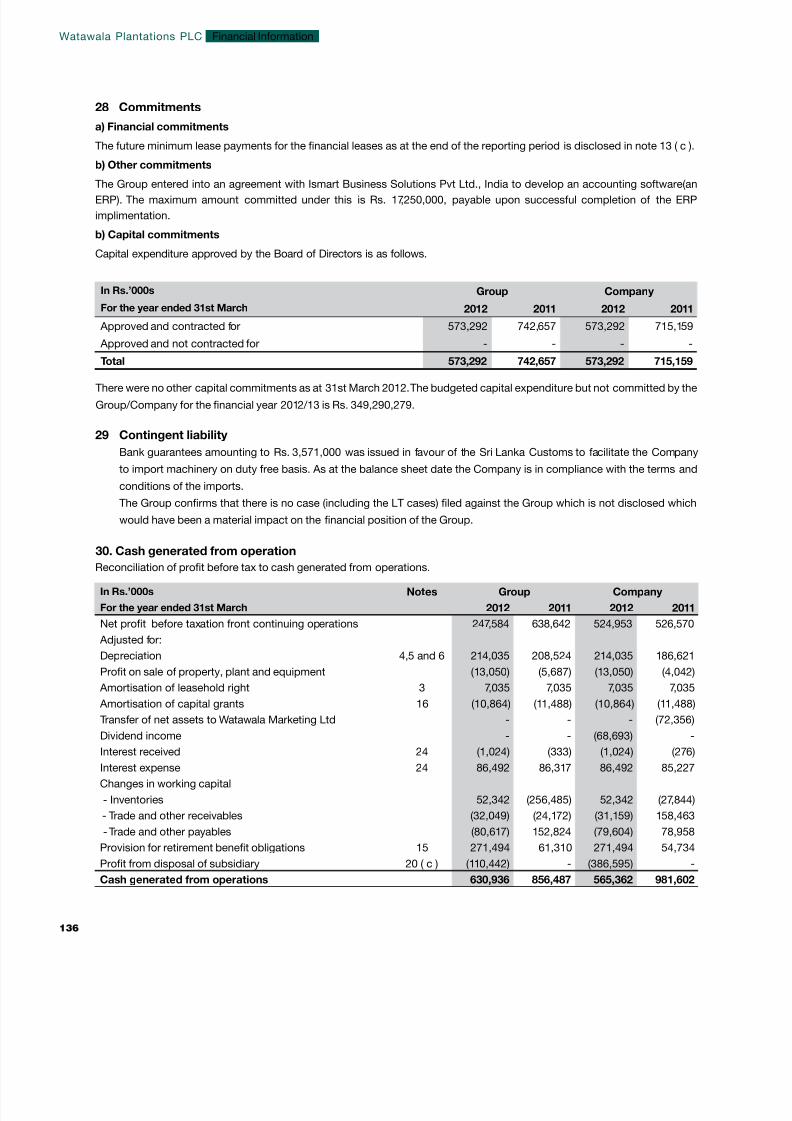
8/14/2019 Watawala Plantations 2011.2012.pdf
http://slidepdf.com/reader/full/watawala-plantations-20112012pdf 138/160
30. Cash generated from operation
28 Commitments
a) Financial commitments
The future minimum lease payments for the nancial leases as at the end of the reporting period is disclosed in note 13 ( c ).
b) Other commitments
The Group entered into an agreement with Ismart Business Solutions Pvt Ltd., India to develop an accounting software(anERP). The maximum amount committed under this is Rs. 17,250,000, payable upon successful completion of the ERP
implimentation.
b) Capital commitments
Capital expenditure approved by the Board of Directors is as follows.
29 Contingent liability
Bank guarantees amounting to Rs. 3,571,000 was issued in favour of the Sri Lanka Customs to facilitate the Company
to import machinery on duty free basis. As at the balance sheet date the Company is in compliance with the terms and
conditions of the imports.
The Group conrms that there is no case (including the LT cases) led against the Group which is not disclosed which
would have been a material impact on the nancial position of the Group.
Reconciliation of prot before tax to cash generated from operations.
There were no other capital commitments as at 31st March 2012. The budgeted capital expenditure but not committed by the
Group/Company for the nancial year 2012/13 is Rs. 349,290,279.
In Rs.’000s Notes Group Company
For the year ended 31st March 2012 2011 2012 2011
Net prot before taxation front continuing operations 247,584 638,642 524,953 526,570
Adjusted for:
Depreciation 4,5 and 6 214,035 208,524 214,035 186,621
Prot on sale of property, plant and equipment (13,050) (5,687) (13,050) (4,042)
Amortisation of leasehold right 3 7,035 7,035 7,035 7,035
Amortisation of capital grants 16 (10,864) (11,488) (10,864) (11,488)
Transfer of net assets to Watawala Marketing Ltd - - - (72,356)
Dividend income - - (68,693) -Interest received 24 (1,024) (333) (1,024) (276)
Interest expense 24 86,492 86,317 86,492 85,227
Changes in working capital
- Inventories 52,342 (256,485) 52,342 (27,844)
- Trade and other receivables (32,049) (24,172) (31,159) 158,463
- Trade and other payables (80,617) 152,824 (79,604) 78,958
Provision for retirement benet obligations 15 271,494 61,310 271,494 54,734
Prot from disposal of subsidiary 20 ( c ) (110,442) - (386,595) -
Cash generated from operations 630,936 856,487 565,362 981,602
In Rs.’000s Group Company
For the year ended 31st March 2012 2011 2012 2011
Approved and contracted for 573,292 742,657 573,292 715,159
Approved and not contracted for - - - -
Total 573,292 742,657 573,292 715,159
Watawala Plantations PLC
136
Financial Information
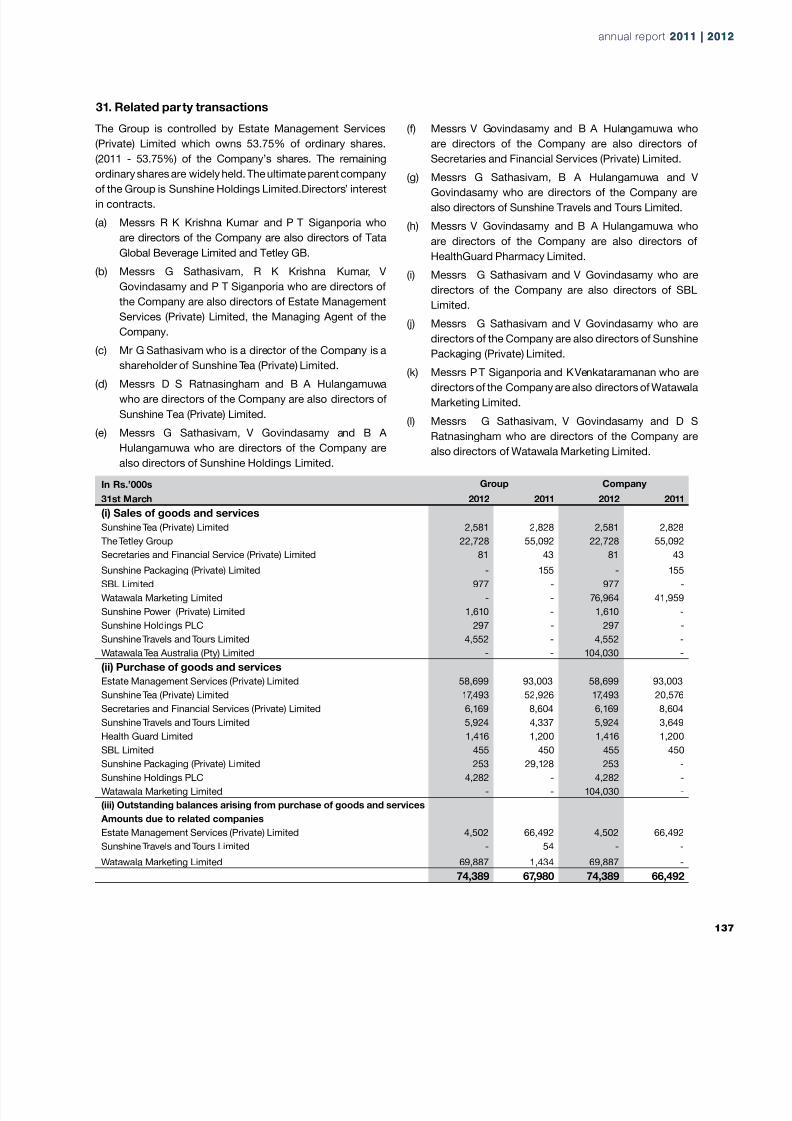
8/14/2019 Watawala Plantations 2011.2012.pdf
http://slidepdf.com/reader/full/watawala-plantations-20112012pdf 139/160
31. Related party transactions
The Group is controlled by Estate Management Services
(Private) Limited which owns 53.75% of ordinary shares.
(2011 - 53.75%) of the Company’s shares. The remaining
ordinary shares are widely held. The ultimate parent company
of the Group is Sunshine Holdings Limited.Directors’ interest
in contracts.
(a) Messrs R K Krishna Kumar and P T Siganporia who
are directors of the Company are also directors of Tata
Global Beverage Limited and Tetley GB.
(b) Messrs G Sathasivam, R K Krishna Kumar, V
Govindasamy and P T Siganporia who are directors of
the Company are also directors of Estate Management
Services (Private) Limited, the Managing Agent of the
Company.
(c) Mr G Sathasivam who is a director of the Company is a
shareholder of Sunshine Tea (Private) Limited.(d) Messrs D S Ratnasingham and B A Hulangamuwa
who are directors of the Company are also directors of
Sunshine Tea (Private) Limited.
(e) Messrs G Sathasivam, V Govindasamy and B A
Hulangamuwa who are directors of the Company are
also directors of Sunshine Holdings Limited.
(f) Messrs V Govindasamy and B A Hulangamuwa who
are directors of the Company are also directors of
Secretaries and Financial Services (Private) Limited.
(g) Messrs G Sathasivam, B A Hulangamuwa and V
Govindasamy who are directors of the Company are
also directors of Sunshine Travels and Tours Limited.
(h) Messrs V Govindasamy and B A Hulangamuwa who
are directors of the Company are also directors of
HealthGuard Pharmacy Limited.
(i) Messrs G Sathasivam and V Govindasamy who are
directors of the Company are also directors of SBL
Limited.
(j) Messrs G Sathasivam and V Govindasamy who are
directors of the Company are also directors of Sunshine
Packaging (Private) Limited.
(k) Messrs P T Siganporia and K Venkataramanan who are
directors of the Company are also directors of Watawala
Marketing Limited.
(l) Messrs G Sathasivam, V Govindasamy and D S
Ratnasingham who are directors of the Company are
also directors of Watawala Marketing Limited.
In Rs.’000s Group Company
31st March 2012 2011 2012 2011
(i) Sales of goods and services
Sunshine Tea (Private) Limited 2,581 2,828 2,581 2,828
The Tetley Group 22,728 55,092 22,728 55,092
Secretaries and Financial Service (Private) Limited 81 43 81 43
Sunshine Packaging (Private) Limited - 155 - 155
SBL Limited 977 - 977 -
Watawala Marketing Limited - - 76,964 41,959
Sunshine Power (Private) Limited 1,610 - 1,610 -
Sunshine Holdings PLC 297 - 297 -
Sunshine Travels and Tours Limited 4,552 - 4,552 -
Watawala Tea Australia (Pty) Limited - - 104,030 -
(ii) Purchase of goods and services
Estate Management Services (Private) Limited 58,699 93,003 58,699 93,003
Sunshine Tea (Private) Limited 17,493 52,926 17,493 20,576
Secretaries and Financial Services (Private) Limited 6,169 8,604 6,169 8,604
Sunshine Travels and Tours Limited 5,924 4,337 5,924 3,649
Health Guard Limited 1,416 1,200 1,416 1,200SBL Limited 455 450 455 450
Sunshine Packaging (Private) Limited 253 29,128 253 -
Sunshine Holdings PLC 4,282 - 4,282 -
Watawala Marketing Limited - - 104,030 -
(iii) Outstanding balances arising from purchase of goods and services
Amounts due to related companies
Estate Management Services (Private) Limited 4,502 66,492 4,502 66,492
Sunshine Travels and Tours Limited - 54 - -
Watawala Marketing Limited 69,887 1,434 69,887 -
74,389 67,980 74,389 66,492
annual report 2011 | 20annual report 2011 | 20
1

8/14/2019 Watawala Plantations 2011.2012.pdf
http://slidepdf.com/reader/full/watawala-plantations-20112012pdf 140/160
31. Related party transactions ( contd)
32. Discontinued operations
In Rs.’000s 31 March 31 March
31st March 2012 2011 2012 2011
(iv) Amounts due from related companies
The Tetley Group - 4,016 - 4,016
SBL Limited - 450 - -
Sunshine Packaging (Private) Limited - 494 - -
Watawala Marketing Limited 6,072 - 6,072
Watawala Tea Australia (Pty) Limited - - 69,887 -
6,072 4,960 75,959 4,016
Transactions with related parties have been carried out on normal commercial terms.
The Directors have disclosed the nature of their interests in contracts and proposed contracts with the Group at meetings
of the directors.
(v) Key management compensation
Key management includes the Executive Committee of the Group & Company. The compensation paid or payable to key
management for employee services is as follows:
In Rs.’000s Group Company
For the year ended 31st March 2012 2011 2012 2011
Salaries and other short term employee benets 35,439 46,982 35,439 29,858
The Company disposed Watawala Marketing Limited on 29 February 2012 as described in Note 7.
a) Financial performance of Watawala Marketing Limited for the period ended 29 February 2012 is shown below.
In Rs.’000s 11 months
ended
29 February 2012
Revenue 1,483,444
Cost of sales (911,258)
Gross prot 572,186
Other income 5,099Distribution expenses (165,513)
Administrative expenses (197,096)
Operating prot 214,676
Management fees (1,018)
Prot before tax 213,658
Tax (43,902)
Prot from discontinued operations 169,756
Watawala Plantations PLC
138
Financial Information
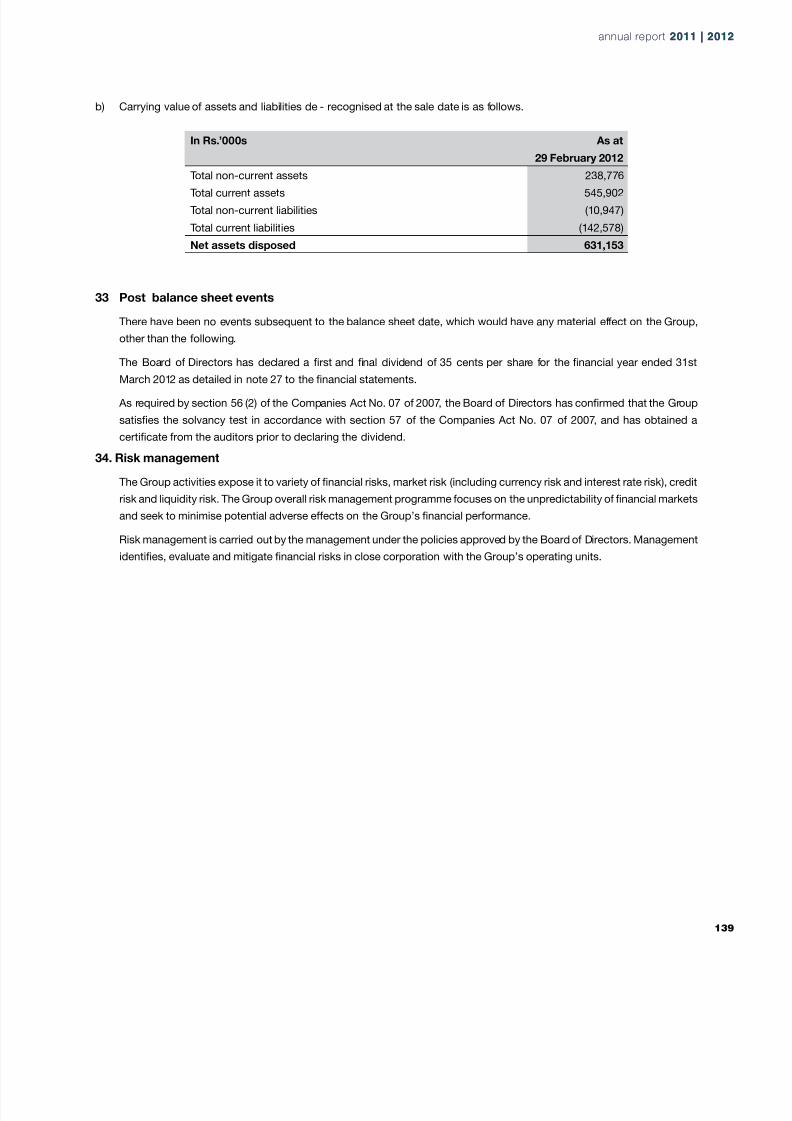
8/14/2019 Watawala Plantations 2011.2012.pdf
http://slidepdf.com/reader/full/watawala-plantations-20112012pdf 141/160
b) Carrying value of assets and liabilities de - recognised at the sale date is as follows.
In Rs.’000s As at
29 February 2012
Total non-current assets 238,776
Total current assets 545,902
Total non-current liabilities (10,947)
Total current liabilities (142,578)
Net assets disposed 631,153
33 Post balance sheet events
There have been no events subsequent to the balance sheet date, which would have any material effect on the Group,
other than the following.
The Board of Directors has declared a rst and nal dividend of 35 cents per share for the nancial year ended 31st
March 2012 as detailed in note 27 to the nancial statements.
As required by section 56 (2) of the Companies Act No. 07 of 2007, the Board of Directors has conrmed that the Group
satises the solvancy test in accordance with section 57 of the Companies Act No. 07 of 2007, and has obtained a
certicate from the auditors prior to declaring the dividend.
34. Risk management
The Group activities expose it to variety of nancial risks, market risk (including currency risk and interest rate risk), credit
risk and liquidity risk. The Group overall risk management programme focuses on the unpredictability of nancial markets
and seek to minimise potential adverse effects on the Group’s nancial performance.
Risk management is carried out by the management under the policies approved by the Board of Directors. Management
identies, evaluate and mitigate nancial risks in close corporation with the Group’s operating units.
annual report 2011 | 20annual report 2011 | 20
1

8/14/2019 Watawala Plantations 2011.2012.pdf
http://slidepdf.com/reader/full/watawala-plantations-20112012pdf 142/160
QUALITY
ASSURANCETHROUGH PEOPLE, PROCESS
AND PRODUCT
8/14/2019 Watawala Plantations 2011.2012.pdf
http://slidepdf.com/reader/full/watawala-plantations-20112012pdf 143/160

8/14/2019 Watawala Plantations 2011.2012.pdf
http://slidepdf.com/reader/full/watawala-plantations-20112012pdf 144/160
Group Company
2011/2012 2010/2011 2011/2012 2010/2011Rs.’000 Rs.’000 Rs.’000 Rs.’000
Revenue 4,535,486 6,158,246 4,532,269 4,663,744
Other income 344,218 124,369 616,708 239,309
4,879,704 6,282,615 5,148,977 4,903,653
Cost of materials and services
obtained
(1,226,393) (2,946,823) (1,386,297) (1,779,699)
Value Addition 3,653,311 3,335,792 3,762,680 3,123,354
Value allocated to:
To Employees
Salaries,wages and other benets 2,744,399 75% 2,173,009 65% 2,744,399 73% 2,129,362 68%
To Providers of funds
Interest to money lenders 85,468 2% 85,984 3% 85,468 2% 84,951 3%
To Government
JEDB/SLSPC Lease rental 55,990 50,958 55,990 50,958
Value Added Tax 104,455 64,947 104,455 64,947
Nation Bulding Tax 26,075 59,285 26,075 25,965
Business Turnover Tax - 463 - -
Social Responsibity Levy 21 174 21 174
Stamp Duty 249 1,975 249 1,975
Income Tax - 13,837 - 12,805
186,790 5% 191,639 6% 186,790 5% 156,824 5%
To providers of capital
Dividend paid to shareholders 201,167 6% 65,083 2% 201,167 6% 65,083 2%
To Expansion and growth
Prot retained 211,418 577,389 319,672 467,317
Depreciation & ammotization 221,070 215,559 221,070 193,656Deferred Taxation 2,999 27,129 4,114 26,161
435,487 12% 820,077 24% 544,856 14% 687,134 22%
3,653,311 100% 3,335,792 100% 3,762,680 100% 3,123,354 100%
Value Added Statement
Watawala Plantations PLC
142
Supplementary Information
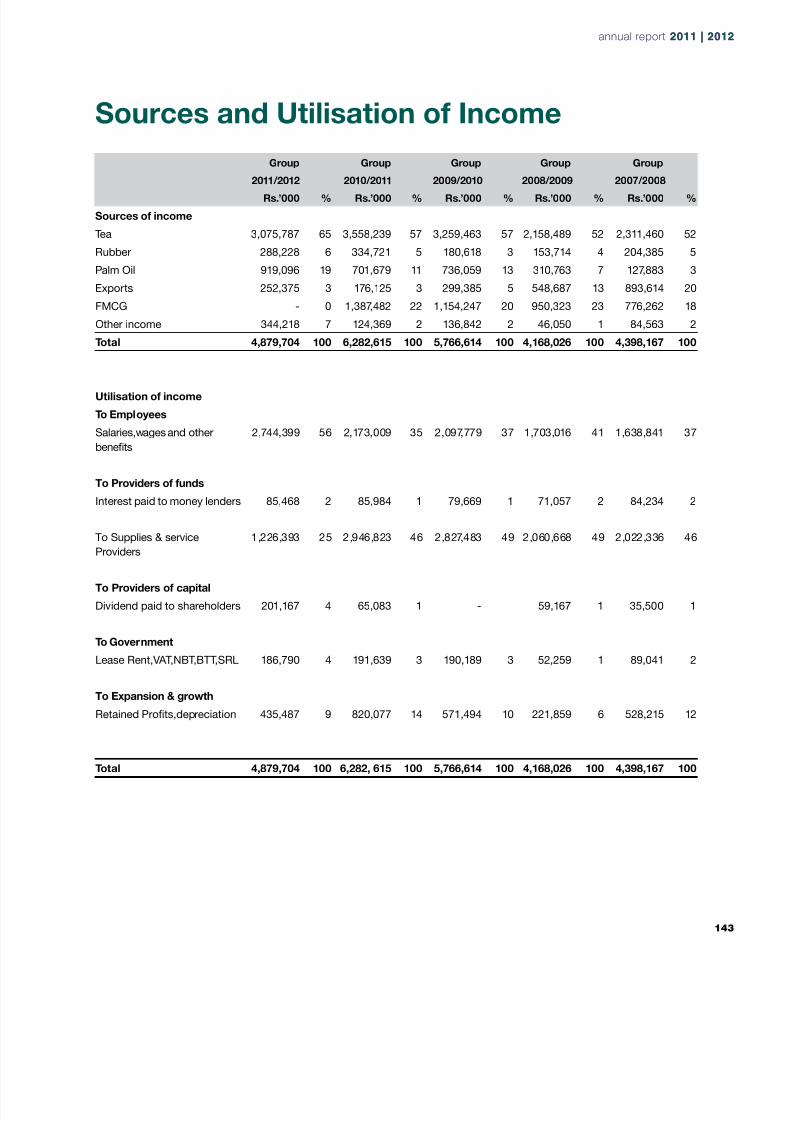
8/14/2019 Watawala Plantations 2011.2012.pdf
http://slidepdf.com/reader/full/watawala-plantations-20112012pdf 145/160

8/14/2019 Watawala Plantations 2011.2012.pdf
http://slidepdf.com/reader/full/watawala-plantations-20112012pdf 146/160
Estate Hectarage Statement
Total Cultivated Other Area Total Area Area (Ha) Area (Ha) Area (Ha)
TEAKenilworth 455.11 147.00 602.11Carolina 466.93 425.49 892.42Wigton 525.87 141.71 667.58Lonach 248.75 171.23 419.98Shannon 224.44 37.60 262.04WATAWALA REGION 1,921.10 923.03 2,844.13
Abbotsleigh 362.25 65.21 427.46Dickoya 512.62 116.97 629.59
Vellai Oya 570.15 269.85 840.00Strathdon 494.96 151.41 646.37HATTON REGION 1,939.98 603.44 2,543.42
Agrakande 206.25 22.50 228.75Henfold 484.05 55.95 540.00Lippakelle 216.00 71.50 287.50Ouvahkelle 198.87 40.88 239.75Tangakelle 313.78 54.01 367.79Waltrim 486.33 91.92 578.25LINDULA REGION 1,905.28 336.76 2,242.04
Homadola 108.91 423.11 532.02Talangaha 92.45 - 92.45UDUGAMA REGION 201.36 423.11 624.47
TOTAL TEA 5,967.72 2,286.34 8,254.06
RUBBERHomadola 307.19 - 307.19Nakiadeniya Rubber 569.19 126.57 695.76Talangaha 119.38 62.79 182.17Nakiadeniya Oil Palm 57.47 16.00 73.47TOTAL RUBBER 1,053.23 205.36 1,258.59
OIL PALMNakiadeniya Oil Palm 899.95 68.00 967.95Talangaha 424.80 - 424.80Nakiadeniya Rubber 1,005.04 1.50 1,006.54Homadola 528.07 - 528.07TOTAL OIL PALM 2,857.86 69.50 2,927.36
COMPANY TOTAL 9,878.81 2,561.20 12,440.01
Watawala Plantations PLC
144
Supplementary Information

8/14/2019 Watawala Plantations 2011.2012.pdf
http://slidepdf.com/reader/full/watawala-plantations-20112012pdf 147/160
Crops & Yields
PRODUCTION (KG’000) 15 Months
REGION 2011/ 2012
2010/ 2011
2009/ 2010
2008/ 2009
2007/ 2008
2006/ 2007
2005/ 2006
2004/ 2005
2003/ 2004
2002/ 2003
2001/ 2002
2000/ 2001
TEA
Watawala 2,245 2,364 2,189 2,076 2,156 1,654 2,127 2,047 2,058 2,498 2,284 2,656
Hatton 3,875 3,872 3,577 3,012 2,837 2,773 3,007 2,931 2,435 2,948 2,700 3,451
Lindula 2,388 2,513 2,359 2,174 2,250 1,981 2,447 2,606 2,603 2,751 2,543 3,532
Udugama 886 1,081 963 723 1,104 1,189 1,581 1,654 1,755 1,934 1,830 2,444
TEA 9,394 9,830 9,087 7,986 8,347 7,597 9,162 9,238 8,851 10,131 9,357 12,083
RUBBER 648 674 658 766 884 854 1,001 874 1,027 978 1,119 1,401
OIL PALM 6,584 5,080 6,164 6,162 5,671 7,563 7,330 6,244 4,644 4,557 4,156 4,540
YIELD PER HECTARAGE (KG) 15 Months
REGION 2011/
2012
2010/
2011
2009/
2010
2008/
2009
2007/
2008
2006/
2007
2005/
2006
2004/
2005
2003/
2004
2002/
2003
2001/
2002
2000/
2001
TEA
Watawala 1,262 1,209 1,152 1,158 1,152 1,062 1,372 1,346 1,397 1,611 1,595 2,088
Hatton 1,365 1,342 1,378 1,245 1,235 1,201 1,470 1,487 1,445 1,638 1,579 2,118
Lindula 1,343 1,396 1,295 1,235 1,267 1,258 1,382 1,332 1,330 1,623 1,544 2,195
Udugama 1,799 1,782 1,752 1,486 1,674 1,341 1,457 1,439 1,546 1,625 1,830 2,384
TEA 1,345 1,344 1,304 1,228 1,243 1,192 1,413 1,392 1,395 1,626 1,583 2,128
RUBBER 753 645 604 671 755 671 779 652 816 783 852 923
OIL PALM 3,156 2,391 2,973 2,908 2,734 2,781 2,814 2,512 2,321 2,609 2,755 3,044
annual report 2011 | 20annual report 2011 | 20
1

8/14/2019 Watawala Plantations 2011.2012.pdf
http://slidepdf.com/reader/full/watawala-plantations-20112012pdf 148/160
2002/03 2003/04 2004/05 2005/06 2006/07
In Rs.’000s
INCOME STATEMENT
Revenue 1,999,337 2,229,238 2,719,781 2,855,036 3,169,788
Gross prot 190,113 287,258 414,948 464,467 502,376
Other Operating income 36,538 28,992 45,287 55,101 76,946
Administrative expenses (67,800) (68,119) (78,910) (86,465) (92,054)
Distribution expenses (43,768) (66,967) (59,253) (71,702) (105,281)
Management fees (42,311) (50,365) (65,152) (60,702) (50,960)
Operating prot 72,772 130,799 256,920 300,699 330,826
Net nance cost (106,619) (98,549) (98,010) (89,819) (83,092)
Amortisation of negative goodwill 7,870 7,870 7,870 - -
Prot /(loss) before Tax (25,977) 40,120 166,780 218,893 247,734
Tax expense - - (4,973) (14,315) (26,034)
Prot /(loss) for the year (25,977) 40,120 161,807 204,578 221,700
Prot from discontinued operations
Attributable to:
Equity holders of the Company (25,977) 40,120 161,807 204,578 221,700
Minority interests - - - - -
Prot /(loss) for the year (25,977) 40,120 161,807 204,578 221,700
BALANCE SHEET
Non Current Assets
Leasedhold right to bare land of JEDB/SLPC estates 296,961 289,926 282,891 267,756 260,928
Immovable estate assets on nance lease 362,541 342,727 322,913 296,958 277,534
Tangible xed assets 551,833 567,670 606,811 656,823 722,453Immature-mature plantations 814,691 846,693 883,679 884,880 990,204
Investment in Gratuity Fund - - - - -
Investments 6,200 - - 205,820 203,416
Total Non Current Assets 2,032,226 2,047,016 2,096,294 2,312,237 2,454,535
Current Assets
Inventories 190,555 175,324 226,546 260,926 292,917
Trade and other receivables 226,473 241,478 293,021 340,306 336,986
Cash and cash equivalents 7,141 3,045 60,001 66,148 75,356
Total Current Assets 424,169 419,847 579,568 667,380 705,259
Total Assets 2,456,395 2,466,863 2,675,862 2,979,617 3,159,794
Capital and reseves
Stated capital 310,000 310,000 310,000 310,000 310,000
General reserve 150,000 150,000 150,000 150,000 150,000
Negative goodwill 116,087 108,217 100,347 92,477 -
Investment reserve - - - 147,926 146,030
Retained earnings 118,930 159,050 279,441 483,876 768,470
Total equity attributable to equity holders of the company 695,017 727,267 839,788 1,184,279 1,374,500
Minority interests - - - - -
Historical nancial information
Watawala Plantations PLC
146
Supplementary Information

8/14/2019 Watawala Plantations 2011.2012.pdf
http://slidepdf.com/reader/full/watawala-plantations-20112012pdf 149/160
2007/08 2007/08 2008/09 2008/09 2009/10 2009/10 2010/11 2010/11 2011/12 2011/12
Group Company Group Company Group Company Group Company Group Company
4,313,604 4,313,604 4,124,503 4,121,976 5,615,167 5,611,731 6,158,246 4,663,744 4,535,486 4,532,269
811,320 811,320 487,193 489,495 851,239 860,887 1,199,796 683,004 249,496 246,279
84,563 86,121 43,523 45,223 130,603 132,303 124,369 239,309 344,218 616,708
(128,637) (127,854) (138,479) (137,225) (164,099) (178,687) (342,364) (220,759) (211,331) (203,235)
(148,084) (148,084) (201,360) (200,981) (231,657) (231,375) (167,142) - - -
(75,427) (75,427) (35,112) (35,112) (75,798) (75,798) (90,033) (90,033) (49,331) (49,331)
543,735 545,671 155,765 161,400 510,288 507,330 724,626 611,521 333,052 610,421
(87,902) (87,902) (71,057) (71,415) (79,669) (79,711) (85,984) (84,951) (85,468) (85,468)
- - - - - - - - - -
455,833 457,769 84,708 89,985 430,619 427,619 638,642 526,570 247,584 524,953
(51,879) (51,879) (10,000) (10,000) (4,000) (4,000) 3,830 5,830 (4,755) (4,114)
403,954 405,890 74,708 79,985 426,619 423,619 642,472 532,400 242,829 520,839
169,756 -
404,438 - 76,026 - 429,900 - 642,468 - 412,585 520,839
484 - 1,318 - 3,281 - - - - -
403,954 - 74,708 - 426,619 - 642,472 532,400 412,585 520,839
261,788 261,788 254,753 254,753 247,718 247,718 240,683 240,683 233,648 233,648
265,062 265,062 247,415 247,415 229,768 229,768 212,121 212,121 194,474 194,474
885,477 879,626 1,068,101 1,062,527 1,486,213 1,478,604 1,769,768 1,651,504 1,710,115 1,710,1151,168,364 1,168,364 1,376,476 1,376,476 1,603,713 1,603,713 1,867,121 1,867,121 2,155,042 2,155,042
- - - - - - - - 42,641 42,641
- 10,781 - 16,125 - - - 355,852 - 852
2,580,691 2,585,621 2,946,745 2,957,296 3,567,412 3,559,803 4,089,693 4,327,281 4,335,920 4,336,772
540,488 534,023 351,370 342,092 540,583 540,583 797,068 568,427 516,085 516,085
439,337 441,303 525,966 530,740 464,611 471,112 488,783 312,649 325,724 343,808
90,434 86,134 73,615 67,920 53,442 52,369 40,697 15,061 470,231 447,716
1,070,259 1,061,460 950,951 940,752 1,058,636 1,064,064 1,326,548 896,137 1,312,040 1,307,609
3,650,950 3,647,081 3,897,696 3,898,048 4,626,048 4,623,867 5,416,241 5,223,418 5,647,960 5,644,381
310,000 310,000 310,000 310,000 310,000 310,000 310,000 310,000 310,000 310,000
150,000 150,000 150,000 150,000 150,000 150,000 150,000 150,000 150,000 150,000
- - - - - - - - - -
- - - - - - - -
1,137,408 1,138,860 1,154,267 1,159,678 1,584,167 1,583,297 2,160,686 2,050,614 2,372,104 2,370,286
1,597,408 1,598,860 1,614,267 1,619,678 2,044,167 2,043,297 2,620,686 2,510,614 2,832,104 2,830,286
3,110 3,571 - 290 - - - - -
Ten Years summary
annual report 2011 | 20annual report 2011 | 20
1
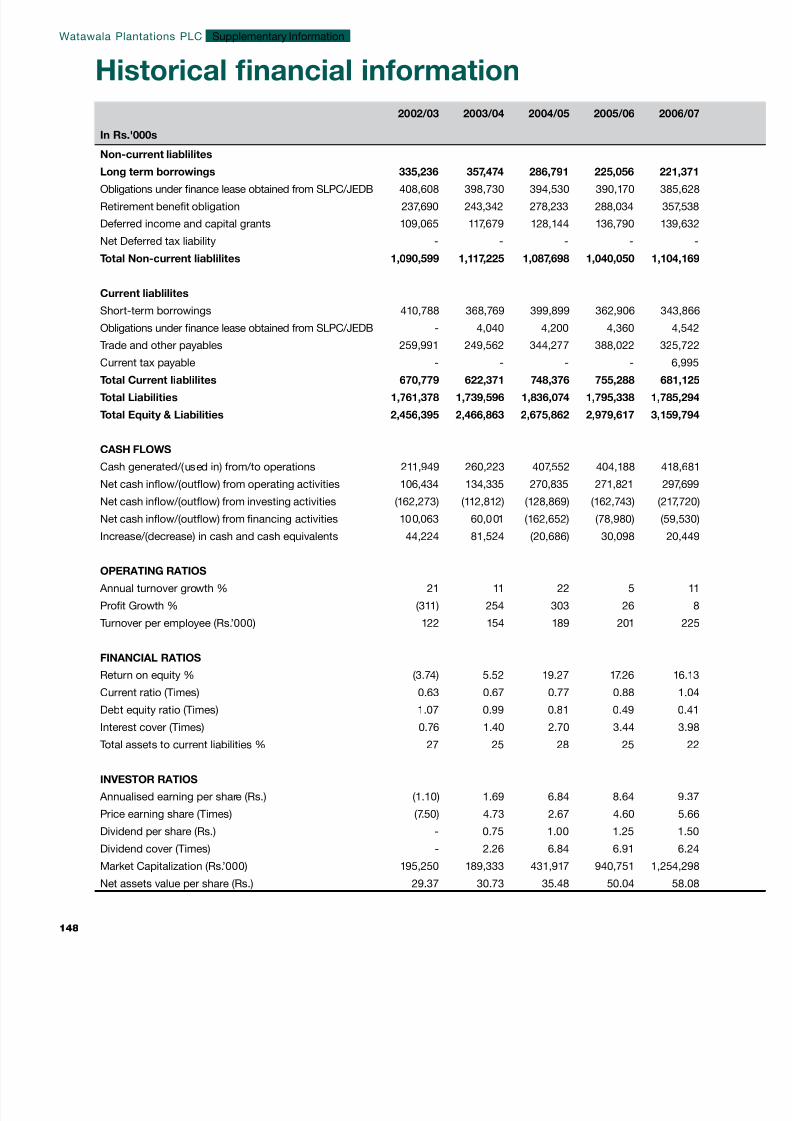
8/14/2019 Watawala Plantations 2011.2012.pdf
http://slidepdf.com/reader/full/watawala-plantations-20112012pdf 150/160
2002/03 2003/04 2004/05 2005/06 2006/07
In Rs.'000s
Non-current liablilites
Long term borrowings 335,236 357,474 286,791 225,056 221,371
Obligations under nance lease obtained from SLPC/JEDB 408,608 398,730 394,530 390,170 385,628
Retirement benet obligation 237,690 243,342 278,233 288,034 357,538
Deferred income and capital grants 109,065 117,679 128,144 136,790 139,632
Net Deferred tax liability - - - - -
Total Non-current liablilites 1,090,599 1,117,225 1,087,698 1,040,050 1,104,169
Current liablilites
Short-term borrowings 410,788 368,769 399,899 362,906 343,866
Obligations under nance lease obtained from SLPC/JEDB - 4,040 4,200 4,360 4,542
Trade and other payables 259,991 249,562 344,277 388,022 325,722
Current tax payable - - - - 6,995
Total Current liablilites 670,779 622,371 748,376 755,288 681,125
Total Liabilities 1,761,378 1,739,596 1,836,074 1,795,338 1,785,294
Total Equity & Liabilities 2,456,395 2,466,863 2,675,862 2,979,617 3,159,794
CASH FLOWS
Cash generated/(used in) from/to operations 211,949 260,223 407,552 404,188 418,681
Net cash inow/(outow) from operating activities 106,434 134,335 270,835 271,821 297,699
Net cash inow/(outow) from investing activities (162,273) (112,812) (128,869) (162,743) (217,720)
Net cash inow/(outow) from nancing activities 100,063 60,001 (162,652) (78,980) (59,530)
Increase/(decrease) in cash and cash equivalents 44,224 81,524 (20,686) 30,098 20,449
OPERATING RATIOS
Annual turnover growth % 21 11 22 5 11
Prot Growth % (311) 254 303 26 8
Turnover per employee (Rs.’000) 122 154 189 201 225
FINANCIAL RATIOS
Return on equity % (3.74) 5.52 19.27 17.26 16.13
Current ratio (Times) 0.63 0.67 0.77 0.88 1.04
Debt equity ratio (Times) 1.07 0.99 0.81 0.49 0.41
Interest cover (Times) 0.76 1.40 2.70 3.44 3.98
Total assets to current liabilities % 27 25 28 25 22
INVESTOR RATIOS
Annualised earning per share (Rs.) (1.10) 1.69 6.84 8.64 9.37
Price earning share (Times) (7.50) 4.73 2.67 4.60 5.66
Dividend per share (Rs.) - 0.75 1.00 1.25 1.50
Dividend cover (Times) - 2.26 6.84 6.91 6.24
Market Capitalization (Rs.’000) 195,250 189,333 431,917 940,751 1,254,298
Net assets value per share (Rs.) 29.37 30.73 35.48 50.04 58.08
Historical nancial information
Watawala Plantations PLC
148
Supplementary Information
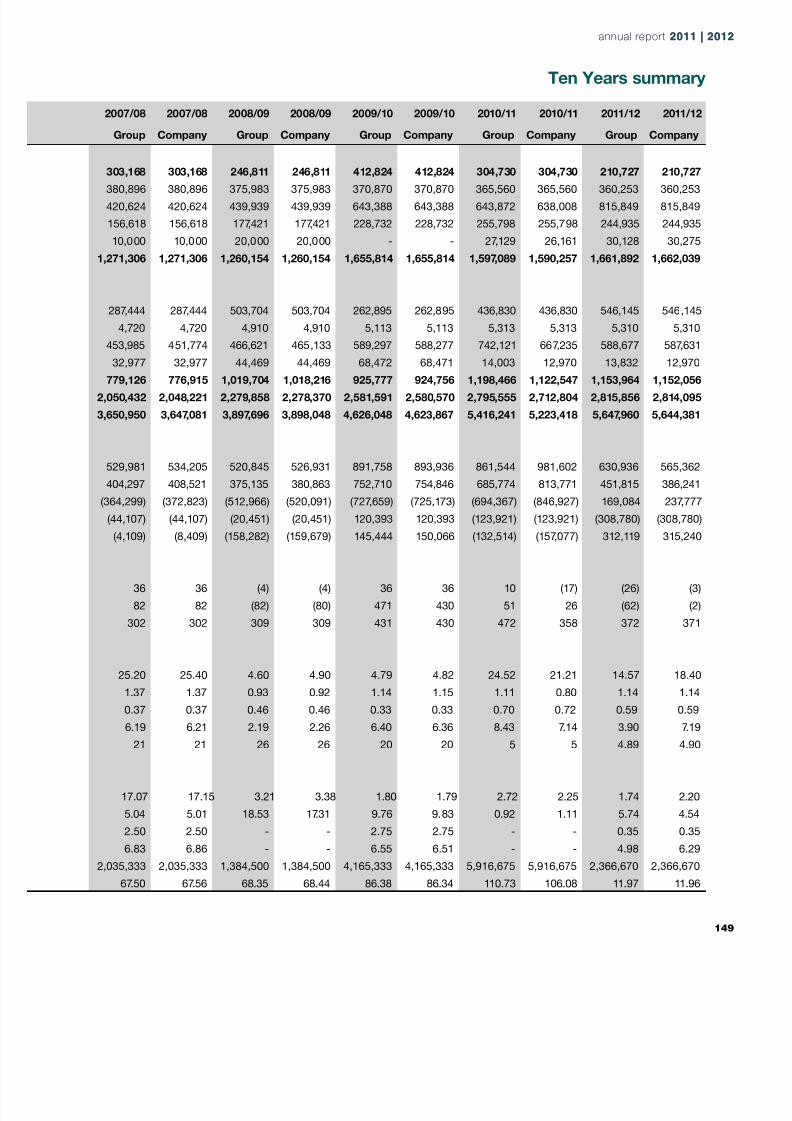
8/14/2019 Watawala Plantations 2011.2012.pdf
http://slidepdf.com/reader/full/watawala-plantations-20112012pdf 151/160
2007/08 2007/08 2008/09 2008/09 2009/10 2009/10 2010/11 2010/11 2011/12 2011/12
Group Company Group Company Group Company Group Company Group Company
303,168 303,168 246,811 246,811 412,824 412,824 304,730 304,730 210,727 210,727
380,896 380,896 375,983 375,983 370,870 370,870 365,560 365,560 360,253 360,253
420,624 420,624 439,939 439,939 643,388 643,388 643,872 638,008 815,849 815,849
156,618 156,618 177,421 177,421 228,732 228,732 255,798 255,798 244,935 244,935
10,000 10,000 20,000 20,000 - - 27,129 26,161 30,128 30,275
1,271,306 1,271,306 1,260,154 1,260,154 1,655,814 1,655,814 1,597,089 1,590,257 1,661,892 1,662,039
287,444 287,444 503,704 503,704 262,895 262,895 436,830 436,830 546,145 546,145
4,720 4,720 4,910 4,910 5,113 5,113 5,313 5,313 5,310 5,310
453,985 451,774 466,621 465,133 589,297 588,277 742,121 667,235 588,677 587,631
32,977 32,977 44,469 44,469 68,472 68,471 14,003 12,970 13,832 12,970
779,126 776,915 1,019,704 1,018,216 925,777 924,756 1,198,466 1,122,547 1,153,964 1,152,056
2,050,432 2,048,221 2,279,858 2,278,370 2,581,591 2,580,570 2,795,555 2,712,804 2,815,856 2,814,095
3,650,950 3,647,081 3,897,696 3,898,048 4,626,048 4,623,867 5,416,241 5,223,418 5,647,960 5,644,381
529,981 534,205 520,845 526,931 891,758 893,936 861,544 981,602 630,936 565,362
404,297 408,521 375,135 380,863 752,710 754,846 685,774 813,771 451,815 386,241
(364,299) (372,823) (512,966) (520,091) (727,659) (725,173) (694,367) (846,927) 169,084 237,777
(44,107) (44,107) (20,451) (20,451) 120,393 120,393 (123,921) (123,921) (308,780) (308,780)
(4,109) (8,409) (158,282) (159,679) 145,444 150,066 (132,514) (157,077) 312,119 315,240
36 36 (4) (4) 36 36 10 (17) (26) (3)
82 82 (82) (80) 471 430 51 26 (62) (2)
302 302 309 309 431 430 472 358 372 371
25.20 25.40 4.60 4.90 4.79 4.82 24.52 21.21 14.57 18.40
1.37 1.37 0.93 0.92 1.14 1.15 1.11 0.80 1.14 1.14
0.37 0.37 0.46 0.46 0.33 0.33 0.70 0.72 0.59 0.59
6.19 6.21 2.19 2.26 6.40 6.36 8.43 7.14 3.90 7.19
21 21 26 26 20 20 5 5 4.89 4.90
17.07 17.15 3.21 3.38 1.80 1.79 2.72 2.25 1.74 2.20
5.04 5.01 18.53 17.31 9.76 9.83 0.92 1.11 5.74 4.54
2.50 2.50 - - 2.75 2.75 - - 0.35 0.35
6.83 6.86 - - 6.55 6.51 - - 4.98 6.29
2,035,333 2,035,333 1,384,500 1,384,500 4,165,333 4,165,333 5,916,675 5,916,675 2,366,670 2,366,670
67.50 67.56 68.35 68.44 86.38 86.34 110.73 106.08 11.97 11.96
Ten Years summary
annual report 2011 | 20annual report 2011 | 20
1
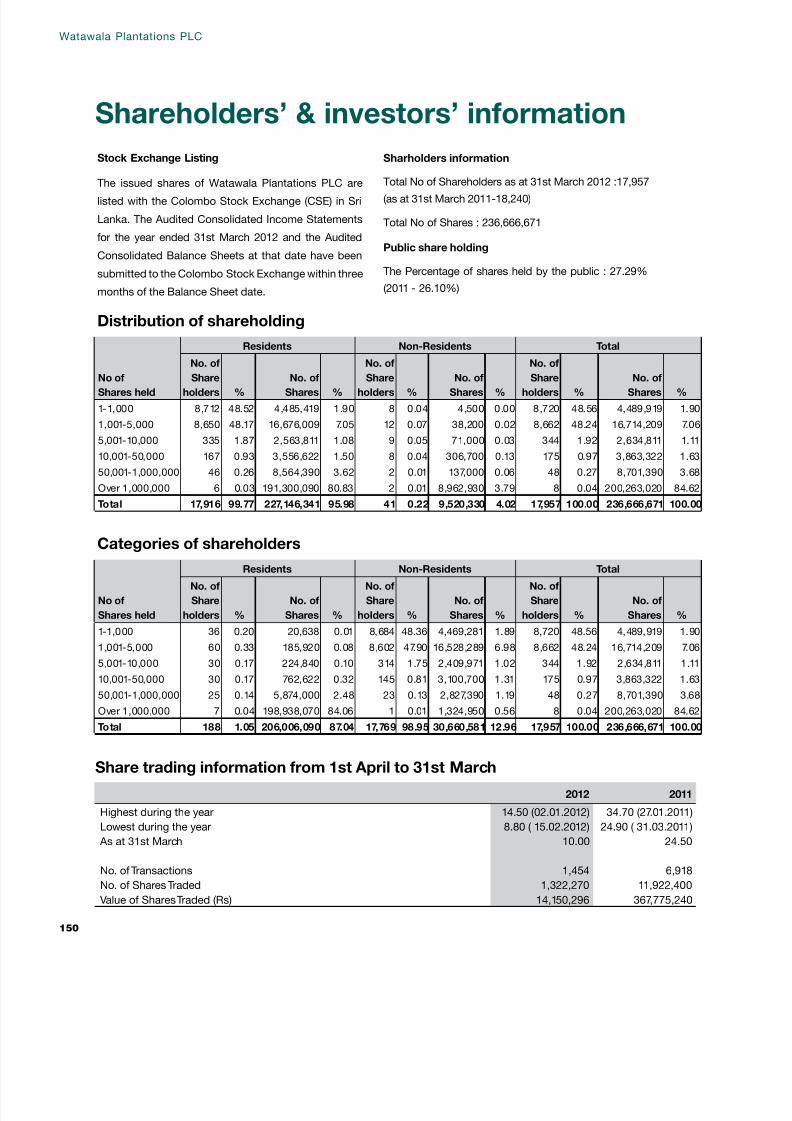
8/14/2019 Watawala Plantations 2011.2012.pdf
http://slidepdf.com/reader/full/watawala-plantations-20112012pdf 152/160
Shareholders’ & investors’ information
Stock Exchange Listing
The issued shares of Watawala Plantations PLC arelisted with the Colombo Stock Exchange (CSE) in Sri
Lanka. The Audited Consolidated Income Statements
for the year ended 31st March 2012 and the Audited
Consolidated Balance Sheets at that date have been
submitted to the Colombo Stock Exchange within three
months of the Balance Sheet date.
Sharholders information
Total No of Shareholders as at 31st March 2012 :17,957(as at 31st March 2011-18,240)
Total No of Shares : 236,666,671
Public share holding
The Percentage of shares held by the public : 27.29%
(2011 - 26.10%)
Distribution of shareholding
Share trading information from 1st April to 31st March
Categories of shareholders
No of
Shares held
Residents Non-Residents Total
No. of
Share
holders %
No. of
Shares %
No. of
Share
holders %
No. of
Shares %
No. of
Share
holders %
No. of
Shares %
1-1,000 8,712 48.52 4,485,419 1.90 8 0.04 4,500 0.00 8,720 48.56 4,489,919 1.90
1,001-5,000 8,650 48.17 16,676,009 7.05 12 0.07 38,200 0.02 8,662 48.24 16,714,209 7.06
5,001-10,000 335 1.87 2,563,811 1.08 9 0.05 71,000 0.03 344 1.92 2,634,811 1.11
10,001-50,000 167 0.93 3,556,622 1.50 8 0.04 306,700 0.13 175 0.97 3,863,322 1.63
50,001-1,000,000 46 0.26 8,564,390 3.62 2 0.01 137,000 0.06 48 0.27 8,701,390 3.68
Over 1,000,000 6 0.03 191,300,090 80.83 2 0.01 8,962,930 3.79 8 0.04 200,263,020 84.62
Total 17,916 99.77 227,146,341 95.98 41 0.22 9,520,330 4.02 17,957 100.00 236,666,671 100.00
No of
Shares held
Residents Non-Residents Total
No. of
Share
holders %
No. of
Shares %
No. of
Share
holders %
No. of
Shares %
No. of
Share
holders %
No. of
Shares %
1-1,000 36 0.20 20,638 0.01 8,684 48.36 4,469,281 1.89 8,720 48.56 4,489,919 1.90
1,001-5,000 60 0.33 185,920 0.08 8,602 47.90 16,528,289 6.98 8,662 48.24 16,714,209 7.06
5,001-10,000 30 0.17 224,840 0.10 314 1.75 2,409,971 1.02 344 1.92 2,634,811 1.11
10,001-50,000 30 0.17 762,622 0.32 145 0.81 3,100,700 1.31 175 0.97 3,863,322 1.63
50,001-1,000,000 25 0.14 5,874,000 2.48 23 0.13 2,827,390 1.19 48 0.27 8,701,390 3.68
Over 1,000,000 7 0.04 198,938,070 84.06 1 0.01 1,324,950 0.56 8 0.04 200,263,020 84.62
Total 188 1.05 206,006,090 87.04 17,769 98.95 30,660,581 12.96 17,957 100.00 236,666,671 100.00
2012 2011
Highest during the year 14.50 (02.01.2012) 34.70 (27.01.2011)
Lowest during the year 8.80 ( 15.02.2012) 24.90 ( 31.03.2011)
As at 31st March 10.00 24.50
No. of Transactions 1,454 6,918
No. of Shares Traded 1,322,270 11,922,400
Value of Shares Traded (Rs) 14,150,296 367,775,240
Watawala Plantations PLC
150

8/14/2019 Watawala Plantations 2011.2012.pdf
http://slidepdf.com/reader/full/watawala-plantations-20112012pdf 153/160
Twenty (20) largest shareholders as at
Share trading information- last ve years
Market capitalization (Bn)
Name
31st March 2012 31st March 2011
No of
Shares held
% of the
holding
No of
Shares held
% of the
holding
Estate Management Services (Pvt) Ltd 127,216,340 53.75 127,216,340 53.75Mouldex Limited 44,855,100 18.95 44,820,700 18.94
Bank of Ceylon A/C Ceybank Unit Trust 17,903,700 7.56 17,846,400 7.54
Aureos South Asia Fund LLC 6,962,930 2.94 6,962,930 2.94
HSBC International Nominees LTD-SSBT-Deustche Bank 2,000,000 0.85 2,000,000 0.85
K.C.Vignarajah 1,324,950 0.56 1,174,500 0.50
Vyjayanthi & Company Limited 1,000,000 0.42 1,000,000 0.42
S.N.M.Semasinghe 545,100 0.23 595,500 0.25
National Savings Bank 419,500 0.18 242,400 0.10
Bank of Ceylon A/C Ceybank No.1 Account 350,100 0.15 350,100 0.15
M.I.Abdul Hameed 350,000 0.15 350,000 0.15
Lexinton Holdings (Pvt) Ltd 323,600 0.14 323,600 0.14
Mrs. S.Vignaraj 319,489 0.13 250,000 0.11
Cocoshell Activated Carbon Company Ltd 293,600 0.12 293,600 0.12
Con Investments (Pvt) Ltd 293,000 0.12 293,000 0.12
Con Management Services (Pvt) Ltd 293,000 0.12 293,000 0.12
Anverally and sons (Pvt) Ltd 257,100 0.11 247,100 0.10
Mr.P.L.A. Waniganayake 255,700 0.11 - -
Merchant Bank of Sri Lanka Limited 250,000 0.11 250,000 0.11
Perera and Sons (Bakers) Limited 250,000 0.11 250,000 0.11
ACL Plastics Ltd - 200,000 0.08
Sub Total 205,463,209 86.82 204,959,170 86.60Others 31,203,462 13.18 31,707,501 13.40
Grand Total 236,666,671 100.00 236,666,671 100.00
2011/12 2010/11 2009/10 2008/09 2007/08 2006/07
Highest during the year 14.50 34.70 192.00 88.50 107.00 65.00
Lowest during the year 8.80 24.90 53.25 42.50 45.00 30.50
As at 31st March 10.00 24.90 176.00 58.50 86.00 53.00
No. of shares 236,666,671 236,666,671 23,666,668 23,666,668 23,666,668 23,666,668
Year Rs. Bn.
2011/2012 2.37
2010/2011 5.89
2009/2010 4.17
2008/2009 1.38
2007/2008 2.04
2006/2007 1.25
annual report 2011 | 20annual report 2011 | 20
1

8/14/2019 Watawala Plantations 2011.2012.pdf
http://slidepdf.com/reader/full/watawala-plantations-20112012pdf 154/160
ACCOUNTING POLICIES
The specic principles, bases, conventions, rules, and
practices adopted by an enterprise in preparing and
presenting Financial Statements.
ACCRUAL BASIS
Recording revenues & expenses in the period in which
they are earned or incurred regardless of whether cash
is received or disbursed in that period.
GSA
The Gross Sales Average. This is the average sales price
obtained (over a period of time, for a kilo of produce)
before any deductions such as Brokerage, etc.
NSA
The Net Sales Average. This is the average sale price
obtained (over a period of time) after deducting
Brokerage fees, etc.
COP
The Cost of Productions. This generally refers to the
cost of producing per kilo of produce (Tea /Rubber /
Palm Oil)
AMORTISATION
The systematic allocation of the depreciable amount ofan intangible asset over its useful life.
EBITDA
Earning before interest, tax, depreciation and
amortization.
VALUE ADDITIONS
The quantum of wealth generated by the activities of
the company and its application.
EARNING PER SHARE – EPS
Prot attributable to ordinary shareholders divided by
the number of ordinary shares in ranking for dividend.
ENTERPRISE VALUE – EV
Market Capitalization plus Debt, Minority Interest &
Preferred shares minus total Cash & Cash equivalents.
ENTERPRISE MULTIPLE – EM
Enterprise Value (EV) divided by Earnings before Interest
Tax Depreciation & Amortization (EBITDA)
Glossary
MARKET VALUE ADDED – MVA
Shareholder funds divided by the market value of
shares
PRICE EARNINGS RATIO - PE
Market Price of a share divided by earnings per share.
MARKET CAPITALIZATION
Number of Shares issues multiplied by the market value
of each share at the year end.
NET ASSETS
Sum of xed Assets and Current Assets less total
liabilities.
NET ASSETS PER SHARE
Net Assets at he end of the period divided by the
number of Ordinary Shares in issues.
RETURN ON EQUITY
Attributable prots divided by average shareholders’
funds.
INTEREST COVER
Prot before tax plus interest charges divided by
interest charges, including interest capitalized.
DIVIDEND COVER
Prot attributable to shareholders divided by gross
dividend.
DIVIDENT PAYOUT
Prot paid out to share holders as dividends as a
percentage of prots made during the year.
RELATED PARTIES
Parties who could control or signicantly inuence the
nancial and operating policies of the Company.
CONTINGENT LIABILITIES
Conditions or situations at the balance sheet date, thenancial effects of which are to be determined by future
events, which may or may not occur.
WORKING CAPITAL
Current assets exclusive of liquid funds and interest-
bearing nancial receivables less operating liabilities
and non-interest-bearing provisions.
Supplementary InformationWatawala Plantations PLC
152

8/14/2019 Watawala Plantations 2011.2012.pdf
http://slidepdf.com/reader/full/watawala-plantations-20112012pdf 155/160
TOTAL BORROWINGS
Total borrowings consist of interest-bearing liabilities,
fair-value derivatives, accrued interest expenses and
prepaid interest income, and trade receivables with
recourse.
NET BORROWINGS
Total borrowings less liquid funds.
CASH EQUIVALENTS
Liquid investments with original maturities of three
months or less.
CURRENT RATIO
Current Assets divided by current liabilities
DEBT TO EQUITY RATIO
Borrowing divided by equity
GERAING RATIO
Interest bearing Capital divided by total Capital (interest
bearing an non interest bearing)
TURNOVER PER EMPLOYEE
Consolidated turnover of the company for the year
divided by the number of employees employed at the
year end.
EXTENT IN BEARING
The extent of land. From which crop is being harvested.
Also see “Immature Plantation”
CROP
The total produce harvested during a nancial year
FIELD
An unit extent of land. Estates are divided into elds in
order to facilitate management.
IMMATURE PLANTATIONS
The extent of plantation that is under-development andis not being harvested.
MATURE PLANTATIONS
The extent of plantation from which crop is being
harvested. Also see “Extent in Bearing”.
IN FILLING
A method of eld development whereby planting of
individual plants is done in order to increase the yield
of a given eld, whilst allowing the eld to be harvested.
REPLANTING
A method of eld development where an entire unit of
land is taken out of “bearing” and developed by way of
uprooting the existing trees/bushes and replanting with
new trees/bushes.
VP TEA
The average crop per unit extent of land over a given
period of time (usually Kgs. per hectare per year)
Yield (YPH)
The average crop per unit extent of land over a given
period of time (usually Kgs. Per hectare per year)
TASL
Tea Association of Sri Lanka
ISO
International Standards Organization
HACCP
Hazard Analysis Critical Control Point System.
Internationally accepted food safety standard.
5S
A Japanese management technique on the organization
of the workplace. 5s stands for Seiri (Sorting),
Seiton (Organizing), Seiso (Cleaning), Seiketso
(Standardization), Shitsuke (Sustenance).
annual report 2011 | 20annual report 2011 | 20
1

8/14/2019 Watawala Plantations 2011.2012.pdf
http://slidepdf.com/reader/full/watawala-plantations-20112012pdf 156/160
NOTICE is hereby given that the nineteenth (19th)
Annual General Meeting of Watawala Plantations PLC
will be held at the “Park Premier Banquet Hall” at Excel
World, No 338, T.B.Jaya Mawatha, Colombo 10 on
Friday 06th July 2012 at 10.00 a.m. and the business to
be brought before the meeting will be:
1. To consider and adopt the Annual Report of the
Board of Directors and the Statement of Accounts
for the Financial year ended 31st March 2012 with
the Auditors’ Report thereon.
2. To re-appoint Mr. R.K. Krishnakumar, who retires
having attained the age of seventy four years and
the Company has received a special notice to pass
the under noted ordinary resolution in compliance
with section 211 of the Companies Act No.07 of
2007 in relation to his appointment.
Ordinary Resolution
“That Mr. R.K. Krishnakumar a retiring Director who has
attained the age of seventy four years be and is hereby
re-appointed a Director of the Company and it is hereby
declared that the age limit of seventy years referred to
in Section 210 of the Companies Act No.07 of 2007shall not apply to the appointment of the said Director”
3. To re-appoint Mr.A.N.Fernando as per article 28
(2) of the Articles of Association, who has been
appointed by the Board, since the last Annual
General Meeting, a Director.
4. To re-elect Mr. P. T. Siganporia who retires by
rotation at the Annual General Meeting, a Director
5. To re-elect Mr. B. A. Hulangamuwa who retires by
rotation at the Annual General Meeting, a Director
6. To re-elect Mr. G. Sathasivam who retires by
rotation at the Annual General Meeting, a Director
7. To declare a Dividend of Rs.0.35 per share as
recommended by the Directors.
8. To re-appoint Messrs. PricewaterhouseCoopers as
Auditors and authorize the Directors to determine
their remuneration
9. To authorize the Directors to determine
contributions to Charities.
By order of the Board
Secretaries & Financial Services (Pvt) Ltd.,
Secretaries, Watawala Plantations PLC.,
Colombo
17/05/2012
We shall be obliged if the Shareholders/ proxiesattending the Annual General Meeting, produce
their National Identity card to the Security Personnel
stationed at the entrance
Notice of Meeting
Watawala Plantations PLC
154
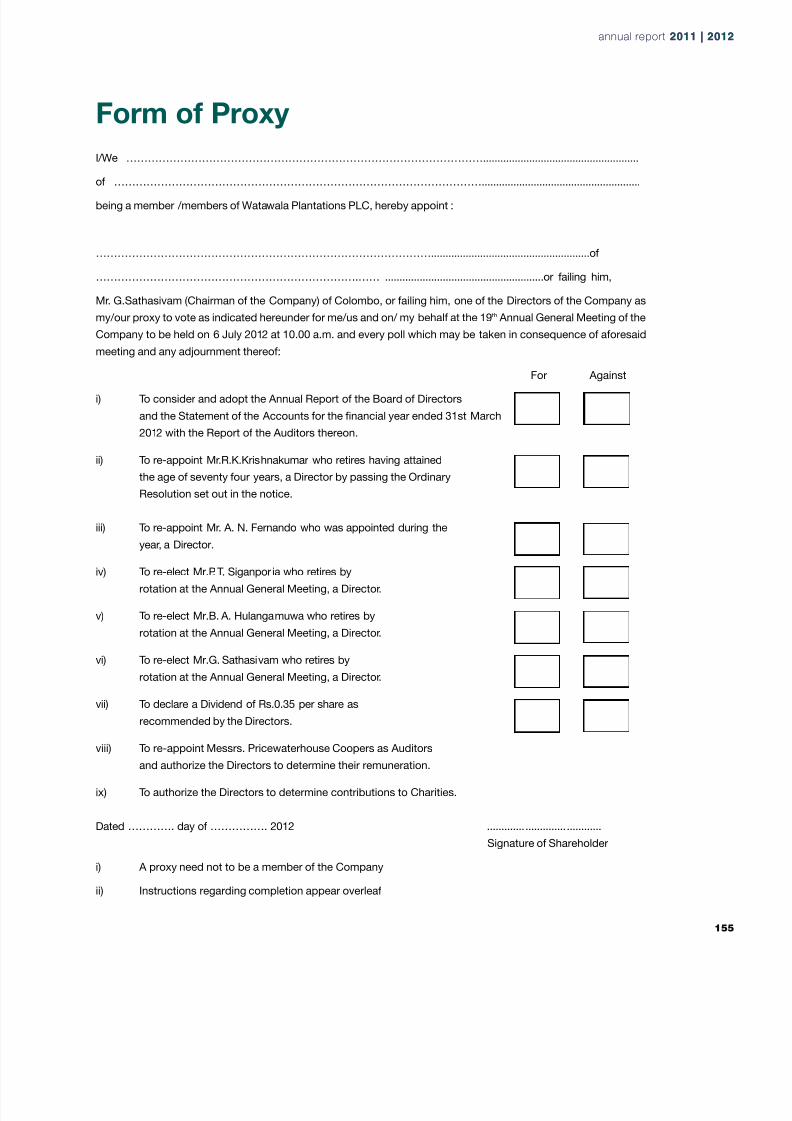
8/14/2019 Watawala Plantations 2011.2012.pdf
http://slidepdf.com/reader/full/watawala-plantations-20112012pdf 157/160
Form of Proxy
I/We ………………………………………………………………………………………......................................................
of ………………………………………………………………………………………….......................................................
being a member /members of Watawala Plantations PLC, hereby appoint :
………………………………………………………………………………….......................................................of
……………………………………………………………….…… .......................................................or failing him,
Mr. G.Sathasivam (Chairman of the Company) of Colombo, or failing him, one of the Directors of the Company as
my/our proxy to vote as indicated hereunder for me/us and on/ my behalf at the 19th Annual General Meeting of the
Company to be held on 6 July 2012 at 10.00 a.m. and every poll which may be taken in consequence of aforesaid
meeting and any adjournment thereof:
For Against
i) To consider and adopt the Annual Report of the Board of Directors
and the Statement of the Accounts for the nancial year ended 31st March
2012 with the Report of the Auditors thereon.
ii) To re-appoint Mr.R.K.Krishnakumar who retires having attained
the age of seventy four years, a Director by passing the Ordinary
Resolution set out in the notice.
iii) To re-appoint Mr. A. N. Fernando who was appointed during the
year, a Director.
iv) To re-elect Mr.P. T. Siganporia who retires by
rotation at the Annual General Meeting, a Director.
v) To re-elect Mr.B. A. Hulangamuwa who retires by
rotation at the Annual General Meeting, a Director.
vi) To re-elect Mr.G. Sathasivam who retires by
rotation at the Annual General Meeting, a Director.
vii) To declare a Dividend of Rs.0.35 per share as
recommended by the Directors.
viii) To re-appoint Messrs. Pricewaterhouse Coopers as Auditors
and authorize the Directors to determine their remuneration.
ix) To authorize the Directors to determine contributions to Charities.
Dated …………. day of ……………. 2012 .......................................
Signature of Shareholder
i) A proxy need not to be a member of the Company
ii) Instructions regarding completion appear overleaf
annual report 2011 | 20annual report 2011 | 20
1
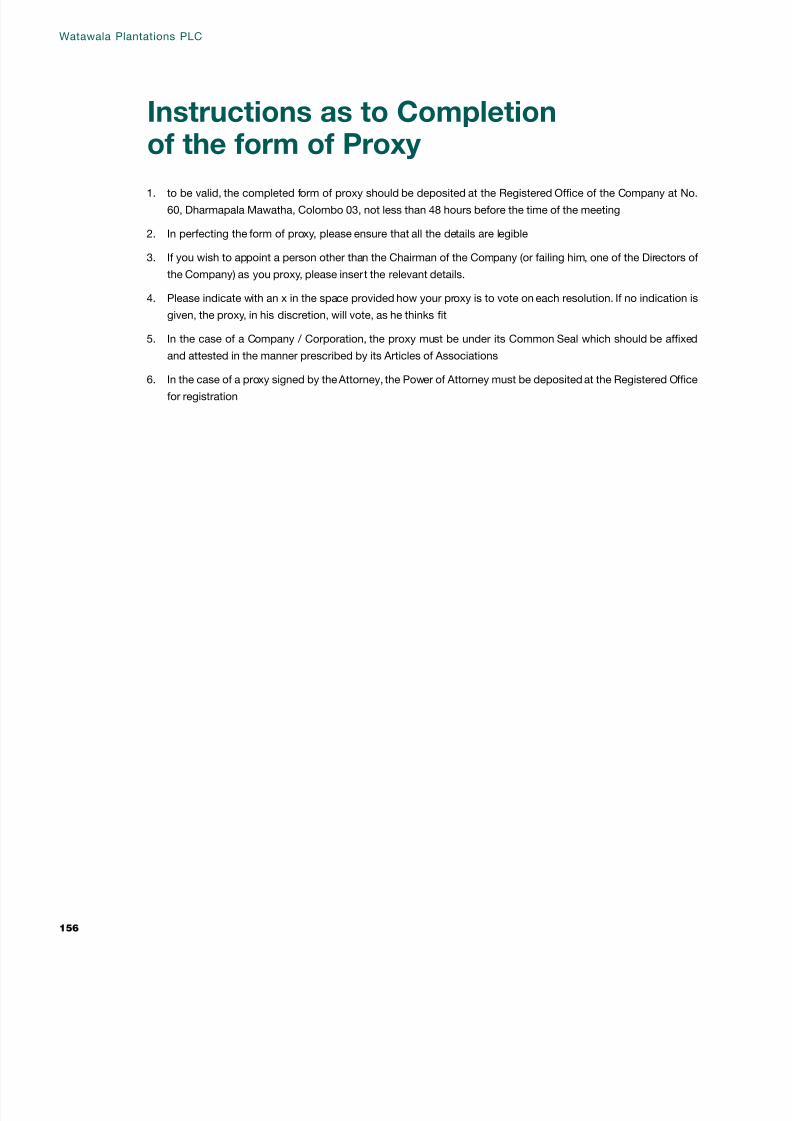
8/14/2019 Watawala Plantations 2011.2012.pdf
http://slidepdf.com/reader/full/watawala-plantations-20112012pdf 158/160
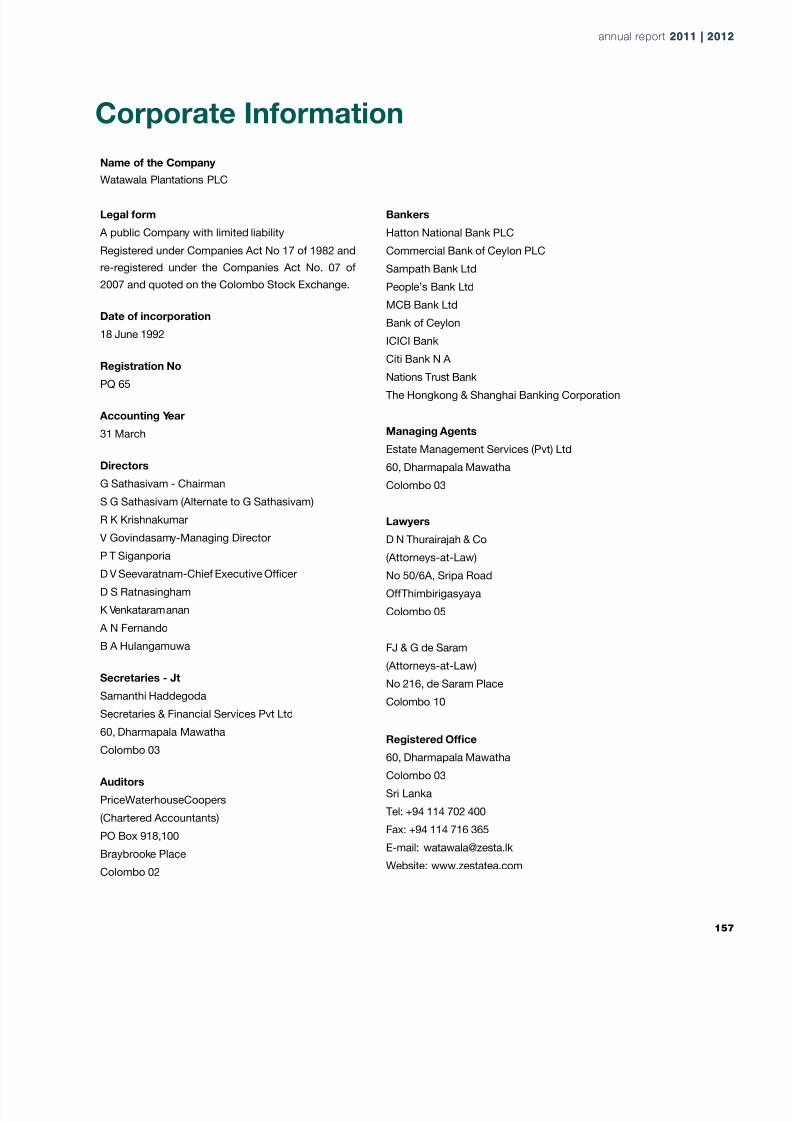
8/14/2019 Watawala Plantations 2011.2012.pdf
http://slidepdf.com/reader/full/watawala-plantations-20112012pdf 159/160
Name of the Company
Watawala Plantations PLC
Legal form
A public Company with limited liability
Registered under Companies Act No 17 of 1982 and
re-registered under the Companies Act No. 07 of
2007 and quoted on the Colombo Stock Exchange.
Date of incorporation
18 June 1992
Registration NoPQ 65
Accounting Year
31 March
Directors
G Sathasivam - Chairman
S G Sathasivam (Alternate to G Sathasivam)
R K Krishnakumar
V Govindasamy-Managing Director
P T Siganporia
D V Seevaratnam-Chief Executive Ofcer
D S Ratnasingham
K Venkataramanan
A N Fernando
B A Hulangamuwa
Secretaries - Jt
Samanthi Haddegoda
Secretaries & Financial Services Pvt Ltd
60, Dharmapala Mawatha
Colombo 03
Auditors
PriceWaterhouseCoopers
(Chartered Accountants)
PO Box 918,100
Braybrooke Place
Colombo 02
Bankers
Hatton National Bank PLC
Commercial Bank of Ceylon PLC
Sampath Bank Ltd
People’s Bank Ltd
MCB Bank Ltd
Bank of Ceylon
ICICI Bank
Citi Bank N A
Nations Trust Bank
The Hongkong & Shanghai Banking Corporation
Managing Agents
Estate Management Services (Pvt) Ltd
60, Dharmapala Mawatha
Colombo 03
Lawyers
D N Thurairajah & Co
(Attorneys-at-Law)
No 50/6A, Sripa Road
Off Thimbirigasyaya
Colombo 05
FJ & G de Saram
(Attorneys-at-Law)
No 216, de Saram Place
Colombo 10
Registered Ofce
60, Dharmapala Mawatha
Colombo 03
Sri Lanka
Tel: +94 114 702 400
Fax: +94 114 716 365
E-mail: [email protected]
Website: www.zestatea.com
Corporate Information
annual report 2011 | 20annual report 2011 | 20
1

8/14/2019 Watawala Plantations 2011.2012.pdf
http://slidepdf.com/reader/full/watawala-plantations-20112012pdf 160/160


