

1
Water Scarcity and Irrigation Efficiency in Egypt Rehab Osman1, Emanuele Ferrari2, Scott McDonald3
Water Economics and Policy (WEP)
Disclaimer: the views expressed are purely those of the authors and may not in any circumstances be regarded as stating an official position of the European Commission.
1 Corresponding author, Senior Lecturer in Economics, Oxford Brookes University, Oxford, OX33 1HX,
UK, Tel: +44 (0)1865 485964, [email protected] 2 Scientific Officer, European Commission, Joint Research Centre (JRC), Institute for Prospective
Technological Studies (IPTS), Edificio Expo, Inca Garcilaso 3, 41092 Seville, Spain, Tel: +34 954-488461, [email protected]
3 Visiting Professor, Institute of Agricultural Policy and Markets, University of Hohenheim, 70593 Stuttgart, Germany, [email protected]

2
Water Scarcity and Irrigation Efficiency in Egypt
Abstract
This study provides quantitative assessments of the impacts of efficiency
enhancement for different types of irrigation water under water scarcity
conditions. It employs a single country CGE (STAGE 2) model calibrated to an
extended version of a recently constructed SAM for Egypt 2008/09. The SAM
segments the agricultural accounts by season and by irrigation scheme,
including Nile- and groundwater-dependent as well as rain-fed agricultural
activities. The simulations show that Egypt should manage potential reductions
in the supply of Nile water with more efficient irrigation practices which
increase the productivity of Nile water, groundwater and irrigated land. The
results suggest a more ambitious plan to boost irrigation efficiency for summer
rice would be desirable in order to outweigh any potential shrinkage in output
and exports. Furthermore, even doubling all non-conventional water resources
is not sufficient to compensate the potential adverse impacts of Nile water
losses. This highlights the importance of irrigation efficiency for the Egyptian
economy.
Key Words: Water Availability, Irrigation Efficiency, Agricultural
Productivity, Egypt, Computable General Equilibrium (CGE) Models.
JEL: Q25, Q15, O55, C68
3
1. Introduction
Egypt faces a serious water scarcity issue that is made more critical by current economic and
population growth rates, and its almost total reliance on the Nile for water. Water availability
per capita, at around 1,000 m3 per year, is already one of the lowest in the world. This is
expected to halve by 2025 and thus fall below the scarcity rate. Moreover, with the rapidly
increasing population, the per capita renewable water share has declined from 853.5 m3 in
2002 to 785.4 m3 in 2007 and to 722.2 m3 in 2012, and is predicted to reach 534 m3 by 2030
(FAO, 2014). Consequently, not only does Egypt face a crisis of scarcity, it also faces a major
environmental problem.
The Nile provides 95% of Egypt’s fresh water. Irrigated agriculture absorbs 85% of
Egypt’s annual water resources, which is equivalent to 89% of Nile water, with the remaining
15% is used by industry and households. However, Egypt’s historic 66% share of Nile
waters4 is under negotiation with upstream countries demanding greater use of these waters.
In April 2011, Ethiopia launched the construction of the Grand Ethiopian Renaissance Dam
(GERD). The GERD will be the biggest hydroelectric power plant, with an energy generation
capacity of 6,000 megawatts (MW), and one of the largest water reservoirs in Africa, with a
water storage capacity of 63 billion cubic metres (BCM). Egyptian experts estimate a possible
water reduction of 11-19 BCM over the dam’s filling period, which is equivalent to 20-34%
water reduction when the filling period overlaps with the dry season.
Reductions in Egypt’s fresh water resources will have significant impacts on agriculture
and the economy as a whole, which makes a reassessment of the productivity of irrigation
water and land, as well as the efficiency of the overall irrigation system, a critical issue.
This paper reports the potential implications of reductions in water resources and
enhancements in irrigation efficiency using a single-country Computable General Equilibrium
(CGE) model that has been customised to encompass production, consumption and
distributional impacts. The model is calibrated with a Social Accounting Matrix (SAM) for
Egypt 2008/09 that has detailed water accounts. The SAM treats water as a factor of
production used by three water activities: Nile water, groundwater and rain-fed agricultural
activities. It also has detailed seasonal irrigation accounts. This seasonality is accounted for
by distinguishing irrigation using (agricultural) activities, not only by irrigation scheme but 4 Sudan also claims rights to 22% of the Nile waters, which only leaves 12% for upstream countries.
4
also by irrigation season. Nile water, groundwater, land irrigated by Nile water, land irrigated
by groundwater and rain-fed land are segmented by irrigation season.
The simulation results address several key questions. How large are the potential effects
of Nile water reductions on the agricultural sector and the economy? What are the necessary
enhancements in irrigation efficiency required to compensate for the potential losses of Nile
water? Is investing in securing non-conventional water resources a viable alternative strategy
to one of improving irrigation efficiency?
The rest of the paper is organised as follows. Section 2 describes the existing irrigation
scheme and resources, and provides a context for this study in relation to prior studies of
Egypt. The SAM database and the model development are detailed in Section 3, while
Section 4 explains the simulations and model configurations used in this study. Analysis of
the results is reported in Section 5, with the results from sensitivity analyses reported in
Section 6. The paper ends with concluding comments.
2. Water and the Egyptian Economy
Where irrigation is common, water for irrigation purposes typically accounts for the largest
share of demand for water and hence irrigation is a major topic in natural resources and
environmental economics and applied water policy analysis. The use of irrigation water has
been modelled using partial and general equilibrium models and micro-macro modelling at
country and global levels (see Dudu & Chumi, 2008; Ponce et al. 2012 and Dinar, 2014 for
reviews). Recent literature demonstrates that CGE models are well equipped to examine the
economy-wide impacts of water-related policy reforms, and the macro impacts of issues like
water scarcity and irrigation policies and investments. This is because CGE models are
flexible enough to include water both as a production factor and as a consumption
commodity. Moreover, an economy-wide approach allows consideration of the effects of
water use on all economic sectors, not only agriculture, and the evaluation of indirect effects
due to changes in water supply and/or policies. However, the available surveys note that
irrigation, water allocation and agricultural productivity are under-explored in the research
and policy literature.

5
2.1 Water and Irrigation
Egypt only receives rainfall along a narrow strip in the northern coastal area where the
average rainfall does not exceed 200 mm and is subject to appreciable temporal variability.
Egypt relies on the Nile and groundwater as primary sources of water. The Nile accounts for
83% (51.7 BCM/year) of Egypt’s irrigation water, while groundwater is the second largest
source with 11% (5.2 BCM/year). In addition, Egypt makes use of small amounts of drainage
(3.7 BCM/year) and treated sewage (1.5 BCM/year) water. Egypt is currently using close to
its total volume of available water, except for groundwater where 11.3 BCM is available, see
Table 1.
Groundwater is mainly located in the Nile aquifer system as well as the Western Desert
region and Sinai. Nile water is replenished through leakages from the irrigation system
alongside the Nile Valley and Nile Delta forming a Nile-reliant source of groundwater with
an annual abstraction rate of 4.6 BCM. The Nubian Sandstone aquifer system, in the Western
Desert, is another main source of groundwater in Egypt. The annual extraction rate from this
non-renewable aquifer is 0.5 BCM (El Arabi, 2012).
Table 1: Available and Used Irrigation Water Resources
Billion m3/Annum % Billion m3/Annum %
Nile Water 51.70 82.59 55.50 75.20
Groundwater 5.20 8.30 11.30 15.30
Drainage Water 3.70 5.91 5.00 6.80
Treated Sewage Water 1.50 2.40 1.50 2.03Rain 0.50 0.80 0.50 0.67
Total 62.60 73.80
Usage AvailabilitySource
Source: compiled by the authors from different sources.
Keller & Keller (1995, p. 6) note that “Egypt’s Nile Valley irrigation system (NVIS) is
an excellent example of a multiple use-cycle system with a high global efficiency but low
local efficiencies”. The enduring nature of this paradox reflects the historic division of the
Nile waters and the control of Nile waters made possible by the Aswan dams. Year-round
availability of water and major reductions in seasonal floods were made possible by the
Nasser Lake reservoir, from which annual flows of 56 BCM are sourced.
6
Irrigated land is heavily concentrated in the Nile Valley and Nile Delta, which accounts
for 85% of the 8.7 million feddans of Egyptian irrigated land.5 Groundwater is used for 11%
of irrigated agricultural production, primarily in the Sinai, Western North Coast (Matruh),
Western Desert and New Valley regions, where it is the sole source of water. Rain-fed
agriculture is limited to the Mediterranean shore, with around 250,000 feddans in Sinai and
150,000 feddans in the Western North Coast dependent on seasonal rains.
Egypt follows a multi-cropping system with up to three crops a year. Crops are rotated
across three irrigation seasons: winter (November-May), summer (May-September) and Nili,
i.e. Nile flood, (September–November). The main crops are wheat, berseem and broad beans
(winter season), cotton and rice (summer season) and maize and millet (flood season). This
system enhances land productivity: berseem and broad beans are nitrogen-fixing legumes
which improve fertility before cotton, which is more demanding on the soil, is planted in
summer.
The bulk of irrigated land, however, depends on a low-efficiency surface (flood)
irrigation scheme: a technology that requires large quantities of cheap water – the Nile waters.
The surface irrigation scheme causes high water losses, declining land productivity,
waterlogging and salinity problems (Karajeh et al. 2011). Moreover, poor agricultural
practices and irrigation management affect the quality of the country’s water resources.
Reductions in irrigation water quality have damaged irrigated soils and crops due to, amongst
other things, increased salinity. These problems have been recognised and hence “one of the
main components of the agricultural development strategy is to achieve a gradual
improvement of the efficiency of irrigation systems to reach 80 per cent in an area of 8 m
feddans, and to reduce the areas planted to rice from 1.673 m feddan (2007) to 1.3 m feddan
by 2030 in order to save an estimated 12 400 million cubic meters of water” (FAO 2013, p.
13).
Other non-conventional water resources are recycled drainage water and treated sewage
water. Annual drainage water use in agriculture is estimated to be 3.7 BCM, with the
potential to reach 5 BCM. Drainage water is evenly mixed with Nile water and used to
irrigate 450, 000 feddans in North Sinai. Treated sewage water used in irrigation amounts to
1.5 BCM/year, with estimates that it will account for 2.4 BCM/year by 2027.
5 Feddan is a non-metric measurement unit of land area used in Egypt, inter alia. A feddan is equivalent to 1.037 acres, 0.420 hectares or 4,220 m2.

7
2.2 Previous Studies of Water and Irrigation in Egypt
Water scarcity in Egypt and the associated socio-economic and political factors, e.g.
population, food demand, economic growth, climate change and debates over the allocation
of the Nile's waters, have been discussed widely in the literature (Gohar & Ward, 2010).
CGE models have been used to examine the economic implications of water
availability, e.g. as part of climate change impact analysis (Strzepek et al. 1995; Yates &
Strzepek, 1996 and Yates & Strzepek, 1998), while some studies consider variability in water
supply and the economic value of reducing variability. Strzepek & Yates (2000) use a
recursive dynamic CGE model to examine impacts of changes in the Nile River on the
Egyptian economy to the year 2060, while Strzepek et al. (2008) use a comparative static
CGE model to evaluate the economy-wide impacts of the High Aswan Dam on the Egyptian
economy.6 The study specifies water as a nested Constant Elasticity of Substitution (CES)
production function through a fixed land-water technology. Also, it explicitly specifies a risk
premium. The results show a negative impact of the dam on summer crops.
Another strand of the literature explores different approaches for maximizing irrigation
water efficiency in Egypt. Gohar & Ward (2011) examine the economic efficiency impacts of
different irrigation water allocation policies in Egypt. They show that flexible irrigation
patterns across locations, seasons and crops could improve the irrigation water efficiency.
Bader (2004), applying a mathematical programming approach, claims that there is scope for
improving farms' returns through the optimisation of irrigation water use and improved
irrigation efficiency, which generate increases in farm income and crop production.
The effect of fiscal reforms, in the form of removing subsidies and taxes, were
examined subject to physical supply constraints for both water and land (Robinson &
Gehlhar, 1995a). The first order conditions for water and land constraints are given by linear
cost functions with an explicit maximand, which ensured that at least one of the two
constraints is binding. The same model was used to investigate the impacts of establishing a
market for water and water pricing policies for the agricultural sector in Egypt (Robinson &
Gehlhar, 1995b). More recently, He et al. (2004) have examined the impact of water pricing
6 For a detailed description of the economic, social and environmental impacts of the High Aswan Dam,
see Abu-Zeid & El-Shibini (1997).
8
and taxation policies on water efficiency in Egypt. The study employs a static partial
equilibrium Agricultural Sector Model of Egypt (ASME).
3. Data and Model
3.1 An Extended SAM for Egypt 2008/09
A SAM provides a consistent framework, within which all expenditures and incomes for the
agents in the economy are recorded. A SAM is a square matrix where each agent is
represented by a column (expenditure) and a row (income) that record, respectively, each
agent’s expenditures and incomes. The SAM used for this study is an extension of a SAM for
Egypt in 2008/09 (Osman et al. 2015a). The latter includes disaggregated agricultural
activities and factors across different irrigation seasons, with Nile irrigation water represented
as a separate production factor.7
The extended version of the SAM is based on national accounts and supply/use tables
with 102 accounts: 54 activities, 16 commodities, 19 factors, 5 institutions, and 4 tax
instruments, as well as trade margins, savings/investment, rest of the world and total
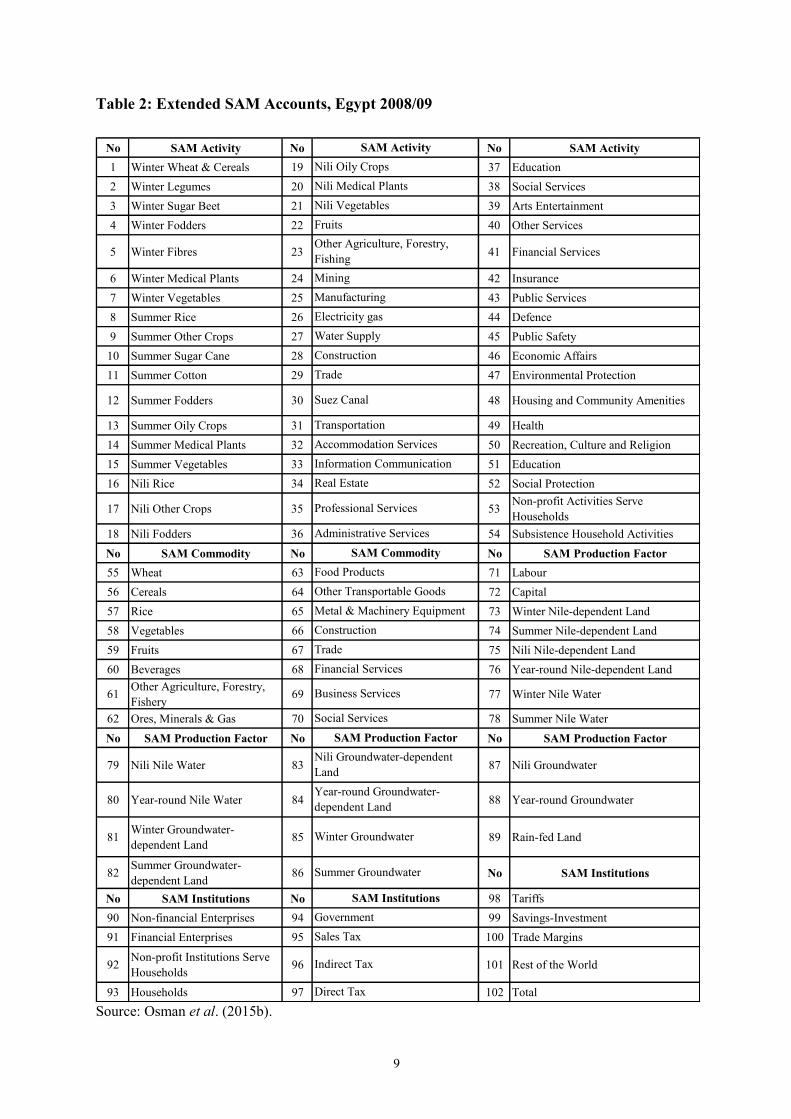
accounts. The accounts are listed in Table 2.8 This extended SAM makes three contributions:
distinguishing agricultural activities and factors by irrigation season, introducing groundwater
irrigation schemes and representing rain-fed agricultural activities.
Water and irrigated land are segmented by irrigation season, i.e. winter, summer, and
Nili, as well as year-round, and by type of water. During the SAM construction process,
detailed data on physical Nile water and land usage, differentiated by crop and season, were
compiled from the Annual Bulletin of Irrigation and Water Resources Statistics, 2008
(CAPMAS, 2009). These data were used to estimate values for Nile water, which were then
deducted from rental prices for irrigated land.
7 A stochastic variant of the cross-entropy (CE) method was used to estimate the SAM; this variant was
developed by Robinson & McDonald (2006). For descriptions of the CE method, see Robinson et al. (1998), Robinson & El-Said (2000) and Robinson et al. (2001).
8 The production factor accounts numbered 81-89 in Table 2 are those added to the SAM reported in Osman et al. (2015a).
9
Table 2: Extended SAM Accounts, Egypt 2008/09
No SAM Activity No No SAM Activity1 Winter Wheat & Cereals 19 37 Education2 Winter Legumes 20 38 Social Services3 Winter Sugar Beet 21 39 Arts Entertainment4 Winter Fodders 22 40 Other Services
5 Winter Fibres 23 41 Financial Services
6 Winter Medical Plants 24 42 Insurance7 Winter Vegetables 25 43 Public Services8 Summer Rice 26 44 Defence9 Summer Other Crops 27 45 Public Safety
10 Summer Sugar Cane 28 46 Economic Affairs11 Summer Cotton 29 47 Environmental Protection
12 Summer Fodders 30 48 Housing and Community Amenities
13 Summer Oily Crops 31 49 Health14 Summer Medical Plants 32 50 Recreation, Culture and Religion15 Summer Vegetables 33 51 Education16 Nili Rice 34 52 Social Protection
17 Nili Other Crops 35 53 Non-profit Activities Serve Households
18 Nili Fodders 36 54 Subsistence Household ActivitiesNo SAM Commodity No No SAM Production Factor55 Wheat 63 71 Labour56 Cereals 64 72 Capital57 Rice 65 73 Winter Nile-dependent Land58 Vegetables 66 74 Summer Nile-dependent Land59 Fruits 67 75 Nili Nile-dependent Land60 Beverages 68 76 Year-round Nile-dependent Land
61 Other Agriculture, Forestry, Fishery 69 77 Winter Nile Water
62 Ores, Minerals & Gas 70 78 Summer Nile WaterNo SAM Production Factor No No SAM Production Factor
79 Nili Nile Water 83 87 Nili Groundwater
80 Year-round Nile Water 84 88 Year-round Groundwater
81 Winter Groundwater-dependent Land 85 89 Rain-fed Land
82 Summer Groundwater-dependent Land 86 No SAM Institutions
No SAM Institutions No 98 Tariffs90 Non-financial Enterprises 94 99 Savings-Investment91 Financial Enterprises 95 100 Trade Margins
92 Non-profit Institutions Serve Households 96 101 Rest of the World
93 Households 97 102 Total
Construction
Trade
SAM Institutions
Sales Tax
SAM Production FactorNili Groundwater-dependent LandYear-round Groundwater-dependent Land
Winter Groundwater
Summer Groundwater
Suez Canal
TransportationAccommodation Services
SAM ActivityNili Oily CropsNili Medical PlantsNili VegetablesFruitsOther Agriculture, Forestry, Fishing
Professional Services
Administrative ServicesSAM Commodity
Trade
Food Products
MiningManufacturingElectricity gasWater SupplyConstruction
Other Transportable GoodsMetal & Machinery Equipment
Government
Indirect Tax
Direct Tax
Information CommunicationReal Estate
Financial Services
Business Services
Social Services
Source: Osman et al. (2015b).
10
Groundwater is introduced as another type of irrigation water, using data on
groundwater and land irrigated by groundwater. Subsequently, Nile- and groundwater-
dependent agricultural activities are distinguished. Due to lack of data on groundwater
production costs, factor payments per unit of land area are assumed to be common across
crops irrigated by Nile water and groundwater. For example, intermediate inputs and factor
payments required to cultivate a feddan of Nile-dependent vegetables in the summer are the
same for a feddan of groundwater-dependent vegetables in the summer. Using water and land
requirements, production costs for groundwater-dependent crops are then estimated.
Rain-fed land is distinct from irrigated land and used to produce seasonal crops.
Therefore, gross operating surplus is segmented between factor to capital used for crops
produced on rain-fed land and payments to rain-fed land.
For consistency, groundwater-dependent activities and rain-fed activities follow the
same seasonal classification as Nile-dependent activities. As such, activity accounts for crops
irrigated by groundwater and for rain-fed crops are synchronised and segmented by irrigation
season, i.e. winter, summer, and Nili, as well as year-round.
3.2 Main Economic Features
Agriculture in Egypt accounts for more than 10% of GDP, 8% of total labour payments and
13% of exports. The economy has a strong industrial base which makes up 40% of GDP, of
which 30% is sourced from manufacturing activities. Services are the main activity,
contributing almost half of GDP. Public services account for more than 7% of GDP with
public employment providing a substantial share of the total (36%).
Vegetable production contributes 23% of agricultural output evenly spread over the
winter and summer seasons and uses some 6% of Nile water in each of the irrigation seasons.
The ‘Wheat & Cereals’ sector represents 13% of agricultural production, and is one of the
main users of Nile land (almost 30%), and uses a tenth of Nile water. Fodder crop growing
represents another 13% of agricultural production and is an intensive user of Nile water (more
than 17%).
Rice accounts for more than 6% of agricultural output, with a substantial share of rice
production exported; contributing more than 10% of total agricultural exports. Rice is water-
intensive: it uses more than 30% of irrigation Nile water and more than half of the summer’s
11
Nile water. It is cultivated mainly in the summer season with only 0.4% of output grown in
the Nili season.
Factor intensities by activity reflect the prevailing technology while factor allocations
represent factor usage across activities, see Table A1 and Table A2. These two indicators are
essential for understanding potential changes in factor rents and the consequent changes in
factor allocations after a policy shock. Vegetables have the lowest Nile water intensity ratios
(ranging 1-3% for seasonal vegetables) see Table A1; the contrast with summer rice (21%
Nile water) and summer sugar cane (13% Nile water) is marked. As such, the vegetables
sectors employ small shares of Nile water (6.3%) and Nile-dependent land (21%), see Table
A2.
Nile water/land accounts for 15% of total agricultural value added and 90% of that for
irrigated agriculture. Groundwater and land irrigated by groundwater have small shares in
agricultural value added (less than 2%) and in irrigated agriculture (8%).
The water supply activity (SAM activity account number 27) mainly provides water for
non-agricultural uses. This water supply service is presented in the SAM as part (2%) of the
utilities distribution services (SAM commodity account number 67).
3.3 CGE Model
The model is a comparative static variant developed of the single-country CGE STatic
Applied General Equilibrium (STAGE 2) model,9 to encompass the characteristics of the
Egyptian agricultural and irrigation systems. Specifically, the production system has been
extended to include derived demand for Nile water and land, as well as other sources of
irrigation water. An important feature of the model is the modelling of agriculture; activities
are defined by their distinctive characteristics whose output mixes are responsive to changes
in the prices of outputs.
Production Specification
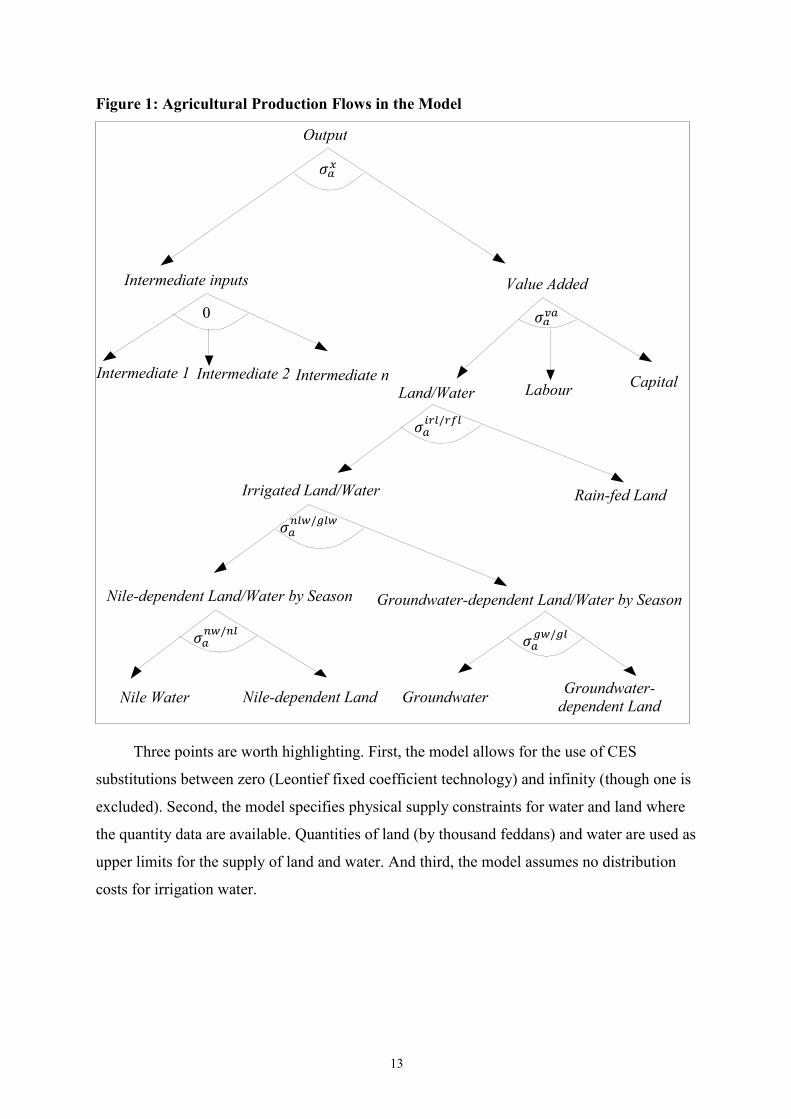
Production relationships for agricultural activities are specified through five levels of nested
CES functions (Figure 1). At the top level, value added and intermediate demand are
combined using a CES aggregator. At the second level, CES production technology specifies 9 The STAGE 2 model is described in detail in McDonald (2007) and McDonald & Thierfelder (2015).
The model is a descendant of the USDA ERS model (Robinson et al. 1990). Luckmann & McDonald (2014) provide a detailed technical documentation for the STAGE_W CGE model.

12
the aggregate value added for each activity as a function of primary inputs: capital, labour and
a composite of land and water. The land/water composite is an aggregate formed by the third,
fourth and fifth level functions.
At the bottom, fifth, level, natural water and land factors are combined in two CES
aggregators – one each for Nile-dependent and for groundwater-dependent activities. For
agricultural activities producing the same crop, water and land productivities vary according
to their irrigation systems. For each irrigation season, both types of water and land are mobile
across crops subject to changes in the ratios of rents. These two CES aggregators (Nile
land/water and groundwater land/water) are (CES) aggregated at the fourth level to form the
irrigated land/water composite. The latter is (CES) aggregated with rain-fed land at the third
level to form the land/water composite.
The study uses estimates for elasticity values from the literature. The elasticity of
substitution between intermediate demand and value added (σax) is set to be 2 while the
elasticity of substitution between production factors (σava) is equal to 0.8 for all sectors. These
elasticity values, given the lack of precise estimation of parameters for Egypt, in general, and
with the disaggregation required by the SAM employed in this study particularly, are
considered as cautious guesstimates for this case study. Calzadilla et al. (2011) estimated the
elasticity of substitution between irrigation water and irrigated land for 15 world regions. This
is based on the price elasticity of water use derived from Rosegrant et al. (2002). Thus, the
applied elasticities of substitution between water and land (𝜎𝑎𝑖𝑟𝑙/𝑟𝑓𝑙, 𝜎𝑎
𝑛𝑙𝑤/𝑔𝑙𝑤, 𝜎𝑎𝑛𝑤/𝑛𝑙 and
𝜎𝑎𝑔𝑤/𝑔𝑙) have a value of 0.06. Systematic sensitivity analyses are used to evaluate the
sensitivity of the results to the assumed elasticities.
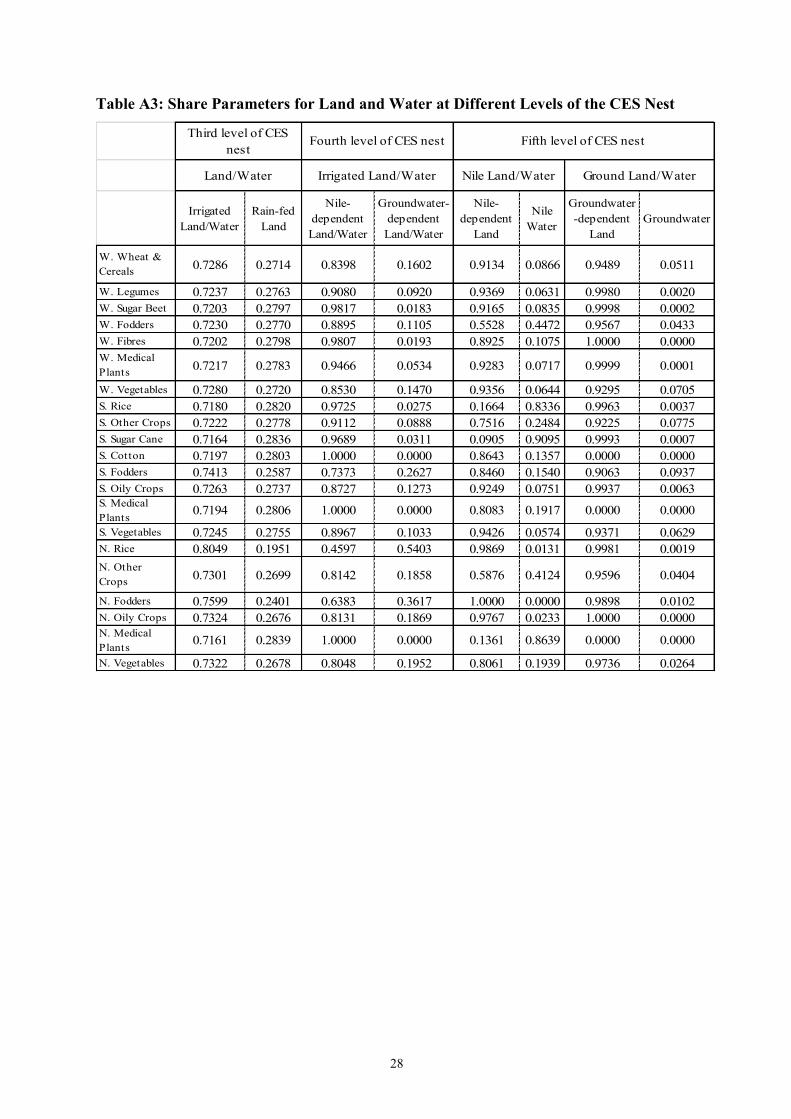
Each agricultural activity has a distinct cost structure and it has been demonstrated
(Devarajan et al. 1990) that substitution possibilities depend on elasticities and share
parameters. The latter are determined by cost structures. Table A3 presents the values of share
parameters for different types of water and land at the third, fourth and fifth levels of the
production nest.
13
Figure 1: Agricultural Production Flows in the Model
Three points are worth highlighting. First, the model allows for the use of CES
substitutions between zero (Leontief fixed coefficient technology) and infinity (though one is
excluded). Second, the model specifies physical supply constraints for water and land where
the quantity data are available. Quantities of land (by thousand feddans) and water are used as
upper limits for the supply of land and water. And third, the model assumes no distribution
costs for irrigation water.
Output
Labour
Nile-dependent Land/Water by Season
Capital
𝜎𝑎𝑥
Intermediate inputs Value Added
Nile-dependent Land Nile Water
Intermediate n
Groundwater-dependent Land/Water by Season
Irrigated Land/Water
Groundwater Groundwater-
dependent Land
Land/Water
Rain-fed Land
Intermediate 1 Intermediate 2
𝜎𝑎𝑣𝑎
𝜎𝑎𝑖𝑟𝑙/𝑟𝑓𝑙
𝜎𝑎𝑛𝑙𝑤/𝑔𝑙𝑤
𝜎𝑎𝑔𝑤/𝑔𝑙
𝜎𝑎𝑛𝑤/𝑛𝑙
14
4. Simulations
4.1 Scenarios
Four main scenarios are reported, see Table 3. The first scenario (N-Wtr Loss) represents the
upper limit of the potential reduction in Egypt’s share of Nile water due to filling of the
GERD reservoir. A 34% reduction in Nile water supply is evenly spread across irrigation
seasons, under the implicit assumption that Lake Nasser will be used to manage water
availability.
Table 3: Simulation Scenarios
Scenario Code Scenario Description Water Scarcity 1. N-Wtr Loss 34% reduction in Nile water supply over the whole year Irrigation Efficiency or Water Compensation? 2. Irrg-Eff 30% increase in irrigation efficiency
Nile Irrg-Eff 30% increase in Nile-dependent irrigation efficiency Ground Irrg-Eff 30% increase in groundwater-dependent irrigation efficiency
3. X-Wtr Gain 95% increase in non-conventional irrigation water resources Irrigation Efficiency under Water Scarcity
4. N-Wtr Loss & Irrg-Eff 30% increase in irrigation efficiency & 34% reduction in Nile water supply
Scenarios two and three simulate alternative policies that Egypt can follow. They
address the important question of whether Egypt should work on improving the efficiency of
existing water resources or on securing more water from non-conventional sources. Hence,
the second scenario (Irrg-Eff) considers improvements in irrigation efficiency specified as
external shocks that increase the flow of services from a given quantity of water. At the fourth
level of the production nest, Nile land/water and groundwater land/water productivities are
assumed to increase by 30%.10 To clarify the interpretation of the determinants of the result,
this scenario is decomposed into two components according to the source of the simulated
irrigation efficiency: Nile-dependent irrigation (Nile Irrg-Eff) and groundwater-dependent
irrigation (Ground Irrg-Eff). The scenario does not specify the source of funding for the
simulated improvements in irrigation efficiency, e.g. government expenditures on research
and development are not explicitly specified.
10 This improvement in irrigation efficiency is based on a pre-simulation scenario, specified to
endogenously quantify changes in efficiency required to offset the water losses keeping agricultural output unchanged. The results imply that a 30% improvement in irrigation efficiency is virtually sufficient to offset the agricultural output reductions from potential Nile water losses.
15
The third scenario (X-Wtr Gain) assumes, ceteris paribus, more non-conventional water
resources are secured to compensate for the simulated reductions in Nile water. It represents
the case in which Nile water reductions are compensated for by increases in recycled drainage
water and treated sewage water; the estimated potential (average) increase in these water
resources is 95%.11 Due to lack of data, an increase in groundwater is simulated as a proxy for
potential increases in all other non-conventional water resources. Groundwater used in
irrigation is roughly equivalent to both recycled drainage and treated sewage water combined
(Table 1). This scenario simulates a 95% increase in groundwater supply across different
irrigation seasons.12
The fourth, and main, scenario (N-Wtr Loss & Irrg-Eff) combines the simulated 34%
reduction in Nile water with the 30% improvement in irrigation efficiency. This
comprehensive scenario provides quantitative assessments for the impact of quality
enhancements of different types of irrigation water under water scarcity conditions.
4.2 Model Closure Rules
Egypt is a small country in the world market; thus world prices for exports and imports are
fixed. The current account balance is fixed at its initial level (in foreign currency units), and
the exchange rate adjusts to clear the external balance. This is a typical choice for developing
economies where foreign credit is limited and fixing the external balance reflects economic
reality.
The model adopts an investment-driven closure in that saving rates adjust to generate
the required funds to finance the base year investment. The combination of exogenous
investments and foreign savings, known as Johansen closure, avoids the misleading change in
household welfare due to change in foreign savings and investments in a single-period model
(Lofgren et al., 2002).
11 This is weighted according to their current shares of irrigation water. 12 Note that any costs associated with this change are not included within the model. Luckmann et al.,
(2014) explores implications of water as a produced commodity, while Luckmann et al., (2016) explores the limits on water recycling.
16
Capital is mobile and fully employed (medium-run closure rule), while labour is
mobile, albeit with underemployment. Underemployment in labour markets is the most
reasonable assumption in a country where the unemployment rate is constantly above 10%.
Water and land, for both Nile-dependent and groundwater-dependent activities, are fully
employed, but season-specific. For the purposes of this study, water and land supply are fixed
for each irrigation season. Thus, water and land are mobile across agricultural activities
within each irrigation season but not across different seasons. This specification implies that
water and land will have distinct seasonal prices. The model solves for water and land
seasonal prices that ensure efficient allocation of water and land across crops cultivated in the
same season.
5. Simulation Results
5.1 Macroeconomic Impacts
Reductions in the availability of Nile water (the N-Wtr Loss scenario) produce minor
negative macroeconomic impacts (Table 4). These are offset by increases in the irrigation
efficiency scenario, which generate around 0.5% increases in GDP and absorption, while
potential increases in non-traditional water resources induce trivial positive macroeconomic
impacts.13
The positive impacts under the Irrg-Eff scenario imply that the 30% improvements in
irrigation efficiency are sufficient to offset the macroeconomic loss due to the 34% reduction
in Nile water supply. This is confirmed by the results of the combined water reduction and
irrigation (N-Wtr Loss & Irrg-Eff) scenario. The results are primarily driven by the
enhancement in Nile-dependent irrigation efficiency. Consequently, the results suggest that
the macroeconomic implications of reductions in the availability of Nile water are less than
may be feared and that the inevitable, but small, negative consequences can be more than
offset by enhancements to irrigation efficiency.
13 An alternative scenario, where irrigation efficiency is improved by only 15%, exactly compensates for
the negative macroeconomic impacts generated by the reduction in Nile water availability, with no changes in GDP and absorption.

17
Table 4: Macroeconomic Indicators (Real percentage change)
Nile Irrg-Eff Ground Irrg-Eff Irrg-Eff
Private Consumption -0.30 0.53 0.03 0.55 0.02 0.26
Government Consumption 0.03 -0.06 0.00 -0.06 0.00 -0.03
Investment Spending -0.13 0.22 0.01 0.23 0.02 0.10
Absorption -0.23 0.41 0.02 0.43 0.02 0.20
Import Demand -0.16 0.11 0.00 0.10 0.04 -0.07
Export Supply -0.25 0.23 0.00 0.24 0.06 -0.03
GDP (Expenditure Side) -0.26 0.45 0.02 0.47 0.02 0.22
Total Domestic Production -0.32 0.56 0.03 0.59 0.02 0.27
Total Intermediate Inputs
-0.42 0.72 0.04 0.75 0.02 0.34
Irrigation Efficiecny N-Wtr Loss & Irrg-EffN-Wtr Loss X-Wtr Gain
However, the extent to which these macroeconomic consequences are likely to be
realised and the impacts on agricultural activities and farmers need to be assessed.
5.2 Sector-specific Impacts
At the sectoral level, changes in Nile water availability and irrigation efficiency generate
substantial structural changes in agricultural production, see Figure 2. Generally, reductions
in water availability cause decreases in the total agricultural output.14 The pronounced
declines in production volumes are more than offset by enhanced irrigation efficiency15 but
even so the extent of structural change is substantial, which implies that the adjustment to a
new regime may take some time. Overall, however, it is noticeable that patterns of structural
change mirror the patterns of water intensity in production.
Reductions in Nile water availability have noticeable adverse impacts on summer
agricultural production (Figure 2). This is particularly the case for rice, ‘other crops’ and
sugar cane. Other sectors (winter and summer vegetables) expand under the N-Wtr Loss
scenario. It is worth noting that, under the N-Wtr Loss scenario, sectors with the highest
expansions have negligible baseline shares in the overall agricultural structure, e.g. Nili rice
(with a share of 0.01%) expands by 32% and Nili fodders (with a share of 0.15%) expands by
7%. Improving Nile-dependent irrigation efficiency generates positive effects for sectors like
14 The Laspeyres Volume Index of agricultural output (measured as an arithmetic average of quantities
weighted by the baseline values) declines by 1.3%. 15 The Laspeyres Volume Index of agricultural output increases by 2.3%.
18
winter legumes and summer ‘other crops’, whereas all the seasonal vegetable sectors shrink.
The simulated increases in non-conventional water resources boost the fruits sector, which
reflects the limitation on the use of non-conventional water resources.
Water loss has negative effects on exports of agricultural commodities while increasing
irrigation efficiency generates positive outcomes. Under the N-Wtr Loss & Irrg-Eff scenario,
the results are mixed as the combined effects of water loss and increased efficiency promote
reallocation of factors and, consequently, new structures for domestic production and exports.
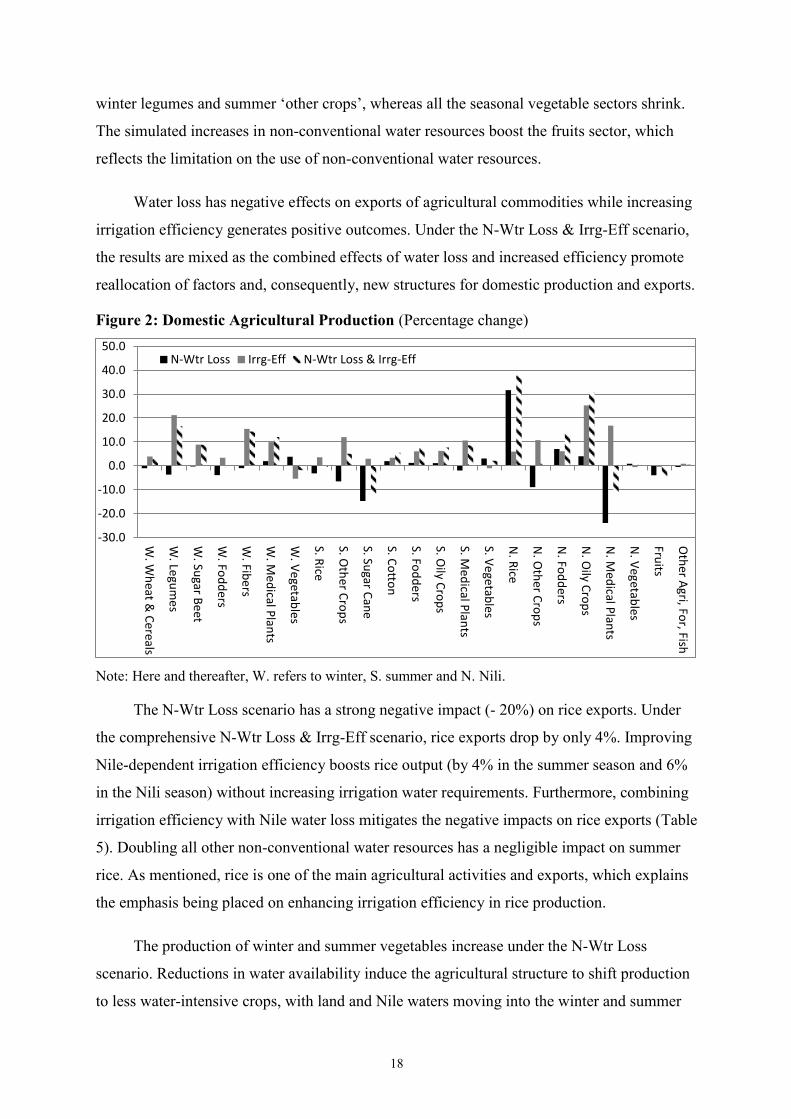
Figure 2: Domestic Agricultural Production (Percentage change)
Note: Here and thereafter, W. refers to winter, S. summer and N. Nili.
The N-Wtr Loss scenario has a strong negative impact (- 20%) on rice exports. Under
the comprehensive N-Wtr Loss & Irrg-Eff scenario, rice exports drop by only 4%. Improving
Nile-dependent irrigation efficiency boosts rice output (by 4% in the summer season and 6%
in the Nili season) without increasing irrigation water requirements. Furthermore, combining
irrigation efficiency with Nile water loss mitigates the negative impacts on rice exports (Table
5). Doubling all other non-conventional water resources has a negligible impact on summer
rice. As mentioned, rice is one of the main agricultural activities and exports, which explains
the emphasis being placed on enhancing irrigation efficiency in rice production.
The production of winter and summer vegetables increase under the N-Wtr Loss
scenario. Reductions in water availability induce the agricultural structure to shift production
to less water-intensive crops, with land and Nile waters moving into the winter and summer
-30.0
-20.0
-10.0
0.0
10.0
20.0
30.0
40.0
50.0
W. W
heat &
Ce
reals
W. Le
gum
es
W. Su
gar Be
et
W. Fo
dd
ers
W. Fib
ers
W. M
ed
ical Plan
ts
W. V
egetab
les
S. Rice
S. Oth
er C
rop
s
S. Sugar C
ane
S. Co
tton
S. Fod
ders
S. Oily C
rop
s
S. Me
dical P
lants
S. Ve
getab
les
N. R
ice
N. O
ther C
rop
s
N. Fo
dd
ers
N. O
ily Cro
ps
N. M
edical P
lants
N. V
egetables
Fruits
Oth
er Agri, Fo
r, Fish
N-Wtr Loss Irrg-Eff N-Wtr Loss & Irrg-Eff

19
vegetable sectors, leading to expansions of 3-4%.16 This reflects the assumption that water
availability across seasons will not change with the reduction in the total availability of Nile
waters. This assumption also explains why summer and Nili vegetable outputs increase but
winter vegetable outputs decline under the comprehensive N-Wtr Loss & Irrg-Eff scenario. It
is the relative water intensity of crops within seasons that matters rather than their absolute
water intensity.17
Table 5: Commodity Exports (Percentage change)
Nile Irrg-Eff Ground Irrg-Eff Irrg-Eff
Wheat -3.95 16.87 1.22 18.16 0.19 13.70
Cereals -7.18 44.42 1.74 46.82 0.00 36.19
Rice -19.46 19.78 0.35 20.16 -0.05 -3.58
Vegetables -3.42 8.81 0.39 9.20 0.01 5.46
Fruits -6.57 -1.09 -0.06 -1.14 7.99 -7.62
Beverages -6.26 10.12 0.60 10.71 0.03 4.03
Ores, Minerals & Gas 0.56 -0.82 -0.05 -0.86 -0.16 -0.30
Food Products -0.20 0.46 0.02 0.47 -0.11 0.32
Other Transportable Goods
-0.31 0.60 0.03 0.62 -0.06 0.35
Metal & Machinery Equipment
-0.41 0.75 0.04 0.78 -0.04 0.42
Construction 0.19 -0.29 -0.02 -0.31 -0.05 -0.11
Trade 0.33 -0.49 -0.03 -0.52 -0.11 -0.18
Financial Services 0.25 -0.36 -0.02 -0.38 -0.08 -0.11
Business Services 0.33 -0.48 -0.03 -0.51 -0.10 -0.17
Social Services 0.44 -0.72 -0.04 -0.75 -0.09 -0.31
N-Wtr Loss & Irrg-EffN-Wtr Loss
Irrigation EfficiencyX-Wtr Gain
Clearly, interpreting these findings requires more detailed analyses of production
technologies prevailing in the base year as well as changes in factor prices and rents under the
scenarios. The next subsection addresses these effects.
5.3 Water and Irrigated Land Prices
Under the Nile Irrg-Eff scenario, Nile water and Nile-dependent land rents drop as they
become more efficient.18 The expanding activities (winter legumes, summer rice, summer
16 For more detailed sectoral results, see Table A4. 17 Nile water intensities for summer and Nili vegetables are virtually double and triple the Nile water
intensity for winter vegetables, Table A1. 18 Increasing factor productivity implies higher effective factor endowment, which consequently affects
factor demand and price. Within this framework, changes in the productivity of specific factors/sectors

20
‘other crops’ and cotton) absorb the mobile factors (labour, capital, year-round Nile water and
year-round Nile-dependent land) leaving other activities and causing their prices and incomes
to rise (Table 6).19
Table 6: Factor Income (Percentage change)
Nile Irrg-Eff Ground Irrg-Eff Irrg-Eff
Labour -0.42 0.78 0.04 0.81 0.03 0.41
Capital -0.40 0.72 0.04 0.75 0.03 0.37
Rain-fed Land 7.60 -12.18 -0.68 -12.74 -0.16 -6.15
Winter Land -1.35 -2.52 -0.77 -3.23 -0.19 -4.51
Summer Land -2.12 -0.65 -0.45 -1.07 -0.11 -3.21
Nili Land -4.13 -0.73 -0.51 -1.22 -0.10 -5.39
Year-round Land -3.78 0.13 0.01 0.14 4.25 -3.57
Winter Water 9.91 -2.27 -0.67 -2.88 -0.17 6.89
Summer Water 6.12 -2.31 -0.30 -2.57 -0.05 3.27
Nili Water 4.25 1.40 -0.28 1.12 -0.06 5.49
Year-round Water 6.75 0.13 0.01 0.14 4.25 6.99
Winter Land 4.17 -10.95 8.27 -3.55 3.89 0.54
Summer Land 4.76 -8.98 8.58 -1.14 4.73 3.55
Nili Land 5.27 -8.85 8.74 -0.89 2.39 4.21
Year-round Land -3.78 0.13 0.01 0.14 4.25 -3.57
Winter Water 4.20 -11.57 8.22 -4.26 -16.65 -0.17
Summer Water 3.60 -8.33 8.51 -0.49 -15.10 3.14
Nili Water 1.79 -7.61 8.63 0.40 -17.34 2.45
Year-round Water -3.78 0.13 0.01 0.14 -11.78 -3.57
Groundwater-dependent Factors
N-Wtr Loss N-Wtr Loss & Irrg-Eff
Irrigation Efficiency
Nile-dependent Factors
X-Wtr Gain
The increases in factor prices under the Nile-Irrg Eff scenario entail higher production
costs for sectors that are relatively more dependent on water. As such, the seasonal vegetables
sectors experience increasing production costs, which explain the reported shrinkage.
6. Systematic Sensitivity Analysis
To analyse the robustness of the results from the model, the elasticity of substitution between
water and land is analysed through a systematic sensitivity analysis (SSA) using a standard
affect demand and price for other factors/sectors through different transmission channels. The higher the factor productivity, the lower is its effective price.
19 In a general equilibrium framework, the causal relationship between factor demand and factor rents works in two directions. Excess demand for a factor raises its price to clear the market. Simultaneously, producers substitute this more expensive factor for other factors according the elasticities of substitution in CES production functions.
21
Monte Carlo approach.20 It is assumed that the elasticity of substitution between water and
land for each agricultural activity follows an independent identically distributed (i.i.d.)
normal distribution, N (µ, σ2), where the mean is the employed elasticity value, i.e. 0.06, and
the variance is one third of the mean.21 This SSA simulates 5,000 Monte Carlo independent
draws for the Irrg-Eff scenario, under which a 30% increase in irrigation efficiency is
simulated for both Nile-dependent and groundwater-dependent irrigation schemes. For each
draw, a new elasticity parameter is selected for each commodity not related to the draw for
other commodities. Once the new elasticity is selected, it remains constant along the lower
three levels of the production tree.
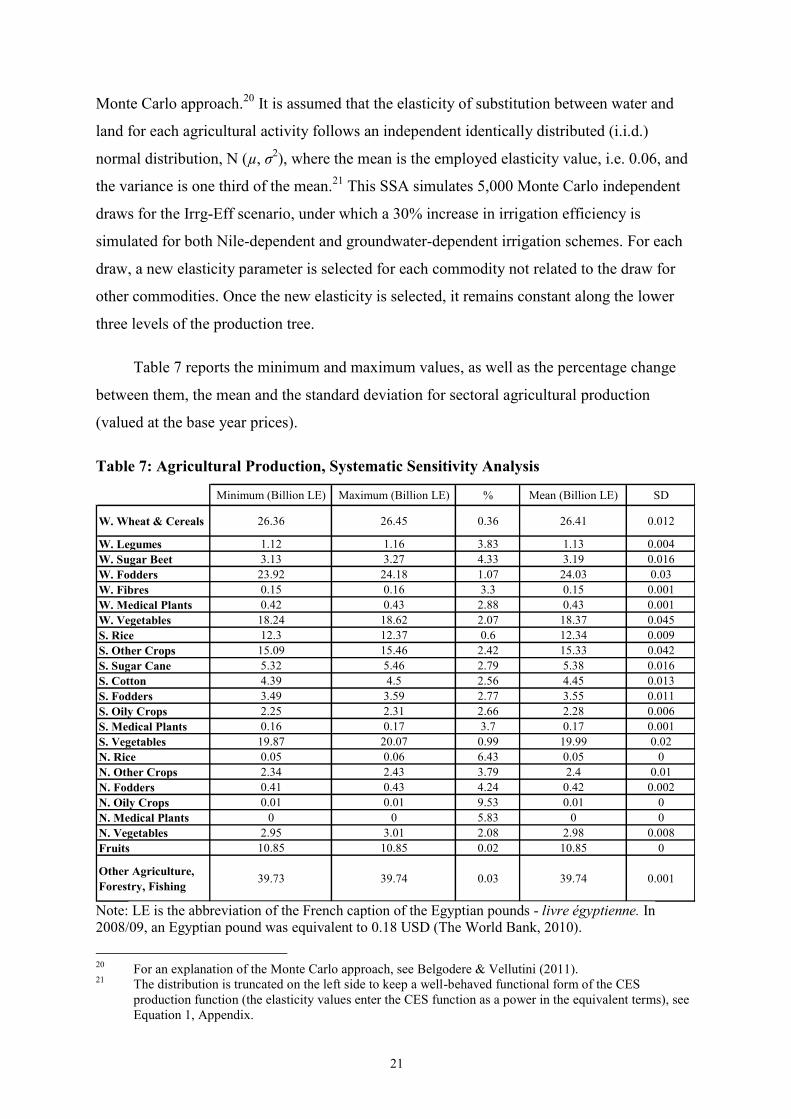
Table 7 reports the minimum and maximum values, as well as the percentage change
between them, the mean and the standard deviation for sectoral agricultural production
(valued at the base year prices).
Table 7: Agricultural Production, Systematic Sensitivity Analysis
Minimum (Billion LE) Maximum (Billion LE) % Mean (Billion LE) SD
W. Wheat & Cereals 26.36 26.45 0.36 26.41 0.012
W. Legumes 1.12 1.16 3.83 1.13 0.004W. Sugar Beet 3.13 3.27 4.33 3.19 0.016W. Fodders 23.92 24.18 1.07 24.03 0.03W. Fibres 0.15 0.16 3.3 0.15 0.001W. Medical Plants 0.42 0.43 2.88 0.43 0.001W. Vegetables 18.24 18.62 2.07 18.37 0.045S. Rice 12.3 12.37 0.6 12.34 0.009S. Other Crops 15.09 15.46 2.42 15.33 0.042S. Sugar Cane 5.32 5.46 2.79 5.38 0.016S. Cotton 4.39 4.5 2.56 4.45 0.013S. Fodders 3.49 3.59 2.77 3.55 0.011S. Oily Crops 2.25 2.31 2.66 2.28 0.006S. Medical Plants 0.16 0.17 3.7 0.17 0.001S. Vegetables 19.87 20.07 0.99 19.99 0.02N. Rice 0.05 0.06 6.43 0.05 0N. Other Crops 2.34 2.43 3.79 2.4 0.01N. Fodders 0.41 0.43 4.24 0.42 0.002N. Oily Crops 0.01 0.01 9.53 0.01 0N. Medical Plants 0 0 5.83 0 0N. Vegetables 2.95 3.01 2.08 2.98 0.008Fruits 10.85 10.85 0.02 10.85 0
Other Agriculture, Forestry, Fishing
39.73 39.74 0.03 39.74 0.001
Note: LE is the abbreviation of the French caption of the Egyptian pounds - livre égyptienne. In 2008/09, an Egyptian pound was equivalent to 0.18 USD (The World Bank, 2010).
20 For an explanation of the Monte Carlo approach, see Belgodere & Vellutini (2011). 21 The distribution is truncated on the left side to keep a well-behaved functional form of the CES
production function (the elasticity values enter the CES function as a power in the equivalent terms), see Equation 1, Appendix.
22
The analysis shows the robustness of the model in relation to the elasticity of
substitution between water and land. The SSA explicitly shows that the results of the model
are clearly determined by the shocks selected and by the initial share parameters (see Table
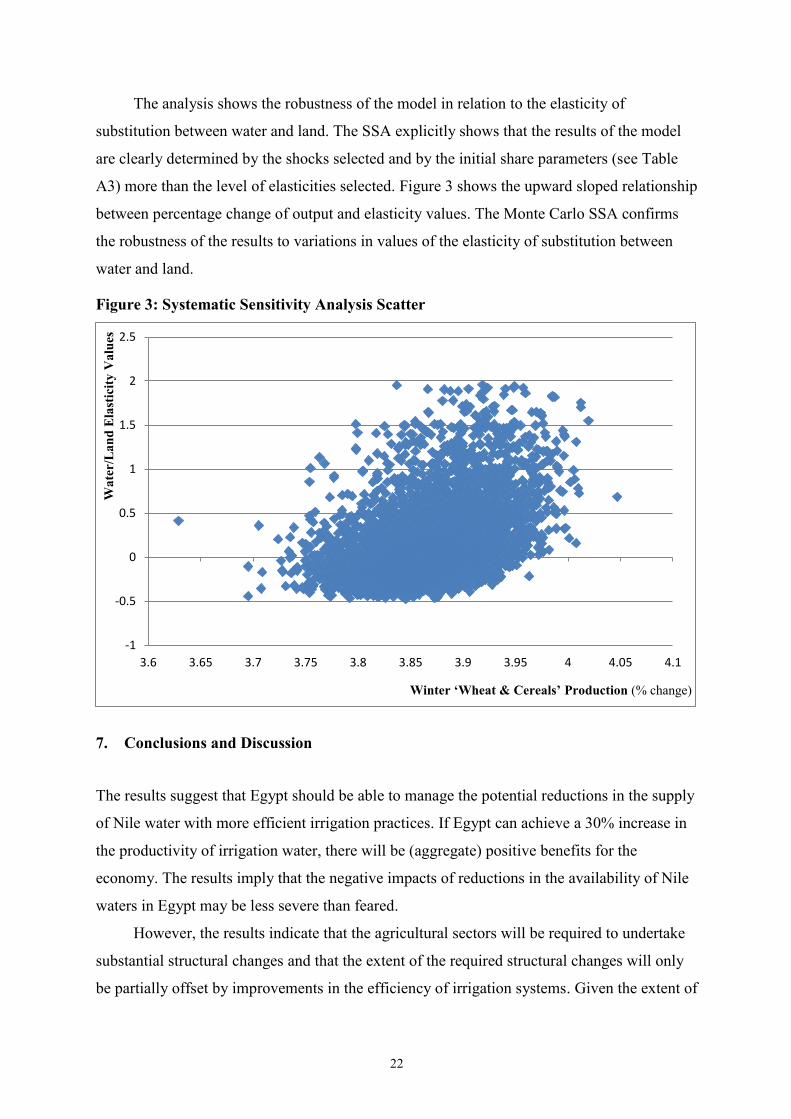
A3) more than the level of elasticities selected. Figure 3 shows the upward sloped relationship
between percentage change of output and elasticity values. The Monte Carlo SSA confirms
the robustness of the results to variations in values of the elasticity of substitution between
water and land.
Figure 3: Systematic Sensitivity Analysis Scatter
7. Conclusions and Discussion
The results suggest that Egypt should be able to manage the potential reductions in the supply
of Nile water with more efficient irrigation practices. If Egypt can achieve a 30% increase in
the productivity of irrigation water, there will be (aggregate) positive benefits for the
economy. The results imply that the negative impacts of reductions in the availability of Nile
waters in Egypt may be less severe than feared.
However, the results indicate that the agricultural sectors will be required to undertake
substantial structural changes and that the extent of the required structural changes will only
be partially offset by improvements in the efficiency of irrigation systems. Given the extent of
-1
-0.5
0
0.5
1
1.5
2
2.5
3.6 3.65 3.7 3.75 3.8 3.85 3.9 3.95 4 4.05 4.1
Winter ‘Wheat & Cereals’ Production (% change)
Wat
er/L
and
Ela
stic
ity V
alue
s
23
implied structural changes and the degree of the required efficiency changes, it is likely that
the adjustment period will not be short. Moreover, the potential distributional implications
may be more pronounced than expected.22
Furthermore, the results show that even doubling all non-conventional water resources
is not sufficient to compensate the potential adverse impacts of Nile water reductions. This
highlights the importance of enhancing irrigation efficiency. Since it is inevitable that the
availability of Nile waters in Egypt will decline, the sooner changes in irrigation methods
begin to be implemented, the better.
There are a number of research avenues that can be explored to enhance the analyses in
this study. The scenarios do not explore the extent to which the Egyptian government can use
the capacities of the Nile dams’ reservoirs to adjust the seasonality of Nile water availability
so as to influence structural changes in cropping decisions across seasons. In the longer term,
the Egyptian government’s ability to take such action will be limited to its control over the
Aswan dams, so the option of collaboration with Ethiopia and Sudan during the period when
the GERD’s lake is filling may be fruitful. Similarly, the analysis does not take account of the
extent to which the cost effectiveness of improvements in irrigation efficiencies may differ
across crops23 and hence the potential benefits of targeting. This analysis also presumes that
there will be no changes in the Egyptian government’s policy on food subsidies, which are a
source of budgetary concern. Thus it may be pertinent to explore the extent to which changes
in food subsidies influence the operation of domestic markets towards or away from water-
intensive domestically produced agricultural commodities. Moreover, since the extent of
structural changes suggests that distributional issues may be important, the analysis would be
enhanced by disaggregation of the household and labour accounts.
22 The distributional impacts cannot be quantified in this study due to the SAM limitations. 23 It is implicitly assumed that the extent to which different crops can respond to changes in irrigation
technology is equiproportionate.

24
Bibliography
Abu-Zeid, M. A., and F. Z. El-Shibini. “Egypt's High Aswan Dam.” International Journal of Water Resources Development 13, no. 2 (1997): 209-218.
Bader, E. (2004). Mathematical Programming Models for Optimising Irrigation Water Management In Egypt. Dissertation.
Belgodere, A., & Vellutini, C. (2011). Identifying key elasticities in a CGE model: a Monte Carlo approach. Applied Economics Letters, 18(17), 1619-1622.
Calzadilla, A.; Rehdanz, K., & Tol, R. S. (2011). The GTAP-W model: Accounting for Water Use in Agriculture. Kiel: Kiel Institute for the World Economy, No. 1745.
CAPMAS (2009). Annual Bulletin of Irrigation and Water Resources Statistics, 2008. Cairo: Central Agency for Public Mobilisation and Statistics.
Devarajan, S.; Lewis, J., & Robinson, S. (1990). Policy Lessons m Trade-Focused,Two-Sector Models. Journal of Policy Modeling, 12 (4), 625-657.
Dinar, A. (2014). Water and Economy-Wide Policy Interventions. Foundations and Trends in Microeconomics, 10(2), 85-165.
Dudu, H., & Chumi, S. (2008). Economics of Irrigation Water Management: A Literature Survey with Focus on Partial and General Equilibrium Models. World Bank Policy Research Working Paper.
El Arabi, N. (2012) “Environmental Management of Groundwater in Egypt via Artificial Recharge Extending the Practice to Soil Aquifer Treatment (SAT)”, International Journal of Environment and Sustainability, Vol. 1 (3), pp. 66‐82.
FAO (2013). Country Programming Framework (CPF) Government of Egypt 2012-2017. Food and Agriculture Organisation.
FAO (2014). AQUASTAT Database. Retrieved September 29, 2014, from Food and Agriculture Organization of the United Nations: http://www.fao.org/nr/water/aquastat/main/index.stm
Gohar, A. A., & Ward, F. A. (2010). Gains from Expanded Irrigation Water Trading in Egypt: An Integrated Basin Approach. Ecological Economics, 69, 2535–2548.
Gohar, A. A., & Ward, F. A. (2011). Gains from Improved Irrigation Water Use Efficiency in Egypt. International Journal of Water Resources Development, 27(4), 737-758.
He, L.; Tyner, W., & Siam, G. (2004). Improving Irrigation Water Allocation Efficiency Using Alternative Policy Options in Egypt. Selected Paper Prepared for Presentation at the American Agricultural Economics.
Karajeh, F.; El‐Gindy, A.; El‐Quosy, D., & Khalifa, H. (2011). Water and Agriculture in Egypt, Technical paper based on the Egypt-Australia-ICARDA Workshop on On-farm Water-use Efficiency. International Center for Agricultural Research in the Dry Areas (ICARDA) Working Paper.
Keller, A. A., & Keller, J. (1995). Effective Efficiency: A Water Use Efficiency Concept for Allocating Freshwater Resources. Center for Economic Policy Studies(Discussion Paper 22).
Lofgren, H.; Harris, R., & Robinson, S. (2002). A Standard Computable General Equilibrium (CGE) Model in GAMS. Washington D.C.: International Food Policy Research Institute.
Luckmann, J. & McDonald, S. (2014). STAGE_W: An Applied General Equilibrium Model with Multiple Types of Water Technical Documentation . Agricultural Economics Working Paper Series, 23.

25
Luckmann, J.; Grethe, H.; McDonald, S.; Orlov, A. & Siddig, K. (2014). "An Integrated Economic Model of Multiple Types and Uses of Water", Water Resources Research, Vol 50 (5), pp. 3875–3892.
Luckmann, J.; Grethe, H. & McDonald, S. (2016). "When Water Saving Limits Recycling: Modeling Economy-Wide Linkages of Wastewater Use", Water Research, Vol 88, pp. 972–980.
McDonald, S. (2007). A Static Applied General Equilibrium Model: Technical Documentation STAGE Version 2. Technical Report.
McDonald, S., & Thierfelder, K. (2015). A Static Applied General Equilibrium Model: Technical Documentation STAGE Version 2. Technical Report. (www.cgemod.org.uk/stage2.pdf).
Osman, R.; Ferrari, E., & McDonald, S. (2015a). Constructing a SAM for Egypt (2008/09): Introducing Water and Irrigation Seasonality. Journal of Development and Economic Policies, 17(1), 5-29.
Osman, R.; Ferrari, E., Causape, A. M., & McDonald, S. (2015b). An Extended SAM for Egypt (2008/09): Conventional and Mixed Multiplier Analyses. the 6th Spanish Conference on Input–Output Analysis. Barcelona: Hispanic Input-Output Analysis Society (SHAIO).
Ponce, R.; Bosello, F., & Giupponi, C. (2012). Integrating Water Resources into Computable General Equilibrium Models – A Survey. In C. Carraro, Climate Change and Sustainable Development Series.
Robinson, S., & El-Said, M. (2000). GAMS Code for Estimating a Social Accounting Matrix (SAM) Using Cross Entropry (CE) Methods. Trade and Macroeconomics Division (TMD) Discussion Paper(No 64).
Robinson, S., & Gehlhar, C. (1995a). Land, Water and Agriculture in Egypt: The Economywide Impact of Policy Reform. TMD Discussion Paper.
Robinson, S., & Gehlhar, C. (1995b). Impacts of Macroeconomic and Trade Policies on a Market-oriented Agriculture. In L. B. Fletcher, Egypt’s Agriculture in a Reform Era. Ames, Iowa: Iowa State University Press.
Robinson, S., & McDonald, S. (2006). Cross Entropy SAM Estimation Program, Mimeo. (http://www.cgemod.org.uk/samest.html)
Robinson, S.; Cattaneo, A., & El-Said, M. (1998). Estimating a Social Accounting Matrix Using Cross Entropy Methods. TMD Discussion Paper(33).
Robinson, S.; Cattaneo, A., & El-Said, M. (2001). Updating and Estimating a Social Accounting Matrix Using Cross Entropy Methods. Economic Systems Research, 13(1), 47-64.
Robinson, S.; Kilkenny, M., & Hanson, K. (1990). The USDA/ERS Computable General Equilibrium (CGE) Model of the United States. The U.S. Dept. of Agriculture, Economic Research Service, Agriculture and Rural Economy Division.
Rosegrant, M. W.; Cai, X., & Cline, S. A. (2002). World Water and Food to 2025: Dealing with Scarcity. International Food Policy Research Institute (IFPRI).
Strzepek, K. M.; Onyeji, S.; Saleh, M., & Yates, D. (1995). An assessment of Integrated Climate Change Impacts on Egypt. In K. Strzepek, & J. Smith , As Climate Changes: International Impacts and Implications (pp. 180-200). Cambridge: Cambridge University Press.
Strzepek, K. M.; Yohe, G. W.; Tol, R. S., & Rosegrant, M. W. (2008). The Value of the High Aswan Dam to the Egyptian Economy. Ecological Economics, 66(1), 117-126.

26
Strzepek, S. M., & Yates, D. N. (2000). Responses and Thresholds of the Egyptian Economy to Climate Change Impacts on the Water Resources of the Nile River. Climatic Change, 46, 339–356.
The World Bank (2010). World Development Indicators 2010, Washington, D.C. Yates, D. N., & Strzepek, K. M. (1996). Modeling Economy-wide Climate Change Impacts
on Egypt: A Case for an Integrated Approach. Environmental Modeling and Assessment, 1(3).
Yates, D. N., & Strzepek, K. M. (1998). An Assessment of Integrated Climate Change Impacts on the Agricultural Economy of Egypt. Climate Change, 38(3).

27
Table A1: Factor Intensity by Agricultural Activity (Percent)
Labour CapitalNile-
dependent Land
Nile WaterGroundwater-
dependent Land
Groundwater Rain-fed Land Total
W. Wheat & Cereals 13.8 56.4 20.0 3.4 1.8 0.2 4.5 100
W. Legumes 22.2 29.8 34.6 4.6 1.3 0.0 7.5 100W. Sugar Beet 12.3 64.2 16.9 2.8 0.0 0.0 3.8 100W. Fodders 2.5 83.7 6.0 5.1 0.4 0.0 2.2 100W. Fibres 14.4 59.0 18.4 3.8 0.1 0.0 4.3 100W. Medical Plants 10.2 68.7 15.3 2.2 0.2 0.0 3.4 100W. Vegetables 7.7 84.1 5.8 0.8 0.4 0.1 1.3 100S. Rice 13.8 54.1 6.1 20.6 0.1 0.0 5.2 100S. Other Crops 23.1 47.0 17.0 7.4 0.6 0.1 4.7 100S. Sugar Cane 11.4 70.1 2.3 13.1 0.1 0.0 3.1 100S. Cotton 24.7 59.0 10.9 2.7 0.0 0.0 2.6 100S. Fodders 4.8 77.8 9.7 2.7 2.2 0.4 2.4 100S. Oily Crops 15.1 62.5 15.6 2.4 1.0 0.0 3.4 100S. Medical Plants 12.1 64.6 14.6 5.0 0.0 0.0 3.8 100S. Vegetables 11.4 74.3 10.4 1.3 0.4 0.1 2.2 100N. Rice 11.4 54.3 13.4 0.5 17.6 0.2 2.7 100N. Other Crops 23.0 47.2 12.9 9.9 2.3 0.2 4.4 100N. Fodders 5.5 76.9 10.9 0.0 4.5 0.1 2.1 100N. Oily Crops 18.4 39.7 30.4 1.8 3.6 0.0 6.1 100N. Medical Plants 11.8 56.4 5.3 21.2 0.0 0.0 5.3 100N. Vegetables 11.4 73.6 8.5 2.9 1.3 0.1 2.2 100Fruits 14.4 63.2 9.5 4.7 4.8 3.4 0.0 100Other Agriculture, Forestry & Fishing 58.0 42.0 0.0 0.0 0.0 0.0 0.0 100
Note: here and thereafter, W. refers to winter, S. summer and N. Nili.
Table A2: Factor Shares in Agricultural Value Added (Percent)
Labour Capital Nile-dependent Land Nile Water Groundwater-
dependent Land Groundwater Rain-fed Land
W. Wheat & Cereals 12.9 12.6 29.8 10.7 27.2 9.7 25.2W. Legumes 0.7 0.2 1.8 0.5 0.7 0.0 1.4W. Sugar Beet 1.4 1.8 3.1 1.1 0.1 0.0 2.6W. Fodders 2.5 20.1 9.7 17.3 7.4 2.3 13.1W. Fibres 0.1 0.1 0.2 0.1 0.0 0.0 0.1W. Medical Plants 0.2 0.3 0.4 0.1 0.1 0.0 0.3W. Vegetables 5.9 15.5 7.1 2.0 5.2 2.4 5.8S. Rice 6.2 5.8 4.4 30.7 0.9 0.0 14.0S. Other Crops 11.2 5.5 13.3 12.1 5.2 2.6 13.8S. Sugar Cane 2.2 3.3 0.7 8.5 0.3 0.0 3.6S. Cotton 4.0 2.3 2.8 1.5 0.0 0.0 2.5S. Fodders 0.7 2.6 2.2 1.3 5.2 3.0 2.0S. Oily Crops 1.3 1.2 2.1 0.7 1.3 0.1 1.7S. Medical Plants 0.1 0.1 0.1 0.1 0.0 0.0 0.1S. Vegetables 8.5 13.3 12.4 3.2 5.0 2.1 10.0N. Rice 0.0 0.0 0.0 0.0 0.6 0.0 0.0N. Other Crops 1.8 0.9 1.6 2.5 2.9 0.9 2.0N. Fodders 0.1 0.3 0.3 0.0 1.2 0.1 0.2N. Oily Crops 0.0 0.0 0.0 0.0 0.0 0.0 0.0N. Medical Plants 0.0 0.0 0.0 0.0 0.0 0.0 0.0N. Vegetables 1.3 2.0 1.6 1.1 2.4 0.5 1.5Fruits 6.2 6.5 6.5 6.6 34.1 76.2 0.0Other Agriculture, Forestry & Fishing
32.8 5.7 0.0 0.0 0.0 0.0 0.0
Total Agricultural Value Added
100 100 100 100 100 100 100
28
Table A3: Share Parameters for Land and Water at Different Levels of the CES Nest
Irrigated Land/Water
Rain-fed Land
Nile-dependent Land/Water
Groundwater-dependent Land/Water
Nile-dependent
Land
Nile Water
Groundwater -dependent
LandGroundwater
W. Wheat & Cereals 0.7286 0.2714 0.8398 0.1602 0.9134 0.0866 0.9489 0.0511
W. Legumes 0.7237 0.2763 0.9080 0.0920 0.9369 0.0631 0.9980 0.0020W. Sugar Beet 0.7203 0.2797 0.9817 0.0183 0.9165 0.0835 0.9998 0.0002W. Fodders 0.7230 0.2770 0.8895 0.1105 0.5528 0.4472 0.9567 0.0433W. Fibres 0.7202 0.2798 0.9807 0.0193 0.8925 0.1075 1.0000 0.0000W. Medical Plants 0.7217 0.2783 0.9466 0.0534 0.9283 0.0717 0.9999 0.0001
W. Vegetables 0.7280 0.2720 0.8530 0.1470 0.9356 0.0644 0.9295 0.0705S. Rice 0.7180 0.2820 0.9725 0.0275 0.1664 0.8336 0.9963 0.0037S. Other Crops 0.7222 0.2778 0.9112 0.0888 0.7516 0.2484 0.9225 0.0775S. Sugar Cane 0.7164 0.2836 0.9689 0.0311 0.0905 0.9095 0.9993 0.0007S. Cotton 0.7197 0.2803 1.0000 0.0000 0.8643 0.1357 0.0000 0.0000S. Fodders 0.7413 0.2587 0.7373 0.2627 0.8460 0.1540 0.9063 0.0937S. Oily Crops 0.7263 0.2737 0.8727 0.1273 0.9249 0.0751 0.9937 0.0063S. Medical Plants 0.7194 0.2806 1.0000 0.0000 0.8083 0.1917 0.0000 0.0000
S. Vegetables 0.7245 0.2755 0.8967 0.1033 0.9426 0.0574 0.9371 0.0629N. Rice 0.8049 0.1951 0.4597 0.5403 0.9869 0.0131 0.9981 0.0019N. Other Crops 0.7301 0.2699 0.8142 0.1858 0.5876 0.4124 0.9596 0.0404
N. Fodders 0.7599 0.2401 0.6383 0.3617 1.0000 0.0000 0.9898 0.0102N. Oily Crops 0.7324 0.2676 0.8131 0.1869 0.9767 0.0233 1.0000 0.0000N. Medical Plants 0.7161 0.2839 1.0000 0.0000 0.1361 0.8639 0.0000 0.0000
N. Vegetables 0.7322 0.2678 0.8048 0.1952 0.8061 0.1939 0.9736 0.0264
Ground Land/Water
Fifth level of CES nest
Land/Water Irrigated Land/Water
Third level of CES nest
Fourth level of CES nest
Nile Land/Water

29
Table A4: Domestic Agricultural Production (Percentage change)
Nile Irrg-Eff Ground Irrg-Eff Irrg-Eff
W. Wheat & Cereals -1.03 3.64 0.28 3.90 0.04 2.90
W. Legumes -3.72 20.25 0.87 21.26 0.00 16.66
W. Sugar Beet -0.30 8.84 0.06 8.90 0.01 8.79
W. Fodders -3.87 3.28 0.10 3.38 -0.04 -0.54
W. Fibres -0.92 15.31 0.14 15.48 -0.01 14.36
W. Medical Plants 2.02 9.81 0.11 9.93 -0.07 12.05
W. Vegetables 3.78 -5.37 -0.08 -5.45 0.00 -1.82
S. Rice -3.13 3.55 0.03 3.59 0.00 -0.48
S. Other Crops -6.51 11.72 0.31 12.03 0.11 5.09
S. Sugar Cane -14.70 3.25 -0.27 2.98 -0.11 -11.66
S. Cotton 2.01 3.72 -0.32 3.42 -0.12 5.45
S. Fodders 1.27 4.72 1.46 6.10 0.63 7.46
S. Oily Crops 1.14 5.86 0.40 6.23 -0.15 7.69
S. Medical Plants -1.98 10.85 -0.21 10.64 -0.09 8.52
S. Vegetables 3.08 -0.96 -0.07 -1.04 -0.02 2.15
N. Rice 31.73 -4.02 10.93 5.90 -0.96 37.78
N. Other Crops -8.92 9.46 1.26 10.74 0.29 1.11
N. Fodders 7.05 3.53 2.77 6.16 -0.11 13.45
N. Oily Crops 3.99 22.63 2.32 25.27 -0.25 30.66
N. Medical Plants -23.93 16.95 -0.14 16.81 -0.08 -11.09
N. Vegetables 0.83 -0.98 0.49 -0.54 0.02 0.45
Fruits -3.94 -0.38 -0.02 -0.40 4.64 -4.28
Other Agriculture, Forestry & Fishing -0.48 0.84 0.04 0.88 0.02 0.43
N-Wtr LossIrrigation Efficiency
X-Wtr Gain N-Wtr Loss & Irrg-Eff
30
Appendix
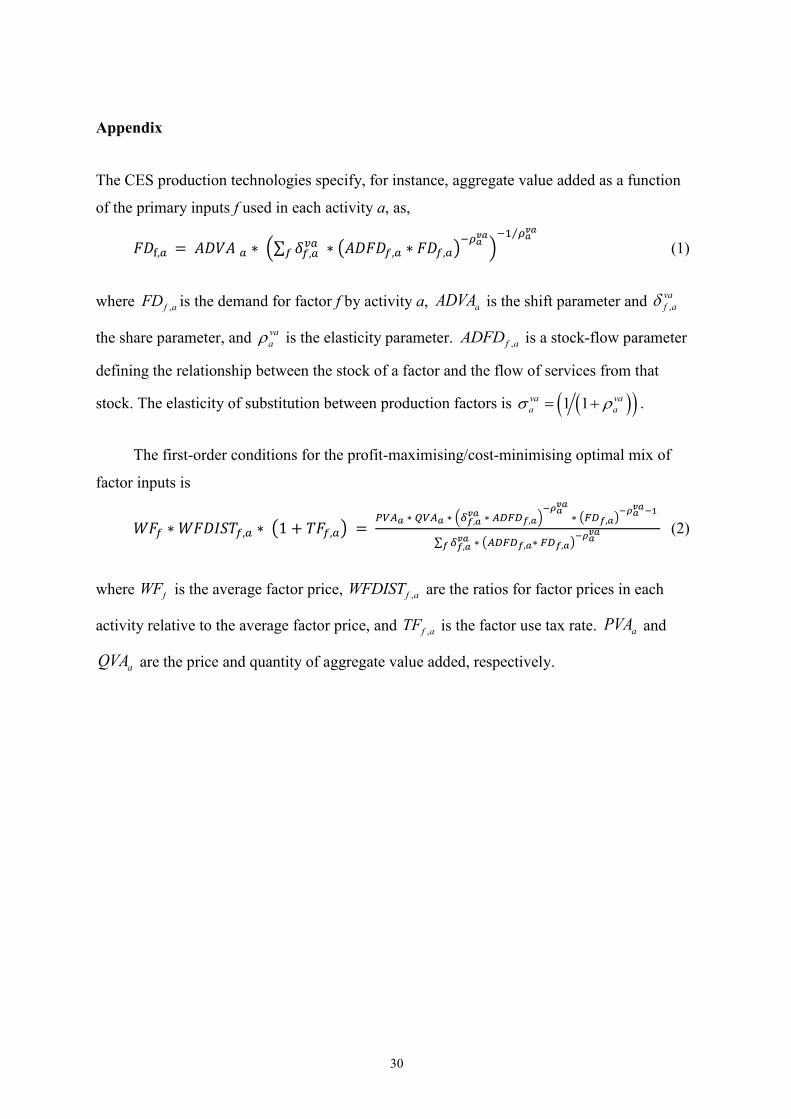
The CES production technologies specify, for instance, aggregate value added as a function
of the primary inputs f used in each activity a, as,
𝐹𝐷f,𝑎 = 𝐴𝐷𝑉𝐴 𝑎 ∗ (∑ 𝛿𝑓,𝑎𝑣𝑎 ∗ (𝐴𝐷𝐹𝐷𝑓,𝑎 ∗ 𝐹𝐷𝑓,𝑎)
−𝜌𝑎𝑣𝑎
𝑓 )−1 𝜌𝑎
𝑣𝑎⁄
(1)
where ,f aFD is the demand for factor f by activity a, aADVA is the shift parameter and ,vaf a
the share parameter, and vaa is the elasticity parameter. ,f aADFD is a stock-flow parameter
defining the relationship between the stock of a factor and the flow of services from that
stock. The elasticity of substitution between production factors is 1 1va vaa a .
The first-order conditions for the profit-maximising/cost-minimising optimal mix of
factor inputs is
𝑊𝐹𝑓 ∗ 𝑊𝐹𝐷𝐼𝑆𝑇𝑓,𝑎 ∗ (1 + 𝑇𝐹𝑓,𝑎) = 𝑃𝑉𝐴𝑎 ∗ 𝑄𝑉𝐴𝑎 ∗ (𝛿𝑓,𝑎
𝑣𝑎 ∗ 𝐴𝐷𝐹𝐷𝑓,𝑎)−𝜌𝑎
𝑣𝑎
∗ (𝐹𝐷𝑓,𝑎)−𝜌𝑎
𝑣𝑎−1
∑ 𝛿𝑓,𝑎𝑣𝑎
𝑓 ∗ (𝐴𝐷𝐹𝐷𝑓,𝑎∗ 𝐹𝐷𝑓,𝑎)−𝜌𝑎
𝑣𝑎 (2)
where fWF is the average factor price, ,f aWFDIST are the ratios for factor prices in each
activity relative to the average factor price, and ,f aTF is the factor use tax rate. aPVA and
aQVA are the price and quantity of aggregate value added, respectively.


