
The Strength of Party Identifications: A Cross-National Comparison of Individual
and Contextual Determinants
Alexander A. Stäubert
Master’s Thesis at the Department of Political Science
UNIVERSITETET I OSLO
May 23rd 2012

The Strength of Party Identifications:
A Cross-National Comparison of Individual and Contextual Determinants
II
Alexander A. Stäubert
Master’s Thesis at the Department of Political Science
UNIVERSITY OF OSLO
May 23rd 2012
III
© Alexander A. Stäubert
2012
The Strength of Party Identifications: A Cross-National Comparison of Individual and
Contextual Determinants
Alexander A. Stäubert
http://www.duo.uio.no/
Trykk: Reprosentralen, Universitetet i Oslo
IV

AbstractTo compare party identification cross-nationally in Europe, we need to analyse both
individual and contextual characteristics that influence individuals during processes of
learning and socialisation. Although numerous papers on the strength and occurrence of party
identifications in Western European countries were published, a comprehensive cross-national
analysis of party identifications in Europe has not been carried out yet. The thesis aims at
testing the explanatory power of individual characteristics such as interest in politics,
contextual variables such as polarisation and the intermediate level characteristic party family
on the individual strength of party identification across 27 European countries. Comparable
ESS data are used to examine the strength of party identification of nearly 60,000 European
citizens.
The ordered logistic multilevel regression analysis reveals that individual or level 1
characteristics prove to have the strongest positive effect on partisan strength, among those
interest in politics, trust and cognitive mobilisation. Contextual variables like polarisation,
fragmentation and maturity of democracy exhibit important yet slightly weaker influence.
Accordingly, highly polarised societies and party systems in Europe as well as highly
fragmented party systems foster strong party identifications. Party family, however, plays
only a minor role in explaining partisan strength. In conclusion, party identification is a
widespread feature in both Eastern and Western Europe that is triggered by the same factors
in both parts. Hence, party identification is a concept widely understood and internalised by
European citizens, thus making it a suitable and convenient tool for the study of political
attitudes among the general public.
Key words: party identification, partisan strength, contextual, individual, life-time learning
model, party family, multilevel model, ordinal response, social capital, cognitive mobilisation,
trust, polarisation, disproportionality, fragmentation, maturity of democracy, society, Eastern
Europe, Western Europe, European Social Survey
V

VI

PrefaceMy interest in party identification as concept dates back to the first semester at Freie
Universität Berlin in summer 2007. Triggered by that interest, a friend of mine and I collected
data on party identification among 350 juveniles that were attending the sixth form at
grammar schools in my home county in early 2009. Our aim was to reveal where their party
identification, if existing, had come from. Complemented by comparisons with the 2007
cross-sectional wave of the German Socio-Economic Panel (GSOEP), we were able to
underpin the causal link between parental and offspring partisanship, also known as
inheritance of party identification. The master’s thesis at hand logically continues my
previous analyses of party identification and provides insights into how individual
characteristics and particularly contextual circumstances influence the emergence and strength
of party attachments in 27 European countries.
My special thanks are due to Professor Dr. Dieter Ohr at Freie Universität Berlin who inspired
me to carrying out statistical analyses within political science at the very beginning of my
studies. It was due to mister Ohr that I have been focusing on empirical social research and
statistics.
Professor Oddbjørn Knutsen at the University of Oslo proved to be an understanding, patient
and helpful supervisor who was approachable at any time.
In addition, I thank my friends and fellow students at the University of Oslo and Anne Dubrau
in particular for triggering discussion and providing necessary distraction.
I am grateful to my very good friend Jenny-Antonia Schulz who always provided critical
feedback on the techniques used, thus laying the foundation for a more comprehensible thesis.
I also like to thank my family, my parents and my sister, who have supported me at any time.
Lust but not least, I would like to acknowledge the support of the German National Academic
Foundation (Studienstiftung des Deutschen Volkes – SDV) and the German Academic
Exchange Service (Deutscher Akademischer Austauschdienst – DAAD) for granting me
scholarships that allowed me to both focus on my studies and the thesis in particular and
benefit from a variety of scientific activities besides my study programme.
Any omissions are purely accidental.
VII
VIII
Tabe of Contents1 Introduction.........................................................................................................................1
2 Theory.................................................................................................................................6
2.1 The Nature of Party Identification...............................................................................6
2.2 The Origin of Party Identification..............................................................................11
2.3 Stability and Development of Party Identification.....................................................14
2.4 The Location of Party Identification in the Ann-Arbor Model..................................16
2.5 Party Identification in the United States....................................................................17
2.6 Party Identification in Europe....................................................................................19
2.7 Party Identification in Eastern Europe.......................................................................24
2.8 Hypotheses.................................................................................................................25
2.8.1 Level 1 Hypotheses.............................................................................................26
2.8.2 Intermediate Level Hypothesis...........................................................................31
2.8.3 Level 2 Hypotheses.............................................................................................33
2.9 Control Variables.......................................................................................................40
3 Method..............................................................................................................................41
3.1 Presentation of the Data Sets......................................................................................41
3.1.1 European Social Survey (ESS)...........................................................................41
3.1.2 Comparative Political Data Set III (CPDS III)...................................................45
3.1.3 Manifesto Data Set..............................................................................................45
3.2 Operationalisation......................................................................................................45
3.2.1 Dependent Variable: Strength of Party Identification........................................45
3.2.2 Independent Variables........................................................................................48
3.2.3 Control Variables................................................................................................64
3.3 Model.........................................................................................................................67
4 Empirical Analysis: The Strength of Party Identification.................................................71
4.1 The Level 1 Hypotheses.............................................................................................73
4.1.1 The Importance of Age.......................................................................................73
4.1.2 The Impact of Social Capital..............................................................................73
4.1.3 Cognitive Mobilisation.......................................................................................75
4.1.4 Trust....................................................................................................................77
4.1.5 Comments on the Control Variables...................................................................77
IX

4.2 The Level 2 Hypotheses.............................................................................................78
4.2.1 Maturity of Democracy and Disproportionality.................................................80
4.2.2 Fragmentation.....................................................................................................81
4.2.3 Polarisation.........................................................................................................81
4.2.4 Overall Model Fit................................................................................................82
5 Empirical Analysis: The Impact of Party Families...........................................................84
6 Conclusion........................................................................................................................89
Bibliography.............................................................................................................................93
Appendix.................................................................................................................................102
A. Table of Countries and Country Codes....................................................................102
B. Disproportionality and Fragmentation Data for Germany and Belgium..................103
C. Party Family Classification......................................................................................104
D. Manifesto Polarisation Data.....................................................................................114
E. Overview over the Numerical Values of the Level 2 Variables..............................115
F. Variable Coding...........................................................................................................116
G. Full Regression Models............................................................................................118
H. Full regression Models with Party Families.............................................................121
X

XI

List of Figures and Tables
Figure 2-1: Lifetime Learning Model of Voting.........................................................................7Figure 2-2. Ideal relationship between strength of party identification and probable direction of vote in the US.......................................................................................................................10Figure 2-3. Exemplification of a non-recursive model for the American case.........................15Figure 2-4. Funnel of causality model......................................................................................16Figure 2-5. Partisans in the USA..............................................................................................17Figure 2-6. Cramér's V (top) and percentage correspondence between vote and party identification.............................................................................................................................21Figure 2-7. A selected institutional form involving the vote....................................................37Figure 3-1. Countries under analysis........................................................................................41Figure 3-2. Mean disproportionality in the 27 level 2 units.....................................................57Figure 3-3. Mean effective number of electoral parties in the 27 level 2 units........................57Figure 3-4. Mean party system polarisation in the 27 level 2 units based on Manifesto Data. 62Figure 3-5. Mean party system polarisation in the 27 level 2 units based on ESS data...........62Figure 3-6. Left-right polarisation of society............................................................................63Figure 3-7. Overview over the level 2 variables, grouped in geographic regions....................64Figure 3-8. Causal model..........................................................................................................67Figure 3-9. Separate effects of individual and contextual effects (a) and cross-level interaction (b)..............................................................................................................................................67Figure 3-10. Thresholds and observed responses for ordinal logit model................................70Figure 6-1. Driving forces for party identifications..................................................................92
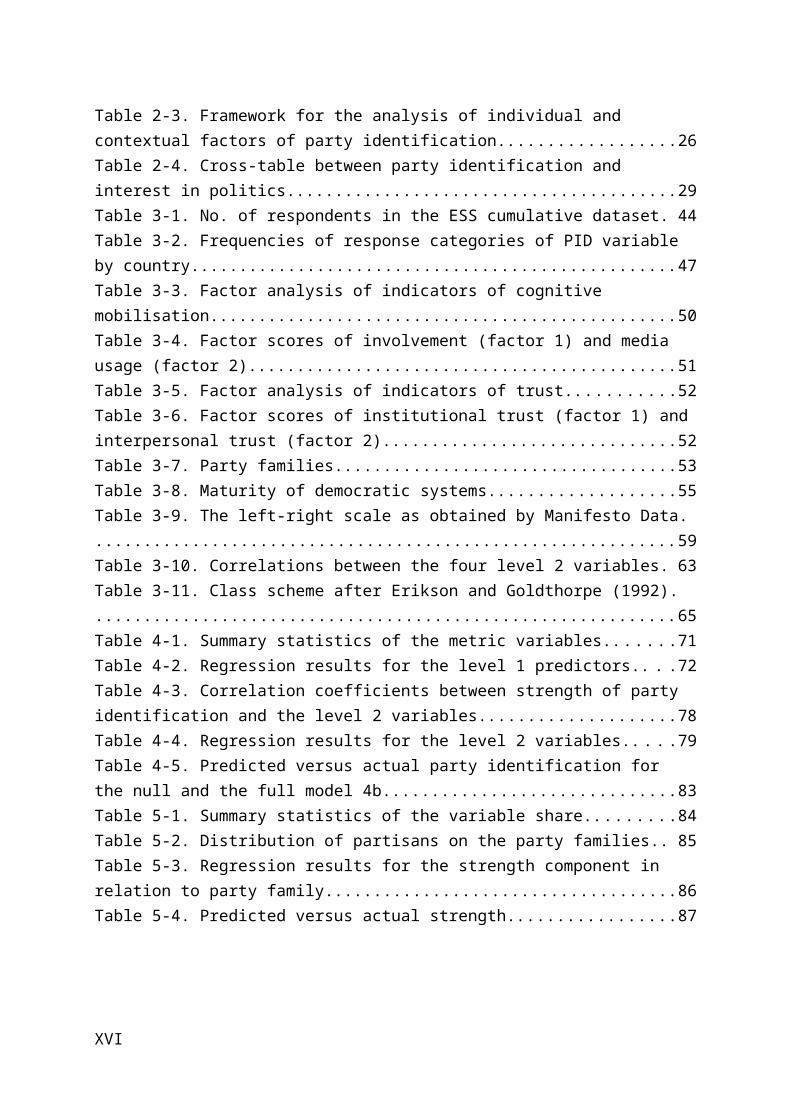
Table 2-1. Mean percentage correspondence between vote and party identification clustered in geographic regions....................................................................................................................22Table 2-2. Classification of partisans in East Europe according to Rose and Mishler (1998). 24Table 2-3. Framework for the analysis of individual and contextual factors of party identification.............................................................................................................................26Table 2-4. Cross-table between party identification and interest in politics.............................29Table 3-1. No. of respondents in the ESS cumulative dataset..................................................44Table 3-2. Frequencies of response categories of PID variable by country.............................47Table 3-3. Factor analysis of indicators of cognitive mobilisation...........................................50Table 3-4. Factor scores of involvement (factor 1) and media usage (factor 2).......................51Table 3-5. Factor analysis of indicators of trust.......................................................................52Table 3-6. Factor scores of institutional trust (factor 1) and interpersonal trust (factor 2).......52Table 3-7. Party families...........................................................................................................53Table 3-8. Maturity of democratic systems..............................................................................55Table 3-9. The left-right scale as obtained by Manifesto Data.................................................59Table 3-10. Correlations between the four level 2 variables....................................................63Table 3-11. Class scheme after Erikson and Goldthorpe (1992)..............................................65
XII

Table 4-1. Summary statistics of the metric variables..............................................................71Table 4-2. Regression results for the level 1 predictors............................................................72Table 4-3. Correlation coefficients between strength of party identification and the level 2 variables....................................................................................................................................78Table 4-4. Regression results for the level 2 variables.............................................................79Table 4-5. Predicted versus actual party identification for the null and the full model 4b.......83Table 5-1. Summary statistics of the variable share.................................................................84Table 5-2. Distribution of partisans on the party families........................................................85Table 5-3. Regression results for the strength component in relation to party family..............86Table 5-4. Predicted versus actual strength..............................................................................87
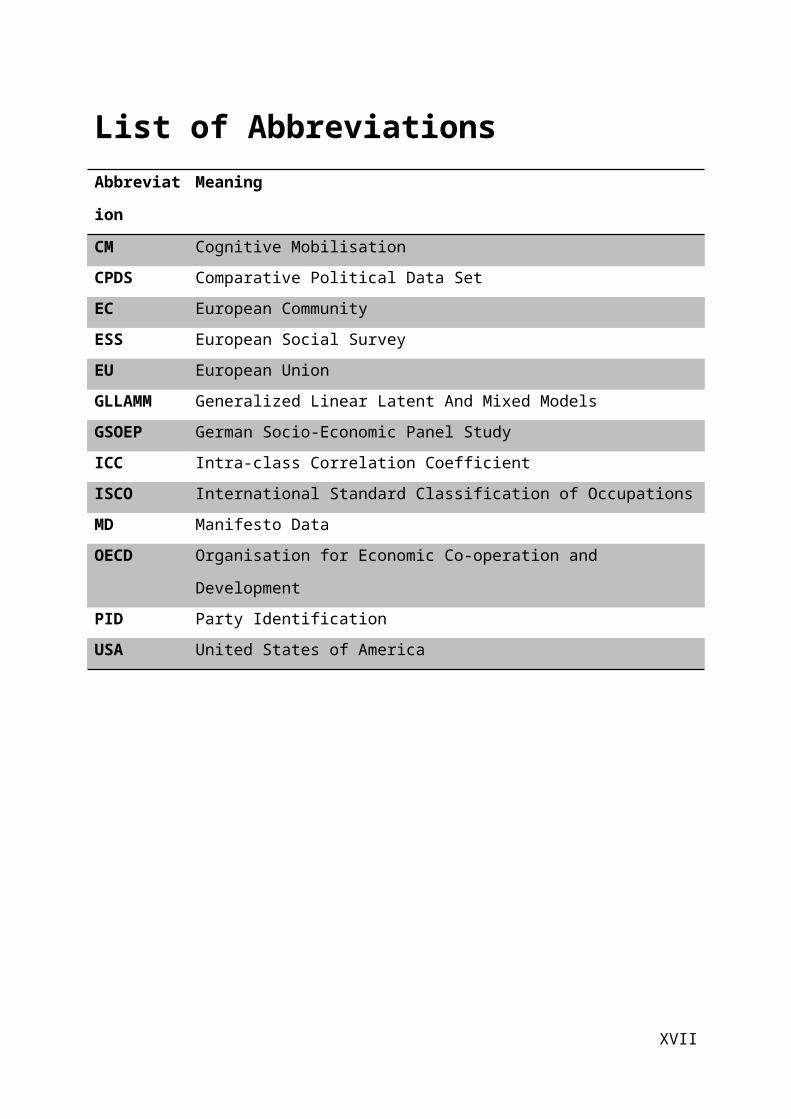
List of AbbreviationsAbbreviation Meaning
CM Cognitive Mobilisation
CPDS Comparative Political Data Set
EC European Community
ESS European Social Survey
EU European Union
GLLAMM Generalized Linear Latent And Mixed Models
GSOEP German Socio-Economic Panel Study
ICC Intra-class Correlation Coefficient
ISCO International Standard Classification of Occupations
MD Manifesto Data
OECD Organisation for Economic Co-operation and Development
PID Party Identification
USA United States of America
XIII

XIV

1 Introduction
Political parties play a major role in virtually every democratic system. Apart from providing
personnel for governing countries, they also serve as important channels through which
individuals – citizens – seek to obtain political influence. However, only very few people actively
engage in political parties. Nevertheless, political parties have been very important organisations
in democracies and much research has tried to theorise the nature of ties between citizens and
political parties which in turn may lead to certain voting behaviour. In my opinion, it is utterly
fascinating to scrutinise why individual citizens identify themselves with political parties and the
effects that may result on an aggregate level: “Any examination of party support (…) similarly
provides the impression, that there are ‘floors’ below which currently unpopular parties never fall
and ‘ceilings’ above which even the most popular parties never break through” (Bartle and
Bellucci 2009a: 4). The general research question is two-fold: Firstly, which factors lead people
in Europe to develop attachments to political parties with various degrees of strength? More
specifically, which individual and aggregate level characteristics influence the strength of this
kind of attachment? Secondly, which role plays party family in explaining how strong an
individual identifies with a political party?
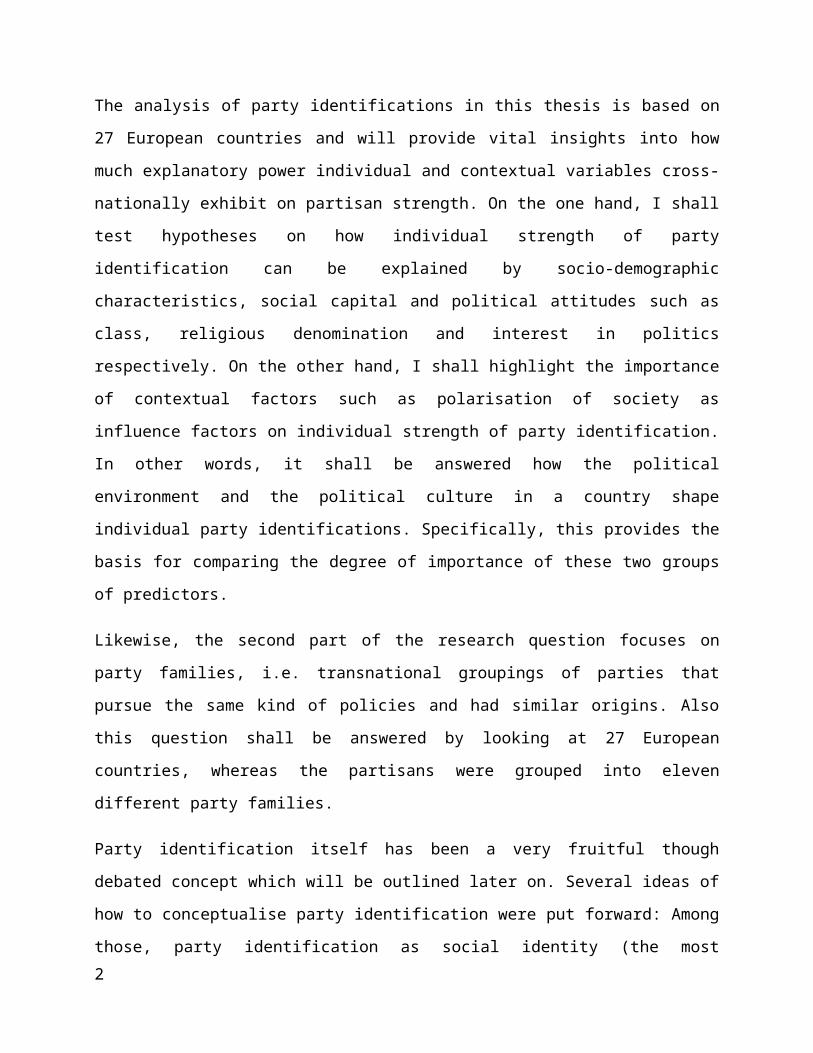
The analysis of party identifications in this thesis is based on 27 European countries and will
provide vital insights into how much explanatory power individual and contextual variables
cross-nationally exhibit on partisan strength. On the one hand, I shall test hypotheses on how
individual strength of party identification can be explained by socio-demographic characteristics,
social capital and political attitudes such as class, religious denomination and interest in politics
respectively. On the other hand, I shall highlight the importance of contextual factors such as
polarisation of society as influence factors on individual strength of party identification. In other
words, it shall be answered how the political environment and the political culture in a country
shape individual party identifications. Specifically, this provides the basis for comparing the
degree of importance of these two groups of predictors.
Likewise, the second part of the research question focuses on party families, i.e. transnational
groupings of parties that pursue the same kind of policies and had similar origins. Also this
1
question shall be answered by looking at 27 European countries, whereas the partisans were
grouped into eleven different party families.
Party identification itself has been a very fruitful though debated concept which will be outlined
later on. Several ideas of how to conceptualise party identification were put forward: Among
those, party identification as social identity (the most prominent advocates nowadays are Green,
Palmquist, and Schickler 2002) and party identification as affective attachment (e.g. Lewis-Beck
et al. 2008) are the most popular opponents. To locate party identification in the tradition of vote
choice research, I shall shortly present the three main approaches of explaining vote choice.
The emergence of theories which aim at explaining voting behaviour dates back to Paul
Lazarsfeld and his colleagues who sought to explain individual voting behaviour by certain group
memberships (Lazarsfeld, Berelson, and Gaudet 1948). In other words, primary groups were seen
as the main anchoring points which, at the same time, determine voting behaviour to a large
degree. For example, belonging to a milieu that is dominated by the working class may produce
an almost irresolvable link towards the party that represents the working class: the respective
labour or social democratic party. This mainly happens due to the large extent and virtual
universal availability of goods and services provided by mass organisations closely interwoven
with the party. A second important factor is interpersonal communication which reinforces
current values and attitudes if the milieu features a high degree of ideological closure in
comparison with other milieus. Although they studied short-term election campaign factors, they
viewed rather static social characteristics as major explanatory variables for vote choice (Clarke,
Sanders, Stewart, and Whiteley 2009: 88-89).
Conversely, Angus Campbell and his colleagues (1954) related their model of voting behaviour
to three concepts that are not static as Lazarsfeld’s group membership but that may vary between
different election situations: Party identification as long-term attachment, issue orientation and
candidate orientation as short-term factors. In their view, party identification is the crucial link
between social background and vote that is missing in Lazarsfeld’s analyses (Budge 2010). Major
influence is exhibited by secondary groups (i.e. the parties) which serve as anchoring points
(Bartle and Bellucci 2009a: 5), although the Michigan scholars do not neglect the influence of
primary groups. Their approach focuses on individual political orientations and perceptions rather
than milieu and social status (Schoen and Weins 2005: 189). In other words, the long-term factor
2
and the two short-term factors connect voting behaviour to personal attitudes rather than
externally predefined personal characteristics. In their view, political parties were able to
maintain their position because they function as “points of psychological anchoring” (Campbell
et al. 1954: 107).
For the sake of completeness, one step further, Anthony Downs’ (1957) economic view on
democracy neglects the importance of any sociological background for voting behaviour and
focuses on considerations of costs and benefits of the act of voting itself instead. As rational
actor, a voter is well aware of her interests which can be ranked according to a sense of personal
importance. Given that the voter has sufficient information on parties and programs, she would
favour the alternative that promises most benefits for her.
In conclusion, the Michigan model of voting behaviour takes a middle position between the first
and the latter approach. It has been a very fruitful theoretical approach for the explanation of
voting behaviour in democratic countries within the past decades and despite the criticism
directed to the concept, which will be addressed below, party identification is valuable and
certainly not a specific US-American concept (Grofman, Wayman, and Barreto 2009: 60). After
all, “party identification is the most enduring of political attitudes, responsible for shaping a wide
variety of values and perceptions” (Miller and Shanks 1996: 117). This is why a study of party
identification is particularly interesting: It is connected to many other characteristics and serves
as proxy for how well a citizen is integrated into today’s post-industrial civic society.
The original formulation of party identification shall serve as point of departure for a deeper
cross-national analysis of ties between citizens and political parties. As Key (1958: 638)
formulates, “the appropriate cross-national analysis might shed light on the question of the
relation between extent and nature of citizen participation and the character of political systems
in the large”. Several studies have dealt with cross-national comparisons (for example Berglund,
Holmberg, Schmitt, and Thomassen 2005; Holmberg 1994; Schmitt and Holmberg 1995); these
studies, however, were limited to a small number of Western European countries. This thesis
shall therefore provide vital insights into individual and contextual factors that determine the
strength of party identifications across 27 European countries, including both established and new
democracies.
3

In particular and as indicated above, I shall analyse the effect of variables with differing degrees
of invariance according to the lifetime learning model, ranging from unchangeable features such
as birth cohort to relatively volatile characteristics such as interest in politics. To illustrate,
interest in politics and media usage are chronologically much closer to the dependent variable –
strength of party identification – than for instance birth cohort or social class; moreover, it makes
sequential analysis an indispensable tool for the analysis carried out in this thesis. Among others,
emphasis is placed on the theory of cognitive mobilisation which shall be tested by applying
several indicators. The specific nature of the data at hand allows for the inclusion of variables that
characterise countries rather than individuals. This approach helps to underpin the importance of
political climate and political culture as well as political socialisation into society in terms of
partisan attachments. Polarisation, fragmentation and electoral disproportionality are of special
interest since no systematic study has been carried out with a large scale sample of both
individuals and countries.
In conclusion, both individual and contextual factors prove to be important, although particularly
individual level predictors show strong effects. Despite recent decline tendencies in partisanship,
the results confirm the widespread existence and importance of party identification. As Lewis-
Back and his colleagues (2008: 126) point out, “a person’s party identification is the most
important piece of information that we can obtain to help us understand their political attitudes
and vote choice.”
This introduction is followed by the theoretical discussion of the concept party identification.
First, the nature, origin and development of party identification will be dicussed from different
theoretical and scholarly points of view. Since the concept originates from the American
presidential campaigns, a comprehensive section is dedicated to identify similarities and
differences between the United States and Europe on the one hand and then further within
Europe, i.e. between the Western and Eastern part of Europe. The hypotheses are located at the
end of the theoretical chapter, starting with individual level hypotheses via the intermediate level
hypothesis of party families to the contextual-level propositions and followed by the control
variable discussion.
The next chapter deals with methodological considerations. Apart from the presentation of the
three main data sets that are used – European Social Survey, Comparative Political Data Set III,
4

Manifesto Data Set – the countries under analysis are introduced. Afterwards, the independent
variable is constructed by using two different variables available in the cumulative ESS data file.
It proved useful grouping the countries into five originally geographical but more culturally
similar regions: Western, Eastern, Southern, Atlantic Europe and the Nordic countries. The
following sections deal with technical issues on how the independent level 1 variables can be
operationalised, for example cognitive mobilisation by using factor analysis and index
construction. Especially the operationalisation of the level 2 variables – polarisation,
fragmentation, disproportionality and maturity of democracy – required sophisticated calculations
which are therefore presented in the method chapter, alongside with graphs that show the
countries ranked according to their values on these four variables. The last section of the method
chapter elaborates on the causal model that has been applied as well as on the technical
background of the ordered logistic multilevel regression technique that produces results which
are displayed and discussed in the empirical chapters.
There are two empirical chapters, one about either of the two-fold research question. In fact, the
first empirical chapter contains the analysis and interpretation of the level 1 and level 2 variables
according to the hypotheses. Besides, the predictive power of the model is assessed. The second
empirical chapter focuses on party family as intermediate level variable and its explanatory
power. The explanatory power of party family as independent variable is rather small;
nevertheless, the analysis generated interesting findings.
The last chapter summarises the findings presented in the thesis and places the results into a
broader context of party identification as concept worth studying. Though this thesis can
contribute to the research on party identification, many other interesting factors appear
scientifically appealing.
5
2 Theory
At first, I briefly discuss the nature and origin of party identifications in the electorate. The
following two sections deal with remarks on stability and development of party identification
among citizens. Developed in the American context, some confinements are highlighted in
sections about party identification in Western and Eastern Europe. This chapter is concluded by
the hypothesis that will be tested in the models to be fitted.
2.1 The Nature of Party IdentificationElections in virtually all modern democracies are nowadays dominated by parties competing for
parliamentary seats and government positions. Campbell et al. (1954: 88) describe political
parties as “sprawling, loosely knit organisations, (…) [that] provide the mechanisms through
which the activities of millions of partisan followers are stimulated and integrated during the
campaigns”. But what characterises a partisan follower according to that reasoning? It is a person
who has a certain sense of attachment toward the party of her choice (Campbell et al. 1954: 88-
89). “Choosing” a party one identifies with actually indicates active engagement in political
processes and the ability to trade different parties off against each other concerning their political
issues and candidates over time. However, “choosing” should not be misinterpreted as mere
consideration of gains and losses, but as feeling of ideological closeness or distance. According
to the classical definition, party identification is psychological in nature and not rationally
chosen. Thus, on the one hand, the Michigan model is far beyond the static view on the electorate
that Lazarsfeld provided which was described earlier. On the other hand, the choice that voters
make during elections is not simply based on mere considerations of cost and benefit, for a
person’s partisanship in terms of Campbell et al.’s concept is path-dependent to a certain degree
and does therefore not exist without the retrospection of previous voting experience1.
1 Although Campbell and his colleagues were not sufficiently explicit about the retrospective effects of voting behaviour, accusations raised against their model were in part too harsh and exaggerated.
6
In their later work, Campbell and his colleagues adjusted their view on party identification as key
concept in their voting model accordingly as reaction to the criticism by using field theory: “The
field-theoretical alternative is to measure the individual’s party identification at the current time,
on the assumption that this is a perfect distillation of all events in the individual’s life history that
have borne upon the way in which he relates himself to a political party” (Campbell et al. 1960:
34). That is very much in line with what Rose and McAllister (1990) 30 years later formulate in
7
Figure 2-1: Lifetime Learning Model of Voting.
Source: Own figure after Rose and McAllister (1990: 36).

their ‘lifetime learning model’: Political views reflect the accumulation of a lifetime learning
process (Rose and McAllister 1990: 35). Already at an early point in life, namely in the family,
individuals are taught to identify with one party and to think of another party as unacceptable
(Rose and McAllister 1990: 35). In other words, the fundament for party identification is laid in
youth, but the building of a stable (or similarly decay of) party identification continues
throughout the whole life. Figure 2-1 shows this relation between time and development of party
identification according to the lifetime learning model. Crucial points in life such as reaching
legal age may lead to a more intense preoccupation with study-, work- or family-related topics.
Specifically, the individual becomes aware of her socio-economic interests based on her current
social status and prestige. This is accompanied by the current milieu where the individual lives;
she is therefore exposed to influences by her surroundings. The factor that is closest to the
outcome party identification is the assessment of the current government. Though meant to
explain vote choice, Rose and McAllister’s model serves well as theoretical construct about the
emergence of party identifications.
Having described the common point of departure of different approaches, this is where the
models propose different indications. The classical view insists on party identification as “long-
term stable predisposition” (Miller and Shanks 1996: 512), an affective attachment to a political
party that includes previous voting experience as well as approval and/or disapproval of previous
party candidates and party stands. Nevertheless, “for most people these party attachments do not
change easily as candidates come and go on the national scene” (Campbell et al. 1954: 97).
Party identification is neither a simple membership in a given political party nor a voting record
(Campbell et al. 1960: 121), i.e. it is psychological (or attitudinal) and not behavioural.
Nevertheless, party identification as concept does not make any sense without empirical
implications. Behavioural manifestations of compliance with party standards due to a distinct
party identification may be “[e]arly decision, lack of vacillation in decision, and straight-ticket
voting” (Campbell et al. 1954: 147).
Panel studies have shown that this kind of party attachment known as party identification is
somewhat stable over time (Green and Schickler 2009; Kroh and Selb 2009; Lewis-Beck et al.
2008: 111-112), thus proving a high degree of reliability. Therefore, it might seem reasonable to
follow Miller and Shank’s argumentation which sees party identification as “an extension of
8
one’s ego to include feeling a part of a group” (Miller and Shanks 1996: 120) and compares party
affiliations with religious affiliations. They also emphasise the feeling of “oneness with the
identified group (that) provide[s] structure, organisation, and coherence to one’s thinking” (Miller
and Shanks 1996: 121). In other words, “it may be that for many people party identification does
not have the capacity to stimulate overt activity, but does have the power to command support on
the psychological level of preferences and attitudes” (Campbell et al. 1954: 108). Conversely,
advocates of the retrospective approach neglect the conceptualisation as social identity because
“affective attachments are not the only kind of predisposition that affects the vote” (Budge 2009:
26). In line with the lifetime learning model, only the onset of party identification might be based
on social identity, whereas individual evaluations of parties, candidates and elections gain
influence throughout the course of life.
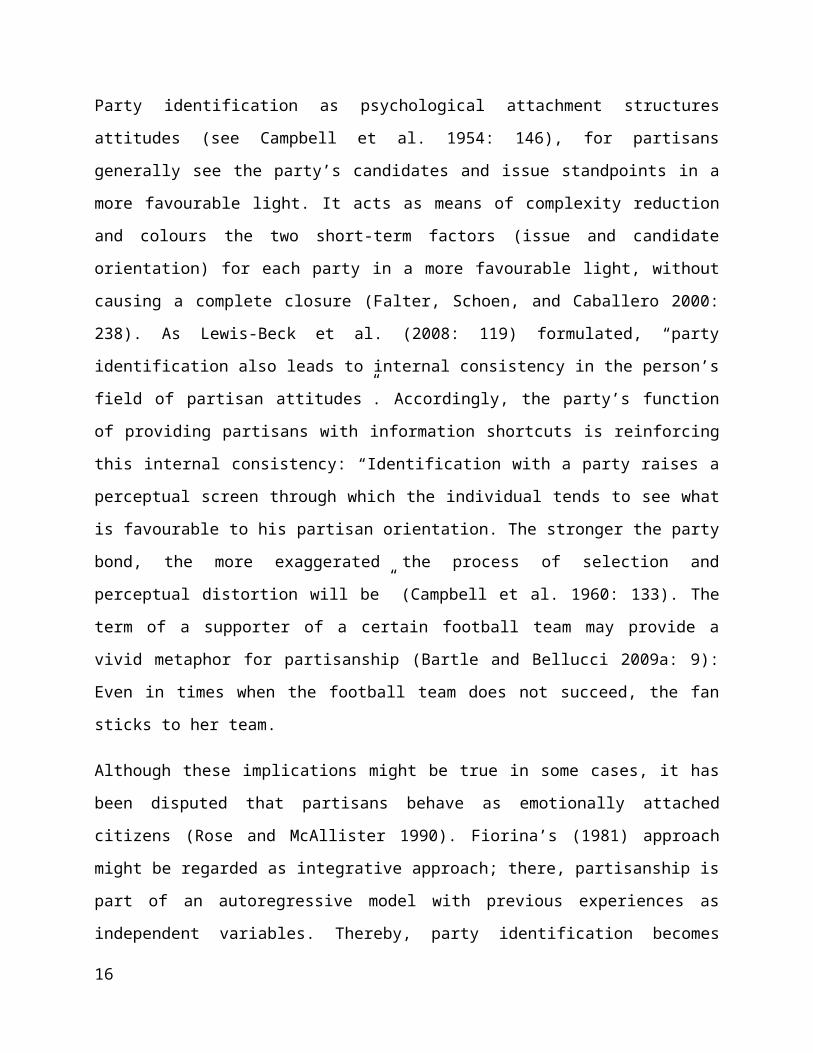
Party identification as psychological attachment structures attitudes (see Campbell et al. 1954:
146), for partisans generally see the party’s candidates and issue standpoints in a more favourable
light. It acts as means of complexity reduction and colours the two short-term factors (issue and
candidate orientation) for each party in a more favourable light, without causing a complete
closure (Falter, Schoen, and Caballero 2000: 238). As Lewis-Beck et al. (2008: 119) formulated,
“party identification also leads to internal consistency in the person’s field of partisan attitudes”.
Accordingly, the party’s function of providing partisans with information shortcuts is reinforcing
this internal consistency: “Identification with a party raises a perceptual screen through which the
individual tends to see what is favourable to his partisan orientation. The stronger the party bond,
the more exaggerated the process of selection and perceptual distortion will be” (Campbell et al.
1960: 133). The term of a supporter of a certain football team may provide a vivid metaphor for
partisanship (Bartle and Bellucci 2009a: 9): Even in times when the football team does not
succeed, the fan sticks to her team.
Although these implications might be true in some cases, it has been disputed that partisans
behave as emotionally attached citizens (Rose and McAllister 1990). Fiorina’s (1981) approach
might be regarded as integrative approach; there, partisanship is part of an autoregressive model
with previous experiences as independent variables. Thereby, party identification becomes
sensitive to current political events and its status as social identity becomes watered down. To
sum up, it appears to be more logical that partisanship is responsive to political events and not an
9

“unmoved mover”. Even Green and Schickler (2009: 195-196) admit that party identification
emerges due to evaluation which is very much in line with Fiorina’s arguments. In connection
with repeated vote choices, these evaluations may transform into a party identification (Converse
1976).
Holding a party identification is related neither to approval or disapproval by other citizens nor to
any “costs”, although group loyalty might lead to group pressure in terms of compliance with
party stands conformity. Therefore, formal membership, consistent voting record and formal
recognition are not necessarily required components of a party identification. Rather, party
identification is a psychological identification with a party that differs in strength across
individuals and that might be either positive or negative (Lewis-Beck et al. 2008: 112).
Typical measures of party identification include a certain degree of closeness to a party, whereas
perceived distances towards parties are mainly disregarded. The literature mainly focuses on
‘positive’ identifications with political parties; that is, a person values and approves a party’s
10
←Probably will vote Democratic 0.5 Probably will vote Republican→
Figure 2-2. Ideal relationship between strength of party identification and probable direction of vote in the US.
Source: Own figure after Campbell et al. (1960: 137); Lewis-Beck et al. (2008: 122).

political program, its standpoints and actions. Conversely, a ‘negative’ identification reflects a
person’s disesteem and disapproval with one or more political parties. Especially in Eastern
Europe, this distinction is valuable since fewer people state a party identification. However, most
people would be able to name parties they feel particularly distant (Rose and McAllister 1990)2.
If there was only party identification that affected a voting decision, we would expect a
distribution of voters similar to figure 2-2. This basic model is also known as the “normal vote”,
where only party identification is assumed to have an impact on the actual voting decision
(Converse 1966). However, the ideal curve can never perfectly be achieved, since factors other
than party identification influence the probability of voting for one party or the other. As a result,
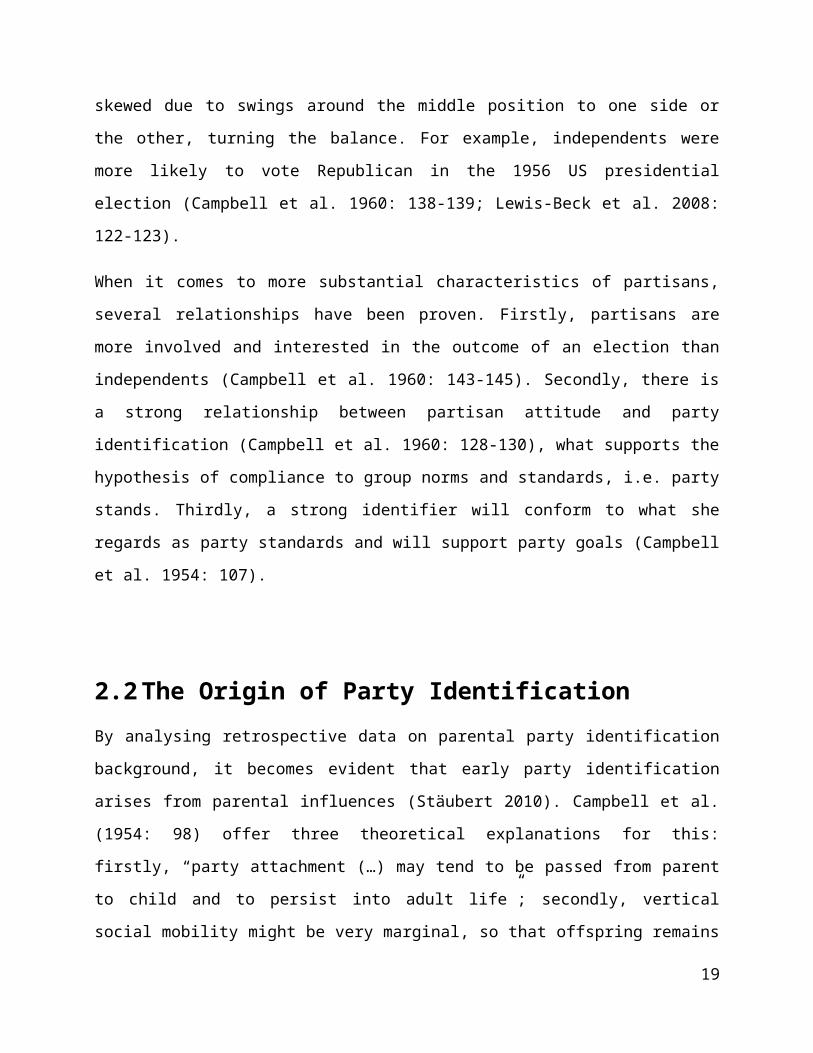
the independents’ curve might be skewed due to swings around the middle position to one side or
the other, turning the balance. For example, independents were more likely to vote Republican in
the 1956 US presidential election (Campbell et al. 1960: 138-139; Lewis-Beck et al. 2008: 122-
123).
When it comes to more substantial characteristics of partisans, several relationships have been
proven. Firstly, partisans are more involved and interested in the outcome of an election than
independents (Campbell et al. 1960: 143-145). Secondly, there is a strong relationship between
partisan attitude and party identification (Campbell et al. 1960: 128-130), what supports the
hypothesis of compliance to group norms and standards, i.e. party stands. Thirdly, a strong
identifier will conform to what she regards as party standards and will support party goals
(Campbell et al. 1954: 107).
2.2 The Origin of Party IdentificationBy analysing retrospective data on parental party identification background, it becomes evident
that early party identification arises from parental influences (Stäubert 2010). Campbell et al.
(1954: 98) offer three theoretical explanations for this: firstly, “party attachment (…) may tend to
be passed from parent to child and to persist into adult life”; secondly, vertical social mobility
might be very marginal, so that offspring remains in the same social class as their parents (which
2 An analysis would be fruitful but is not possible with the data at hand.
11

is somehow in line with the early arguments of Lazarsfeld); thirdly, the recall mechanism is
simply biased. These retrospective data were later complemented by panel data that clearly
supported the hypothesis of the inheritance of party identification (cf. Zuckerman, Dasovic, and
Fitzgerald 2007).
In their later works, Campbell et al. (1960: 147) point out that “the high degree of
correspondence between the partisan preference (…) may be taken as a rough measure of the
extent to which partisanship is passed from one generation to the next“. In a broader perspective,
political socialisation occurring in the family is a process by which individuals are expected to
adapt to societal values and norms by internalizing those (Hermann 2009: 107). Numerous
articles have been published covering trends of decline in PID (for an overview see Arzheimer
(2006)) which is of special interest since party identification of a majority of citizens is only
possible if subsequent generations are socialised in this manner (Mößner 2006: 337).
Campbell and his colleagues were also able to show that the transmission of party identification
from parents to their children correlates positively with the degree of politisation in homes: While
children in active homes tend to develop party attachments, children in inactive homes are more
likely to develop partisan independency. Lewis-Beck et al. (2008: 140-141) and Kroh and Selb
(2009: 114-115) have proved the stability of this relationship today.
Sears (1975: 106) reminds that naive positive attitudes develop at an early stage of childhood, but
being replaced by more active evaluations. Research showed that party identifications rapidly
increased from the age of 11, thereafter gradually increasing during the rest of life (Sears 1975:
119). Admittedly, these findings applied to the United States; European children tended to
develop a party identification a little earlier than their American counterparts (Sears 1975: 120).
Three major reasons for weaker party identifications among children compared to adults were
found by Vaillancourt and Niemi (1974: 144-145): Firstly, there are few major elections in
childhood that children are actually aware of; secondly, elections are much less important for
children; thirdly, children might observe a mismatch between parental party identification and
vote choice. This makes the pre-adult phase the weakest link in the intergenerational party chain
(Jennings and Niemi 1976; Vaillancourt and Niemi 1974: 146).
12

Lewis-Beck et al. (2008: 134) adverted to the conception of party identification as based in a
rational choice tradition, although other researchers conceptualised party identification as
“running tally” (Fiorina 1981) that takes voting experience into account, as the field-theoretical
approach does. In conclusion, the origin of party identification is much more complex than
theorised in the first place. Yet family plays a major role, other groups and social settings at later
points in time such as elections have influence, too. As a consequence, the multiplicity of origins
might cause differing significance, meaning and consequences of party identification (Miller and
Shanks 1996: 163).
Despite these findings, reinforcement might explain the transmission but not why people choose
to identify in the first place (Shively 1979: 1040). Shively (1979) drafts a functional model of
party identification which takes five variables into account about the onset of party identification:
(1) The sense of civic duty in terms of political participation (motivation)
(2) Cost of information inherent in voting choice (magnitude of information costs)
(3) Available resources in order to pay these costs (capacity to bear costs)
(4) Concern for the quality of the decision
(5) Availability of alternative cost-saving devices
The probability of developing a party identification is directly proportional to (1) and (2),
whereas (3) and (5) are inversely proportional linked to party identification. In addition,
moderately low concern for the outcome (4) is seen as beneficial in terms of party identification
(Shively 1979: 1040-1042). However, this last proposition might not fit into nowadays pattern,
since cognitive mobilisation has contributed to increase or at least stability rather than decline of
party identification (Arzheimer 2006; Berglund et al. 2005).
Despite the disagreement about the influence of the various socialisation institutions, there is an
ongoing debate whether party identification is “based on affect rather than cognition” and is “part
of a person’s self-concept” (Lewis-Beck et al. 2008: 134) or whether its main source is cognition
(Thomassen and Rosema 2009: 43). I advocate a mixed approach that views party identification
as inherited social identity in the first place that is being replaced by political experiences and
evaluations successively throughout an individual matures. The strength of bridging both
approaches is the sensitivity to external political and societal influences which moves party
13

identification into a more endogenous position in terms of voting behaviour. Having said this,
different political and social settings may produce different strengths of party identification as a
function of citizen’s response to these institutional settings.
2.3 Stability and Development of Party IdentificationPolitical orientations such as party identifications origin partly from the current milieu, which is
the family in case of young voters and youth that hasn’t arrived at voting age yet (Campbell et al.
1960: 146-147). However, Campbell and his scholars theorised the influence of early
socialisation as superior to influences that occur after the individual has left its home. In their
words, “identification with political parties, once established, is an attachment which is not easily
changed” (Campbell et al. 1960: 148-149) and “that persons who identify with one of the parties
typically have held the same partisan tie for all or almost all of their adult lives” (Campbell et al.
1960: 135). Neither change of candidates nor alterations in the nature of issues disturb
partisanship of the electorate as a whole, thus promoting the hypothesis that citizen’s party
attachments have persisted through time, i.e. a number of elections (Campbell et al. 1960: 121).
Avoiding being repetitive, the lifetime learning model provides a more intuitive and complex
concept of party identification that takes aggregate changes in society as well as individual
changes into account.
Regardless of their emphasis on the great importance of parental influence, Campbell et al.
(1960: 149-150) identified two major driving forces for fluctuations in party identification:
Personal forces which directly relate to the individual itself, and social forces that denote changes
at a larger scale, namely the social grouping of a society. Regarding the first type of force, change
of milieu is the main reason for shifting partisan loyalties:
“A marriage, a new job, or a change in neighbourhood may place a person under strong
social pressure to conform to political values different from his own. Close personal
relationships are usually associated with common political identifications (…). Although
there are many strong-minded people who hold out despite the pressure implicit in this
14
type of situation, others find it more congenial to accept the coloration of those persons or
groups whose approval they value” (Campbell et al. 1960: 150).
At the individual level, Lewis-Beck et al. (2008: 130-133) conclude that party attachments
established in early adolescence period may not always be as stable as Campbell and his
colleagues assumed which again supports the view of party identification as function of
experience with political parties and their personnel. They found that most partisan shifts occur
due to personal rather than social forces. Lewis-Beck et al. (2008: 134-135) emphasise that party
identification by no means takes the role as “unmoved mover” and that party identification is
affected by political forces. Hence, the assumption of long-term stability of partisan attachments
attained in youth does not always hold.
Research carried out by Miller and Shanks (1996: 153) proved that not only the level, i.e. the
mere number of persons identifying with a political party, but also the strength (i.e. intensity) of
party identifications has declined in the US. This leads to the question what forces influence the
intensity of a party identification. Campbell et al. (1960: 161) presumed that the intensity of party
identification strengthens over time: “the longer a person thinks of himself as belonging to a
party, the stronger his sense of loyalty to it will become” (Campbell et al. 1960: 163). This simple
15
Figure 2-3. Exemplification of a non-recursive model for the American case.Source: Own figure according to Campbell et. al (1960).
assumption of a lifelong increase in
intensity has been invalidated by Abramson
(1976; 1979; 1992). I will shed light on the
relationship between age and intensity of
party identification later in this chapter. The
same applies to recent trends (mainly
decline) and their explanations (cognitive
mobilisation, weakening of social ties,
shrinking groups).
2.4The Location of Party Identification in the Ann-Arbor ModelApart from party identification, two short-
term factors, issue and candidate
orientation, exert influence on the final
voting decision (cf. Lewis-Beck et al. 2008:
120). None of these three concepts might
solely explain voting behaviour, but
Campbell et al. (1954: 86-87) point out that
voting behaviour is a function of coaction of
party identification, issue and candidate
orientation. Specifically, corresponding
factors raise the probability of voting, while
conflicting orientations reduce this
probability (Campbell et al. 1954: 87, 157-
164). The Michigan model considers
16
Figure 2-4. Funnel of causality model.
Source: Own figure after Lewis-Beck, Jacoby, Norpoth, and

political orientations as intervening variables between social structure and voting behaviour
(Schoen and Weins 2005: 195).
Based on that, a non-recursive model (figure 2-3) can be expressed to model electoral choice. The
advantage lies in its assumption of reciprocal relation between each of the factors. In that
reasoning, party identification with one of the two major US American parties that is connected
to the social milieu, influences both candidate image and issue orientation. Moreover, these two
short term factors may weaken or strengthen party identification over a range of election if
candidates and issues do not find approval of the identifier or if candidates and issues brought up
by the party correspond to the individual’s opinions. There is also interdependency between
candidate image and issue voting. Although a non-recursive model overcomes some of the
weaknesses of the assumption of one-way causations, it makes the model more confusing and
impossible to estimate, since there would be more effects to be estimated than variables available.
Hence, it is advisable and necessary to limit some of the backward effects to be zero.
In order to make this original model more visible, the “funnel of causality” (Campbell et al. 1960:
24-32; Lewis-Beck et al. 2008: 22-24) was introduced. It explains metaphorically how a certain
electoral choice materialises given a set of prior variables that exist in different time dimensions
(figure 2-4). Socio-demographic characteristics stand behind the concept of party identification
which again determines issue and candidate orientation to a certain degree. However, the funnel
metaphor does not capture the full variety of processes involved in electoral choice. Furthermore,
the possible repercussive effects of the short-term factor on party identification as suggested by
the lifetime learning model are not included. In order to allow for such effects caused by the
specific nature of political systems, party competition and elections, I advocate a model indicated
by figure 2-1 – the life-time learning model.
2.5 Party Identification in the United StatesCampbell et al. (1954) based their analysis on the American political system, where two parties
de facto exert hegemony in the electoral arena. Not surprisingly, Campbell et al. (1960: 127)
found that “nearly everyone (…) could be placed on a unitary dimension of party identification”.
17

According to the measurement of PID, the operationalisation has been two-fold: firstly, people
where asked whether they think of themselves as Democrats, Republicans or independent3.
Partisans were then asked how strong they feel attached to their party. A subsequent question
prompted independents to stating closeness to one of the two parties which were then categorised
as partisan leaners (independent democrats or independent republicans). Those who insisted on
being independent, where categorised as “true” independents (Campbell et al. 1960: 122-125;
Campbell et al. 1954: 90-91). In this way, nearly the whole electorate can be grouped one-
dimensionally along the strength of their party identification (figure 2-5). The reliability of this
measurement has been proven several times by its stability over time. The validity was analysed
by cross-checking theoretical expectations about conflicting situation with survey data; e.g.
strong partisans tend to vote for “their” party, even though they did not agree with or like the
party’s candidate (Campbell et al. 1954: 93-95). Furthermore, asking identifiers whether they
ever thought of themselves as partisan of the opposite party reveals that only very few admitted
that they once had the opposite PID (Campbell et al. 1954: 102).
Nevertheless, methodological problems were uncovered: Firstly, grouping the leaners that were
prompted with the second question into the same seven-point scale presumes an equal distance
between this category of leaners and the categories of weak identifiers. Petrocik (1974) and
Fiorina (1981: 103-105) referred to that fact as “intransitivity” and Petrocik (1974: 40) concludes
that this index of party identification is neither linear nor monotonic with regard to all kinds of
political involvement. Secondly, most of the independent leaners deny temporally extended self-
identity (Miller and Shanks 1996: 126), although two factors in operationalisation of party
identification are highly important: an extended time horizon and a sense of self-identity (Miller
and Shanks 1996: 125). Thirdly, Campbell et al. found that naming oneself a “strong” identifier
3 “Generally speaking, do you usually think of yourself as a Republican, a Democrat, an independent, or what?” The follow-up question for identifying leaners is: “Do you think of yourself as closer to the Republican or Democratic party?”
18
Figure 2-5. Partisans in the USA.
Source: Own figure after Campbell et al. (1954).
Strong Republican
Weak Republican
Independent Republican
IndependentIndependent
DemocratWeak
DemocratStrong
Democrat

might not always correspond to an objective strong party identification, for the category “strong”
leaves space for individual interpretations of its meaning (Campbell et al. 1954: 96-97).
Recent trends in the United States are downwards: Though still the majority of Americans are
able to classify themselves into the 7- or 3-point scale, the pure number of identifiers has
decreased within the last decades (Bartle and Bellucci 2009a: 13).
2.6 Party Identification in EuropeThe presented measure of party identification in the US does not fit the complexity of most
European party systems. In particular, two characteristics make party identification in Europe
distinct from its American counterpart: Firstly, the existence of minor parties (cf. Campbell and
Valen 1966: 247) and secondly, the cleavage routes of many European party systems (Schmitt
and Holmberg 1995: 98-99). As a result of the first difference, party identifications cannot be
arranged on a scale that captures both direction and strength. Accordingly, those who refuse
holding any party identification in Europe cannot automatically be categorised as
“Independents”, for both independents and people that base their belonging on group membership
fall into this category4. Furthermore, this category must then be placed in the middle of an n-
dimensional continuum, where n corresponds to the number of political parties considered as
important for categorising a party system.
As mentioned, it has been an issue of scientific discourse whether party identification in the US
can be regarded as one-dimensional; however, the perception of party identification as continuum
with Republican and Democratic partisanship as its uttermost poles prevails (Lewis-Beck et al.
2008: 130). Contrary to the US, multiparty systems and thus multidimensional partisanship is the
norm in Europe rather than an exception.
In an attempt to transport the concept of party identification to the Netherlands, Thomassen
(1976) draws a rather dark conclusion about the applicability of the concept. He found that party
identification is less stable than the vote or even equivalent to the vote (Clarke et al. 2009: 98-
4 Lewis-Beck et al. (2008: 173) identified the problem of respondents that are «closet partisans» that actually lean towards a party while they believe that a good citizen should hold an independent position. However, severe methodological problems are not expected to arise from this group. On the contrary, in European countries, an independent position is not explicitly offered.
19
101; Holmberg 1994: 100), that party identification and vote preference cannot be distinguished
and that party identification is not causally prior to the vote (Budge 2009: 31; Holmberg 1994:
98-99; Thomassen 1976: 77; Thomassen and Rosema 2009)5. As a result, “lasting party
identification does not mean impregnable party identifications in political systems where people
vote for parties, not for candidates” (Holmberg 1994: 100). However, in certain national election
studies (e.g. Britain), respondents were forced into the identifier category, because no
independent category was provided, producing a lack of face validity (Bartle and Bellucci 2009a:
18). In addition, research proved that question order mattered. In their article, Heath and Pierce
(1992) were able to attribute some of the instability to differing question order. Since the urge for
consistency is larger when vote is asked before party identification, they recommend “that more
‘true’ identifiers are uncovered when the question about party identification precedes the question
about current electoral preference than when it follows it” (Heath and Pierce 1992: 103). Other
authors such as Green and Schickler (2009) advert to the specific nature of the Dutch party
system in the 1970s which might derogate the validity of the results obtained by Thomassen.
As foreshadowed above, research proved that party identification is much more closely related to
party vote than in the US, thus not allowing for an analysis of the normal vote based on
partisanship versus the short-term factor driven vote (Berglund et al. 2005: 106; Thomassen and
Rosema 2009: 44). In fact, my calculations based on the ESS data show that the correlation6
between party vote and party identification in all countries covered is very high, indicated by
values of Cramer’s V around .70 which points to the very close relationship between these
concepts (figure 2-6). The first column in each of the graphs shows the correspondence between
vote and party identification when non-voters are included; hence, the values are slightly lower
than in the second column where non-voters were excluded. For example, roughly 65 percent of
all Swedish partisans voted for the party they identified with. This share increases when those
who did not vote are being removed from the table: Then, more than 90 percent of the Swedish
partisans voted for the party they identify with. In line with Thomassen’s (2009: 52) findings, the
correspondence between vote and party identification in Eastern Europe is not very different from
the one in Western Europe: There is no clear-cut division between East and West. Nevertheless, 5 Thomassen and Rosema (2009) rely on a very different question wording which distinguishes between adherence and attraction to political parties; Green and Schickler (2009: 186) note that this might be error-prone. Furthermore, their selection of countries seems rather arbitrary than based on theoretical explanations.6 Neither party vote nor party identification can be regarded as ratio-scaled variable (ranked according to left-right dimension). Therefore, Cramer’s V is the correlation measure of choice, rather than Pearson’s r.
20

the Nordic countries score particularly high on correspondence between vote and party
identification. Around 91 percent of the partisans voted for the party they identify with (table 2-
1).
21

Already in the 1960s, scholars were concerned with differences between the United States and
European countries. For example, Campbell and Valen conclude that the “phenomenon of party
22
Figure 2-6. Cramér's V (top) and percentage correspondence (bottom) between vote and party identification.
Source: Own calculations based on the cumulative ESS data file.
identification has similar qualities in the two countries (i.e. the US and Norway, the author)”
(Campbell and Valen 1966: 252), although certain features are different on either side of the
Atlantic. A comparison of France and the United States led to the same conclusion (Converse and
Dupeux 1966).
Table 2-1. Mean percentage correspondence between vote and party identification clustered in geographic regions.
Source: Own calculations based on the ESS data file.
Including non-voters Excluding non-voters
Western 76.5 88.3
Eastern 70.1 85.4
Nordic 74.8 90.9
Southern 72.9 85.9
Atlantic 72.5 82.3
When it comes to the object of an identification, there are significant differences between the US
and Europe. Political parties in most European countries cannot be seen as only loosely bound
and decentralised organisations. On the contrary, parties are usually highly centralised, resulting
in a strong position of the party leader, and membership is connected to dues-payment as
substantial source of party revenues. That is, political parties yield much more power over the
electoral arena than in the US, and individual candidates hardly have any chance to enter the
parliament without a political party backing them. As a result, this marks an important difference
compared to the US where basically candidates are exposed to criticism and conflict, whereas
parties are mainly “sheltered” (Campbell and Valen 1966; Holmberg 1994: 100). In Europe, due
to the relative dominance of parties over candidates and policies (Campbell and Valen 1966:
247), the effect is reversed, what leads to “double volatility”, i.e. change in both party
identification and vote choice (Holmberg 1994: 100).
However, the criticism was mainly directed towards the direction of party identification and not
towards the strength component which has been seen as important predictor of people’s political
attitudes and behaviour (Holmberg 1994: 101; Thomassen 2005b: 11).
23

Lewis-Beck et al. (2008: 421) try to explain the persistence of the American two-party system
with the breadth and depth of party attachments in large parts of the electorate. Thus, the political
sphere is virtually taken by the two major parties, leaving very little space for new parties. As for
Europe, party systems emerged that contain more than two, usually more than three parties in
most countries. How would that relate to the existence and strength of party identifications? On
the one hand, a larger number of parties that control the political sphere might lead to weaker
attachments, because one-party governments are unlikely to occur, thus increasing the probability
for discontent about policies and politicians, what might weaken the attachments over time. On
the other hand, this discontent with one party might easily lead to a shift in party identification.
However, as research has shown, people usually do not easily cross the lines of parties (Campbell
et al. 1960: 127; Vaillancourt and Niemi 1974), although the concept of multiple partisanships
could offer a fruitful approach: Instead of holding an independent position, an identifier might
emphasise her attachment to the party she identifies second-strongest.
As briefly mentioned earlier, another important difference is connected to the societal origin of
party identifications. European party identifications are much more related to social structure than
in the US (Berglund et al. 2005: 123; Miller 2010: 27). Therefore, European voters do not
necessarily need a guide such as party identification for making up their mind since group
membership that is settled in the cleavage structure of the society serves this function, although
there is a tendency towards more independency between both that already Shively (1979: 1050)
has predicted as convergence between the US and Europe. A party identification might still take
an intermediate function but it is viewed as redundant by some researchers (Thomassen 2005b:
12). In general, three concepts for explaining ties between political parties and voters exist
(Thomassen 2005c: 258): Cleavages, party identification and value orientations, whereby
cleavages again pander the development of party identification, albeit they do not determine it.
To sum up, the underlying cleavage structures in European countries are supposed to exhibit
more power on voting decision than the intermediate concept of party identification. However,
party identification is a useful concept itself.
24
2.7 Party Identification in Eastern EuropeDespite the methodological problems raised, the concept of party identification has been
transferred successfully not only to several Western and Northern European but also to Eastern
European countries (Schoen and Weins 2005: 199-200). However, it was especially doubtful
whether party identification is a concept that is understood in East European countries. Miller and
Klobucar (2000) have proven the applicability of the concept in the post-communist societies of
Russia and Ukraine, where about half of the population can name a party that expresses one’s
views better than any other party (Miller and Klobucar 2000: 669). In addition, Rose and Mishler
(1998) drew attention to the importance of both negative and positive party identification in post-
communist countries (table 2-2). The former is held by the vast majority of citizens, whereas the
number of persons positively identifying with one of the political parties is considerably lower
than in Western Europe (Paskeviciute 2009: 132-133).
Table 2-2. Classification of partisans in East Europe according to Rose and Mishler (1998).
Party identification
Yes No
Party never vote for Yes Closed partisans Negative partisans
No Open partisans Apathetic electors
Contrary to Western Europe, Eastern European countries cannot revert to a long history of
independent institutions of civil society since these institutions were under control of the ruling
communist party. Therefore, the Lipset-Rokkan model is difficult to apply (Rose and Mishler
1998: 220). Another aspect closely related to this occupation of the public and political sphere as
a whole by one ruling communist party, is that identifiers are most likely those who had and still
have close ties to the now transformed communist party. In opposition to Western Europe, party
identification might not always be regarded as civic virtue (Rose and Mishler 1998: 221).
Nevertheless, Evans (2006) points out that pre-communist social identities and interests still
persisted through the time of communism and that “[t]here is little to suggest that communism
had removed social divisions in political orientations” (Evans 2006: 262). Despite the
differences, Eastern Europe differs from Western Europe only in few regards when it comes to
25

party identification because party identification relies on attitudes, institutions and longevity of
democratic traditions in both Western and Eastern Europe (Enyedi and Todosijević 2009: 142).
Much research has been carried out to explore the extent of construct validity, because only a
measure that is stable over time and space can be used. Eventually, the results were positive, thus
indicating that party identification cannot be regarded as specifically American concept, although
country characteristics must be taken into account (Schoen and Weins 2005: 208-210).
Having laid out the theoretical foundation of the concept under study, the following section will
deal with the propositions to be tested quantitatively.
2.8 HypothesesFirst of all, the analysis will deal with the comparison of the strength (or: intensity) of party
identifications across the countries covered by ESS. Since the units of analysis represent different
universes, i.e. countries, a multilevel model is indispensable. Multilevel models typically contain
explanatory variables on both level 1 (individuals) and level 2 (countries). Therefore, hypotheses
can be formulated on both levels. This approach is very fruitful since already Campbell et al.
(1960: 157-159) concluded that geographic regions show differences in strength of party
identifications.
Many factors have been named as important for the explanation of party identifications: Nature
of competition, importance of unions and churches as linking organisations, systematic
ideological differences among party families, and the type of electoral rules (Norris 2004: 130).
By studying patterns of party identification of teachers in seven European countries (Belgium,
United Kingdom, France, Netherlands, Norway, Sweden, Germany), Rokkan et al. (1970: 294-
295) provide a fruitful framework for studying cross-national variation in individual party
identification and propose six conceptual contexts (table 2-3). I augmented the table by party
family as meso-level variable, since it can be argued that there are significant differences in
political party families with regard to issue coherence and clarity of programmatic solutions
offered.
26

Mac
ro-le
vel
varia
bles
(1) The political context, i.e. party system, patterns of opposition;
(age of democracy, polarisation, fragmentation)
(2) The legal context, i.e. suffrage, system of representation;
(disproportionality)
Mes
o-le
vel
varia
ble
(7) Party family
Mic
ro-le
vel v
aria
bles
(3) The socio-economic context, i.e. kinship, education, status,
occupation; (education, social class, area of residence)
(4) The communication context, i.e. information about parties and
politics; (interest in politics, newspaper, cognitive mobilisation)
(5) The cognitive context, i.e. images and reflections on one self’s
own situation; (economic performance)
(6) The personality context, i.e. individual development (age, gender)
2.8.1 Level 1 Hypotheses
Both Campbell et al. (1960) and Lewis-Beck et al. (2008) propose that the strength of party
identification is a function of age. In other words, older citizens are expected to hold stronger
party identifications than younger citizens that are “more likely to be moved by the prevailing
political tides because they have not as yet developed stable party attachments” (Campbell et al.
1960: 156). This is because they have not developed psychological ties yet and are not fully
aware of their own political and personal interests.
Group theory tells that identification with a group becomes stronger the longer the individual is
affiliated with the group (Lewis-Beck et al. 2008: 148). Thus, biological age is only an
27
Table 2-3. Framework for the analysis of individual and contextual factors of party identification.Source: Rokkan, Campbell, Torsvik, and Valen (1970: 294-295).
approximation since not all individuals attained an identification in preadult ages, one must
therefore “adjust the clock” when the democratic process interrupted (cf. Lewis-Beck et al. 2008:
149). In addition, age also serves as proxy for voting/party experience (Converse 1976: 12-13,
46).
Regardless of these general statements, the relationship of age and party identification is much
more complex. For example, older people after system change are expected to have weaker PID
than youngsters since they were not able to develop party attachments due to the lack of party
competition (particularly in Eastern Europe, Enyedi and Todosijević 2009; Schoen and Weins
2005: 214). Furthermore, changes in social conditions and political context are more likely to
produce changes in party identification among the young – or newly identified – than among the
old (Miller and Shanks 1996: 184).
H1: Young citizens show weaker party identifications than older citizens.
Integration into civic society or ‘social capital’ has an important effect on many political
attitudes. In the framework of this thesis, social capital shall be looked at as membership in
different non-political secondary groups. Those groups are basically religious denomination as
well as trade union membership, because membership in these groups pushes its members
towards a certain partisan attachment, thus promoting “prematurely strong party identification”
(Campbell et al. 1960: 329-330). As for today, one expects a declining significance of social
group memberships and in a European context, the division Protestant vs. Catholic might exert
larger explanatory power than in the USA (Schmitt and Holmberg 1995). The social-cultural
rootedness of the party system plays an important role, i.e. how closely related partisanship is to
religion, race and ethnicity (Grofman et al. 2009: 64-65). Therefore, religious denomination and
church attendance on the one hand and trade union membership on the other hand are also seen as
indicators for social embeddedness or social capital. Moreover, the membership in other, non-
political organisations is also meant when analysing the impact of social capital. It is not further
specified which organisation is meant; however, it can for example be sport organisations, charity
or voluntary work organisations that themselves serve as proxy for civic integration.
28

H2: Citizens that are active members of non-political secondary groups show stronger party
identifications than their less integrated counterparts.
The theory of cognitive mobilisation assumes a decline in partisanship due to two specific
developments in advanced industrial societies: Firstly, educational expansion and secondly, the
spread of mass media (Dalton 1984: 265). Because citizens acquire skills for processing the
growing amount of information provided by the mass media, the need for information shortcuts
in terms of the functional theory of party identification decreases (Dalton 1984: 267). Therefore,
it becomes easier to involve oneself in politics.
Hence, Dalton (1984) sees cognitive mobilisation as multidimensional concept and distinguishes
between the skills component and the involvement component which is represented by education
and interest in politics respectively. However, I argue that interest in politics may not be specific
enough to capture the whole concept “cognitive mobilisation”, for interest does not necessarily
imply processing and judging the information available. For instance, reading about the most
recent political debate does not need to be linked to any assessment of the political issue under
discussion. In conclusion, a variable that characterises whether or not citizens form opinions
about political issues based on the information obtained must be included. Moreover, it shall be
registered whether citizens in general think that politics is a complex and complicated matter. In
other words, this variable shall capture how often if ever people do meet difficulties in dealing
with political information. In conclusion, a factor analysis shall help to identify different
dimensions of the concept ‘cognitive mobilisation’. There are 5 components I shall analyse
before the regression analysis:
1. The skills component (educational achievement)
2. The interest component (interest in politics)
3. The decisional or assessment component (forming an opinion)
4. The complexity component (politics as complicated or simple domain)
5. The usage of mass media.
29
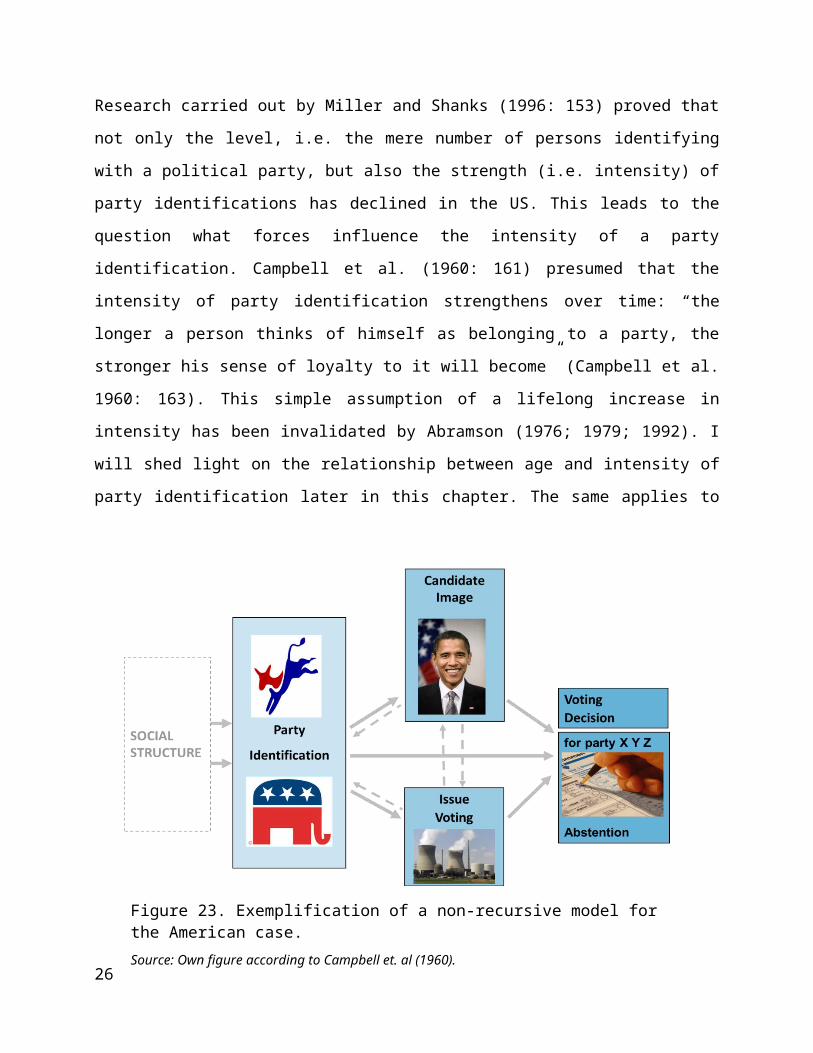
The factors analysis on page 51 will reveal that only 4 of the 5 components have to be retained:
(a) education, (b) interest in politics, (c) involvement (combining no. 3 and 4), and (d) media
usage.
In opposition to the theory of cognitive mobilisation (Dalton 1984; Dalton and Wattenberg 2000),
political interest – or more generally the ability to orientate oneself in the political sphere – may
still have a positive effect on party identification; even Dalton (1984: 267) admits that partisans
are usually more involved than non-partisans. In addition, Converse (1976: 50) found a moderate
relationship between interest in politics and party identification. Cross-tabulating party
identification and interest in politics leads to table 2-4 (Holmberg 1994: 114). In other words, the
expectation would be that habituals become rather partisans than independents despite a wider
toolkit of information processing devices, because party identification is a product of experiences
and evaluations of parties and their candidates.
Table 2-4. Cross-table between party identification and interest in politics.
Source: Figure after Holmberg (1994: 114).
Party identification
Yes No
Politi
cal
inte
rest
High Partisans Independent
s
Low Habituals Apathetics
This “inversion” of the original cognitive mobilisation hypothesis is then assumed to be the
dominant one; an early formulation can be found in Campbell’s work on the American voter: “a
much larger number of people acquire a certain familiarity with political goings on, and it seems
likely that this fact is associated with an increasing identification of oneself with the party
symbols” (Campbell et al. 1960: 164). Berglund et al. (2005: 111-116) were able to disprove the
theorised negative relationship between higher educational achievement and dealignment for
their six West European countries under analysis. They excluded interest in politics because they
regarded it as consequence rather than factor of cognitive mobilisation. However, interest in
30
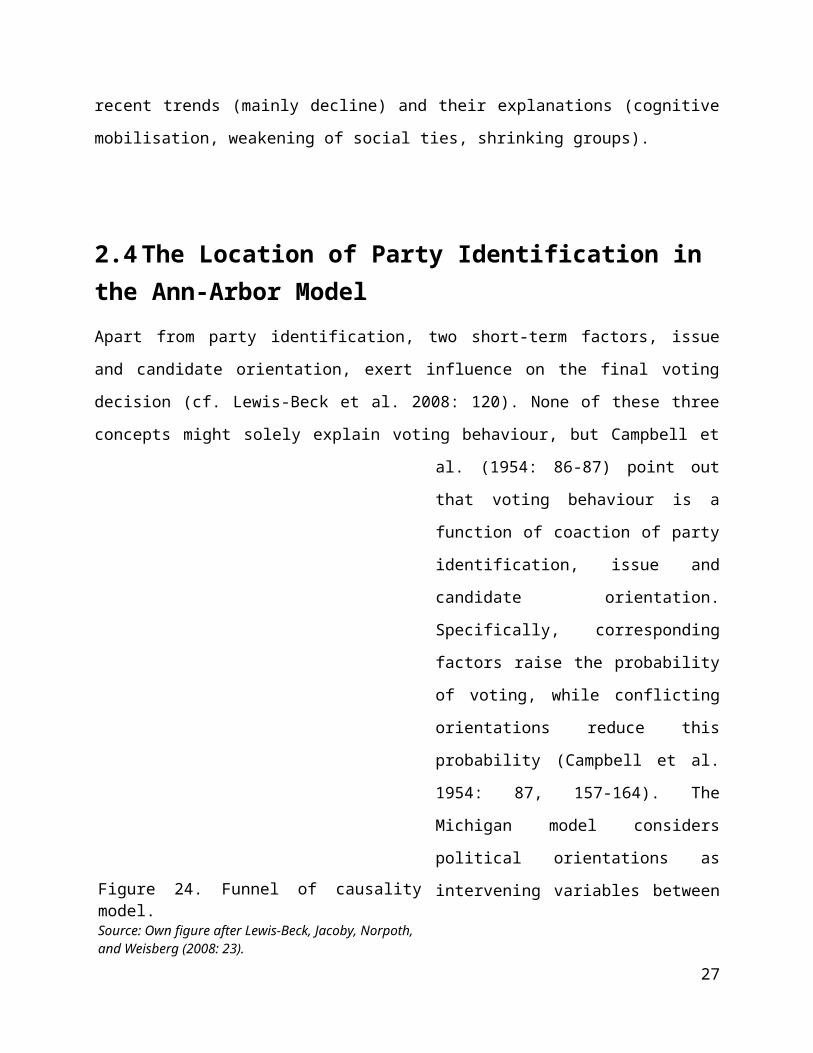
politics is indeed positively correlated with strength of party identification (Campbell et al. 1960:
144-145).
In general and in opposition to Dalton (1984), the dealignment is neither triggered nor accelerated
by cognitive mobilisation, although the expansion of education and the mass media have led to a
larger number of people who do no longer rely on information shortcuts provided by a party
identification. These individuals actually tend to hold party identifications rather than moving
independently trough the political sphere. In a review of research on cognitive mobilisation,
Albright (2009: 258) concludes:
“CM clearly increases the probability that a respondent expresses an attachment to a
specific party, and this positive relationship does not change across cohorts. In fact, there
is some evidence that the positive effect of CM on party attachments is growing even
stronger over time. In sum, neither the micro- nor the macro-level components of the
theory are corroborated by the data.”
Due to the obvious deficiencies of this particular part of the theory of cognitive mobilisation in
some European countries, the theory shall be tested inverted for all countries under study:
H3: Cognitive mobilisation is expected to increase the probability of having a party identification
rather than decrease it.
Taking into account that Eastern and Western European countries differ in many respects, at least
one further variable should be included. As Miller and Klobucar (2000: 671) revealed, one
distinct characteristic of partisans in Russia and Ukraine as representative cases for post-Soviet
societies is their sense of efficacy and institutional trust compared to non-partisans. Therefore, it
seems reasonable to include trust in institutions7.
Despite this evidence, the relationship between trust and party identification is far more
ambiguous than it seems. Some scholars claim that “the positive effect of party identification on
political trust is well established (…) [and] argue that party identification is a predictor of support
7 Though trust in political parties is available, a very high number of missings renders the item almost useless. In addition, it can be expected that partisanship and trust in political parties are very highly correlated.
31

for the political system and its actors” (Söderlund and Kestilä-Kekkonen 2009: 159). In other
words, a party identification serves as incentive for developing a greater level of trust. Miller and
Listhaug (1990) find striking differences between partisans and non-partisans in terms of their
level of trust. Their main expectation is that an attachment to a political party facilitates trust
(Miller and Listhaug 1990: 371-372). However, a certain amount of trust is clearly a pre-
condition for a party identification since it seems exceptionally unlikely that one develops an
attachment to an institution or organisation that she totally distrusts. Having said this, there is
obviously a chicken-or-egg problem: Which came first, trust or party identification? I argue that
some kind of trust is necessary for the evolution of a party identification which is in line with
what Rose and Mishler (1998) found important for the new democracies in Eastern Europe. To
meet the concerns about trust, the relationship between trust and party identification shall be
looked at with greater caution.
Trust can be related to both institutions and individuals, I shall rather focus on institutional trust
since the link between institutional trust and party identification is the most direct one whereas
trust in fellow citizens is a bit more remote. However, also trust in other people represents
integration into civic society and might be regarded as pre-condition for a variety of activities and
if nothing else trust in institutions which consist of individuals. Therefore, interpersonal trust
shall be included as well.
H4a: Trust in institutions is positively related to party identification.
H4b: Interpersonal trust is positively related to party identification.
2.8.2 Intermediate Level Hypothesis
Schmitt and Holmberg (1995: 114) reveal that the strength of party identification varies across
political parties. Although their analysis was limited to Western European countries, they
revealed that Social Democratic and Conservative partisans showed the strongest party
identifications. They even concluded that party family was the strongest predictor of party
identification, amounting for more than 50 percent of the variance, whereas the age of a political
party turned out to be insignificant.
32

The Greens and the new left have tried to foster new cleavages (Lipset 2001: 7) that emerged
recently compared to the classical conflict lines in Western European countries. It can be
assumed that new groups have interests that are more narrowly defined and therefore lead to
stronger party attachments once a party has been formed to represent these new politics. In
addition, parties indelibly associated with critical political events (such as the environmental
movement) are likely to generate strong loyalties (Grofman et al. 2009: 65). The same
mechanism might be applied to people residing in territories with a strong independence
movement. One might expect stronger attachments to regional parties as a consequence of a
cohesive group effect since regional parties promote the conflict between central authorities and
regional independence. Moreover, extreme parties, especially extreme left parties, are more
favourable for strong partisanship (Norris 2004: 137-140; Schmitt and Holmberg 1995: 133)
because they are supposed to tie strong-minded voters up to themselves instead of volatile
pragmatists. Very much in line with this reasoning is Norris’ (2004: 138-139) argument that
parties in the middle of the left-right continuum cannot be distinguished sharply which causes
supporters to switch between the different middle alternatives.
High member identification of a certain group leads to what Campbell et al. (1960: 309-310) call
a “cohesive group”. Hence, the transmission of group, i.e. partisan standards, is more likely to be
successful if a group consists of comparably fewer people (Campbell et al. 1960: 313-314). Apart
from well-known relations between socio-demographic characteristics that comprise a group, the
pure size or even perceived size of a group might have a considerable influence on the
cohesiveness of a group. I argue that smaller groups such as smaller parties and parties that arose
after a consolidated party systems had developed, tend to show a stronger partisan attachments
than parties that have existed over a long period and hence are incorporated in the ”political
establishment” (cf. Campbell et al. 1960: 553). Therefore, partisans of catch all people’s parties
should show slightly weaker party identifications. This shall not imply that classical social
cleavages have lost all of their importance; rather, the number of people placed at the polar points
of cleavages has decreased.
Since the matter of party families appears to be complex and perhaps contradictory, two
competing hypotheses were set up:
33

H5a: Partisans of the issue-based parties (e.g. peace and ecologic issues or anti-immigration)
provide a more favourable basis for strong attachments compared to old cleavage-based parties.
H5b: Old cleavages still trigger strong attachments.
2.8.3 Level 2 Hypotheses
Political parties in newly democratised countries such as the post-Soviet countries in Eastern
Europe emerged in the late 1980s in the surroundings of the collapse of the Soviet Union.
Although political parties in most countries had existed before 1989, those can by no means be
compared to political parties in established democratic systems, since they merely served the
purpose of simulating political plurality without actually being a factual political alternative. The
political systems in the socialist countries in Eastern and Central Europe were dictatorships where
one party and/or one leader ruled the country in autarchy. In fact, Kroh and Selb (2009: 112)
found a 10 percentage point gap between West and East Germans and Norris (2004: 133)
confirmed the relation between democratic consolidation and share of population holding a party
identification. Countries like Spain, Greece and Portugal underwent their transition periods in the
1970s and are therefore expected to have both a slightly higher aggregated strength of party
identification and a slightly larger share of identifiers among the inhabitants than East European
countries. Nevertheless, there should be a gap compared to the “old” democracies in Western and
Northern Europe.
Firstly, since political parties were not able and not allowed to fulfil the functions they serve in
democratic nations, attachments to these parties that might have existed do not fit the concept of
party identification and can hardly be assumed as stable due to the lack of self-determination in
terms of partisan choice. Similar to West Germany after the Nazi dictatorship, one might expect
weaker partisan ties in Eastern and Southern Europe due to the lack of experience with political
parties and their organisation. Party identification simply needs time to develop (Converse 1976:
13; Enyedi and Todosijević 2009: 144), since it is a function of evaluations and experiences with
political parties and elections in the context of free party competition (cf. Converse 1976). In
addition, political parties in Eastern European countries have changed labels more frequently than
34

in Western Europe which makes attachments more difficult to develop. Moreover, Eastern
European political systems are still and more than medium long democratic systems characterised
by weak civic society, alienation from the political system, fluid party images, personalistic
parties, underdeveloped mass-branch party organisations what again makes parties less popular
(Enyedi and Todosijević 2009: 145; Norris 2004: 134). As immediate consequence, if citizens of
those countries mentioned above state a PID, the strength of the attachment is comparably lower
compared to established democracies.
Secondly, parties did in general not emerge from social classes or religions in most Eastern
European countries. While Western European societies are characterised by a set of up to 4
political cleavages (center – periphery, church – state, land – industry, owner – worker; cf.
Rokkan and Lipset 1967), these traditional cleavage structures are far less important in Eastern
Europe than in the countries analysed by Rokkan and his colleagues, though still valuable. This is
underpinned by Lindström (2001: 216) who argues that the agrarian cleavage has become more
salient because of the redistribution of land after 1989. A similar mechanism is visible in
countries with medium-long experience with democracy such as Portugal (Thomassen and
Rosema 2009: 50).
H6: Maturity of democratic system has a positive effect on the strength of party identification. In
other words: The strength of PID is a function of the maturity of a (democratic) political system.
The second hypothesis deals with party system fragmentation. This is a proxy for how the
political process is designed. One expects that fragmented party system will show a larger extent
of political debate and harsh conflict which again might lead to a lower level of support for
political parties as the central actors in the political arena in general. However, the effective
number of parties in the electorate (see chapter 3) cannot provide any information on how
decisions in parliament are taken, but for the purpose of this analysis, the general trend that more
collective actors in the arena lead to cacophony in the political process should be considered.
Campbell et al. (1960: 552) point out that one of most important aspects of a political system is
“the number of parties having a realistic chance to control government”. In the United States,
“large representations of both parties at virtually all social and occupational levels” exist
35

(Campbell et al. 1960: 150) make it easier to find oneself among co-partisans in almost any new
situation into which one moves. This is not the case in Europe and dissenter position is more
likely to occur in European countries, since more than two, often smaller parties compete for
voters and partisans, which raises the probability of entering into a social or geographic milieu,
where one’s political view is seen as “exotic” (cf. Campbell et al. 1960: 150).
Related to that argument, the development of party identification might be easier in systems with
few parties because they simplify voters’ cognitive task of choosing an affiliation (Grofman et al.
2009: 64; Rose and Mishler 1998: 221). Furthermore, if the same set of parties competes over
long time, it should be easier for citizens to develop attachments that can be based on implicit or
explicit comparisons between the parties (Grofman et al. 2009: 64). Consistent with this finding,
Rose and Mishler (1998: 221) note that Poland has the lowest number of identifiers due to the
very high fragmentation of the party system.
Moreover, there is a second reason for why the number of parties plays a role in terms of the
party attachments. Since the 1980s, new political parties have emerged which have successively
been able to recruit voters from the established parties. On the one hand, identifiers with one of
these new parties could not have been socialised in the same manner as youngsters who grew up
in a family that is attached to one of the established parties. Therefore, one might expect fewer
partisans among the voters of these parties. On the other hand, identifiers of new parties had less
time to accustom themselves to the new parties and show therefore weaker party attachments.
One can therefore assume weaker aggregated party identifications.
The previously described mechanism could, however, be reversed: Declining support for
established parties due to discontent with their political alignment, i.e. disregard of new politics
issues, might lead to more and stronger party identification for the new parties. Since the
declining support for established parties might outweigh the gain due to new political parties, the
strength of party identification is expected to be lower in highly fragmented party systems.
On the one hand, if few parties bear responsibility for political outcomes the behaviour of each
party is more clearly visible what makes evaluations of parties and programs easier in terms of
the running tally model. At the same time, space for deprivation might be larger if parties do not
stick to their promises (Enyedi and Todosijević 2009: 144). On the other hand, a large tableau of
36
political parties offers more alternatives to choose from and finding a party that overlaps with
one’s own attitudes might be more likely than in systems where the party space is occupied by
few catch-all parties. Enyedi and Todosijević (2009: 159) were able to confirm the diminishing
effect of a large number of parties on party identification.
Schmitt and Holmberg (1995: 110-111) found that the number of parties represented in the
parliament, i.e. on legislative level, has indeed a negative effect on the share of identifiers8.
Nevertheless, five of their 14 countries under analysis did not fit into this pattern. Despite the
great value of their findings, two methodological adjustments should be taken in this analysis:
Firstly, the strength of party identification cannot be treated as ratio-scaled variable, thus
forbidding OLS regression. Secondly, the effective number of parties is a more sensitive indicator
for political fragmentation because it takes into account how many votes a party was able to
collect. The formula and the characteristics of the measure are laid out in chapter 3.
H7: Fragmented party systems curb the development of (strong) party attachments.
As mentioned earlier, there might be a difference in party identifications on the basis of different
electoral arrangements in terms of parliamentary elections. In the United Kingdom, where
majority voting has taken place for decades, people might tend to hold weaker party
identifications, for they elect persons rather than parties (cf. Grofman et al. 2009: 64). In other
countries, such as Germany or Austria, people vote for party lists9, thus providing the substantial
basis for a manifestation as a party identification. Albeit differences between the election codes in
the US and Europe, some of the arguments of Campbell et al. (1960: 269-270) can be transferred
to the European context: “We would suppose that election laws relevant to partisanship would
have their greatest significance for the development of loyalties represented in our measure of
party identification. (…) Voters governed by rules most likely to promote partisanship are most
likely to be strong party identifiers and least likely to classify themselves as Independents.
Conversely, the voters in states that provide minimal encouragement of partisanship are
significantly more often self-classified Independents and less often strongly identified with a
8 The hypothesis was confirmed for Belgium, Germany, Greece, Netherlands, Norway, Portugal, Ireland, Italy and Luxemburg.9 The share of seats depends on the number of votes for party lists, although a majority voting component exists.
37
party”. Since primaries and caucuses are not part of the European nomination processes, the
relation shall be seen between electoral arrangements such as highly disproportional election
codes such as majority voting and election codes such as proportional electoral systems.
A second reason for curbed existence of party identification in highly disproportional party
systems is the degree of deprivation that might be connected to imbalanced systems.
Disproportional systems favour larger parties at the expense of smaller parties that might hardly
cross the threshold necessary for winning seats in parliament. If this is repeatedly the case, voters
might turn their back either on this party or on the whole party system.
However, the relation between disproportionality and partisanship remains ambiguous (figure 2-
7). It can be objected that institutions that foster clear government responsibility promotes party
identification (Enyedi and Todosijević 2009: 142).
Schmitt (2009) proposes that consensus-oriented societies that go hand-in-hand with proportional
representation show weaker and fewer party attachments than majoritarian systems. Conversely,
Norris (2004: 130) argues that majoritarian systems provide strong incentives for parties to
38
Figure 2-7. A selected institutional form involving the vote.
Source: Campbell, Converse, Miller, and Stokes (1960: 274).

develop bridging appeals to achieve more support in order to negotiate electoral thresholds,
whereas proportional rules stimulate the adoption of bonding appeals on core issues due to lower
representational thresholds. She finds that disproportional rules in that respect promote fewer
partisans than less disproportional rules. However, partisans in disproportional systems tended to
be more strongly attached than their counterparts (Norris 2004: 136-137).
H8: Disproportional election codes inhibit party identifications.
Grofman et al. (2009: 64) assume that the degree of ideological difference between parties in a
society may influence party identification. In their view, ideologically distinct parties enhance
party identification. However, they do not provide empirical underpinning for their assumption.
Schmitt and Holmberg (1995) show that the strength of party identification is related to
weakening party polarisation, declining ideological conflicts, diminished issue differences and
increase in number of parties. Enyedi and Todosijević (2009: 144) propose that “ideological
polarisation of the party system should have the same effect [i.e. promoting partisanship], since
parties that offer distinct ideological alternatives are more likely to foster emotional attachments”.
However, another interpretation that is more related to the attitudinal model of party
identification is the fact that parties in a very polarised society differ strongly according to their
policy goals that should be implemented once elected. Therefore, it is much more at stake if the
rival party comes into power which might foster more rationally-based party identifications.
At a very early point in time, Campbell and Valen (1966) analysed differences in party
identification between the United States and Norway. They claimed that parties in the United
states are catch-all parties, whereas political parties in Norway (and possibly in whole Europe)
are linked to distinct societal groups (Campbell and Valen 1966: 247). Following that reasoning,
weakening ties to societal groups as well as shrinking social groups should decrease polarisation
that is based on different group interests in terms of Lipset and Rokkan’s cleavage theory. If so,
political parties are forced to broaden their basis of possible supporters, thus watering down their
sharply cleavage-based programme in order to attract voters that are no longer or have never been
member of any of the cleavage poles. In that process of depolarisation, party identifications are
likely to diminish since the specific content and guidance one party offers, is also decreasing.
39

As Schmitt (2009: 76-77) points out, party identification may be stronger in countries where
conflict flourishes. This happens due to clarity in terms of political alternatives; in other words,
there is much more at stake when the party one opposes comes into power, since the
programmatic distance between the preferred and opposed party is very large. He has repeatedly
found moderate positive relationships between polarisation and the number of citizens holding a
party identification (Schmitt 2009; Schmitt and Holmberg 1995). He primarily links inter-party
conflict to the structure of political competition and proposes that political conflict is suppressed
by consensus style, whereas conflict may unfold in adversary style systems with majority vote
(also Norris 2004: 69).
It has been proven earlier that partisanship increases in periods of higher degree of polarisation
(for example, Germany in the 1970s: Norpoth 1984). In their study of six West European
countries, Berglund et al. (2005: 117) found that perceived large distances between parties is
positively correlated with stronger attachments. This is consistent with findings of Enyedi and
Todosijević (2009: 151-154) who identified that ideologically radical, leftist, polarised societies
typically show citizens with stronger attachments10.
Also Campbell and his colleagues offered an explanation for changing party attachments
although they emphasised changes at the aggregated level due to polarisation effects. Polarisation
is seen as stimulus that affects not only single individuals but whole societal groups and it can be
triggered by national crises or simply through progress through the life-cycle. However, “the
resulting shifts in partisanship may change the make-up of each party’s support without altering
the relative proportions supporting each party” (Campbell et al. 1960: 151). Newer research
showed that gradual depolarisation at the macro-level leads to decline in the share of identifiers
among all citizens. Berglund et al. (2005: 118-119) found that overall partisanship drops, when
the ideological distance between polar parties decreases. However, polarisation is only expected
to foster partisanship if the polarisation of the party system is mirrored within the society. The
effect of polarisation has been found reversed if citizens perceive parties as more distant from
themselves on the left-right scale (Schmitt and Holmberg 1995: 114-115).
10 However, OLS regression of strength of party identification and pooling countries without recognizing country-specific features might have caused problems in their study.
40
Since political parties are the most important actors in all countries under study, it is natural to
look at party system left-right polarisation. In addition, societal polarisation shall be looked at. In
line with the argumentation above, left-right polarisation of the society might as well have an
impact on the individual strength of party identifications.
H9: A high degree of left-right polarisation facilitates the development of party identifications.
2.9 Control VariablesGender is an important variable though much of the gender gap in party identification can be
attributed to differences in interest in politics. Furthermore, “class is clearly one of the underlying
dimensions of party affiliation in the US” (Campbell et al. 1960: 159, 333-380). This should be
tested as well, although Oskarson (2005) finds that the impact of class has declined in the six
observed countries (Norway, Sweden, Denmark, Netherlands, Germany, United Kingdom), while
religious voting has risen in the Netherlands and declined in the other countries. Hence, the
Erikson and Goldthorpe (1992) class scheme shall enter as control variable. Area of residence
shall also be included to control for possible urban-rural cleavage structures.
Since the data set contains data from a 6-year time range, it might be useful to control for
elections years and other “turbulent years” (cf. Lewis-Beck et al. 2008: 142). Because “a heavy
dose of bad news for a major party can easily discourage young adults with a budding attachment
to that party from growing closer to it” (Lewis-Beck et al. 2008: 147). Separate analyses by
country and year did, however, not reveal significant differences.
The intermediate level hypothesis on the impact of party families is a special case since the
analysis will be carried out in a separate part, in chapter 5. Due to the specific nature of party
family, it seems worthy controlling for the overall share of partisans of a country. This macro-
level variable may not be confused with the dependent variable since the share does not
distinguish between different degrees of strength. Moreover, it can be argued that a party
identification-friendly environment fosters individual party identifications, just like the overall
class achievements might influence the individual pupils’ achievement, although the individual
itself is used to generate the macro-level characteristic.
41

3 Method
3.1 Presentation of the Data Sets
3.1.1 European Social Survey (ESS)
The European Social Survey (ESS 2011) cumulative data file contains all necessary information
about the level 1 units, i.e. respondents, and the variables characterising them. It was established
in 2002 and cumulative data are available for the first four rounds. Carried out biennially, the
ESS is hallmarked by strict methodological rigor that is among others indicated by questionnaire
translation that shall ensure functional equivalence (Kittilson 2007: 882). Although different
42
Figure 3-1. Countries under analysis.
Source: Own illustration.

sampling methods are employed due to differing available information about the universe,
random probability sampling is the common basis for all data collection. In addition and as
opposed to other multinational research programs, the ESS is governed by a central authority and
can resort to central public funding.
In terms of equivalence, four different levels exist that are cumulative in nature (Braun 2003:
140-150). Firstly, concepts must share the same attributes in order to be comparable (construct
equivalence). Secondly, functional equivalence is guaranteed if the instrument administered in
different groups actually measures the same construct. Thirdly, measurement unit equivalence is
achieved if measurement scales have the same units of measurement. Finally, full score
equivalence makes direct comparisons of scores possible. Obviously, the most desirable form of
equivalence is the latter one. The goal of ESS is “to achieve equivalent methods and measures,
not identical ones” (Jowell, Kaase, Fitzgerald, and Gillian 2007: 9). Despite the very accurate and
transparent method of data collection and procession, some degree of uncertainty can never be
ruled out. However, since the ESS provides the most ambitious attempt so far, I confide in the
quality of data at hand in terms of both reliability and validity.
The cumulative data file will be used which contains 25 countries11 that have participated in at
least two rounds (figure 3-1). Though collected at different points in time, the data will be pooled.
Nevertheless, it has been controlled for the point in time of data collection. The variables and
respective items remained unchanged during the whole data collection period, thus allowing for
an unrestricted analysis that does not suffer from missing values due to item inconsistency.
Two countries raise special attention: Firstly, Germany is a particular country because of the
reunification in 1990. Treating the country as one single unit would distort the results and it
seems reasonable to assume that citizens in East and West Germany differ significantly from
each other due to different socialisation. It can be argued that East Germany is more infused with
party identifications than other formerly communistic states in Eastern Europe, since East
Germans were indirectly exposed to political parties in West Germany via television coverage
(Kaase and Klingemann 1994: 152). However, Kaase and Klingemann (1994: 139) found that
“whatever party identification in East Germany exists”, it was not quite established yet in 1994.
11 Turkey, Russia, Ukraine and Israel were excluded. Northern Ireland was also excluded due to the special structure of the party system.
43

Information on where the interview took place, are provided in the variable intewde, thus
allowing for a clear cut division between East and West.
Secondly, Belgium is a culturally and politically strongly divided country. The northern part
Flanders is Dutch-speaking, whereas the southern part Wallonia is francophone. Moreover, the
party system space in the two parts is nearly exclusively occupied by the Dutch-speaking and
French-speaking parties respectively. This allows for a sharp division of Belgium in terms of
level 2 variables, though the capital region is a case of special attention: In order to classify
respondents residing in the Brussels area, the region identifier variable (regionbe) was combined
with the variable that captures the language predominantly spoken in the household (lnghoma,
lnghomb).
However, these two countries remain the exceptional cases in terms of treating regions as level 2
units. The aim of this thesis is to uncover country-specific patterns and differences and not
differences between regions within a country12. Besides, the conceptualisation of party
identification as product of previous experience with parties, leaders, issues and elections entails
the influence of political contexts such as election codes, patterns of party competition and
democratic experience. Therefore, Green and Schickler’s (2009: 196-197) critique against the
analysis of countries that separates individuals “by arbitrary boundaries and jurisdiction” is not
justified.
A problem that arises due to the very large N is related to statistical methods. It is very likely that
many of the effects will be statistically significant. However, given the high number of
observations, one must be careful in drawing conclusions. Therefore, significance levels should
be rather restrictive in order to avoid type I errors. Moreover, in order to enable generalisations
from the samples to the respective universes, it is indispensable to include the design weights
(Ganninger 2007). Table 3-1 shows the number of respondents in all countries by year of data
collection (ESS round). To be addressed later, an equal number of observations per country shall
enter the model in chapter 4 because all countries shall have equal weight in the regression
analysis.
12 The latter approach, though attractive, cannot be implemented with the data available. The number of cases would not always be sufficient. Furthermore, data characterizing regions as level 2 units might be difficult to collect (especially polarisation and fragmentation).
44

Table 3-1. No. of respondents in the ESS cumulative data set.
cnum Country ESS 1 ESS 2 ESS 3 ESS 4 Total1 Austria 2,257 2,256 2,405 NA 6,9182 Belgium (Flanders) 1,264 1,064 1,146 1,088 4,5623 Belgium (Wallonia) 635 714 652 672 2,6734 Bulgaria NA NA 1,400 2,230 3,6305 Switzerland 2,040 2,141 1,804 1,819 7,8046 Cyprus NA NA 995 1,215 2,2107 Czech Republic 1,360 3,026 NA 2,018 6,4048 Germany (East) 1,098 1,019 1,040 967 4,1249 Germany (West) 1,821 1,851 1,876 1,784 7,332
10 Denmark 1,506 1,487 1,505 1,610 6,10811 Estonia NA 1,989 1,517 1,661 5,16712 Spain 1,729 1,663 1,876 2,576 7,84413 Finland 2,000 2,022 1,896 2,195 8,11314 France 1,503 1,806 1,986 2,073 7,36815 Great Britain 1,988 1,831 2,324 2,273 8,41616 Greece 2,566 2,406 NA 2,072 7,04417 Hungary 1,685 1,498 1,518 1,544 6,24518 Ireland 2,046 2,286 1,800 1,764 7,89619 Italy 1,207 1,529 NA NA 2,73620 Luxemburg 1,552 1,635 NA NA 3,18721 Netherlands 2,364 1,881 1,889 1,778 7,91222 Norway 2,036 1,760 1,750 1,549 7,09523 Poland 2,110 1,716 1,721 1,619 7,16624 Portugal 1,511 2,052 2,222 2,367 8,15225 Sweden 1,999 1,948 1,927 1,830 7,70426 Slovenia 1,519 1,442 1,476 1,286 5,72327 Slovakia NA 1,512 1,766 1,810 5,088
Total 39,796 44,534 38,491 41,800 164,621 NA: The country did not participate in the respective round.
The following two paragraphs shortly present the two data sets that were used to obtain numeric
values for the level 2 variables.
45
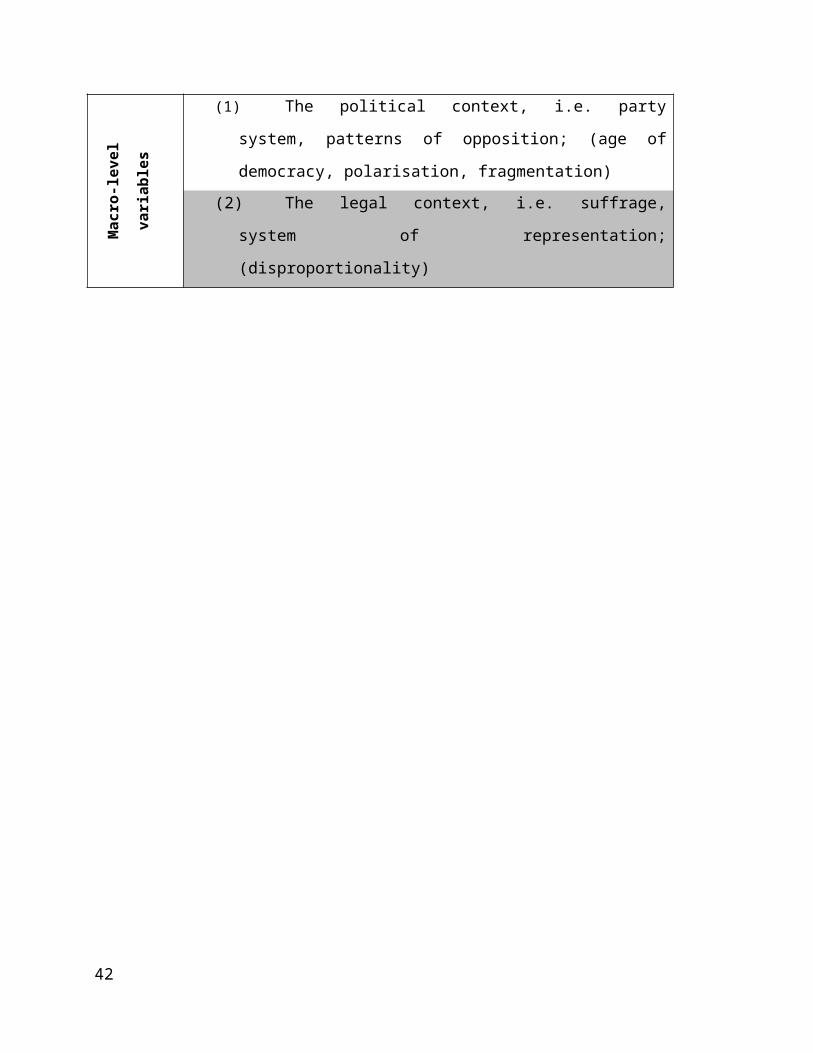
3.1.2 Comparative Political Data Set III (CPDS III)
The Comparative Political Data Set III 1990-2009 (Armingeon, Careja, Weisstanner, Engler,
Potolidis, Gerber, and Leimgruber 2011) assembles annual data for 35 OECD and/or EU member
countries. It has been extracted from the Comparative Political Data Sets I and II which were also
created at the University of Berne, Institute of Political Science and funded by the Swiss National
Science Foundation. In this data set, disproportionality and the effective number of electoral
parties are available and ready for use. However, I calculated the values for East and West
Germany as well as Belgium(Flanders) and Belgium(Wallonia) by myself by using official
government election statistics (see Appendix B).
3.1.3 Manifesto Data Set
Data on political party programs is provided by the Comparative Manifesto Project ([CMP]
Volkens, Lacewell, Lehmann, Regel, Schultze, and Werner 2011). In a nutshell, party and
electoral programs are coded by disaggregating statements into quasi-sentences that again are
simply counted and sorted into different, a priori defined sets of policy categories (Werner,
Lacewell, and Volkens 2010). Hence, it measures the relative importance of a political dimension
or concept compared to other concepts. The variable relevant to the research question of this
article is rile, i.e. the left-right value of the respective political party. I computed the polarisation
values for the two parts of Germany and Belgium respectively by taking different vote shares into
account (see Appendix D).
3.2 Operationalisation
3.2.1 Dependent Variable: Strength of Party Identification
The dependent variable is based on two questions in the data set: Firstly, the simple question
whether a respondent states a party identification or not, and secondly, the strength (or closeness)
46

of party identification. The first part of the new variable party identification is captured by the
following question, leaving the response categories ‘yes’, ‘no’ and ‘don’t know’, whereby those
who answer ‘no’ will be placed at the lower end of the new variable:
Is there a particular political party you feel closer to than all the other parties? (Question B20a)
It can of course be argued that this questions is somewhat vague in terms of party identification,
because it lacks at least one of the components that Miller and Shanks (1996: 125) describe as
essential for the measurement of party identification: an extended time horizon. Virtually, there is
no explicit indication for the respondent to be prompted for a long-term relation to a political
party. Thus, this instrument comes closer to rational choice theory and in connecting the running
tally model (Thomassen and Rosema 2009: 46). When it comes to the second component, the
sense of self-identity, the instrument takes a middle position on the continuum that is formed by
‘considering oneself as partisan’ and simply ‘approving a political party’. In other words, feeling
closer to a political party is a somewhat weaker attachment than considering oneself as partisan
of a distinct political party, but feeling closer to a political party is again stronger than simply
‘liking’ a political party. In fact, this questions does not exclude the existence of multiple party
identifications, whereas the American instrument and the instruments used in national election
studies explicitly preclude such constructs as multiple party identifications (for a deeper
presentation see Schmitt 2002).
Despite these methodological objections, this instrument appears to be the best suited for cross-
national comparisons, though it resembles the lowest common denominator (Johnston 2006: 384;
for an overview over instruments used see Bartle and Bellucci (2009: 17-21)). Nevertheless, this
is an advantage rather than a problem. This analysis compares 2713 countries that differ in terms
of many characteristics. It may therefore be very wise to apply a measurement that is easily
understood and interpreted. Moreover, Burden and Klofstad (2005) found evidence that asking
whether a person feels partisan leads to more reliable results than asking whether a respondent
thinks partisan. Given these supporting evidence, the ESS questions appear to be a suitable
measure for the cross-national analysis of partisanship.
13 These are 23 countries plus 2 German regions (East and West) and 2 Belgian regions (Flanders and Wallonia) which adds up to 27 level 2 units, conveniently referred to as 27 countries.
47
The second part of the dependent variable is added by looking at the strength component of party
identification. This is operationalised by the follow-up question directed towards those who
stated certain closeness to a political party. The question wording is:
How close do you feel to this party? Do you feel that you are very close, quite close, not
close, or, not at all close? (Question B20c)
It is both empirically and theoretically hard to define what the response category ‘not at all close’
means. Merely 2,000 out of 76,000 identifiers chose to call themselves ‘not at all close’ to the
party they mentioned before. Some countries show numbers in this category that are one or only
double digit when selecting 2,000 respondents per country. It is both empirically and theoretically
hard to define what the difference between the response categories ‘not at all close’ and ‘not
close’ is. There might even appear some problems with equivalence if these response categories
are understood differently among citizens in different countries or even in the same country. In
addition, a Brant test for all countries separately revealed that the parallel regression assumption
is violated when applying the 5-point scale. For these reasons, I shall use the 4-point scale, in
which the response category “not at all close” is merged with the category of “no identification”.
Table 3-2. Frequencies of response categories of PID variable by country.
No identification Not close
Quite close Very close
Total
Western EuropeAustria 3,153 475 1,790 437 5,854Belgium (Flanders) 2,371 284 1,524 238 4,417Belgium (Wallonia) 1,166 326 897 138 2,527Switzerland 3,567 870 2,764 382 7,583Germany (West) 3,637 1,063 2,023 242 6,965France 3,505 979 2,204 332 7,020Luxemburg 1,734 491 530 115 2,870Netherlands 3,309 478 3,492 457 7,736Nordic CountriesDenmark 1,801 1,123 2,470 433 5,827Finland 3,607 1,042 2,774 311 7,734Norway 2,662 913 2,996 377 6,948Sweden 2,615 1,012 3,172 615 7,414Eastern EuropeBulgaria 1,609 121 1,047 566 3,343
48
Czech Republic 3,713 552 1,353 271 5,889Germany (East) 2,515 420 883 133 3,951Estonia 3,055 591 1,129 113 4,888Hungary 3,014 195 1,937 633 5,779Poland 5,268 566 1,008 103 6,945Slovenia 3,466 541 1,105 203 5,315Slovakia 2,566 21 1,684 429 4,700Southern EuropeCyprus 671 118 656 624 2,069Spain 3,890 1,098 1,891 317 7,196Greece 2,932 326 2,195 797 6,250Italy 1,346 69 767 215 2,397Portugal 3,913 1,416 1,483 283 7,095Atlantic EuropeGreat Britain 4,412 1,158 2,319 346 8,235Ireland 4,450 901 1,518 315 7,184
Total 79,946 17,149 47,611 9,425 154,131
The dependent variable now consists of 4 ordered response categories that include both
respondents without party identification and respondents with party identification, i.e. those that
were able to state the strength of their attachment. Table 3-2 provides a cross-tabulation of
country and the new PID (party identification) variable. A first glimpse indicates that there is a
division between Eastern and Western Europe according to whether citizens state a party
identification or not: The number of citizens identifying with a political party is considerably
lower in Eastern Europe than in Western Europe.
3.2.2 Independent Variables
It is important to note that this analysis deals with two types of explanatory variables:
Characteristics of the level 2 units (countries)14 that shall explain between-unit variation, and
characteristics of the level 1 units (respondents) that can theoretically explain both within-unit
and between-unit variation. The variable codings are displayed in Appendix F.
14 The level 2 unit identifier is the variable cnum (country number).
49
Age and Social Capital
Some of the level 1 variables can be obtained by simple transformations of the original ESS data
set. In particular, age is stored as variable ready to use in the data set. As it comes to integration
into civic society or social capital, trade union membership is taken from the data set. The
categories of being currently and being previously a member of a trade union were merged into
one category, contrasted with all respondents that are not and have never been member of a trade
union.
The second part of social capital deals with being member of any other non-political organisation
which is stores as variable in the data set. These organisations could for instance be
environmental, sport or charity organisations.
In addition, being member of a religious organisation and attending religious services is seen as
integration into civic society. Here, Catholic, Protestant, Other Christian and Other Non-Christian
respondents are contrasted with atheists.
Cognitive Mobilisation
As indicated earlier, cognitive mobilisation is seen as multi-dimensional concept with at least
three dimensions to be defined below: Education, political involvement and media consumption.
Education shall be operationalised as years of completed fulltime education, because collapsing
education into ordinal level categories proved to violate the parallel regression assumption for
various countries.
In order to reduce the number of indicators, a factor analysis was carried out. Before I present the
results, it had become obvious that interest in politics has a uniqueness which exceeds 97 percent.
It was therefore dropped from the factor analysis and shall be a single individual indicator in the
regression analysis instead.
The variables under consideration are:
The amount of time spent with the TV using it as source of political information (sttvpol).
50

The amount of time spent with the radio using it as source of political information
(strdpol).
The amount of time spent with newspapers using it as source of political information
(stnwsppol).
How often one makes up one’s mind about political issues (stpolcmpl).
How often one sees politics as complicated matter (stpoldcs).
The variables were rectified and standardised to ensure they have a zero mean and a standard
deviation of 1. Besides, increasing values in either of the variables now corresponds to an
increased degree of cognitive mobilisation: e.g. a higher value in TV usage for political
information (sttvpol) now implies that the person is more cognitively mobilised. Moreover, only
standardisation leads factor analysis to produce reliable and meaningful results. The factor
analysis was based on the full data set; the Eigenvalue criterion produces two factors that should
be retained. After rotating the factors by applying the orthogonal varimax rotation, following
factors can be distinguished:
Table 3-3. Factor analysis of indicators of cognitive mobilisation.
Variable Factor 1 Factor 2
Uniqueness
sttvpol (TV) 0.0130 0.7260 0.4728strdpol (Radio) 0.0124 0.7020 0.5071stnwsppol (Newspaper) 0.2852 0.6488 0.4977stpolcmpl (Politics complicated) 0.8460 0.0502 0.2817stpoldcs (Making up one’s mind about politics)
0.8385 0.0770 0.2909
Making up one’s mind about political issues and seeing politics as not very complicated seem to
go hand in hand and both variables are highly correlated with the first factor while almost
uncorrelated with the second factor. Furthermore, the media usage indicators are highly
correlated with the second factor and hardly correlated with the first factor (cf. table 3-3). The
uniqueness is slightly higher than for the items that form the first factor. Roughly 60 percent of
the total variation is captured by the factor solution. Having confirmed the two dimensions, an
index can be constructed. Instead of simply adding the variable scores, the score for each
51
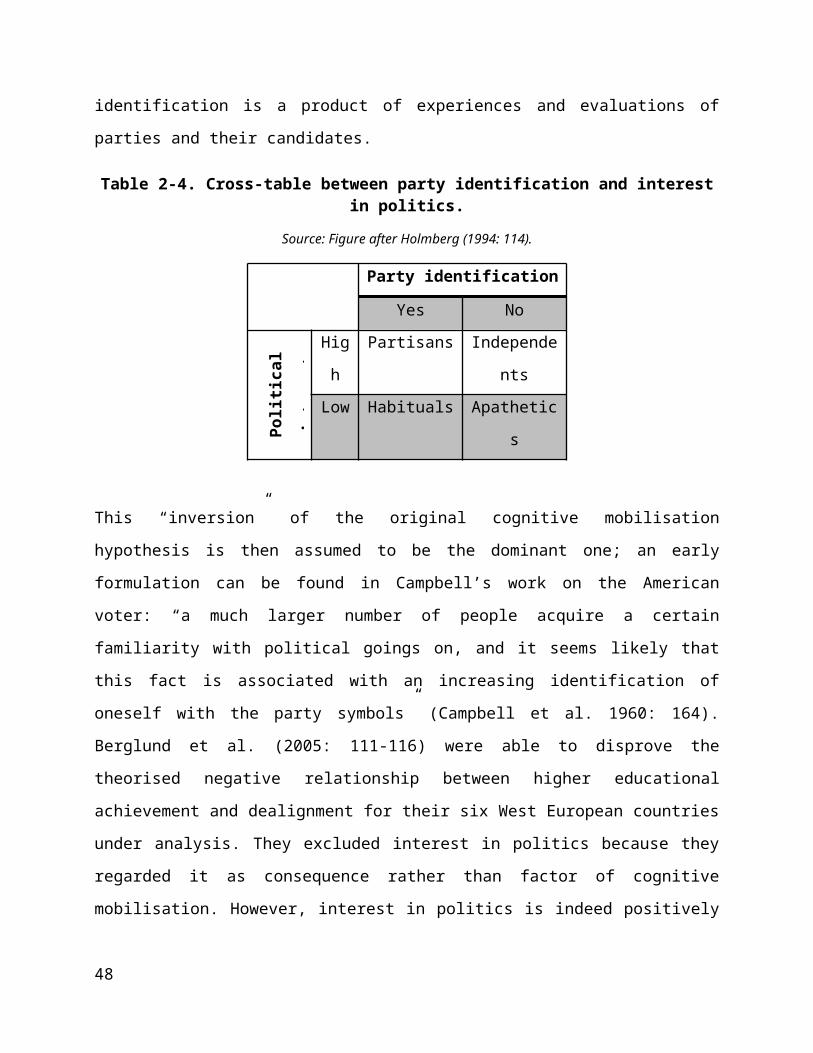
individual is computed by using Stata’s predict command which gives more accurate results in
terms of the weighting of the indicators. The overall scores are then computed as the linear
regression result of the original score on the particular variable and the coefficient obtained
through factor analysis:
Table 3-4. Factor scores of involvement (factor 1) and media usage (factor 2).
Variable Factor 1: Involvement Factor 2: Media usagesttvpol (TV) -0.09928 0.52219strdpol (Radio) -0.09614 0.50494stnwsppol (Newspaper) 0.10203 0.42587stpolcmpl (Politics complicated) 0.58242 -0.09004stpoldcs (Making up one’s mind about politics)
0.57320 -0.06956
The newly obtained factors can be seen as media usage (factor 2) and involvement in politics
(factor 1). In other words, a respondent’s score on the new variable involvement is constructed as
the linear combination of the products between each variable score and the respective correlation
with the factor displayed in table 3-4. The same applies then to the second factor which
represents media usage.
Trust
Similar to cognitive mobilisation, trust can be regarded as multi-dimensional. Therefore, a second
factor analysis was conducted according to the same procedure described above. In total, 6 items
were regarded as important for summarizing trust (whereby trust in political parties was omitted
due to a high number of missings and obvious variance inflation problems):
Most people can be trusted or you can't be too careful (stppltrst).
Most people try to take advantage of you, or try to be fair (stpplfair).
Most of the time people helpful or mostly looking out for themselves (stpplhlp).
Trust in the country’s parliament (sttrstprl).
Trust in the country’s legal system (sttrstlgl).
Trust in politicians (sttrstplt).
52
Again, two factors are retained because they have an Eigenvalue that exceeds 1. The rotated
factor solution is shown below:
Table 3-5. Factor analysis of indicators of trust.
Variable Factor 1
Factor 2 Uniqueness
stppltrst (trust in people) 0.2417 0.7993 0.3028stpplfair (people are fair) 0.1725 0.8332 0.2760stpplhlp (people helpful) 0.1698 0.7884 0.3496sttrstprl (trust in parliament) 0.8869 0.1653 0.1860sttrstlgl (trust in the legal system)
0.8093 0.1891 0.3092
sttrstplt (trust in politicians) 0.8541 0.1986 0.2310
The mean uniqueness is about 30 percent (cf. table 3-5), slightly lower for the variables that form
the first factor. As obvious, trust in the parliament, in politicians and the legal system show high
loadings on the first factor and low on the second, whereas the three first indicators show high
loading on the second factor and low ones on the first. The two factors amount for roughly 72
percent of the total variation.
Table 3-6. Factor scores of institutional trust (factor 1) and interpersonal trust (factor 2).
Variable Factor 1: Institutional trust Factor 2: Interpersonal truststppltrst (trust in people) -0.06651 0.41894stpplfair (people are fair) -0.11205 0.45624stpplhlp (people helpful) -0.10246 0.43006sttrstprl (trust in parliament) 0.43655 -0.11914sttrstlgl (trust in the legal system)
0.38894 -0.08580
sttrstplt (trust in politicians) 0.41074 -0.09117
The index is then constructed in the same way as mentioned above. Then, trust in the legal
system has slightly less weight then trust in the parliament since the coefficient is lower (0.39
compared to 0.44, cf. table 3-6). In conclusion, the first factor clearly subsumes trust in
institutions, while the second factor represents interpersonal trust. Obviously, politicians are no
institutions like the parliament or the legal system. However, politicians usually act as entities on
53

behalf of an institution such as the parliament or the government. They can therefore be grouped
into institutional rather than interpersonal trust. The new variables were constructed in the same
way as the involvement and media usage variables under the cognitive mobilisation part.
Party Families
Classifying political parties across countries into party families is a complex matter. As Mair and
Mudde (1998) suggest, party family classification should be based both on common origins of
parties and on common party ideologies. I follow the classification scheme used by Klingemann
(2005: 26) who applied this classification to six West European countries; however, I performed
my own classification based on programme and ideological considerations. Information on
Eastern Europe were partly provided by Kitschelt, Mansfeldova, Markowski, and Toka (1999).
The resulting party family groups are displayed in table 3-7. At a first glimpse, the categories
“radical right” and “left-socialist” might be the ‘fuzziest’ ones.
Table 3-7. Party families.
Label Meaning Issue vs. CleavageCOM Communist Cleavage
LS Left-Socialist IssueSO Social democratic CleavageEC Ecological IssueLI Liberal Cleavage
CO Conservative CleavageREL Religious Cleavage
R Radical right IssueREG Regional/Ethnical IssueAGR Agrarian/Centre Cleavage
SI Single issue Issue
The classification is based on certain features of party programs and ideologies. Communist
parties advocate a shift of the political systems towards a communist state. Left-socialist parties
are reformed left parties that stand for moderate socialism and politics including public spending
and welfare distribution by the state. They typically evolved as splinters of socialist or communist
parties (Klingemann 2005: 26). Social democratic parties denote political parties that are based
54
on the original labour cleavage and therefore based on the labour movement. Usually, social
democratic parties are the catch-all party on the left side of the political spectrum. Ecological
parties are parties of newer origin, usually emerged in the late 20 th century in reaction to
environmental and climate issue. Therefore, they are rather issue- than cleavage-based. Liberal
parties are the modern form of traditional middle class bourgeois parties with strong emphasis on
individual and economic liberalism and freedom. Conservative parties espouse traditional
institutions and aim at maintaining the status quo of the society. This is usually connected to
economic liberalism and limited public spending on redistribution. Religious parties can be seen
as political arm of one of the major religions, basically the Roman Catholic and/or the Protestant
church inside a country. Radical right parties are characterised by nationalism, populist rhetoric,
especially towards immigrants and minorities, and emphasis on specific features of the country’s
culture. Regional and ethnical parties represent either regional entities within a country which
want to gain more autonomy/influence, or ethnical minorities within a country that want to
protect and/or expand their rights. Centre and agrarian parties used to represent peasants and have
become the representation of farmers. These parties pursue centrist policies. Single issue parties
do not offer a broad political programme but occupy a political niche or gap that is not
thoroughly covered by major parties. The complete classification is shown in Appendix C.
In terms of hypotheses 5a and 5b, the classical cleavage-based party families are social
democratic (SOC), communist (COM), liberal (LI), conservative (CO), religious (REL) and
agrarian/centre parties (AGR). Conversely, issue-based parties emerged later than the parties
mentioned above and focus more on certain controversial issues: Ecological (ECO) parties focus
on environmental protection and sustainability; radical right parties (R) emphasise immigration as
important aspect in politics, namely negatively connoted; regional and ethnical parties (REG)
fight for autonomy and more extensive rights for their region and ethnicity respectively; single
issue parties pursue only one aim; however, there is only one party, DESUS in Slovenia, that is
placed in this category. Hence, it is merged with the category ‘other parties’ in the analysis part in
chapter 5. Left socialist parties play a somewhat ambiguous role: On the one hand, they usually
separated from the social democratic or communist party; on the other hand, the reasons for
separation were usually more situational (e.g. EC/EU, extent of social redistribution, issues of
war and peace). It is therefore not easy to place this party family. Nevertheless, since the reasons
55
for separation appeared to be strong enough for a complete break-up with the mother party, I
argue for treating left socialist parties as issue-based rather than cleavage-based.
Maturity of Democracy
Four hypotheses that deal with contextual characteristics were presented in the previous chapter.
The first one denotes the maturity of the democratic system. A three-category ordinal variable has
been fitted that distinguishes “old” or established democratic systems such as the United
Kingdom, Norway or France from “medium” old democracies that experienced transition in the
1970s (Greece, Spain and Portugal). The third category consists of the newly democratised
countries in central and Eastern Europe. In the analysis chapter and in line with table 3-8, this
variable will consist of 2 dummy variables: matdem1 for old democracies and matdem3 for new
democracies, leaving medium old democracies the reference category.
The peculiarity of the history of Eastern European countries leads to an important effect:
According to the lifetime learning model, the level of commitment should increase with age (cf.
hypothesis 6). Since the dictatorial nature of state hampered this development (cf. Green et al.
2002: 165), younger people are expected to be more likely stating a party identification.
Therefore, a cross-level interaction between maturity of democratic system and individual age
should be created and tested.
Table 3-8. Maturity of democratic systems.
MD j Country
Old democracies 1 Austria, Belgium (Flanders), Belgium (Wallonia), Cyprus,
Denmark, Finland, France, Germany (West), Ireland, Italy,
Luxemburg, Netherlands, Norway, Sweden, Switzerland,
United Kingdom
Medium old democracies 2 Greece, Portugal, Spain
Young democracies 3 Bulgaria, Czech Republic, Estonia, Germany (East), Hungary,
Poland, Slovakia, Slovenia
56

Party System Fragmentation
The second hypothesis captures the extent of party fragmentation in the electorate. Fragmentation
can be operationalised as effective number of parties represented in parliament. As mentioned
before, the fragmentation within the electorate is a purer measure of the extent of different
tendencies that exist inside of a society than the respective number in terms of parliamentary
representation, for that is rather a product of electoral codes and arrangements which should be
discussed later. The number of relevant parties N for country j can be calculated by the following
formula, proposed by Laakso and Taagepera (1979):
N j=1
∑i=1
n
v i2
where vi corresponds to the proportion of votes for party i. Relevant data can be found in the
Comparative Political Data Set III, where vote shares for parties were collected from 1990 to
2009. As a general rule, parties that attained more than 2 percent of the votes are included. Tests
have shown that this threshold does not impair the validity of this measure (not shown here). Due
to the specific nature of the data set, the issue of time frame arises. I argue that the fragmentation
should be averaged over the time period when ESS was conducted; the number of elections is
also taken into account when calculating the fragmentation15. This variable will then be called
fragmentation in the analysis.
Electoral Disproportionality
The third hypothesis deals with the degree of distortion produced by the electoral code. Since
primary arrangements or party tests do not exist in the run-up to European elections, I suggest
Gallagher’s index of disproportionality (Gallagher 1991; Lijphart 1999):
15 In addition, fragmentation might not only have an immediate effect on the electorate at a given point in time t, but it can be argued that fragmentation takes the position of a lagged variable. In other words, electoral fragmentation at time t-1 (F t−1) may lead to differences in the level of party identification at time t which is the time when ESS was conducted. Hence, an alternative measure of fragmentation that represents an extended time frame could be tested in the model as well. However, due to limited space, this is omitted.
57

G j=√ 12∑i=1
n
(vi−s i)2
where vi is the vote percentage and si the seat percentage for party i. Data is available in the
Comparative Political Data Set III. The variable is denoted disprop in the analysis.
58
59
Figure 3-2. Mean effective number of electoral parties in the 27 level 2 units.
Source: Comparative Political Dataset III and own calculations.
Figure 3-3. Mean disproportionality in the 27 level 2 units.
Source: Comparative Political Dataset III and own calculations.

In order to ensure consistency, I argue for averaging over the time period which ESS was
conducted, thus data from 2002 to 2009 will be used, taking the number of elections into account
that took place within that period. The mean values of effective number of electoral parties and
disproportionality are shown in figures 3-2 and 3-3 respectively.
Polarisation
The fourth hypothesis touches the polarisation of the political sphere which is dominated by
political parties. In that reasoning, political parties and their standpoints are seen as mirrors of
views and attitudes that exist inside the society. This reflects a more bottom-up approach16 of
political participation which can indeed be questioned. However, in that view, political parties
absorb current persisting lines of attitudes in the electorate and base their party program on these
attitudes in order to ensure favourable election results. In other words, a party that represents
attitudes and values that are not mirrored in society will hardly be a successful one.
Given that the dimension of left-right is still the main conflict line in European countries, the
placement on this axis serves as proxy for the polarisation of party systems as a whole17. Four
operationalisations have been applied in the literature: Firstly, using Manifesto data to extrapolate
the total party system polarisation (Klingemann 1995); secondly, using voters’ or partisans’ self-
placement on the left-right scale (e.g. Berglund et al. 2005); thirdly, calculating polarisation as
difference between the two major (polar or largest block) parties’ polarisation again by looking at
Manifesto data (e.g. Berglund et al. 2005); finally, simply measuring the vote share of anti-
system parties as Lane and Ersson (1999: 140) describe. I shall apply the first two approaches for
two reasons: First of all, both measures include the total polarisation of the party system as a
whole whereas the two latter measures only focus on parts of the party system, e.g. the biggest
block parties, anti-system or polar parties. This might be error-prone since stable a priori criteria
for these terms need to be defined; in addition, the classification of parties into these concepts
16 The respective top-down approach: looking at people’s left-right placement.17 In a nutshell, left materialist orientations emphasise the responsibility of government to facilitate solidarity and economic equality; conversely, right materialist value orientations highlight the supremacy of the market (Knutsen 1995).
60

might be less stable over time. Secondly, the two alternative measures I chose to apply use
different data material, i.e. survey data and manifesto data. Thus, the other two measures become
redundant due to their lack of accuracy mentioned above. It shall be underscored that the two
approaches to be presented below denote party system polarisation, whereas the third and last
approach to be addressed represents left-right polarisation in the society.
Table 3-9. The left-right scale as obtained by Manifesto Data.
Code Policy Dimension — Code Policy Dimensionper104 Military: Positive per103 Anti-Imperialism: Positive+ +per201 Freedom and Human Rights per105 Military: Negative+ +per203 Constitutionalism: Positive per106 Peace: Positive+ +per305 Political Authority per107 Internationalism: Positive+ +per401 Free Enterprise per403 Market Regulation+ +per402 Incentives per404 Economic Planning+ +per407 Protectionism: Negative per406 Protectionism: Positive+ +per414 Economic Orthodoxy per412 Controlled Economy+ +per505 Welfare State Limitation per413 Nationalisation+ +per601 National Way of Life: Positive per504 Welfare State Expansion+ +per603 Traditional Morality: Positive per506 Education Expansion+ +per605 Law and Order per701 Labour Groups: Positive+ +per606 Social Harmony per202 Democracy
Firstly, I will take a look at the manifesto data-based measure. Since the manifesto data set relies
on party programmes, one has to be aware of that fact that party standpoints articulated in party
programmes and party behaviour in the decision-making process do not always correspond;
61
therefore, party programmes do only serve as proxy for party behaviour, although it cannot
account for variations and deviations produced by political compromises and negotiations. The
Manifesto data set contains an index of the left-right dimension (see Appendix D) which I will
apply (CMP 2011: 20-21). In a nutshell, a “left” position is indicated by emphasis on democracy,
planned or mixed economy, cultural libertarianism, welfare state expansion, peace and deténte,
whereas a “right” position includes a strong emphasis on freedom and human rights, market
economy, traditional morality/law and order, welfare state limitation, military strength. The
indicator provided by the Manifesto Data Set is the difference between the sums of the “right”
and “left” party policy categories, whereupon actual percentages are used (table 3-9, for more
details regarding the policy categories, see CMP (2011)). These characteristic policy categories
were obtained by applying factor analysis (Budge 2001: 217). It is obvious that the policy
categories are not always mirrored on either side; for example, there is no “left” counterpart to
“Constitutionalism: Positive”. In other words, a “left” position does not correspond to
“constitutionalism: negative” which means that the two indices consist of partly very different
categories because the Manifesto measure18 is based on issue salience. Unfortunately, manifesto
data are not always provided for the whole period under study (2002-2009, see Appendix D).
This first indicator for party system polarisation based on Manifesto data will be called
polaris_MD.
Secondly, I shall use the voter-based left-right placement for political parties. In a first country-
wise step, the left-right self-placement mean value is calculated based on the electorate; i.e. those
respondents who claim having voted for the political party they name. Afterwards, for all
political parties in a country the mean left-right position of their voters is calculated. In addition,
the vote share for each party is obtained based on the number of respondents that voted for the
respective party.
Both MD-based and survey-based party system polarisation measures have in common that they
rely on the same formula for polarisation once the mean polarisation for the party system and the
values for the parties are obtained. I advocate the use of a measure formulated by Huber (1989)
because his formula does not rely on squaring the differences from the mean as opposed to the
measure by Taylor and Herman (1971: 34). Hence, polarisation is measured more accurately and
18 I modified the left-right variable in order to attenuate the effect of parties that are not represented with a polarisation value. Hence, I rescaled the measure in case the total share of votes did not add up to 100 percent.
62
not influenced by artificially applied mathematical operations such as squaring. Polarisation is
then related to pi and vi as left-right policy position and vote share respectively of party i, p as
mean left-right policy position of the party system as a whole and n as number of parties, thus
capturing the total polarisation of the party systems:
P j=∑i=1
n
[ v i ×|pi−p|]
The presented formula operates with absolute values instead of squares and/or square roots and
yields the values in Figure. This survey-based measure shall be called polaris_survey.
Furthermore, one additional measure shall be applied that is related to a society’s mean left-right
value. It is also based on the survey data at hand: For each country, the mean left-right value is
calculated by taking all respondents into account. Since the mean is a measure of central
tendency, it might be possible that maximally polarised societies (e.g. the two halves of the
population are placed on either pole of the scale) and minimally polarised societies (e.g. all
respondents have the middle value 5) lead to the same polarisation value. Therefore, the standard
deviation of the left-right self-placement scale shall serve as proxy for polarisation inside the
society, thus not taking political parties directly into account. This last measure is denoted with
polaris_sdleftright.
Admittedly, there are some facts worth noting: The measure is not directly related to the political
sphere, i.e. not to political parties. However, it might be the case that citizens perceive large
polarisation inside the society and therefore choose to support parties as partisans. I implicitly
then assume that the mobilisation effect would be more visible for citizens around the middle
area of the scale since a wider range of parties is available at this position.
According to the Manifesto-based measure (figure 3-4), the three Scandinavian countries are
among the 5 most polarised party systems and score high on fragmentation as well. This
corresponds to Sartori’s (2005: 112) theoretical expectation that high fragmentation (seen as a
party systems with more than 5 parties) lead to polarised pluralism. However, according to the
survey-based measures (figures 3-5 and 3-6), the Scandinavian countries lie in the middle,
whereas Eastern and Southern European countries score high on polarisation.
63

Aust
riaCy
prus
Belg
ium
(Wal
loni
a)Es
toni
aGr
eat B
ritai
nPo
land
Luxe
mbu
rgSl
oven
iaBe
lgiu
m (F
land
ers)
Irela
ndFr
ance
Hung
ary
Gree
ceSp
ain
Port
ugal
Bulg
aria
Neth
erla
nds
Slov
akia
Finl
and
Italy
Germ
any
(Wes
t)Ge
rman
y (E
ast)
Swed
enCz
ech
Repu
blic
Denm
ark
Norw
aySw
itzer
land
0
5
10
15
20
25
30
Figure 3-4. Mean party system polarisation in the 27 level 2 units based on Manifesto Data.
Source: Manifesto Data Set and own calculations.
Irela
ndBe
lgiu
m (F
land
ers)
Esto
nia
Grea
t Brit
ain
Germ
any
(Eas
t)Lu
xem
burg
Germ
any
(Wes
t)Au
stria
Belg
ium
(Wal
loni
a)Sl
ovak
iaNe
ther
land
sPo
land
Denm
ark
Slov
enia
Finl
and
Norw
aySw
itzer
land
Spai
nPo
rtug
alFr
ance
Swed
enGr
eece
Hung
ary
Czec
h Re
publ
icBu
lgar
iaIta
lyCy
prus
0
0.5
1
1.5
2
2.5
Figure 3-5. Mean party system polarisation in the 27 level 2 units based on ESS data.
Source: Own calculations based on ESS data.
64
Irelan
d
German
y (West
)
Great B
ritain
German
y (Eas
t)
Switze
rland
Belgium (F
landers
)
Austria
Estonia
Spain
Netherl
ands
Finlan
d
Belgium (W
allonia)
Norway
Portugal
Denmark
Luxemburg
Greece
Swed
en
Slova
kia
PolandFra
nce
Slove
niaIta
ly
Hungary
Czech Rep
ublic
Bulgaria
Cyprus
0
0.5
1
1.5
2
2.5
3
3.5
Figure 3-6. Left-right polarisation of society.
Source: Own calculations based on ESS data.
Table 3-10. Correlations between the four level 2 variables.
1 2 3 4 5 61 Disproportionalitya 1.002 Effective number of electoral partiesa -0.21 1.003 Party system polarisationa (MD) -0.22 0.31 1.004 Left-right polarisationa (SD ESS) -0.04 0.14 -0.13 1.005 Survey based party system polarisationa (ESS) -0.03 -0.03 0.20 0.83 1.00
6 Maturity of democracyb 0.32 -0.14 0.01 0.29 0.14 1.00N=27 countriesa Pearson’s rb Kendall’s tau b
Table 3-10 summarises the correlations between each of the four country level variables19. With
one exception, the variables are only modestly correlated (|r|< .30); however, maturity of
democracy and disproportionality are modestly stronger correlated, indicated by τ b=.32 since 19 The numerical values of the level 2 variables are displayed in Appendix E.
65

maturity of democracy is treated as ordinal level variable. The two survey-based measures of
polarisation are strongly correlated at .8, whereas the third Manifesto-based measure is strongly
correlated to neither of the survey-based measure. This is an indication that there are different
concepts represented in the survey-based measures and the Manifesto-based respectively. In
order to avoid variance inflation, these three measures will be tested separately on at a time.
Nordic Western Southern Eastern Atlantic02468
1012141618
Effective number of electoral parties Disproportionality Party system polarisation Left-Right polarisationSurvey-based polarisation
Figure 3-7. Overview over the level 2 variables, grouped in geographic regions.
Figure 3-7 summarises the five operationalisations according to geographic regions. The Nordic
countries score high on the effective number of political parties and very low on
disproportionality. However, the countries score highest on Manifesto-based polarisation,
whereas the other measures of polarisation indicate a middle position. The Atlantic countries
score highest on disproportionality and lowest on all three polarisation measures as well as the
effective number of parties. Western, Southern and Eastern European countries show very similar
patterns in terms of the level 2 variables.
3.2.3 Control Variables
The Erikson and Goldthorpe social class classification was obtained by running the syntax based
on the ISCO codes and proposed by Leiulfsrud, Bison, and Jensberg (2005). The Erikson and
66
Goldthorpe (1992) class scheme divides society, or rather the labour force, into seven categories
(table 3-11). Though they originally aimed at distinguishing between employers, self-employed
workers and employees, they did not consistently keep this division, since large employers and
higher grade service persons are merged into one group. Therefore, it is rather difficult to
maintain a clear-cut division between workers and employers. Basically, the following classes II,
III, V, VI and VII are formed exclusively by employees, whereas the classes I and IVc are to
some extent a mixture of both employers and employees and self-employed workers respectively.
In other words, the key feature is the distinction between various types of employees.
Table 3-11. Class scheme after Erikson and Goldthorpe (1992).
Code Erikson/Goldthorpe label Class label
0 I Higher level service class
1 II Lower level service class
2 IIIa + IIIb Routine non-manual
3 IVa + IVb Petty bourgeoisie
4 V+VI Skilled workers
5 VIIa + VIIb Unskilled workers
6 IVc Farmers
As mentioned earlier, there are 7 classes in the class scheme applied in the analysis; the
description of the respective class is based on Erikson and Goldthorpe (1992: 36-41). First of all,
the service class is divided into two different classes, the higher level (I) and the lower level
service class (II). The first class (I), the higher level service class, includes high-grade
professionals, administrators and officials as well as managers in large industrial companies and
large proprietors as mentioned above. Positions in this class carry the largest responsibilities
(Erikson and Goldthorpe 1992: 43). On the contrary, the second class (II) consists of lower-grade
professionals, higher-grade technicians, managers in small companies and supervisors of non-
manual employees. The third class (III as merger of IIIa and IIIb) unites lower and higher level
non-manual workers such as sales personnel, rank-and-file service workers who fulfil clerical
tasks. Class IIIb was added in order to capture “low-skill non-manual positions largely occupied
by women” (Erikson and Goldthorpe 1992: 44). Small proprietors with and without employees as
67
well as artisans are grouped together in the fourth class (IV as merger of IVa and IVb), named
petty bourgeoisie. The specific feature about it is that they either employ a small number of
employees or are self-employed in their own small company. Finally, the last three classes deal
with different kinds of workers. The fifth class (V+VI) consists of skilled workers, i.e. lower-
grade technicians, supervisors of manual workers and skilled manual workers. Unskilled workers,
however, find themselves placed in the sixth class (VIIa and VIIb). Individuals placed in either
group V or VI do not work in the primary sector, but in the secondary. As similar to class II, there
is the least need to grant autonomy in the workflow to employees, whereas skilled workers fulfil
craft-specific tasks (Erikson and Goldthorpe 1992: 43, footnote 16). Finally, workers engaged in
agriculture are being placed in the seventh class (IVc). Erikson and Goldthorpe (1992: 44) justify
this distinction with the fact that the primary form of property is land.
In addition to class, area of residence (urban vs. rural) shall serve as control variable for the
classic cleavage mentioned earlier. Gender completes the group of control variables that enter at
an early stage since these variables denote the very stable social background as shown in the life
time learning model.
It can be expected that the variables have differing time horizons. That is why a sequential
regression analysis will be used that takes these differences into account. Figure 3-8 displays the
proposed regression sequence. At first, invariant individual characteristics enter the model that is
basically gender, birth cohort, education, social class and area of residence which cannot be
influences by other factors outside the individual. In a second step, social capital is included in
the model. Afterwards, long-term political attitudes and political behaviour enter into the model,
such as trust, political interest and media consumption. Actually some of these variables might
produce endogeneity problems since it can be argued that certain opinions and attitudes are
consequences rather than causes. Therefore, the results in this model shall be looked at with
caution. Nevertheless, I argue that long-term political play a remarkable role and cannot be
discarded. In a final step, the contextual level 2 variables complete the model. This model follows
the life time learning model and the time horizons proposed there.
68

I: Invariant Individual Characteristics: e.g. Gender, Birth Cohort
II: Acquired Skills and Attributes: e.g. Education, Social Class, Social Capital
III: Long-term Political Orientations: e.g. Political Interest, Media Usage
STRENGTH O
F PARTY IDENTIFICATIO
N
TI M E HO RIZ
O NIV: Contextual Characteristics: e.g. Polarisation
Figure 3-8. Causal model.
3.3 ModelMultilevel models connect a certain outcome, here the strength of party identification, to not only
individual but also context characteristics in which an individual is located. Figure 3-9
69
Figure 3-9. Separate effects of individual and contextual effects (a) and cross-level interaction (b).Source: Snijders and Bosker (1999: 11)
YX
Z
YX
Z
exemplifies how a multilevel model relates both individual (X) and contextual (Z) variables to a
certain outcome (Y).
The analysis deals with the strength of party identification which is coded as 4-category ordinal
variable. Based on this ordinal data structure, an ordered logistic multilevel regression is the
method of choice.
The rationale behind this model is the introduction of cumulative probabilities. For the three
distinct outcomes as presented above, the following assumptions can be made:
Prob (Y =0 )=p1
Prob (Y =1 )=p2
Prob (Y =2 )= p3
Prob (Y =3 )=p4
Having made this distinction, the relation between these three probabilities can be seen as
cumulative (Hox 2010: 142):
p1¿=Prob (Y=0)=p1
p2¿=Prob(Y ≤1)=p1+ p2
p3¿=Prob (Y ≤2)=p1+ p2+ p3=1
p4¿=Prob (Y ≤3 )=p1+p2+ p3+ p4=1
The last equation is not necessary since probabilities can only vary between 0 and 1, thus p4¿ can
simply be found by subtracting p3¿ , p2
¿ and p1¿ from 1.
The general family of statistical techniques is again the family of logistic regressions, using the
logistic link function. Instead of using binomial probabilities, the cumulative probabilities are the
outcome (Hox 2010: 142-143). ηc is the underlying latent variable, strength of party
identification, that defines the link function:
70

ηc=log( pc¿
1−pc¿ )=log( Prob(Y ≤ c)
Prob (Y >c ) )=logit ( pc¿ )
Then, a random intercept-only model can be written as follows (Hox 2010: 143):
ηijc=θc+u0 j,
where θc is an intercept that is category-specific (i.e. threshold). The key assumption is the
assumption of proportional odds, i.e. the independent variables affect the odds ratio in the same
way for every category c.
Based on that, following relations hold:
y i={0 ,1 ,2 ,3 ,
if ηi ≤θ1
if θ1<ηi ≤θ2
if θ2<ηi ≤θ3
if θ3<ηi
In particular, the equations will take the following form (Hox 2010: 145; Raudenbush and Bryk
2002: 321-324), since the first threshold is 0 (θ1=0¿:
Level 1:
η1 ij=β0 j+β1 j∗xij
η2 ij=θ2+β0 j+β1 j∗x ij
η3 ij=θ3+β0 j+ β1 j∗x ij
η4 ij=θ4+β0 j+ β1 j∗x ij
where the subscript i denotes an individual’s value on a given variable x in country j. In terms of
the analysis that will be carried out in this paper, the x’s are the level 1 variables described above,
such as educational achievement, gender. Random intercept models will be fitted that take the
general form on level 2 given below:
Level 2:
βoj=γ00+γ 01∗AD j+γ 02∗N j+γ 03∗G j+γ04∗P j+uoj
71
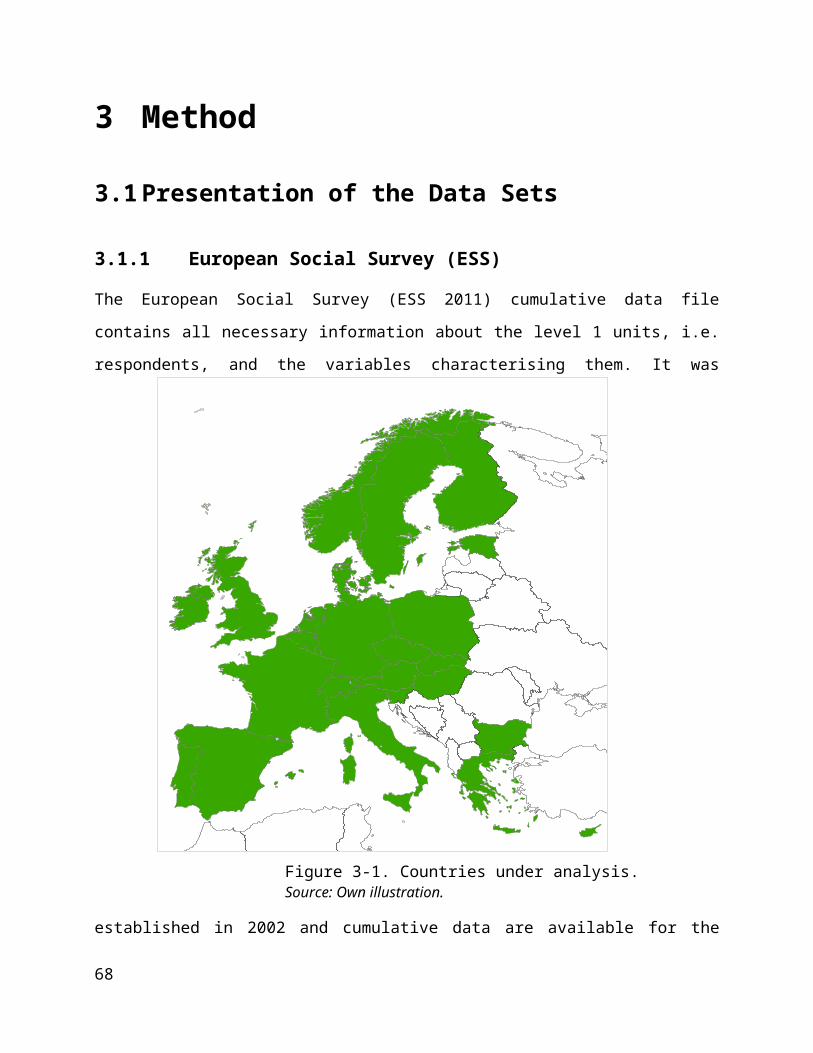
β1 j=γ1 j+u1 j
Figure 3-10 shows exemplary the relationship between logistic density function and the
thresholds. Since ordered logistic multilevel regression is not part of the Stata 12 MP routines, I
downloaded and incorporated the GLLAMM package which is outlined and explained in Rabe-
Hesketh, Skrondal, and Pickles (2004; 2005). Practical guidelines for the model were taken from
Rabe-Hesketh and Skrondal (2008).
72
no PI not close quite close very close
Figure 3-10. Thresholds and observed responses for ordinal logit model.
Source: Own figure after Hox (2010: 144).
θ2 θ3 θ4
4 Empirical Analysis: The Strength of Party Identification
In order to test the hypotheses set up in the methodological chapter, a sequential two level ordinal
logistic regression model was fitted. As mentioned before, the results are weighted with the
design weight what ensures correct results in a statistical sense. The model numbers in the result
table header correspond to the numbers in the causal model. Metric variables were centred by
subtracting the variable’s grand mean which is presented in table 4-1. The factor solutions are
obviously not centred since they already have a mean that is zero.
Table 4-1. Summary statistics of the metric variables.
Variable Obs Mean Std. Dev. Min Maxeduyears 52,728 12.3 4.0 0.0 25.0age 52,728 47.8 16.9 14.0 102.0religattend 52,728 4.4 1.5 0.0 6.0involvement 52,728 0.0 1.0 -2.9 3.1institut.trust 52,728 0.0 1.0 -2.8 3.4interpers.trust 52,728 -0.1 1.0 -3.6 3.2mediausage 52,728 0.0 1.0 -2.0 7.1fragmentation 52,728 4.6 1.1 2.8 7.1disprop 52,728 5.3 4.2 0.7 19.4polaris_MD 52,728 11.2 5.9 2.1 27.0polaris_sdleftright 52,728 2.1 0.3 1.8 3.1polaris_survey 52,728 1.3 0.4 0.5 2.3
Since the number of respondents varies largely between countries, I shall base the analysis on
roughly 2,000 respondents per country. Thus, countries present in all rounds are not
overrepresented and cannot distort the results. The number 2,000 is based on the fact that the
smallest number of observations per country is slightly below this threshold. I then drew a
random sample of 2,000 observations per country from the data set. Table 4-2 shows the
regression results of the ordinal logistic multilevel regression on the strength of party
identification. The baseline intra-class correlation coefficient is estimated as 0.0651, i.e. 6.51
73
percent of the total variation is caused by differences between countries. It must be noted that this
74
Table 4-2. Regression results for the level 1 predictors.pid Model 0 Model 1 Model 2 Model 3gender -0.214*** -0.195*** 0.037(Female) (0.026) (0.025) (0.028)
age 0.020*** 0.017*** 0.011***(Age) (0.001) (0.001) (0.001)
eduyears 0.040*** 0.032*** -0.010*(Education in years) (0.005) (0.005) (0.005)
egp1 -0.038 -0.043 0.002(Lower level service class) (0.035) (0.034) (0.036)
egp2 -0.228*** -0.193*** -0.042(Petty bourgeoisie) (0.044) (0.044) (0.047)
egp3 -0.151** -0.081 0.031(Routine non-manual) (0.057) (0.059) (0.058)
egp4 -0.273*** -0.242*** 0.005(Skilled workers) (0.052) (0.051) (0.051)
egp5 -0.319*** -0.277*** -0.014(Unskilled workers) (0.049) (0.047) (0.048)
egp6 0.049 0.088 0.234***(Farmers) (0.066) (0.064) (0.066)
area1 0.015 0.066 0.009(City) (0.048) (0.054) (0.038)
area2 -0.003 0.019 0.000(Town) (0.039) (0.041) (0.038)
religdenom1 0.136*** 0.129**(Roman Catholic) (0.037) (0.039)
religdenom2 0.259*** 0.222***(Protestant) (0.040) (0.038)
religdenom3 0.022 0.076(Other Christian) (0.097) (0.092)
religdenom4 0.061 -0.029(Other non-Christian) (0.197) (0.169)
religattend -0.024 -0.010(Church attendance) (0.016) (0.016)
tradeu1 0.240*** 0.176***(Trade union member) (0.029) (0.022)
organis1 0.600*** 0.397***(Organisation member) (0.060) (0.054)
polinter1 0.585***(Hardly) (0.037)
polinter2 1.246***(Quite) (0.049)
polinter3 1.942***(Very) (0.049)
involvement 0.173***(Factor: involvement in politics) (0.018)
institut.trust 0.242***(Factor: institutional trust) (0.016)
interpers.trust 0.072***(Factor: interpersonal trust) (0.014)
mediausage 0.063***(Factor: media usage) (0.016)
_cut11 -0.075 -0.367*** -0.147* 0.975***(0.087) (0.085) (0.064) (0.062)
_cut12 0.396*** 0.120 0.349*** 1.516***(0.101) (0.1099) (0.038) (0.045)
_cut13 2.638*** 2.413*** 2.670*** 4.009***(0.158) (0.164) (0.081) (0.104)
N 52,728 52,728 52,728 52,728LL -58835.740 -57778.250 -57295.48 -54503.98Pseudo-R2 (Mc-Fadden) — 0.0180 0.0262 0.0736Pseudo-R2 (Nagelkerke) — 0.0440 0.0636 0.1697
Significance levels: * p<0.05; ** p<0.01; *** p<0.001(Robust standard errors in parentheses)
75
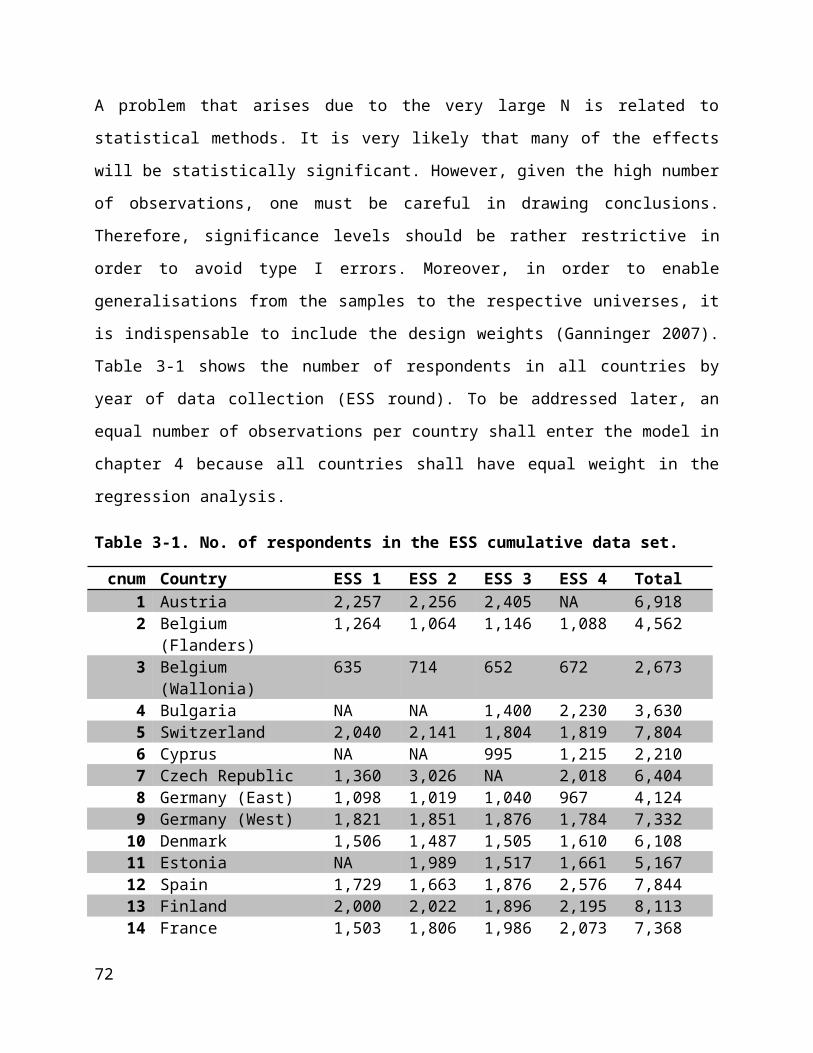
general effect is estimated on average for all countries under study simultaneously; however, the
slope for age is fixed, thus assumed to be equal for all countries.
4.1 The Level 1 Hypotheses
4.1.1 The Importance of Age
As formulated in hypothesis 1, there is indeed evidence for the importance of age as predictor of
party identification. In model 1, age has a total causal positive effect of .020 on partisan strength.
In other words, each increase in age by one year above the mean age causes an increase in the
logged strength of party identification of .020 of being in a higher level of partisan strength.
Conversely, the predicted probability of holding a party decreases by .020 per age year below the
mean age, given that all other variables in the model are held constant. The direct causal effect of
age is .011 and only half of that total effect, whereas the other half is indirect via social capital
variables and attitude variables.
Therefore, there might be countries, where the general effect of age is lower or higher. In
conclusion, however, the hypothesis can be regarded as confirmed: Younger citizens state a party
identification less often than older citizens; and if they state one, they are expected to hold a
weaker attachment to their preferred political party. This is very much in line with expectation of
the life time learning model. Increasing experience with elections, parties and programmes leads
to stronger attachments. Nevertheless, this is not a deterministic trend in personal party
identification as Campbell et al. (1960) claimed. It simply means that today’s older generations
did at one point in time acquire a party identification and maintained it, whereas the younger
generations have not (yet) caught up to the same extent.
4.1.2 The Impact of Social Capital
In the analysis, there were basically three types of indicators of social embeddedness: Firstly,
membership based on religion and religious denomination; secondly, membership in work-related
76

organisations; thirdly, working in other, non-political organisations. Let’s first have a look at
religious belongings. There is evidence that especially Christians, i.e. Protestants and Catholics
tend to be closer partisans compared to atheists; the estimated and highly significant total causal
effects in model 2 are around .259 for Protestants, .136 for Catholics. In addition, this also
provides evidence for the importance of cleavages since both Catholics and Protestants tend to be
more partisan than other religious denominations and atheists. Attending religious services less
often has a negative insignificant total causal effect of -.024 on the strength of party
identification. This slightly significant effect remains insignificant when political attitudes enter
the model; accordingly, the effects of religious denomination decrease when controlling for
political attitudes in model 3.
The second indicator is related to integration into trade unions as organisation for protection of
labour right and wage bargaining. Both current and previous trade union members show stronger
attachments compared to non-members. The common total causal effect is .240 and slightly
stronger than the effect of religious denomination. Though also the institutionalised churches
have been facing a loss of members, the trend is stronger for trade unions. The sequential analysis
shows that trade union membership is connected to some of the attitudes that enter the model in
step 3. Therefore, the estimates drop to a direct effect of .176, indicating that the total causal
effect is mediated through political attitudes. The direct effect remains larger than the indirect.
Finally, an activity related neither to work nor to religion is represented by whether a person has
worked in an organisation other than a political party. The estimated effect in model 2 is .600,
indicating that active citizens are expected to be more partisan compared to inactive citizens in
the sense mentioned above. Here as well, the original total causal effect decreases when political
attitudes are controlled to .397 in model 3.
In conclusion, the hypothesis about integration into civil society can be confirmed, based on the
indicators presented. This seems to be a more general disposition that is connected to
“integration”: Since members of religious organisations, other organisations or trade unions are
members due to certain belief systems or, in case of the latter one, issue or ideology-related
attitudes. Joining such an organisation is therefore connected to a wish of change or the wish for
meeting likeminded people what might have a reinforcing effect on the attitudes that once
brought an individual there. Moreover, institutionalised forms penetrate their members with
77
messages and standpoints of the institution itself in one way or another. Hence, if the institution
is somehow associated with a political party, it may serve as transmission channel through with
political parties gain support. This has been observed with trade unions and the churches. Though
meant in a slightly different sense, Robert Putnam’s term of ‘social capital’ that has a value
(Putnam 2000: 19-20) does fit here as well: Active people that are highly integrated usually hold
party identifications.
4.1.3 Cognitive Mobilisation
Hypothesis 3 proposes a positive effect of cognitive mobilisation on partisanship. Four different
components were distinguished in the model of which each should increase the probability of
having a party identification: Educational achievement, interest in politics, political involvement
and media usage.
First of all, education plays an ambiguous role. In the first model that includes long-term socio-
demographic background variables, the total causal effect of education is in accordance with the
hypothesis 3, i.e. each one year increase in education above the mean education, i.e. becoming
more cognitively mobilised, increases the log odds of being placed in a higher level of partisan
strength (0.040). Surprisingly, this positive significant effect is being reversed when political
attitudes are included in model 3. Each increase in education is now related to a slightly
decreasing probability of being placed in a higher level of partisan strength (-.010). It is relatively
unusual that an effect remains significant, while the sign is changing. However, this estimate for
education indicates the “pure” effect of education when all closely related effects are controlled
for. In a more simple way, if high education is not correlated to interest in politics any more,
education itself leads to rather weaker attachments. To sum up, hypothesis 3 in terms of
education holds when political attitudes are not taken into account. If so, education affects
partisan strength negatively and is then in line with the original cognitive mobilisation
hypothesis, although the effect is tiny. However, the total causal effect indicates that increasing
educational achievement fosters party identifications which is in line with hypothesis 3.
78
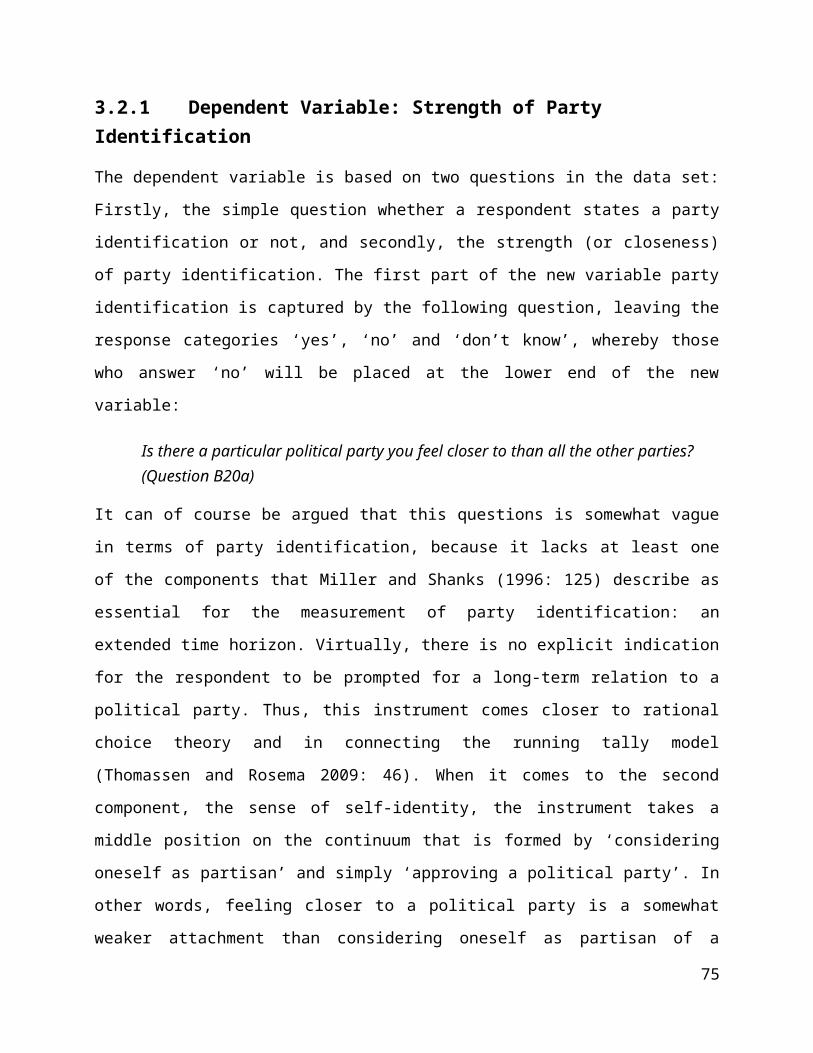
Secondly, the well-proven effect of interest in politics can be confirmed here as well; moreover,
the effect of political interest is by far the largest one. Political interest appears to be almost
linearly related to the strength of partisanship. People with low interest in politics are expected to
hold a stronger party identification (.585) compared to uninterested persons; the same applies to
moderately and highly interested people (1.246 and 1.942 respectively). Being open towards
topics on the political agenda and persons engaged in the political arena actually leads to a closer
relation to a political party – hypothesis 3 can therefore be seen as confirmed with respect to
interest in politics. Moreover, since the factor analysis revealed the specific nature of interest in
politics compared to the ability variables below, it can also be confirmed that interest in political
affairs is an independent pillar of cognitive mobilisation along with media usage and educational
achievement as I theorised.
The same patterns can be seen according to political involvement. In general, the factor solution
that represents involvement into politics has a positive effect on the strength of party
identification. Each one unit increase leads to a .173 higher log odds for being placed in a higher
level of partisan strength. It is important to note that the effect is highly significant and different
from the effects produced by interest in politics. Therefore again, the distinction between these
two dimensions seems fruitful and valuable. In conclusion, being interested in politics and being
involved with political issues are two distinct variables with significant and strong effect on the
strength of party identification. Hypothesis 3 is therefore confirmed with regard to involvement.
Finally, media usage is captured by a factor solution that represents television, radio and
newspaper usage at the same time. Using media actively for the purpose of political information
increases the likelihood of having a stronger party attachment by .063. Though the effect is
significant, it appears to be far less important than the other components of cognitive mobilisation
which confirms hypothesis 3 for media as well.
To sum up, intimidating evidence has invalidated the theory of cognitive mobilisation in many
respects. Only education seems to play the role that it was been assumed by Dalton (1984) and
Dalton and Wattenberg (2000), although they did not formulate their theory for taking political
attitudes into account. The other components, interest in politics, involvement and media
consumption point directly in the other direction: They actually increase the strength of party
identification among citizens of the 27 European countries under study
79

4.1.4 Trust
The factor analysis resulted in two factors of which one represents interpersonal and the other
institutional trust. The main focus, however, lies on institutional rather than interpersonal trust.
Bearing qualms about endogeneity in mind, there is a positive effect (.242) of institutional trust
which is formed by trust in parliament, legal system and politicians, on the strength of party
identification. I advocate the view that some basic level of institutional trust must be present
before a person starts to identify with a political party; that is what the variable in the analysis
should represent. The results table supports this view. Having trust in institutions increases the
likelihood of stating a party identification.
The second part of the trust factor analysis shows a small significant effect of interpersonal trust
on the strength of party identification (.072) which seems almost negligible. Though I laid out
reasons for controlling for interpersonal trust, I regard interpersonal trust not as immediately
important as trust in institutions. Anyhow, the analysis shows that basically the institutional trust
components is very important, whereas the interpersonal component taken into account for
control purposes seem to be far less important. The hypotheses 4a and 4b are confirmed.
4.1.5 Comments on the Control Variables
I shall now turn to some findings based on the control variables. There is confirmation that
gender itself does not have any direct influence on the strength of party identification; rather, the
initially negative effect indicating that women tend to hold weaker party identifications than their
male counterparts, becomes insignificant when controlling for political attitudes and political
behaviour. Thus, it is primarily due to these differences in attitudes connected to party
identification that women have weaker attachments than men.
The Erikson and Goldthorpe class variable shows significant effects when it first enters into the
regression model. However, these initially negative total causal effects become insignificant as
soon as one controls for political attitudes. Thus class membership must be closely correlated
with certain attitudes and opinions that mediate its effect. Exceptional cases are only farmers who
tend to have a positive and significant influence on the strength of party identification; their
80

probability of stating a stronger party identification increases by .234 compared to higher
controllers (class I). This might be the reason why the domicile identifier is insignificant all the
way: Area of residence (area) does not have any significant effect on the strength of party
identification. It indicates that mere residence in a geographical sense is no longer a suitable
proxy for social status and/or political attitudes.
I shall now turn to the analysis of the level 2 variables that represent the country-specific features
of each society and/or party system.
4.2 The Level 2 HypothesesFirst of all, the correlations between partisan strength and each of single level 2 predictors are
displayed in table 4-3.
Table 4-3. Correlation coefficients between strength of party identification and the level 2 variables.
pidfragmentation η=0.005disprop η=0.004polaris_MD η=0.006polaris_survey η=0.024polaris_sdleftright
η=0.029
matdem Crame r ' sV=0.087
Fragmentation, disproportionality and Manifesto-based polarisation are almost uncorrelated with
the strength of party identification. The correlations for the two survey-based measures are not
very large either; however, they are to some extent mirroring the importance of these measures
compared to the ones named before. Since maturity of democracy is not a matric variable, the
Cramer’s V value is shown instead of the eta-coefficient. There is obviously a correlation but it
turns out to be very weak since values below .1 are usually seen as very small correlation. Before
turning to the regression analysis, it should be noted that the magnitude of the correlations found
cannot be compared to the effect sizes of the regression analysis.
81
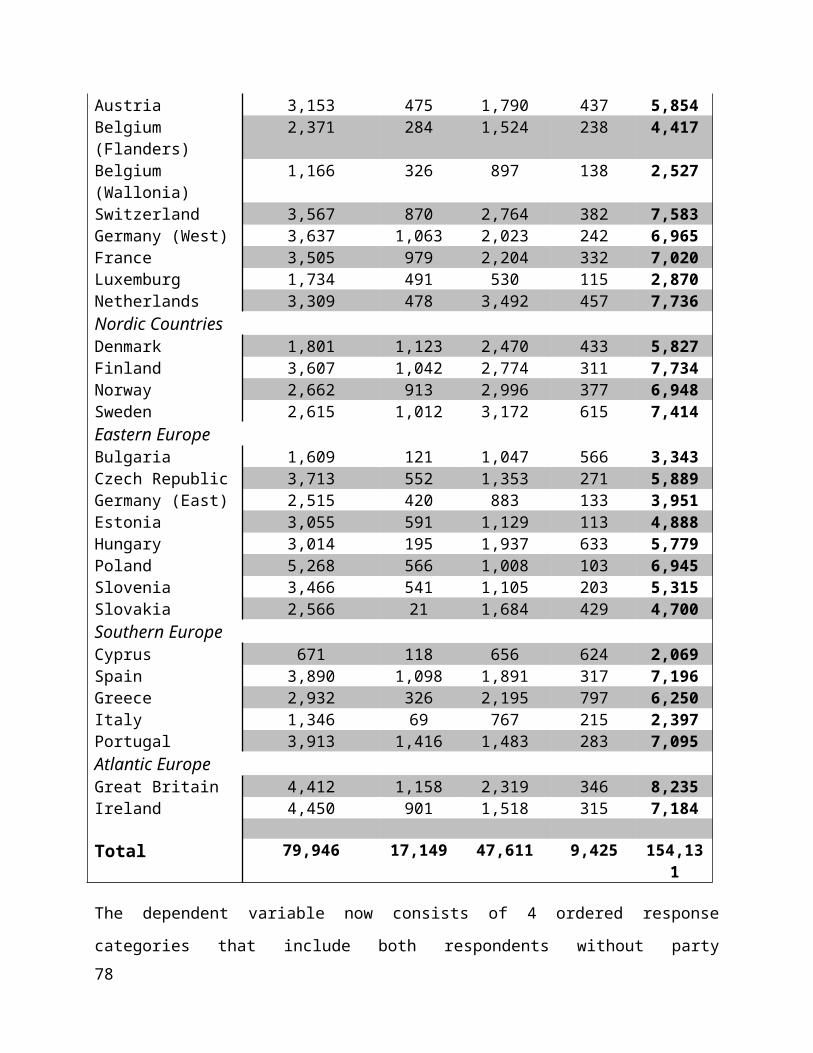
Table 4-4 shows the results for the level 2 variables. There are three different columns that
indicate the three different polarisation measure mentioned in the other chapters:
Model 4a: polaris_MD is the Manifesto-based party system polarisation variable.
Model 4b: polaris_survey is the ESS-based party system polarisation variable.
Model 4c: polaris_sdleftright is the ESS-based society polarisation variable (the standard
deviation (sd) of the societal left-right variable).
The output for level 1 variables is omitted since the effect sizes remain unchanged. The full
models can be found in Appendix G.
Table 4-4. Regression results for the level 2 variables.
pid 4a 4b 4c(regression output for the level 1 variables omitted)
fragmentation 0.139*** 0.067*** 0.042***(Fragmentation N j)
(0.019) (0.013) (0.011)
disprop -0.004 0.003 0.005(Disproportionality G j ) (0.003) (0.005) (0.003)
matdem1 -0.293*** -0.227** -0.332***(Old democracies
AD1 j)
(0.035) (0.081) (0.072)
matdem3 -0.257*** -0.359*** -0.662***(New democracies
AD3 j)
(0.037) (0.082) (0.067)
eastage 0.005 0.005 0.005(Interaction
age∗AD3 j)
(0.003) (0.003) (0.003)
polaris_MD -0.008*(Polarisation: MD P j)
(0.004)
polaris_survey 0.906***(Polarisation: Survey P j)
(0.053)
polaris_sdleftright 1.306***(Polarisation: Left-right
P j)
(0.049)
_cut11 0.792*** 0.824*** 0.574***(0.067) (0.081) (0.061)
_cut12 1.332*** 1.364*** 1.128***(0.056) (0.089) (0.049)
_cut13 3.826*** 3.858*** 3.663***(0.109) (0.137) (0.096)
N 52,728 52,728 52,728LL -54495.75 -54480.94 -54480.06Pseudo-R2 (Mc-Fadden)
0.0738 0.0740 0.0740
82
Pseudo-R2 (Nagelkerke)
0.1700 0.1706 0.1706
ICC 0.1485 0.0439 0.0465
* p<0.05; ** p<0.01; *** p<0.001 (Robust standard errors in parentheses)
4.2.1 Maturity of Democracy and Disproportionality
First of all, maturity of democracy shows significant results in all three cases: The reference
category is medium old democracies such as Spain. In accordance with hypothesis 6, citizens of
new democracies (matdem3) tend to show weaker attachments compared to medium old
democracies. However, also old democracies (matdem1) follow the same pattern: Being citizen
of an established democracy decreases the log odds of being place in a higher level of strength by
.293 in model 4a, .227 in model 4b and .332 in model 4c. Hence, there is no linear trend
concerning the strength of party identification and the maturity of a democratic system.
Accordingly, the differences between old and new democracies seem to be insignificant, as
opposed to the difference compared to the medium old democracies. This pattern appears in
connection with all polarisation measures, although the negative effect of young democracies is
largest (-.662) in model 4c that includes the measure based on the standard deviation of the left-
right axis. In conclusion, there is evidence that young democracies have weaker party
identifications than medium old democracies, whereas the difference to old democracies is far
from being significant, since also old democracies have weaker attachments than medium old
ones.
As opposed to the expectation, there appears to be only a tiny effect based on the cross-level
interaction between individual age and maturity of democracy: Citizens from newly democratised
countries are expected to have a slightly increased probability of holding a party identification if
their age increases by one unit above the grand mean, compared to medium old and old
established democracies. Conversely, young people in Eastern European countries are not
necessarily closer to political parties than their parents or more general generations that were
socialised under socialist regimes. In other words, the younger generations are not or not yet as
close to institutionalised forms of political processes as their older counterparts. Despite this
finding, the general hypothesis 1 of age as predictor for strength of party identification is
83

confirmed as explained above, even though the cross-level interaction effect appears to be tiny
and not significant.
Disproportionality of the electoral system seems to have virtually no effect on the strength of
partisan attachments no matter what polarisation measure is applied. The effect of
disproportionality is insignificant all the way. In conclusion, hypothesis 8 can be seen as
invalidated since the estimates oscillate around 0.
4.2.2 Fragmentation
Hypothesis 7 dealt with party system fragmentation. Fragmentation operationalised as effective
number of electoral parties actually has a significant effect on the strength of individual
partisanship in all models which is contradicting my hypothesis: Higher fragmentation leads to
stronger party identifications. The effect is largest in model 4a that includes Manifesto-based
polarisation (.139) and slightly lower in models 4b and 4c (.067 and .042 respectively). Thus, the
more parties compete for seats in the national parliament, the stronger the party attachments. It
can be argued that the more parties, the more likely one finds a political party which represents
one’s opinions and attitudes. Moreover, the chance for niche attitudes to be covered by niche
parties in the party system is much higher. In conclusion, hypothesis 7 does not receive support.
On the contrary, fragmentation fosters stronger party identifications.
4.2.3 Polarisation
As obvious from the table of results, the Manifesto-based polarisation measure (model 4a) has
only a very tiny effect on the individual strength of partisanship. Conversely, the inclusion of this
measure actually increases the level 2 variation and at the same time the ICC to 0.1485. The
estimated slightly significant effect is -.008, thus indicating that increasing polarisation decreases
partisan strength. However, it might be the case that party programmes might not be a suitable
approximation to party system polarisation as a whole; in addition, some problems with the
84
available data were outlined in the method chapter. Moreover, the effect is very small at the
border of being insignificant.
Fortunately, both the survey-based party-related measure and the survey-based left-right measure
show strongly significant effects. Recall that these effects were closely related to each other with
r ≈ .8. Hypothesis 9 can therefore be confirmed: Polarisation of both society and party system
have a positive effect on individual partisan strength. Each increase in polarisation above the
grand mean leads to an expected increase of .906 (party-system polarisation) and 1.306 (societal
polarisation) respectively in the log odds of being placed in a higher level of partisan strength.
Therefore, the expected positive effect of polarisation in terms of clear political alternatives
provided by the parties in question pays off. It obviously matters whether a party system is
polarised because it is much more at stake in case the opposite party of the one an individual
favours comes into power.
Generally, the individual-based measures tend to be far better predictors than the party
programme-based measure. Surprisingly, it does not play a major role whether the left-right
polarisation measure is being mediated by parties that represent the position on the axis, or not.
This basically indicates that individuals in the 27 level 2 units are usually well represented by
their political parties in terms of left-right placement.
4.2.4 Overall Model Fit
Taken together, model 4b seems to be the model that performs best due to two reasons. Firstly,
the ICC is decreased to its lowest value (.0439). In other words, the model performs best at
reducing country-specific variation in the strength of party identification, whereas the ICC
actually increases when Manifesto-based polarisation is included in the model20. Secondly, both
20 Level 1 variance is assumed to be constant and following a logistic distribution with var=π 2
3, thus the ICC is
estimated by ICC=
ψ̂11
ψ̂11+π2
3.
85

Pseudo-R2 are highest for this model21. The Pseudo-R2 values indicate the predictive power which
the four different variable groups yield. The largest increase in the Pseudo-R2 occurs due to the
inclusion of political attitudes (from model 2 to model 3), i.e. interest in politics and political
involvement, followed by socio-demographics and social capital. At the latter end, the level 2
variables increase the Pseudo-R2 values only very little.
In order to see how well the best model 4b performs, the table below (table 4-5) shows the
predicted and actual party identifications. Roughly 43.21 percent of the observations were
correctly classified given the final model that includes the survey-based and party-related
polarisation measure. This is an increase of about seven percentage points compared to the
intercept-only model (36.04 percent).
Table 4-5. Predicted versus actual party identification for the null and the full model 4b.
Actual PIDNo party
identificationNot close Quite close Very close Total
Null Full Null Full Null Full Null Full Null Full
Pred
icte
d PI
D
No party identification
12,519 14,886 2,820 2,786 8,648 6,902 1,989 1,438 25,976 26,012
Not close 2,883 2,646 628 695 1,894 1,883 438 422 5,843 5,646
Quite close 8,586 6,922 1,964 1,949 5,607 6,767 1,149 1,528 17,306 17,166
Very close 1,727 1,261 427 409 1,199 1,796 250 438 3,603 3,904
Total 25,715 5,839 17,348 3,826 52,728
21 The values are indeed highest for this model though a difference between model 4b and model 4c becomes obvious on the fifth position after the decimal point.
86

5 Empirical Analysis: The Impact of Party Families
Table 5-3 below shows regression for the strength of party identification as dependent variable
and party family as predictor variable. In addition, the overall share of a country’s party
identifiers obtained through calculations based on the ESS cumulative data file entered the model
as centred control variable that is located at level 2 (table 5-1; the variable displayed has not been
centred yet). In model 1, only the party family variable and the share of identifiers are included,
whereas model 2 includes all level 1 variables as seen in the previous chapter. The output,
however, has been omitted here and the full regression table is presented in Appendix H. As
opposed to the analyses presented in the previous chapter, no limitation has been made according
to the number of respondents per country that enter the model.
Table 5-1. Summary statistics of the variable share.
Variable Obs Mean Std. Dev. Min Maxshare 61,280 0.6 0.1 0.3 0.7
Since the main focus is placed on the intermediate level variable party family, it does not appear
necessary to limit the number of level 1 units per level 2 unit. Rather, the regression is more an
analysis of European party families and their identifier’s strength of party identification across
country boundaries. In addition, the level 2 variables from the previous chapter are not included
in this analysis, for they cause serious variance inflation problems in connection with the variable
that captures the share of identifiers. Table 5-2 shows the number of respondents per party
family. Clearly, social democratic and conservative partisans outnumber the other party families,
since their combined share of identifiers exceeds 50 percent.
Furthermore, the original 4 response categories are retained. The reason for doing so is rather
straightforward: There is no need for a distinction between ‘no identification’ and ‘not at all
close’ in this analysis because non-identifiers are not part of the model anyways. However,
87
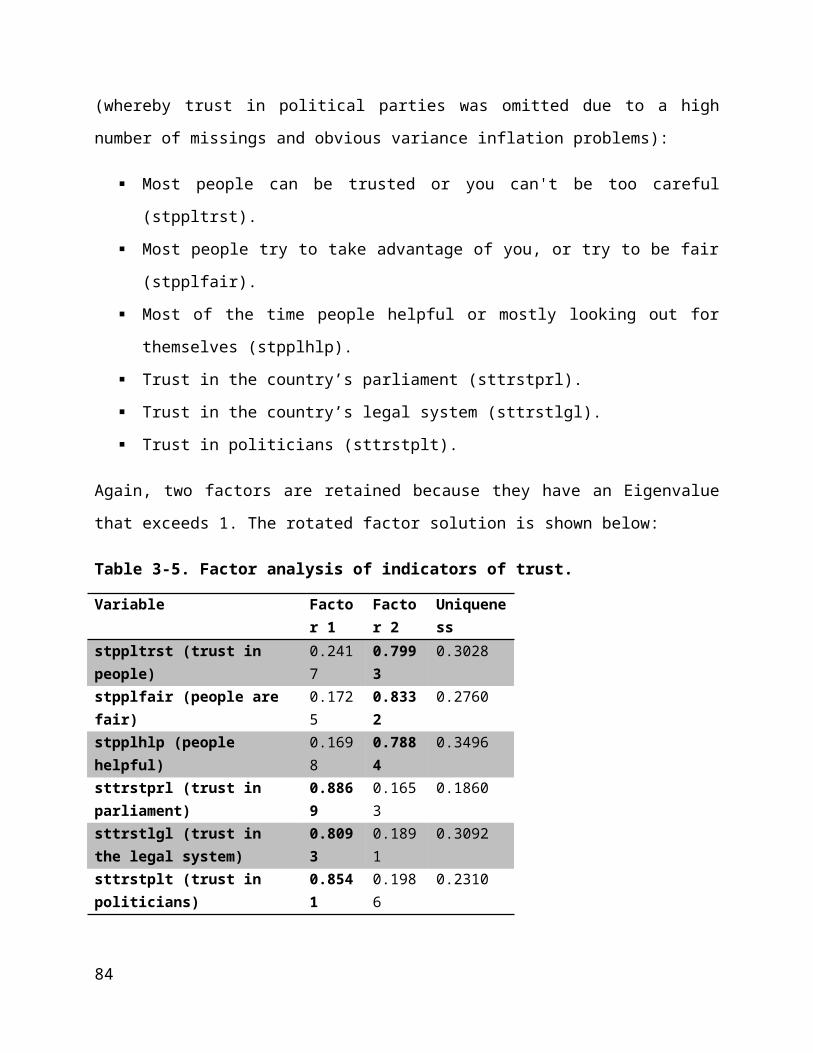
respondents in the category ‘not at all close’ are able to name a party they feel closer to and can
be seen as lower end of the strength scale in this case.
Table 5-2. Distribution of partisans on the party families.
parfam Frequency Percent
Communist 1,635 2.67
Left socialist 3,714 6.06
Social democratic 19,758 32.24
Ecological 3,182 5.19
Liberal 7,394 12.07
Conservative 11,328 18.49
Religious 7,727 12.61
Far right 3,345 5.46
Regional/ethnical 755 1.23
Agrarian/Centre 1,331 2.17
Single Issue/Other 1,111 1.81
Total 61,280 100.00
The reference category is social democratic parties. Single issue and other parties were merged
into the last category, other parties. As obvious from model 1, only three effects of party families
are significant, compared to the partisan strength of identifiers with social democratic parties.
First of all and highly significant, identifiers with communist parties tend to have stronger party
identifications than any other party family. The respective coefficient is .536 and significant at
the 0.1 percent level. Conversely, identifiers of both liberal and radical right parties tend to hold
weaker attachments, -.167 and -.122 respectively compared to social democratic partisans.
Hypotheses 5a and 5b suggested that issue-based parties or old cleavages parties still foster
strong attachments. None of these hypotheses seem to be confirmed. Significant differences can
only be traced for communist parties as well as liberal and far-right parties. In other words, there
seems to be no division between issue-based and cleavage-based parties in terms of how strong
their partisans identify with their preferred political party.
88

Table 5-3. Regression results for the strength component in relation to party family.
strength Null model Model 1 (excluding level 1
variables)
Model 2 (including level 1 variables, output
omitted)Parfam1 Communist 0.536*** 0.519***
(0.108) (0.130)
Parfam2 Left socialist 0.063 0.074(0.070) (0.066)
Parfam3 Social democratic(reference category)
Parfam4 Ecologic -0.044 0.051(0.058) (0.062)
Parfam5 Liberal -0.167** -0.204***(0.048) (0.052)
Parfam6 Conservative 0.035 0.002(0.033) (0.047)
Parfam7 Religious 0.081 -0.003(0.066) (0.057)
Parfam8 Radical right -0.122** 0.054(0.044) (0.050)
Parfam9 Regional/Ethnical 0.110 0.197(0.097) (0.102)
Parfam10 Agrarian/Centre 0.100 0.050(0.111) (0.110)
Parfam11 Single Issue/Other -0.007 0.041(0.090) (0.105)
share 2.715*** 1.669***(Share of identifiers) (0.695) (0.455)
_cut11 -3.838*** -2.514*** -3.404***(0.207) (0.267) (0.218)
_cut12 -1.132*** 0.195 -0.617***(0.150) (0.251) (0.173)
_cut13 2.220*** 3.554*** 2.983***(0.123) (0.287) (0.175)
N 61,280 61,280 61,280LL -56437.39 -56351.497 -53796.102Pseudo-R2 (McFadden) — 0.0015 0.0468Pseudo-R2 (Nagelkerke) — 0.0033 0.0982
* p<0.05; ** p<0.01; *** p<0.001
Robust standard errors in parentheses
Neither is any trend in partisan strength visible regarding extreme parties, such as communist and
radical right parties: Communists tend to have stronger attachments, whereas partisans of radical
right parties tend to have weaker attachments than social democratic partisans. It is far from self-
explanatory what distinguishes communist and radical right parties so that the estimated effect on
the strength of party identification is so different. It might be the case that the estimate for
communist parties is largely a product of strong attachments towards the communist parties in
Eastern Europe that still persist among citizens that played an active and supporting role inside
89
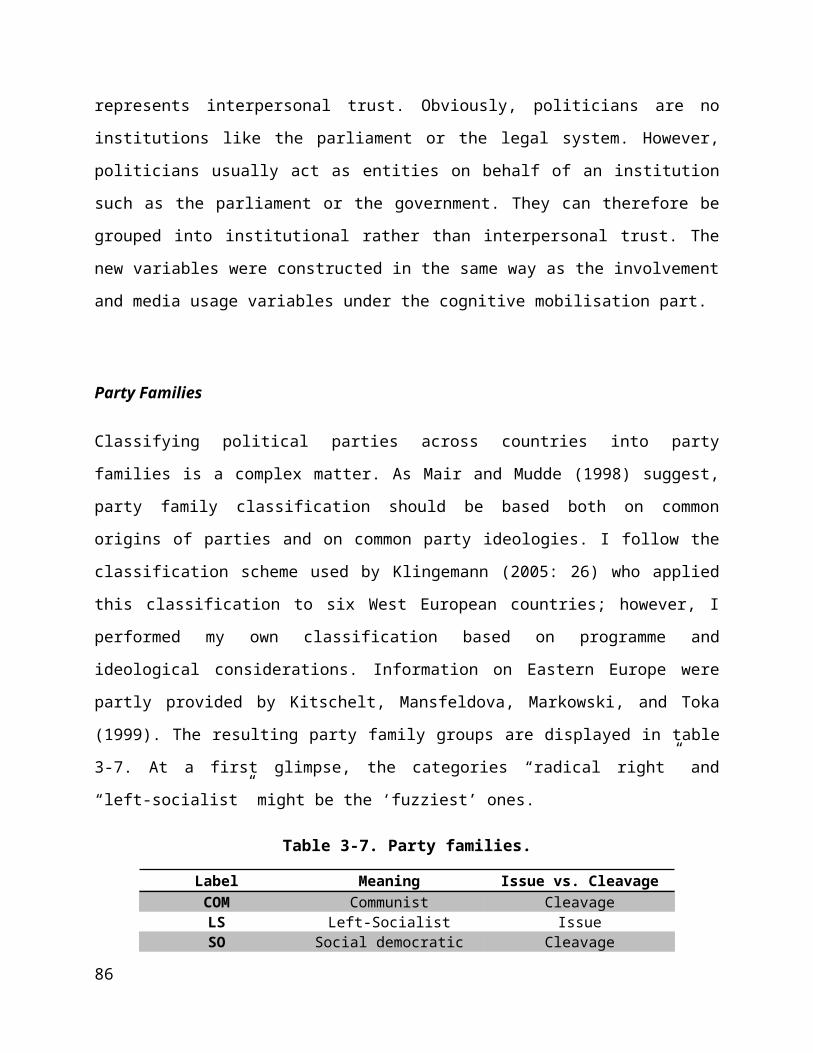
the communist systems before 1990. It might be the case that radical right parties are attracting
protest groups to a larger extent than communist parties. This again indicates volatility due to
negative feelings towards other parties rather than positive attachments to the radical right party.
Further studies might shed light on this division between positive and negative party
identifications addressed earlier.
Interestingly, when consulting the results of model 2, the effect for radical right parties has
become insignificant. This means that the total causal effect of this variable is mediated by some
of the level 1 variables, possibly trust, interest in politics and cognitive mobilisation. The effects
for communist and liberal parties remain significant and maintain their strength even when
controlled for the level 1 variables.
The share of partisans which characterizes a country has a significant and strong effect on the
strength of party identifications. In other words, the higher the number of party identifiers in a
country, the stronger the attachments on individual level. The effect is estimated with 2.715 in
model 1 and drops to 1.669 in model 2 which means that the share of partisans is closely related
to individual-level characteristics.
Nevertheless, since partisans of radical right parties score lower in terms of their partisan
strength, hypothesis 5a is rejected, at least for this kind of parties. The picture is not clearly
supporting hypothesis 5b either.
Table 5-4. Predicted versus actual strength.
Actual PIDNot at all
closeNot close Quite close Very close Total
Null Full Null Full Null Full Null Full Null Full
Pred
icte
d PI
D
Not at all close
29 22 299 272 884 711 182 133 1,394 1,138
Not close 308 281 2,984 2,754 8,428 7,606 1,650 1,523 13,370 12,164
Quite close 908 920 8,362 8,915 23,830 25,172 4,548 4,804 37,648 39,811
Very close 154 176 1,923 1,627 5,667 5,320 1,124 1,044 8,868 8,167
Total 1,399 13,568 38,809 7,504 61,280
90
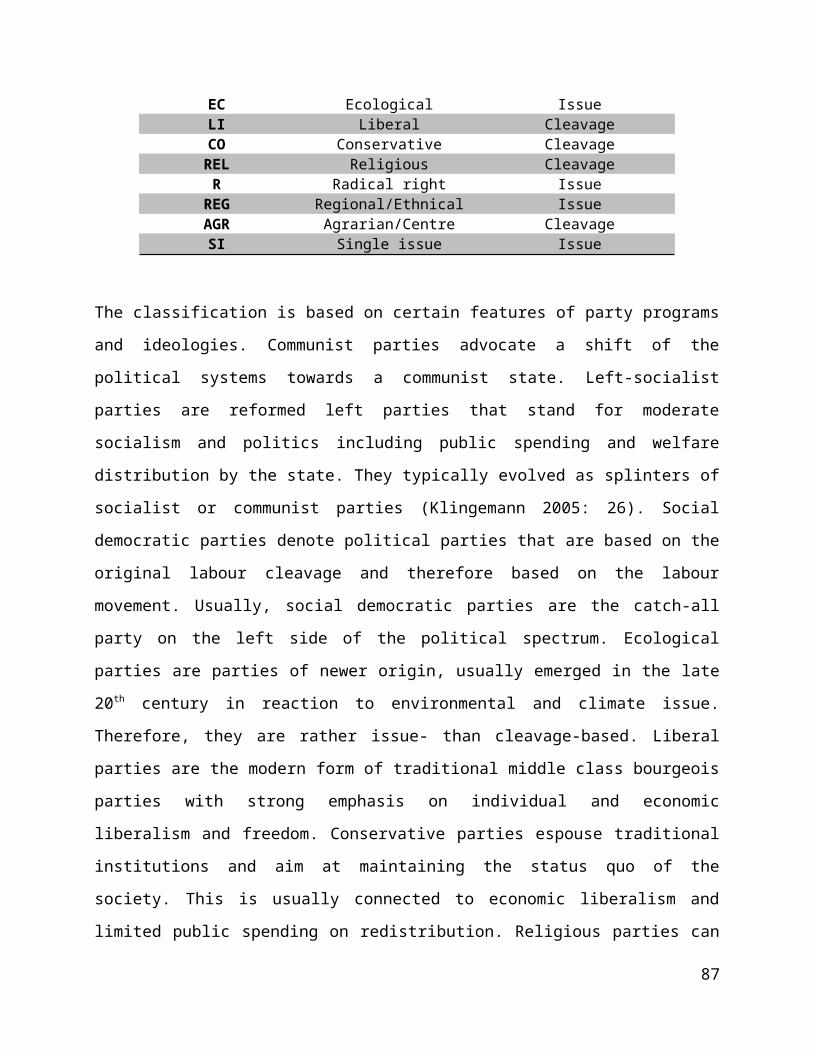
The model fit statistics indicate that party family accounts for very little of the total variation in
the strength of party identification. Moreover, the strongest predictor appears to be the control
variable on level 2 (share) that represents the share of party identifiers within each country. Given
a mere 0.002 and 0.003 for the Pseudo-R2, it becomes obvious that party family is not a very
powerful predictor of partisan strength. Nevertheless, it is interesting to see that strength indeed
varies partly significantly across party family.
A closer look at the classification table 5-4 reveals that model 1 which includes only share and
party family contributes very little: The percentage of correctly classified observations, i.e. the
trace of the matrix divided by the total number of observations, increases by roughly one and a
half percentage points from 45,64 percent in the null model to only 47,31 percent in the model at
hand. Surprisingly, the model performs only better at classifying observations into the “quite
close” category whereas the number of correctly classified observations actually decreases.
In conclusion, there is an effect of party family on the strength of party identification. However,
this effect is tiny and applies to partisans of communist parties that have stronger ties to their
parties and liberal and radical right party identifiers that have weaker attachments to their parties
than social democratic identifiers. The other party families do not show any significant difference
in strength compared to social democratic identifiers.
91
6 Conclusion
The thesis aimed at answering the question which individual and contextual factors exhibit
influence on the individual strength of partisanship. To address this question, the cumulative ESS
data file was used that allows for valid conclusions across the countries under study for the time
period the survey was conducted. It has been pointed out that the ESS programme is
characterised by strict methodological rigor which ensures the reliability of the results generated.
On the individual level, biological age and social capital were confirmed as important positive
sources of influence on party identification. The older and more integrated a citizen, the more
likely becomes a party identification in the first place and the stronger the attachment. Age can
here be seen as proxy for experience with elections, parties and the political system as a whole:
Young voters have to acquaint themselves with the political sphere which counteracts strong
attachments. In addition, integration into civic society, such as churches, trade unions and other
organisation seem to foster party identifications. Though the link between organisation and
political party may vary to a great extent, these organisations serve either as transmission channel
between individual and party or as space for communication about political issues between peers.
Nevertheless, cross pressure might blur the effect of these organisations; for instance, those who
actively engage in an organisation tend to be those who have goals and clear opinions on how to
achieve these goals.
The theory of cognitive mobilisation was granted greater emphasis in the analysis chapter. It has
been confirmed that the concept itself is multidimensional and that all components – educational
achievement, interest in politics, involvement in politics and media usage – have significant and
distinguishable effects on the strength of party identification. Apart from educational
achievement, the other components seem to contradict the original theory of cognitive
mobilisation. Instead of watering down and washing away party identification, interest,
involvement and media usage actually increase the probability of stating a (strong) attachment.
Thus, the expectation of a growing number of independent voters is not met by the data. In other
words, it is not cognitive mobilisation that has triggered dealignment.
92
Some notes of caution were issued in terms of trust. However, the data suggest that trust in
institutions has a positive effect on partisanship. This seems to fit with the expectation that some
basic level of trust is required before any kind of identification can emerge. Nevertheless, the
causal relationship is not necessarily that clear since party identification itself may increase the
level of trust over time. In order to analyse this, a panel analysis must be carried out.
When it comes to the contextual variables under analysis, the picture is somewhat less univocal.
First of all, the bivariate correlations between each of the variables and the strength of party
identification indicate weak to moderate relationships. There is some indication that medium old
democracies tend to have citizens with slightly stronger identifications; moreover, fragmentation
seems to have a positive effect on party attachments. These two findings contradict the original
hypotheses formulated in the theory chapter. As mentioned earlier, the positive effect of
fragmentation might occur due to greater range of parties ‘available for identification’ so that
even niche interest combinations might find representation. Electoral disproportionality caused
by restrictive electoral codes appears to be insignificant and negligible as predictor for individual
party attachments. In other words, it is not pivotal whether an electoral system is highly
disproportional – such as the one in the United Kingdom – or particularly proportional.
Polarisation was scrutinised by applying three different indicators of which two had strong effects
on partisanship. The Manifesto-based measure, however, exhibits no advantage in explaining
partisan strength; it actually increases the ICC and is therefore unsuitable for prediction. Some
deficiencies of the measure were pointed out earlier; it might be the case that party programmes
are too far from the concept ‘party system polarisation’ in this particular case. The two other
measures were based on survey data: The first one used the left-right placement of party voters as
measure for total party system polarisation, whereas the second one relied on the standard
deviation of a country’s mean left-right score. Both measures are strongly correlated and produce
similar results: The more polarised a society, the stronger the attachments to political parties. As
explained earlier, the clearer or more visible the differences between political parties, the easier is
it to spot the party which represents one’s own beliefs and attitudes. Furthermore, it is more at
stake if any other than the preferred party wins the election. On the whole, contributions were
made in terms of social class, religion, political interest, cognitive mobilisation and a variety of
contextual variables (the red shapes in figure 6-1).
93

The last part of the analysis dealt with the impact of party families on party identification.
Treated as intermediate level variable, party family proved to be a rather weak predictor of
partisan strength in terms of explanatory power. However, especially communist and liberal
partisans stick out: The first ones due to their increased strength and the latter one due to their
decreased strength compared to social democratic partisans. I argued that the communist group
might be the most cohesive one and that Eastern European partisans of the former ruling
communist parties before the fall of the wall might contribute to generating this result.
Having summarised the main findings, there is still much research to be carried out on party
identification (the blue shapes in figure 6-1). Despite the discussion about the usability of party
identification as predictor of party choice, there is little doubt that the concept itself is fruitful
since it is usually connected to many other features of the political process. In addition, a
politically mature and responsible citizen is a key characteristic (or rather key precondition) of
the model of participatory democracy. To a certain degree, also elite theories of democracy
demand a certain awareness of politics by the citizens that form a society. Therefore, party
identification and its connected attributes can be regarded as important for democratic societies.
So far, we know much about which individual factors raise or decrease the probability of stating a
party identification. Moreover, there is much evidence that partisanship has declined in most
Western societies, though it is still a matter of debate how to interpret such a decline. It has been
tried to identify the reasons for the decline, among others cognitive mobilisation, modernisation,
shrinking societal milieus, and weakening ties between civil society and political parties. Some of
the proposed explanations perform well in explaining the decline; nevertheless, none of the
approaches is able to explain the decline sufficiently.
Though the thesis contributes to the nature of partisanship and answers some important questions,
it also poses new questions and possible subjects for further research. Some of the elements in
figure 6-1 were covered in the analysis, such as class, religion, political interest and contextual
variables. From a scientific point of view, there are a variety of interesting questions that raise
interest. For instance, how do personality traits influence the strength and direction of party
identifications? Gerber and his colleagues (2011) analysed the importance of extraversion,
agreeableness, conscientiousness, emotional stability and openness to experience on party
identification. They found support for their expectation that the “Big Five” personality traits do
94
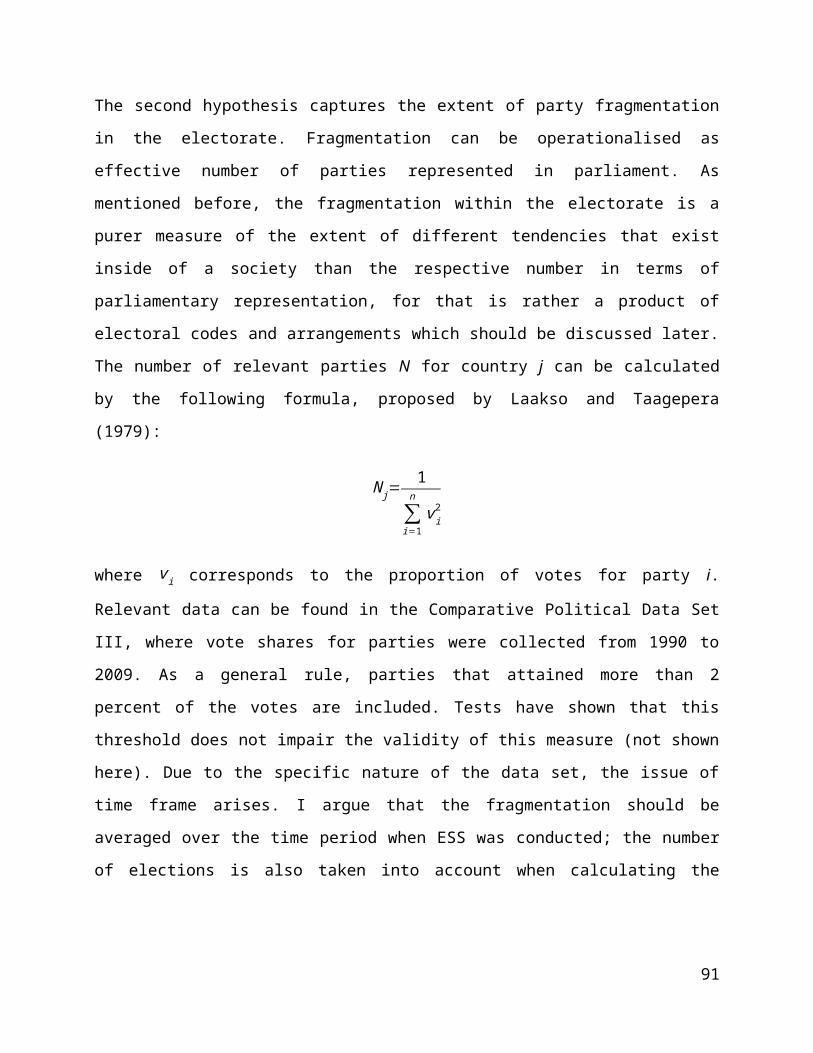
have an impact on both strength and direction of party identification in the United States. In line
with previous research, it appears appealing to compare their results across the Atlantic.
Furthermore, the financial crisis and the following debt crisis that has hit Europe might be
reflected in the strength of party identifications, especially in those countries that have been
suffering most. The new ESS round 5 has been released recently, though incomplete. It appears
very fascinating to scrutinise possible impacts on party identifications with results from the time
before the crisis started.
Figure 6-1. Driving forces for party identifications.
Source: Own illustration.
As a suggestion, further studies and surveys might consider treating the strength of party
identification as continuous variable which makes it easier to analyse it. Though ordered logistic
regression proves to be a powerful analytical tool, immediate understanding could be improved
by introducing a strength scale that ranges for example from 0 to 10, indicating increasing
partisan strength.
95
PID
Parental influences
Social class and religion
Contextual factors
Political interest and
opinions
Personality traits
Interpersonal communi-
cation
Current milieu
Current performance of parties and
the government
BibliographyAbramson, Paul R. 1976. "Generational Change and the Decline of Party Identification in
America: 1952-1974." The American Political Science Review 70:469-478.
—. 1979. "Developing Party Identification: A Further Examination of Life-Cycle, Generational,
and Period Effects." American Journal of Political Science 23:78-96.
—. 1992. "Of Time and Partisan Instability in Britain." British Journal of Political Science
22:381-395.
Albright, Jeremy J. 2009. "Does Political Knowledge Erode Party Attachments?: A Review of the
Cognitive Mobilization Thesis." Electoral Studies 28:248-260.
Armingeon, Klaus, Romana Careja, David Weisstanner, Sarah Engler, Panajotis Potolidis,
Marlène Gerber, and Philipp Leimgruber. 2011. "Comparative Political Data Set III 1990-
2009." Bern: Institute of Political Science, University of Bern.
Arzheimer, Kai. 2006. "'Dead men walking?' Party identification in Germany, 1977-2002."
Electoral Studies 25:791-807.
Bartle, John and Paolo Bellucci. 2009a. "Partisanship, social identity and individual attitudes."
Pp. 1-25 in Political Parties and Partisanship: Social Identity and Individual Attitudes,
edited by J. Bartle and P. Bellucci.
—. 2009b. "Political Parties and Partisanship: Social Identity and Individual Attitudes." London:
Routledge.
Berglund, Frode, Sören Holmberg, Hermann Schmitt, and Jacques Thomassen. 2005. "Party
Identification and Party Choice." Pp. 106-124 in The European Voter: A Comparative
Study of Modern Democracies, edited by J. Thomassen.
Braun, Michael. 2003. "Errors in Comparative Survey Research: An Overview." Pp. 137-155 in
Cross-cultural Survey Methods, edited by J. A. Harkness, F. J. R. v. d. Vijver, and P. P.
Mohler.
Budge, Ian. 2001. "Validating Party Policy Placements." British Journal of Political Science
31:179-223.
—. 2009. "Deconstructing Party Identification." Pp. 26-41 in Political Parties and Partisanship:
Social Identity and Individual Attitudes, edited by J. Bartle and P. Bellucci.
96

—. 2010. "New Introduction to the ECPR Press Edition." Pp. I-XIII in Party Identification and
Beyond: Representations of Voting and Party Competition, edited by I. Budge, I. Crewe,
and D. J. Farlie.
Budge, Ian, Ivor Crewe, and Dennis J. Farlie. 2010. "Party Identification and Beyond:
Representations of Voting and Party Competition." Colchester: ECPR Press.
Burden, Barry C. and Casey A. Klofstad. 2005. "Affect and Cognition in Party Identification."
Political Psychology 26:869-886.
Campbell, Angus, Philip E. Converse, Warren E. Miller, and Donald E. Stokes. 1960. The
American Voter. New York: Wiley.
—. 1966. "Elections and the Political Order." Pp. 385 s. New York: John Wiley.
Campbell, Angus, Gerald Gurin, and Warren E. Miller. 1954. The Voter Decides. Westport,
Conn.: Greenwood Press.
Campbell, Angus and Henry Valen. 1966. "Party Identification in Norway and the United States."
Pp. 245-268 in Elections and the Political Order, edited by A. Campbell, P. E. Converse,
W. E. Miller, and D. E. Stokes.
Clarke, Harold, David Sanders, Marianne Stewart, and Paul Whiteley. 2009. "Travel Tips for
Students of Electoral Choice: The Dynamics of Partisanship in Britain and Elsewhere."
Pp. 88-106 in Political Parties and Partisanship: Social Identity and Individual Attitudes,
edited by J. Bartle and P. Bellucci.
CMP. 2011. "Description of the Manifesto Data Set (Full Data Set)."
Converse, Philip E. 1966. "The Concept of the Normal Vote." Pp. 9-39 in Elections and the
Political Order, edited by A. Campbell, P. E. Converse, W. E. Miller, and D. E. Stokes.
—. 1976. The Dynamics of Party Support: Cohort-Analyzing Party Identification. Beverly Hills:
Sage Publications.
Converse, Philip E. and Georges Dupeux. 1966. "Polarization of the Electorate in France and the
United States." Pp. 269-291 in Elections and the Political Order, edited by A. Campbell,
P. E. Converse, W. E. Miller, and D. E. Stokes.
Dalton, Russell J. 1984. "Cognitive Mobilization and Partisan Dealignment in Advanced
Industrial Democracies." The Journal of Politics 46:264-284.
Dalton, Russell J. and Hans-Dieter Klingemann. 2007. "The Oxford Handbook of Political
Behavior." Oxford: Oxford University Press.
97
Dalton, Russell J. and Martin P. Wattenberg. 2000. Parties Without Partisans: Political Change
in Advanced Industrial Democracies. Oxford: Oxford University Press.
Deth, Jan W. van and Elinor Scarbrough. 1995. The Impact of Values, vol. 4. Oxford: Oxford
University Press.
Downs, Anthony. 1957. An Economic Theory of Democracy. New York: Harper & Row.
Enyedi, Zsolt and Bojan Todosijević. 2009. "Adversarial Politics, Civic Virtues and Partisanship
in Eastern and Western Europe." Pp. 142-161 in Political Parties and Partisanship:
Social Identity and Individual Attitudes, edited by J. Bartle and P. Bellucci.
Erikson, Robert and John H. Goldthorpe. 1992. The Constant Flux: A Study of Class Mobility in
Industrial Societies. Oxford: Clarendon Press.
ESS. 2011. "ESS Cumulative Data Set Rounds 1 to 4. Data file edition 1.0.". Bergen: Norwegian
Social Science Data Services, Norway.
Evans, Geoffrey. 2006. "The Social Bases of Political Divisions in Post-Communist Eastern
Europe." Annual Review of Sociology 32:245-270.
Falter, Jürgen, Harald Schoen, and Claudio Caballero. 2000. "Dreißig Jahre danach: Zur
Validierung des Konzepts ‚Parteiidentifikation’ in der Bundesrepublik." Pp. 235-271 in
50 Jahre Empirische Wahlforschung in Deutschland, edited by M. Klein, W. Jagodzinski,
E. Mochmann, and D. Ohr.
Falter, Jürgen W. and Harald Schoen. 2005. "Handbuch Wahlforschung." Wiesbaden: Verlag für
Sozialwissenschaften.
Fiorina, Morris P. 1981. Retrospective Voting in American National Elections. New Haven,
Conn.: Yale University Press.
Gallagher, Michael. 1991. "Proportionality, Disproportionality and Electoral Systems." Electoral
Studies 10:33-51.
Ganninger, Matthias. 2007. "Weighting in the ESS Cumulative Data Set." ZUMA, Mannheim.
Gerber, Alan S., Gregory A. Huber, David Doherty, and Conor M. Dowling. 2011. "Personality
and the Strength and Direction of Partisan Identification." Yale.
Green, Donald P., Bradley Palmquist, and Eric Schickler. 2002. Partisan Hearts and Minds:
Political Parties and The Social Identities of Voters New Haven: Yale University Press.
98

Green, Donald P. and Eric Schickler. 2009. "A Spirit Defence of Party Identification Against Its
Critics." Pp. 180-199 in Political Parties and Partisanship: Social Identity and Individual
Attitudes, edited by J. Bartle and P. Bellucci.
Greenstein, Fred I. and Nelson W. Polsby. 1975. "Handbook of Political Science." Reading,
Mass.: Addison-Wesley.
Grofman, Bernard, Frank Wayman, and Matthew Barreto. 2009. "Rethinking Partisanship: Some
Thoughts on A Unified Theory." Pp. 60-74 in Political Parties and Partisanship: Social
Identity and Individual Attitudes, edited by J. Bartle and P. Bellucci.
Harkness, Janet A., Fons J. R. van de Vijver, and Peter Ph Mohler. 2003. Cross-cultural Survey
Methods. Hoboken, N.J.: Wiley.
Heath, Anthony and Roy Pierce. 1992. "It Was Party Identification All Along: Question Order
Effects on Reports of Party Identification in Britain." Electoral Studies 11:93-105.
Hermann, Michael. 2009. Politische Weltbilder Jugendlicher in der Mediendemokratie: eine
interdisziplinäre Analyse am Beispiel von Wahlkampfkommunikation. Bad Heilbrunn:
Klinkhardt.
Holmberg, Sören. 1994. "Party Identification Compared Across the Atlantic." Pp. 93-122 in
Elections at Home and Abroad: Essays in Honor of Warren E. Miller, edited by W. E.
Miller, K. M. Jennings, and T. E. Mann.
Hox, Joop J. 2010. Multilevel Analysis: Techniques and Applications. New York: Routledge.
Huber, John D. 1989. "Values and Partisanship in Left-Right Orientations: Measuring Ideology."
European Journal of Political Research 17:599-621.
Jennings, Kent M. and Richard G. Niemi. 1976. "Attachments to the Political Parties." Pp. 332-
356 in Controversies in American Voting Behavior, edited by R. G. Niemi and H. F.
Weisberg.
Johnston, Richard. 2006. "Party Identification: Unmoved Mover or Sum of Preferences?" Annual
Review of Political Science 9:329-351.
Jowell, Roger, Max Kaase, Rory Fitzgerald, and Eva Gillian. 2007. "The European Social Survey
as a Measurement Model." in Measuring Attitudes Cross-Nationally. Lessons from the
European Social Survey., edited by R. Jowell, C. Roberts, R. Fitzgerald, and E. Gillian.
Jowell, Roger, Caroline Roberts, Rory Fitzgerald, and Eva Gillian. 2007. "Measuring Attitudes
Cross-Nationally. Lessons from the European Social Survey." Los Angeles: Sage.
99

Kaase, Max and Hans-Dieter Klingemann. 1994. "The Cumbersome Way to Partisan Orientations
in a "New" Democracy: The Case of the Former GDR." Pp. 123-156 in Elections at Home
and Abroad: Essays in Honor of Warren E. Miller, edited by W. E. Miller, K. M.
Jennings, and T. E. Mann.
Key, Valdimer O. 1958. Politics, Parties, and Pressure Groups. New York: Th.Y. Crowell.
Kitschelt, Herbert P., Zdenka Mansfeldova, Radoslav Markowski, and Gabor Toka. 1999. Post-
Communist Party Systems: Competition, Representation, and Inter-Party Cooperation.
New York: Cambridge University Press.
Kittilson, Miki C. 2007. "Research Resources in Comparative Political Behavior." Pp. 865-895 in
The Oxford Handbook of Political Behavior, edited by R. J. Dalton and H.-D.
Klingemann.
Klein, Markus, Wolfgang Jagodzinski, Ekkehard Mochmann, and Dieter Ohr. 2000. "50 Jahre
Empirische Wahlforschung in Deutschland." Wiesbaden: Westdeutscher Verlag.
Klingemann, Hans-Dieter. 1995. "Party Systems and Voter Orientations." Pp. 183-205 in Citizens
and the State, edited by H.-D. Klingemann and D. Fuchs.
—. 2005. "Political Parties and Party Systems." Pp. 22-63 in The European Voter: A
Comparative Study of Modern Democracies, edited by J. Thomassen.
Klingemann, Hans-Dieter and Dieter Fuchs. 1995. "Citizens and the State." Pp. XXI, 474 s. in
Beliefs in government, vol. Vol. 1. Oxford: Oxford University Press.
Knutsen, Oddbjørn. 1995. "Left-Right Materialist Value Orientations." Pp. 160-196 in The
Impact of Values, edited by J. W. Deth and E. Scarbrough.
Kroh, Martin and Peter Selb. 2009. "Individual and Contextual Origins of Durable Partisanship."
Pp. 107-120 in Political Parties and Partisanship: Social Identity and Individual
Attitudes, edited by J. Bartle and P. Bellucci.
Laakso, Markku and Rein Taagepera. 1979. "“Effective” Number of Parties." Comparative
Political Studies 12:3-27.
Lane, Jan-Erik and Svante Ersson. 1999. Politics and Society in Western Europe. London: Sage.
Lazarsfeld, Paul F., Bernard Berelson, and Hazel Gaudet. 1948. The People's Choice: How the
Voter Makes Up His Mind in a Presidental Campaign. New York: Columbia University
Press.
100
Leiulfsrud, Håkon, Ivano Bison, and Heidi Jensberg. 2005. "Social Class in Europe. European
Social Survey 2002/3." NTNU Social Research Ltd., Trondheim.
Lewis-Beck, Michael S., William G. Jacoby, Helmuth Norpoth, and Herbert F. Weisberg. 2008.
The American Voter Revisited. Ann Arbor: University of Michigan Press.
Lijphart, Arend. 1999. Patterns of Democracy: Government Forms and Performance in Thirty-
six Countries. New Haven, Conn.: Yale University Press.
Lindström, Ulf. 2001. "From Post-communism to Neo-communism? The Reconstitution of the
Party Systems of East-Central Europe." Pp. 216-237 in Party Systems and Voter
Alignments Revisited, edited by L. Karvonen and S. Kuhnle.
Lipset, Seymour Martin. 2001. "Cleavages, Parties and Democracy." Pp. 3-9 in Party Systems
and Voter Alignments Revisited, edited by L. Karvonen and S. Kuhnle.
Mair, Peter and Cas Mudde. 1998. "The Party Family and Its Study." Annual Review of Political
Science 1:211-229.
Miller, Arthur H. and Thomas F. Klobucar. 2000. "The Development of Party Identification in
Post-Soviet Societies." American Journal of Political Science 44:667-686.
Miller, Arthur H. and Ola Listhaug. 1990. "Political Parties and Confidence in Government: A
Comparison of Norway, Sweden and the United States." British Journal of Political
Science 20:357-386.
Miller, Warren E. 2010. "The Cross-national Use of Party Identification as a Stimulus to Political
Inquiry." Pp. 21-31 in Party Identification and Beyond: Representations of Voting and
Party Competition, edited by I. Budge, I. Crewe, and D. J. Farlie.
Miller, Warren E. and J. Merrill Shanks. 1996. The New American Voter. Cambridge, Mass.:
Harvard University Press.
Mößner, Alexandra. 2006. "Jung und ungebunden? Parteiidentifikation von jungen
Erwachsenen." Pp. 337-357 in Jugend und Politik, edited by R. B. v. Deth.
Niemi, Richard G. 1974. "The Politics of Future Citizens." San Francisco: Jossey-Bass.
Niemi, Richard G. and Herbert F. Weisberg. 1976. "Controversies in American Voting
Behavior." San Francisco: Freeman.
Norpoth, Helmut. 1984. "The Making of a More Partisan Electorate in West Germany." British
Journal of Political Science 14:53-71.
101

Norris, Pippa. 2004. Electoral Engineering: Voting Rules and Political Behavior. Cambridge:
Cambridge University Press.
Oskarson, Maria. 2005. "Social Structure and Party Choice." in The European Voter: A
Comparative Study of Modern Democracies, edited by J. Thomassen.
Paskeviciute, Aida. 2009. "Partisanship and System Support in Established and New
Democracies." Pp. 121-141 in Political Parties and Partisanship: Social Identity and
Individual Attitudes, edited by J. Bartle and P. Bellucci.
Petrocik, John R. 1974. "An Analysis of the Intransitivities in the Index of Party Identification."
Political Methodology 31:31-47.
Putnam, Robert D. 2000. Bowling Alone. The Collapse and Revival of American Community.
New York: Simon and Schuster.
Rabe-Hesketh, Sophia and Anders Skrondal. 2008. Multilevel and Longitudinal Modeling Using
Stata. College Station, Tex.: Stata Press.
Rabe-Hesketh, Sophia, Anders Skrondal, and Andrew Pickles. 2004. "Generalized Multilevel
Structural Equation Modeling." Psychometrika 69:167-190.
—. 2005. "Maximum Likelihood Estimation of Limited and Discrete Dependent Variable Models
With Nested Random Effects." Journal of Econometrics 128:301-323.
Raudenbush, Stephen W. and Anthony S. Bryk. 2002. Hierarchical Linear Models: Applications
and Data Analysis Methods. Thousand Oaks: Sage Publications.
Rokkan, Stein, Angus Campbell, Per Torsvik, and Henry Valen. 1970. Citizens, Elections,
Parties: Approaches to the Comparative Study of the Processes of Development. Oslo:
Universitetsforlaget.
Rokkan, Stein and Seymour Martin Lipset. 1967. Party Systems and Voter Alignments: Cross-
National Perspectives. New York: Free Press.
Roller, Edeltraud, Frank Brettschneider, and Jan W. Deth. 2006. Jugend und Politik: "voll
normal!": der Beitrag der politischen Soziologie zur Jugendforschung. Wiesbaden: VS
Verlag für Sozialwissenschaften.
Rose, Richard and Ian McAllister. 1990. The Loyalties of Voters: A Lifetime Learning Model.
London: Sage.
Rose, Richard and William Mishler. 1998. "Negative and Positive Party Identification in Post-
Communist Countries." Electoral Studies 17:217-234.
102

Sartori, Giovanni. 2005. Parties and Party Systems: A Framework for Analysis. Colchester:
ECPR.
Schmitt, Hermann. 2002. "Multiple Party Identifications." in Comparative Study of Electoral
Systems. WZB Berlin.
—. 2009. "Partisanship in Nine Western Democracies: Causes and Consequences." Pp. 75-87 in
Political Parties and Partisanship: Social Identity and Individual Attitudes, edited by J.
Bartle and P. Bellucci.
Schmitt, Hermann and Sören Holmberg. 1995. "Political Parties in Decline?" Pp. 95-133 in
Citizens and the State, edited by H.-D. Klingemann and D. Fuchs.
Schoen, Harald and Cornelia Weins. 2005. "Der sozialpsychologische Ansatz zur Erklärung von
Wahlverhalten." Pp. 187-242 in Handbuch Wahlforschung, edited by J. Falter and H.
Schoen.
Sears, David O. 1975. "Political Socialization." Pp. 93-153 in Handbook of Political Science, vol.
2, edited by F. I. Greenstein and N. W. Polsby.
Shively, W. Phillips. 1979. "The Development of Party Identification among Adults: Exploration
of a Functional Model." The American Political Science Review 73:1039-1054.
Snijders, Tom A. B. and Roel J. Bosker. 1999. Multilevel Analysis: An Introduction to Basic and
Advanced Multilevel Modeling. London: Sage.
Stäubert, Alexander A. 2010. "The Inheritance of Party Identification. A Study of Young Adults
aged 18 to 21." Paper submitted at University of Oslo.
Söderlund, Peter and Elina Kestilä-Kekkonen. 2009. "Dark Side of Party Identification? An
Empirical Study of Political Trust among Radical Right-Wing Voters." Journal of
Elections, Public Opinion & Parties 19:159-181.
Taylor, Michael and V. M. Herman. 1971. "Party Systems and Government Stability." The
American Political Science Review 65:28-37.
Thomassen, Jacques. 1976. "Party identification as a cross-national concept: its meaning in the
Netherlands." Acta Politica:416-435.
—. 2005a. "The European Voter: A Comparative Study of Modern Democracies." Oxford:
Oxford University Press.
—. 2005b. "Introduction." Pp. 1-21 in The European Voter: A Comparative Study of Modern
Democracies, edited by J. Thomassen.
103

—. 2005c. "Modernization or Politics?" Pp. 254-266 in The European Voter: A Comparative
Study of Modern Democracies, edited by J. Thomassen.
Thomassen, Jacques and Martin Rosema. 2009. "Party Identification Revisited." Pp. 42-59 in
Political Parties and Partisanship: Social Identity and Individual Attitudes, edited by J.
Bartle and P. Bellucci.
Vaillancourt, Pauline M. and Richard G. Niemi. 1974. "Children's Party Choices." Pp. 126-149 in
The Politics of Future Citizens, edited by R. G. Niemi.
Volkens, Andrea, Onawa Lacewell, Pola Lehmann, Sven Regel, Henrike Schultze, and Annika
Werner. 2011. "The Manifesto Data Collection. Manifesto Project
(MRG/CMP/MARPOR)." Berlin: Wissenschaftszentrum Berlin für Sozialforschung
(WZB).
Werner, Annika, Onawa Lacewell, and Andrea Volkens. 2010. "Manifesto Coding Instructions
(4th fully revised edition)."
Zuckerman, Alan S., Josip Dasovic, and Jennifer Fitzgerald. 2007. Partisan Families: The Social
Logic of Bounded Partisanship in Germany and Britain. Cambridge: Cambridge
University Press.
104
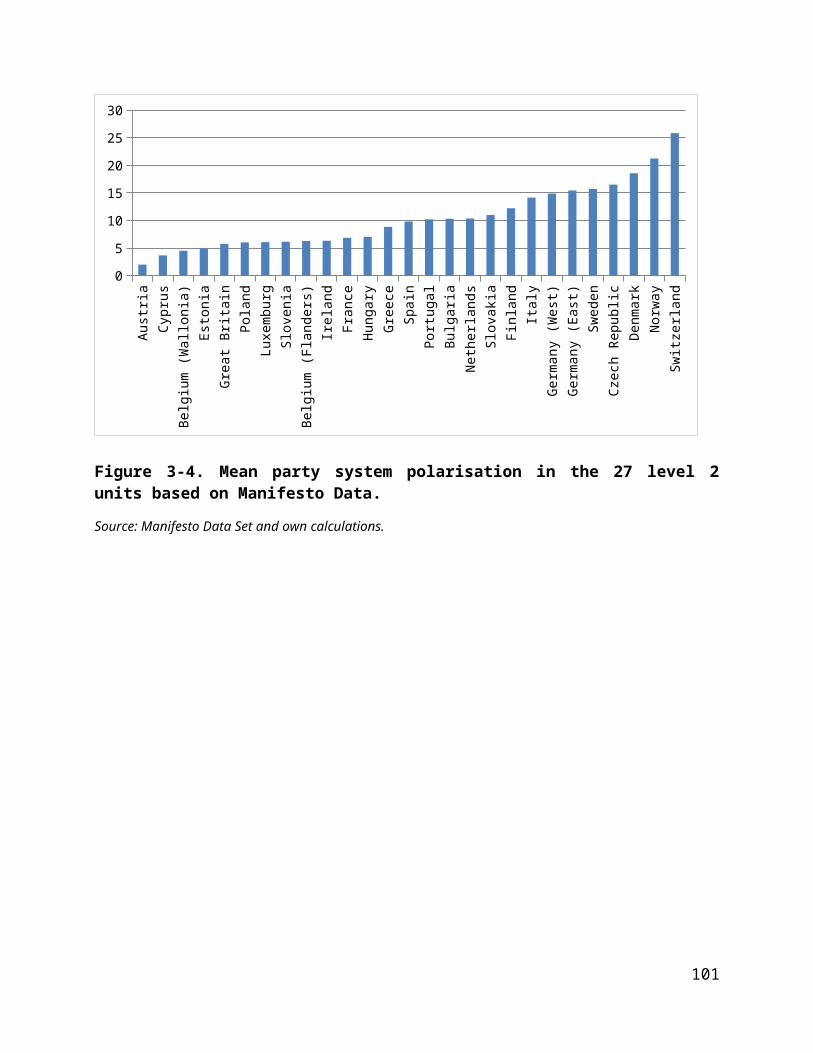
Appendix
A. Table of Countries and Country Codes
Country code Country Geographical/Cultural belonging
AT Austria Western Europe
BE (F) Belgium (Flanders) Western Europe
BE (W) Belgium (Wallonia) Western Europe
BG Bulgaria Eastern Europe
CH Switzerland Western Europe
CY Cyprus Southern Europe
CZ Czech Republic Eastern Europe
DE (E) Germany (East) Eastern Europe
DE (W) Germany (West) Western Europe
DK Denmark Nordic
EE Estonia Eastern Europe
ES Spain Southern Europe
FI Finland Nordic
FR France Western Europe
GB United Kingdom Atlantic Europe
GR Greece Southern Europe
HU Hungary Eastern Europe
IE Ireland Atlantic Europe
IT Italy Southern Europe
LU Luxemburg Western Europe
NL Netherlands Western Europe
NO Norway Nordic
PL Poland Eastern Europe
PT Portugal Southern Europe
SE Sweden Nordic
SI Slovenia Eastern Europe
SK Slovakia Eastern Europe
105

B. Disproportionality and Fragmentation Data for Germany and Belgium
GERMANYa BELGIUMb
WEST EAST FLANDERS WALLONIAEff_N Disp_G Eff_N Disp_G Eff_N Disp_G Eff_N Disp_G
2002 3,03 1,99 3,73 12,51 5,82 2,57 6,11 3,992003 3,03 1,99 3,73 12,51 4,97 5,44 5,34 7,012004 3,03 1,99 3,73 12,51 4,97 5,44 5,34 7,012005 3,49 1,08 4,41 3,95 4,97 5,44 5,34 7,012006 3,49 1,08 4,41 3,95 4,97 5,44 5,34 7,012007 3,49 1,08 4,41 3,95 4,98 3,79 5,42 5,272008 3,49 1,08 4,41 3,95 4,98 3,79 5,42 5,272009 4,46 3,52 4,74 5,08 4,98 3,79 5,42 5,27
a: Data used to generate the effective number of electoral parties and disproportionality for East and West Germany can be obtained online at http://www.bundeswahlleiter.de/en/bundestagswahlen/fruehere_bundestagswahlen/.
b: Data used to generate the effective number of electoral parties and disproportionality for East and West Germany can be obtained online at http://electionresources.org/be/.
106

C. Party Family Classification
Freq.
Code Label
COM LS SO EC LI
COREL R REGAGR
SI
The Nordic countriesprtclDKDENMARK 1242 1 Socialdemokraterne - the
Danish social democtrats X
300 2 Det Radikale Venstre - Danish Social-Liberal Party X
338 3 Det Konservative Folkeparti - Conservative X
555 4 SF- Socialistisk Folkeparti - the Socialist People's Party X
303 5 Dansk Folkeparti - Danish peoples party X
62 6 Kristendemokraterne - Christian democtrats X
1199 7 Venstre, Danmarks Liberale Parti - Venstre X
103 8 Enhedslisten, De Rød-Grønne - The Red-Green Alliance
X
47 20 OtherprtclFIFINLAND 883 1 The National Coalition Party X
208 2 The Swedish People´s Party (SPP) X
9 3 Liberals, (The liberal party of Finland) X
947 4 The Centre Party X90 5 TRUE Finns X
177 6 Christian Democrats X532 7 The Green League X
1056 8 Finnish Social Democratic Party X
274 9 The Left Alliance X11 10 Communist Parties X
107
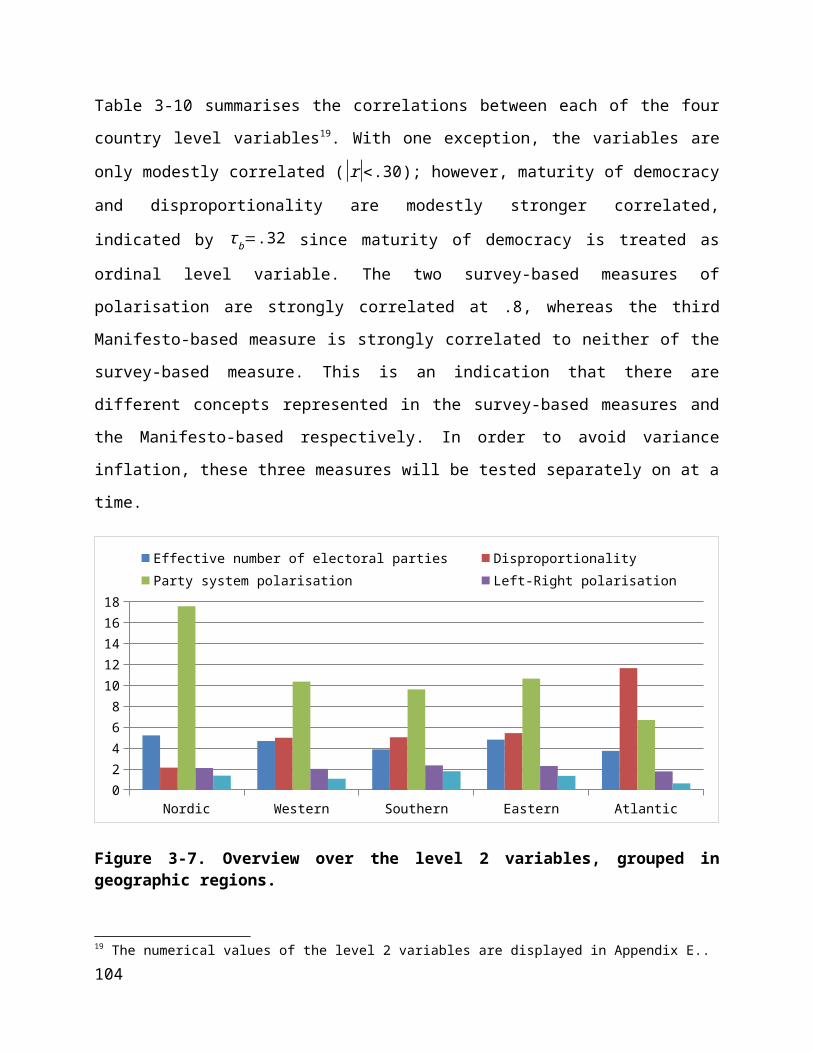
Freq.
Code Label
COM LS SO EC LI
COREL R REGAGR
SI
31 20 OtherprtclNONORWAY 55 1 Red Electoral Alliance (RV) X
573 2 Socialist left party (SV) X1337 3 Labour Party (A) X
155 4 Liberal Party (V) X326 5 Christian Democratic Party
(Krf) X
247 6 Centre Party (Sp) X772 7 Conservative Party (H) X839 8 Progress Party (FrP) X
40 20 OtherprtclSESWEDEN 281 1 Centre Party X
477 2 Liberals X264 3 Christian Democrats X315 4 Green Party X
1094 5 Conservative X1934 6 Social Democrats X
411 7 Left X115 20 Other
Central and Western EuropeprtclATAUSTRIA 1017 1 SPÖ X
1036 2 ÖVP X180 3 FPÖ X
13 4 BZÖ X564 5 GRÜNE X
12 6 LIF X7 7 KPÖ X
15 20 OtherprtclBEBELGIUM 212 1 Groen! XFLANDERS 659 2 CD&V + N-VA X
25 4 Lijst Dedecker (NOW LDD) X428 5 SP.A. + Vlaams
progressievenX
108
Freq.
Code Label
COM LS SO EC LI
COREL R REGAGR
SI
237 7 Vlaams Belang X407 8 Open VLD + Vivant X
97 20 Other
BELGIUM 225 9 CDH XWALLONIA 232 10 Ecolo X
16 11 Front National X414 12 MR X496 13 PS X
27 20 OtherprtclFRFRANCE 40 1 CPNT (Chasse, Pêche,
Nature et Traditions) X
146 2 FN (Front National) X88 3 LCR (Ligue Communiste
Révolutionnaire) X
57 4 LO (Lutte Ouvrière) X51 5 MPF (Mouvement pour la
France) X
186 6 PC (Parti Communiste) X21 7 Nouveau Centre X17 8 PRG (Parti Radical de
Gauche) X
1369 9 PS (Parti Socialiste) X1036 10 UMP (Union pour la
Majorité Présidentielle) X
300 11 UDF-MoDem (Mouvement Democrate) X
237 12 Les Verts X62 13 Autres mouvements
écologistes X
22 14 MNR (Mouvement national républicain) X
44 20 OthersprtclDEGERMANY 1598 1 Social Democratic Party
(SPD) X
WEST 1733 2 Christian Democratic Union X
109

Freq.
Code Label
COM LS SO EC LI
COREL R REGAGR
SI
(CDU/CSU)695 3 Green Party (Bündnis90/Die
Grünen) X
246 4 Liberal Democratic Party (FDP) X
473 5 The Left Party.Party of Democratic Socialism (Linkspartei.PDS)
X
43 6 Republican Party (Republikaner) X
30 7 National Democratic Party/German Peoples Union (NPD/DVU)
X
65 20 Other PartyprtclLULUXEMBURG 515 1 Parti Chrétien Social (PCS) X
336 2 Parti Socialiste Ouvrier Luxembourgeois (PSOL) X
194 3 Parti Démocrate (PD) X162 4 Les Verts (GRENG) X
28 5 La Gauche (LENK) X49 6 Comité d'action pour la
Démocratie et Justice sociale (=ADR)
X
8 20 AutresprtclNLNETHERLANDS
1124 1 Christian Democratic Party X
1041 2 Labour Party X714 3 Party for Freedom and
Democracy X
141 4 List Pim Fortuyn X193 5 Democrats `66 X322 6 Green Left X538 7 Socialistic Party X178 8 Christian Union X
73 9 Social Reformed Party X56 10 PVV (List Wilders) X
110

Freq.
Code Label
COM LS SO EC LI
COREL R REGAGR
SI
28 11 Party for the Animals X11 12 TON (List Verdonk) X70 20 Other
prtclCHSWITZERLAND 643 1 Radicals X
444 2 Christian democrats X1273 3 Socialist party X
961 4 Swiss people party X111 5 Liberal party (MERGED
WITH 1 in 2009) X
19 6 Christian-social party X37 7 Swiss labour party X
373 8 Green party X36 9 Green liberal party X36 10 Federal Democratic Union X82 11 Evangelical People's Party X62 20 Other party
Eastern EuropeprtclBGBULGARIA 725 1 BSP X
315 2 GERB X209 3 DPS (Turkish minority) X
65 4 DSB X18 5 BZNS-NS X44 6 NDSV X
193 7 Ataka X133 8 SDS X
49 20 OtherprtclCZCZECH REPUBLIC
393 1 KSCM X
681 2 CSSD X88 3 SZ X
233 4 KDU-CSL X782 5 ODS X
37 6 Association of Independents X42 7 US Freedom Union X
111

Freq.
Code Label
COM LS SO EC LI
COREL R REGAGR
SI
95 20 OtherprtclEEESTONIA 310 1 Pro Patria and Res Publica
Union X
751 2 The Estonian Centre Party X428 3 Estonian Reform Party X104 4 The People's Union of
Estonia X
193 5 The Social Democratic Party X73 6 Estonian Greens X65 20 Other
prtclDEGERMANY 1 Social Democratic Party
(SPD) X
EAST 2 Christian Democratic Union (CDU/CSU) X
3 Green Party (Bündnis90/Die Grünen) X
4 Liberal Democratic Party (FDP) X
5 The Left Party.Party of Democratic Socialism (Linkspartei.PDS)
X
6 Republican Party (Republikaner) X
7 National Democratic Party/German Peoples Union (NPD/DVU)
X
20 Other PartyprtclHUHUNGARY 1373 1 Fidesz - KDNP (coded in a
single category ESS r4) X
73 2 MDF X56 3 MIÉP/Jobbik X
1120 4 MSZP X32 5 Munkáspárt X
121 6 SZDSZ X33 20 Other
112

Freq.
Code Label
COM LS SO EC LI
COREL R REGAGR
SI
prtclPLPOLAND 136 1 League of Polish Families X
495 2 Civic Platform X56 3 Democratic Party X
125 4 Polish Peasants Party X349 5 Law and Justice X172 6 Self-defence X
30 7 Social Democratic Party of Poland X
383 8 Democratic Left Alliance X43 20 Other
prtclSKSLOVAKIA 229 1 Movement for a Democratic
Slovakia (HZDS) X
317 2 Slovak Democratic Christian Union (SDKU) X
921 3 SMER X195 4 Party of Hungarian Coalition
(SMK) X
188 5 Christian Democratic Movement (KDH) X
173 6 Slovak National Party (SNS) X26 7 KSS Communist Party of
Slovakia X
33 8 ANO New Citizen's Alliance X58 20 Other
prtclSISLOVENIA 100 1 Democratic Party of
Pensioners of Slovenia - DESUS
X
412 2 Liberal Democracy of Slovenia - LDS X
18 3 Slovene Youth Party - SMS X146 4 New Slovenia - Christian
Peoples Party - NSi X
504 5 Slovenian Democratic Party - SDS X
108 6 Slovene Peoples Party - SLS X
113

Freq.
Code Label
COM LS SO EC LI
COREL R REGAGR
SI
127 7 Slovene National Party - SNS X379 8 Social Democrats - SD X
51 9 ZARES - New Politics X60 20 Other
Southern EuropeprtclCYCYPRUS 483 1 Progressive Party of
Working People (AKEL) X
291 2 Demokrat Party (DIKO) X452 3 Democratic Rally (DISY) X
50 4 European Party (EVROKO) X18 5 The Cyprus Green Party X
8 6 United Democrats (EDI) X113 7 Social Democrats (KS EDEK) X
prtclGRGREECE 1401 1 Panhellenic Socialist
Movement - PASOK X
1424 2 New Democracy - ND X287 3 Communist Party - KKE X171 4 Coalition of the Radical Left -
SYRIZA X
49 5 Popular Orthodox Rally - LAOS X
19 6 Greens X25 20 Other
prtclITITALY 295 1 Democratici di sinistra X
95 2 La Margherita X25 3 Comunisti Italiani X34 4 Verdi e SDI (Girasole) X97 5 Rifondazione Comunista X
242 6 Forza Italia X139 7 Alleanza Nazionale X
38 8 CCD-CDU X37 9 Lega Nord X12 10 Nuovo PSI X10 11 Lista di Pietro X
114
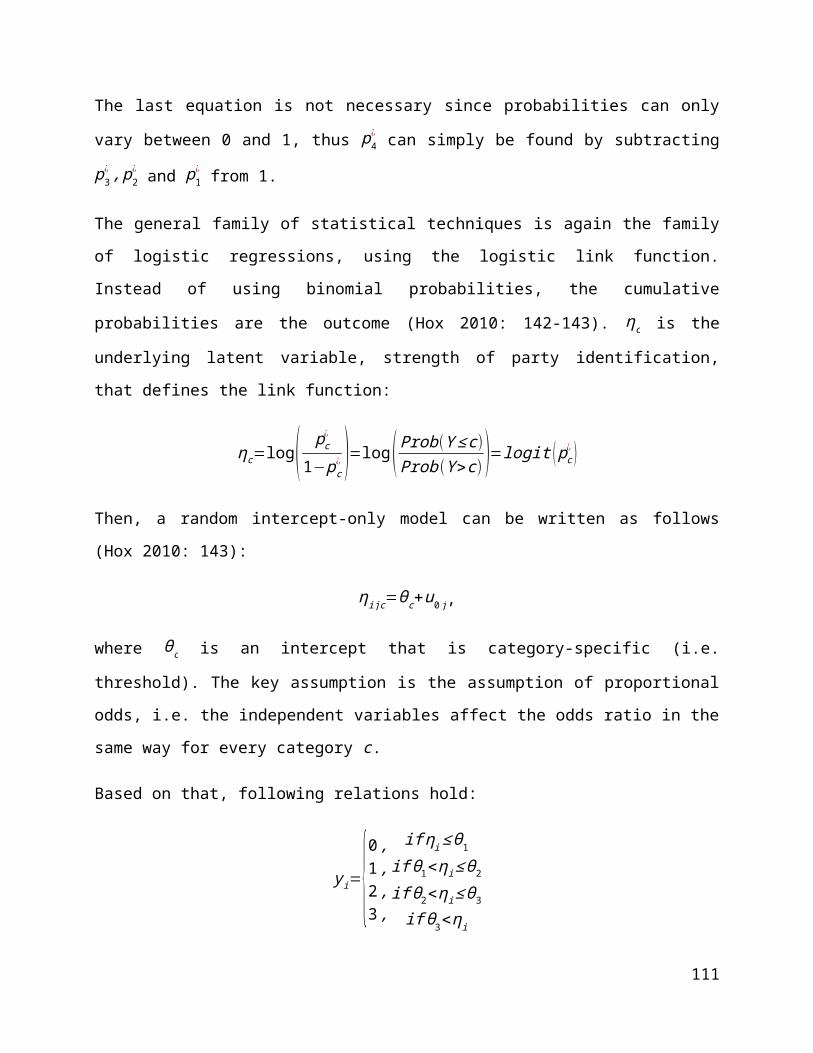
Freq.
Code Label
COM LS SO EC LI
COREL R REGAGR
SI
55 20 OtherprtclPTPORTUGAL 181 1 BE - Bloco de Esquerda X
110 2 CDS/PP - Centro Democrático Social/Partido Popular
X
306 3 PCP-PEV - Partido Comunista Português - Partido Ecologista o
X
23 4 PCTP-MRPP - Partido Comunista dos Trabalhadores Portugueses
X
1277 5 PSD - Partido Social Democrata X
1705 6 PS - Partido Socialista X17 20 Other
prtclESSPAIN 1101 1 Partido Popular X
1605 2 Partido Socialista Obrero Español (PSOE) X
216 3 Izquierda Unida (IU) X133 4 Convergència i Unió (CiU) X
71 5 Esquerra Repubicana de Catalunya (ERC) X
66 6 Partido Nacionalista Vasco (PNV) X
52 7 Bloque Nacionalista Galego (BNG) X
140 20 Other
Atlantic EuropeprtclIEIRELAND 1638 1 Fianna Fail X
888 2 Fine Gael X387 3 Labour X
65 4 Progressive Democrats X177 5 Green Party X183 6 Sinn Fein X
33 20 Other
115

Freq.
Code Label
COM LS SO EC LI
COREL R REGAGR
SI
prtclGBUNITED KINGDOM
1292 1 Conservative X
1779 2 Labour X589 3 Liberal Democrat X
91 4 Scottish National Party X35 5 Plaid Cymru X
146 6 Green Party X17 7 British National Party X
5 8 UK Independence Party X88 20 Other
Label MeaningCOM Communist
LS Left-SocialistSO Social democraticEC EcologicalLI Liberal
CO ConservativeREL ReligiousR Radical right
REG Regional/EthnicalAGR Agrarian/Centre
SI Single issue
116

D. Manifesto Polarisation Data
cnum 2002 2003 2004 2005 2006 2007 2008 2009 ∅ Country
1 0.97 0.97 0.97 0.97 4.29 4.29 6.44 6.44 2.08 Austria
2 4.73 6.90 6.90 6.90 6.90 X X X 6.47 Belgium (Flanders)
3 3.78 6.45 6.45 6.45 6.45 X X X 5.92 Belgium (Wallonia)
4 9.75 9.75 9.75 12.87 12.87 12.87 12.87 6.68 11.32 Bulgaria5 22.21 28.25 28.25 28.25 28.25 X X X 27.04 Switzerland6 4.05 4.05 4.05 4.05 X X X X 4.05 Cyprus
7 20.24 20.24 20.24 20.24 15.03 15.03 15.03 15.03 18.50 Czech Republic
8 15.53 15.53 15.53 17.46 17.46 17.46 17.46 13.79 16.28 Germany (East)
9 16.63 16.63 16.63 15.05 15.05 15.05 15.05 13.02 15.39 Germany (West)
10 24.21 24.21 24.21 22.09 22.09 11.28 11.28 11.28 18.83 Denmark11 11.53 5.24 5.24 5.24 5.24 X X X 5.24 Estonia12 12.67 12.67 9.73 9.73 9.73 9.73 8.85 8.85 10.25 Spain13 14.16 15.37 15.37 15.37 15.37 8.36 8.36 8.36 12.59 Finland14 9.14 9.14 9.14 9.14 9.14 8.68 8.68 8.68 8.97 France15 5.14 5.14 5.14 7.03 7.03 7.03 7.03 7.03 6.32 Great Britain16 9.28 9.28 X X X X X X 9.28 Greece17 9.01 9.01 9.01 9.01 6.52 6.52 6.52 6.52 7.76 Hungary18 9.37 9.37 9.37 9.37 9.37 3.23 3.23 3.23 7.07 Ireland19 14.78 14.78 14.78 14.78 32.91 32.91 32.91 32.91 14.78 Italy20 7.64 7.64 5.09 5.09 5.09 5.09 5.09 9.11 6.37 Luxemburg21 9.66 10.96 10.96 10.96 X X X X 10.63 Netherlands22 22.46 22.46 22.46 X X X X X 22.46 Norway23 12.82 12.82 12.82 2.42 2.42 3.19 3.19 3.19 6.61 Poland24 7.99 7.99 7.99 10.26 10.26 10.26 10.26 12.81 9.73 Portugal25 18.81 18.81 18.81 18.81 13.97 13.97 13.97 13.97 16.39 Sweden26 8.38 8.38 5.94 5.94 5.94 5.94 6.37 6.37 6.66 Slovenia27 12.67 12.67 12.67 12.67 12.87 12.87 12.87 12.87 12.80 Slovakia
X – No data availableRed cell values are available data that was not taken into account since the country did not participate in the respective round. E.g., Italy did not participate in rounds 3 and 4.
117
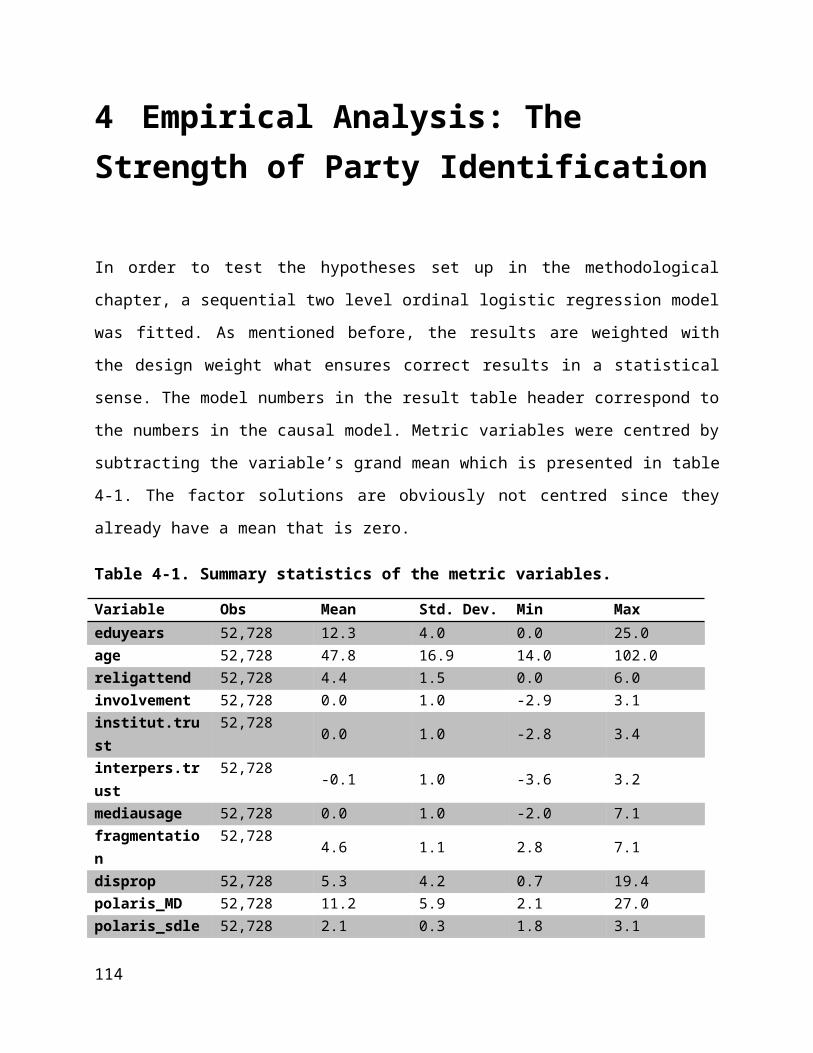
118

E. Overview over the Numerical Values of the Level 2 Variables
cnum Label Country fragmen-tation
disprop
polaris_MD
polaris_survey
polaris_sdleftright
matdem
1 AT Austria 3.25 1.87 2.08 0.95 1.97 12 BEF Belgium
(Flanders)5.08 4.47 6.47 0.65 1.95 1
3 BEW Belgium (Wallonia)
5.46 5.98 5.92 1.02 2.04 1
4 BG Bulgaria 5.00 4.38 11.32 1.97 2.70 35 CH Switzerland 5.59 2.37 27.04 1.35 1.90 16 CY Cyprus 4.31 1.77 4.05 2.30 3.05 17 CZ Czech Republic 4.37 5.62 18.50 1.89 2.44 38 DEE Germany (East) 4.20 7.30 16.28 0.85 1.86 39 DEW Germany
(West)3.44 1.73 15.39 0.93 1.79 1
10 DK Denmark 5.09 0.73 18.83 1.24 2.07 111 EE Estonia 5.23 3.38 5.24 0.72 1.96 312 ES Spain 3.01 5.29 10.25 1.43 2.02 213 FI Finland 5.76 3.08 12.59 1.31 2.02 114 FR France 4.69 19.44 8.97 1.61 2.34 115 GB Great Britain 3.50 17.03 6.32 0.77 1.79 116 GR Greece 2.81 7.06 9.28 1.69 2.20 217 HU Hungary 2.77 7.53 7.76 1.78 2.42 318 IE Ireland 4.00 6.28 7.07 0.48 1.78 119 IT Italy 6.07 5.55 14.78 2.03 2.43 120 LU Luxemburg 4.42 3.19 6.37 0.92 2.15 121 NL Netherlands 5.55 0.89 10.63 1.19 2.02 122 NO Norway 5.45 2.72 22.46 1.32 2.05 123 PL Poland 4.40 5.71 6.61 1.21 2.30 324 PT Portugal 3.23 5.53 9.73 1.49 2.07 225 SE Sweden 4.59 2.02 16.39 1.61 2.29 126 SI Slovenia 5.51 3.55 6.66 1.24 2.36 327 SK Slovakia 7.05 6.06 12.80 1.10 2.34 3
Grand Mean 4.59 5.20 11.10 1.30 2.16 XMode X X X X X 1
119
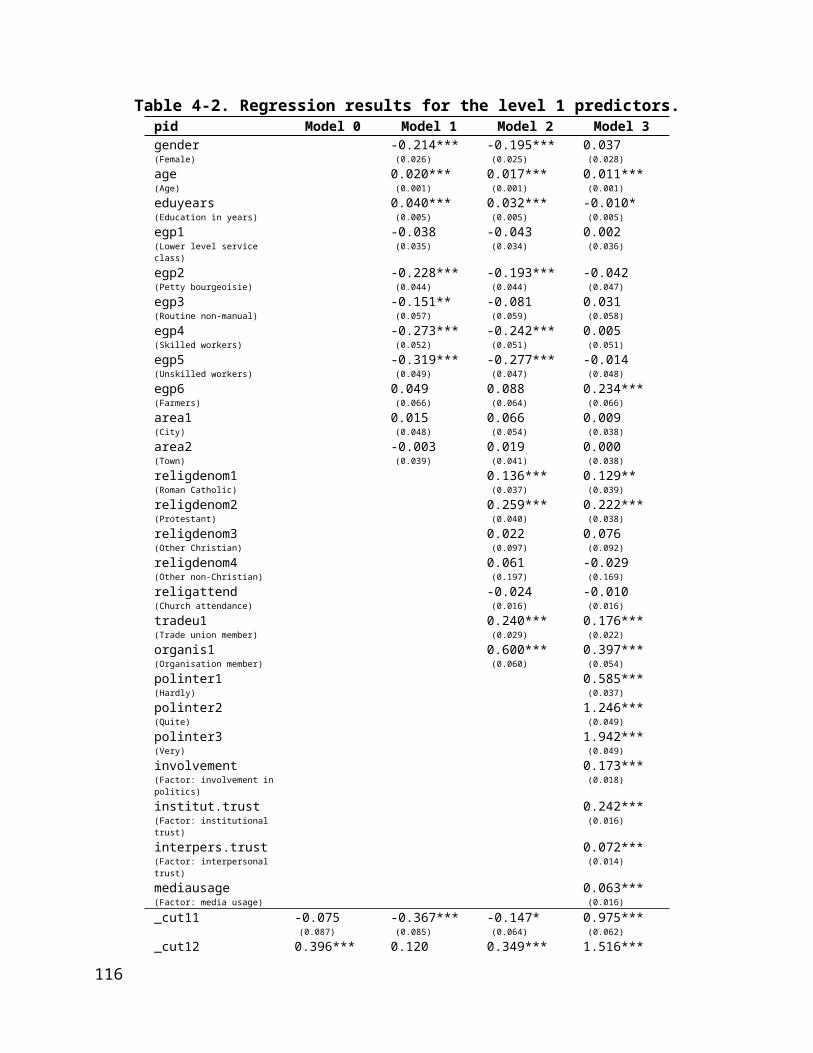
F. Variable CodingNominal/ordinal variables:
code Class
(egp)
Religious denomination
(reld)
Making mind up about political issues(poldcs)
Seeing politics as complicated matter(polcmpl)
Worked in organisation
(org)
Gender
(gndr)
Trade Union member(tradeu)
Area of residence
(larea)
Interest in politics
(polinter)0 I Higher
level service class
No religion Very difficult Frequently No Male No City Not at all
1 II Lower level service class
Roman Catholic Difficult Regularly Yes Female Yes Town Hardly
2 IIIa + IIIb Routine non-manual
Protestant Neither/nor Occasionally Country-side
Quite
3 IVa + IVb Petty bourgeoisie
Other Christian Easy Seldom Very
4 V + VI Skilled workers
Other non-Christian
Very easy Never
5 VIIa + VIIb Unskilled workers
6 IVc Farmers
Interval/ratio scaled variables:
Label Meaning
120
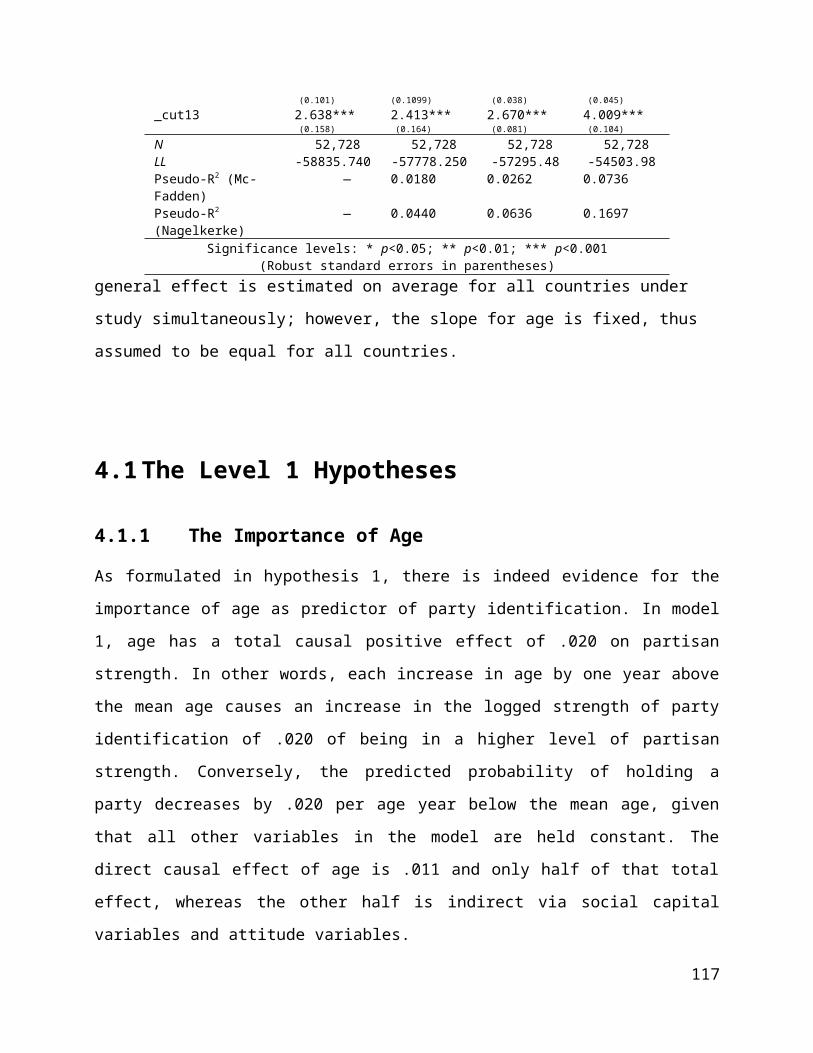
AGE Biological age
EDUYRS Years of fulltime education completed (0-25)
RLGATND Attending religious services, treated as interval level variable; original categories: Every day – More than once a week – Once a
week – At least once a month – Only on special holy days – Less often – Never
TVPOL TV use for political issues, increasing (0-8, half-hour difference)
RDPOL Radio use for political issues, increasing (0-8, half-hour difference)
POLNEWS Newspaper use for political issues, increasing (0-8, half-hour difference)
TRSTPRL Trust in the parliament, increasing trust (0-10)
TRSTPLT Trust in politicians, increasing trust (0-10)
TRSTLGL Trust in the legal system, increasing trust (0-10)
PPLFAIR Most people try to be fair, increasing agreement (0-10)
PPLHLP Most people try to help, increasing agreement (0-10)
PPLTRST Most people can be trusted, increasing agreement (0-10)
121
G. Full Regression Models
pid Model 0 Model 1 Model 2 Model 3 Model 4a Model 4b Model 4cLe
vel 1
gender -0.214*** -0.195*** 0.037 0.035 0.035 0.035(Female) (0.026) (0.025) (0.028) (0.027) (0.028) (0.028)
age 0.020*** 0.017*** 0.011*** 0.010*** 0.010*** 0.010***(Age) (0.001) (0.001) (0.001) (0.001) (0.001) (0.001)
eduyears 0.040*** 0.032*** -0.010* -0.010* -0.010* -0.010*(Education in years) (0.005) (0.005) (0.005) (0.005) (0.005) (0.005)
egp1 -0.038 -0.043 0.002 0.001 0.001 0.001(Lower level service class) (0.035) (0.034) (0.036) (0.036) (0.036) (0.036)
egp2 -0.228*** -0.193*** -0.042 -0.044 -0.045 -0.044(Petty bourgeoisie) (0.044) (0.044) (0.047) (0.047) (0.047) (0.046)
egp3 -0.151** -0.081 0.031 0.032 0.032 0.032(Routine non-manual) (0.057) (0.059) (0.058) (0.057) (0.058) (0.058)
egp4 -0.273*** -0.242*** 0.005 0.003 0.002 0.003(Skilled workers) (0.052) (0.051) (0.051) (0.048) (0.051) (0.049)
egp5 -0.319*** -0.277*** -0.014 -0.018 -0.018 -0.018(Unskilled workers) (0.049) (0.047) (0.048) (0.047) (0.047) (0.047)
egp6 0.049 0.088 0.234*** 0.237*** 0.236*** 0.235***(Farmers) (0.066) (0.064) (0.066) (0.067) (0.067) (0.067)
area1 0.015 0.066 0.009 0.009 0.009 0.009(City) (0.048) (0.054) (0.038) (0.044) (0.045) (0.045)
area2 -0.003 0.019 0.000 0.001 0.000 0.000(Town) (0.039) (0.041) (0.038) (0.038) (0.038) (0.038)
religdenom1 0.136*** 0.129** 0.126*** 0.127** 0.128**(Roman Catholic) (0.037) (0.039) (0.035) (0.038) (0.037)
religdenom2 0.259*** 0.222*** 0.223*** 0.221*** 0.220***(Protestant) (0.040) (0.038) (0.038) (0.038) (0.038)
religdenom3 0.022 0.076 0.068 0.067 0.067(Other Christian) (0.097) (0.092) (0.094) (0.093) (0.093)
religdenom4 0.061 -0.029 -0.036 -0.035 -0.035(Other non-Christian) (0.197) (0.169) (0.169) (0.169) (0.169)
religattend -0.024 -0.010 -0.011 -0.011 -0.011(Church attendance) (0.016) (0.016) (0.016) (0.016) (0.016)
122

pid Model 0 Model 1 Model 2 Model 3 Model 4a Model 4b Model 4cLe
vel 1
tradeu1 0.240*** 0.176*** 0.164*** 0.164*** 0.164***(Trade union member) (0.029) (0.022) (0.021) (0.021) (0.021)
organis1 0.600*** 0.397*** 0.398*** 0.397*** 0.396***(Organisation member) (0.060) (0.054) (0.054) (0.054) (0.053)
polinter1 0.585*** 0.584*** 0.584*** 0.584***(Hardly) (0.037) (0.036) (0.037) (0.036)
polinter2 1.246*** 1.244*** 1.244*** 1.244***(Quite) (0.049) (0.042) (0.048) (0.045)
polinter3 1.942*** 1.939*** 1.939*** 1.939***(Very) (0.049) (0.047) (0.049) (0.048)
involvement 0.173*** 0.175*** 0.175*** 0.175***(Factor: involvement in politics) (0.018) (0.016) (0.018) (0.018)
institut.trust 0.242*** 0.241*** 0.241*** 0.240***(Factor: institutional trust) (0.016) (0.016) (0.016) (0.016)
interpers.trust 0.072*** 0.073*** 0.073*** 0.073***(Factor: interpersonal trust) (0.014) (0.014) (0.014) (0.014)
mediausage 0.063*** 0.064*** 0.064*** 0.064***(Factor: media usage) (0.016) (0.016) (0.016) (0.016)
Leve
l 2
fragmentation 0.139*** 0.067*** 0.042***(Fragmentation N j)
(0.019) (0.013) (0.011)
disprop -0.004 0.003 0.005(Disproportionality G j ) (0.003) (0.005) (0.003)
matdem1 -0.293*** -0.227** -0.332***(Old democracies AD1 j)
(0.035) (0.081) (0.072)
matdem3 -0.257*** -0.359*** -0.662***(New democracies AD3 j)
(0.037) (0.082) (0.067)
eastage 0.005 0.005 0.005(Interaction cage∗AD3 j)
(0.003) (0.003) (0.003)
polaris_MD -0.008**(Polarisation: MD P j)
(0.003)
123
polaris_survey 0.906***(Polarisation: Survey P j)
(0.053)
polaris_sdleftright 1.306***(Polarisation: Left-right P j)
(0.049)
pid Model 0 Model 1 Model 2 Model 3 Model 4a Model 4b Model 4c
Inte
rcep
ts _cut11 -0.075 -0.367*** -0.147* 0.975*** 0.792*** 0.824*** 0.574***(0.087) (0.085) (0.064) (0.062) (0.067) (0.081) (0.061)
_cut12 0.396*** 0.120 0.349*** 1.516*** 1.332*** 1.364*** 1.128***(0.101) (0.1099) (0.038) (0.045) (0.056) (0.089) (0.049)
_cut13 2.638*** 2.413*** 2.670*** 4.009*** 3.826*** 3.858*** 3.663***(0.158) (0.164) (0.081) (0.104) (0.109) (0.137) (0.096)
Mod
el fi
t
N 52,728 52,728 52,728 52,728 52,728 52,728 52,728LL -58835.740 -57778.250 -57295.48 -54503.98 -54495.75 -54480.94 -54480.06Var (2) 0.2289 0.2357 0.7331 0.5566 0.5737 0.1512 0.1605ICC 0.0651 0.0669 0.1822 0.1428 0.0738 0.0740 0.0740Pseudo-R2 (Mc-Fadden) — 0.0180 0.0262 0.0736 0.1700 0.1706 0.1706Pseudo-R2 (Nagelkerke) — 0.0440 0.0636 0.1447 0.1485 0.0439 0.0465
Significance levels: * p<0.05; ** p<0.01; *** p<0.001(Robust standard errors in parentheses)
124

H. Full regression Models with Party Families
strength Model 0 Model 1 Model 2
Part
y Fa
mily
Communist 0.536*** 0.519***(0.108) (0.130)
Left socialist 0.063 0.074(0.070) (0.066)
Social democratic(reference category)Ecologic -0.044 0.051
(0.058) (0.062)
Liberal -0.167** -0.204***(0.048) (0.052)
Conservative 0.035 0.002(0.033) (0.047)
Religious 0.081 -0.003(0.066) (0.057)
Radical right -0.122** 0.054(0.044) (0.050)
Regional/Ethnical 0.110 0.197(0.097) (0.102)
Agrarian/Centre 0.100 0.050(0.111) (0.110)
Single Issue/Other -0.007 0.041(0.090) (0.105)
share 2.715*** 1.669***(Share of identifiers) (0.695) (0.455)
Leve
l 1 co
ntro
l var
iabl
es
gender 0.136***(Female) (0.026)
age 0.004***(Age) (0.001)
eduyears -0.024***(Education in years) (0.003)
egp1 0.065(Lower level service class) (0.033)
egp2 0.055(Petty bourgeoisie) (0.031)
egp3 0.063(Routine non-manual) (0.038)
egp4 0.099*(Skilled workers) (0.040)
egp5 0.180***(Unskilled workers) (0.045)
egp6 0.324***(Farmers) (0.070)
area1 -0.041(City) (0.026)
area2 0.009(Town) (0.034)
religdenom1 -0.050(Roman Catholic) (0.036)
religdenom2 0.075(Protestant) (0.040)
religdenom3 0.017
125

(Other Christian) (0.051)
strength Model 0 Model 1 Model 2Le
vel 1
cont
rol v
aria
bles
religdenom4 -0.056(Other non-Christian) (0.083)
religattend -0.051**(Church attendance) (0.017)
tradeu1 0.033(Trade union member) (0.030)
organis1 0.238***(Organisation member) (0.041)
polinter1 0.108(Hardly) (0.058)
polinter2 0.584***(Quite) (0.055)
polinter3 1.444***(Very) (0.074)
involvement 0.192***(Factor: involvement in politics) (0.019)
institut.trust 0.202***(Factor: institutional trust) (0.019)
interpers.trust -0.000(Factor: interpersonal trust) (0.012)
mediausage 0.047**(Factor: media usage) (0.014)
Inte
rcep
ts _cut11 -3.838*** -2.514*** -3.404***(0.207) (0.267) (0.218)
_cut12 -1.132*** 0.195 -0.617***(0.150) (0.251) (0.173)
_cut13 2.220*** 3.554*** 2.983***(0.123) (0.287) (0.175)
Mod
el fi
t
N 61,280 61,280 61,280LL -56437.39 -56351.497 -53796.102Var (2) 1.8903 (.4638) 1.4753 (.3662) 0.5466 (-.1300)ICC 0.3649 0.3096 0.1425Pseudo-R2 (Mc-Fadden) — 0.0015 0.0468Pseudo-R2 (Nagelkerke) — 0.0033 0.0982
126
127


