

1
ConferenceConference callcall / / WebcastWebcastRESULTS ANNOUCEMENTRESULTS ANNOUCEMENT3rd Quarter 20093rd Quarter 2009(Brazilian Corporate Law)(Brazilian Corporate Law)
Almir Guilherme Almir Guilherme BarbassaBarbassaCFO and Investor Relations OfficerCFO and Investor Relations Officer
NovemberNovember 17th, 200917th, 2009
2
The presentation may contain forecasts about future events. Such forecasts merely reflect the expectations of the Company's management. Such terms as "anticipate", "believe", "expect", "forecast", "intend", "plan", "project", "seek", "should", along with similar or analogous expressions, are used to identify such forecasts. These predictions evidently involve risks and uncertainties, whether foreseen or not by the Company. Therefore, the future results of operations may differ from current expectations, and readers must not base their expectations exclusively on the information presented herein. The Company is not obliged to update the presentation/such forecasts in light of new information or future developments.
The United States Securities and Exchange Commission permits oil and gas companies,
in their filings with the SEC, to disclose only proved reserves that a company has demonstrated by actual production or conclusive formation tests to be
economically and legally producible under existing economic and operating conditions.We use certain terms in this presentation, such as oil and gas resources, that the SEC’s guidelines strictly prohibit us from including in filings with the SEC.
CAUTIONARY STATEMENT FOR US INVESTORS
DISCLAIMER
3
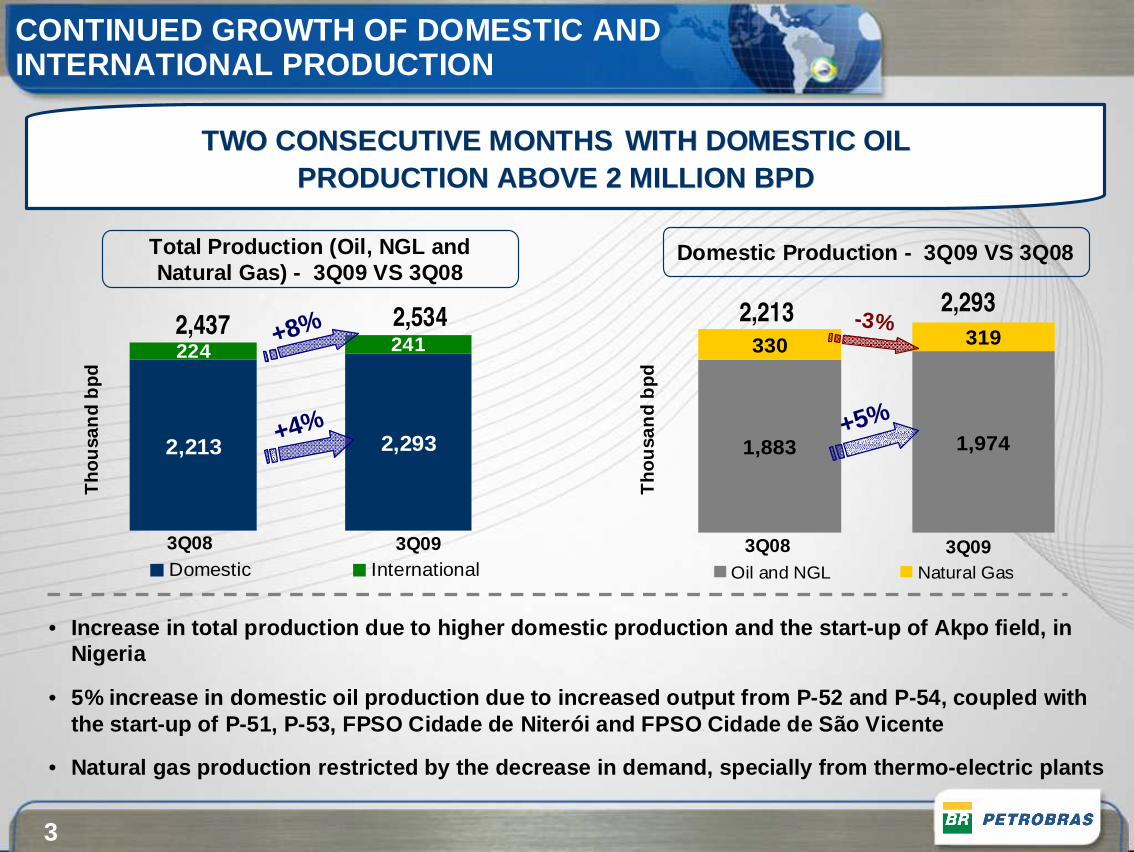
CONTINUED GROWTH OF DOMESTIC AND INTERNATIONAL PRODUCTION
Domestic Production - 3Q09 VS 3Q08
2,213 2,293
224 241
Domestic International
Total Production (Oil, NGL and Natural Gas) - 3Q09 VS 3Q08
2,437
3Q08 3Q09
2,534+8% 2,213 2,293
330 319
1,9741,883
Oil and NGL Natural Gas
+5%
TWO CONSECUTIVE MONTHSTWO CONSECUTIVE MONTHS WITH DOMESTIC OIL WITH DOMESTIC OIL PRODUCTION ABOVE 2 MILLION BPDPRODUCTION ABOVE 2 MILLION BPD
-3%
+4%
Tho
usan
d bp
d
Tho
usan
d bp
d
3Q08 3Q09
• Increase in total production due to higher domestic production and the start-up of Akpo field, in Nigeria
• 5% increase in domestic oil production due to incre ased output from P-52 and P-54, coupled with the start-up of P-51, P-53, FPSO Cidade de Niterói an d FPSO Cidade de São Vicente
• Natural gas production restricted by the decrease i n demand, specially from thermo-electric plants
4
P-51
P-51
PLATFORM/ FIELD
CAPACITY(thous. bpd)
AVERAGE 3Q09
(thous. bpd)
NUMBER OFWELLS
EXPECTED WELLS
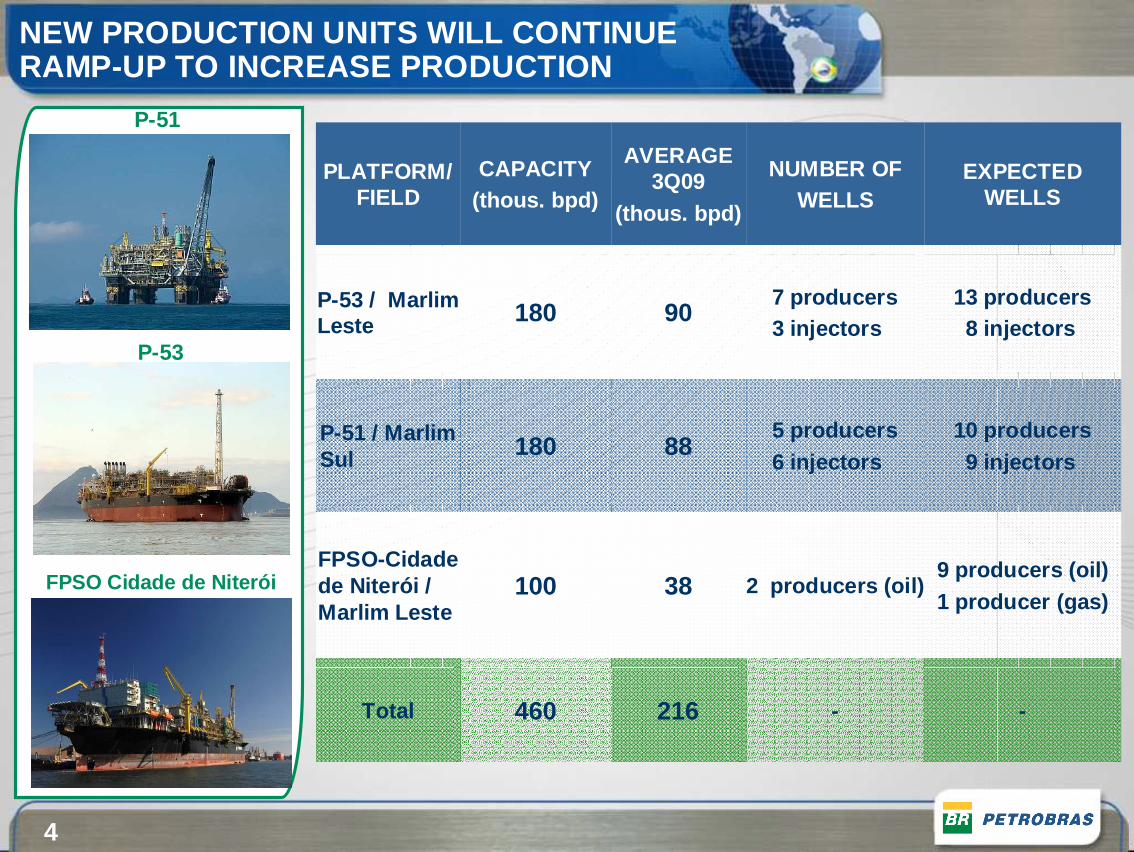
P-53 / MarlimLeste 180 90
7 producers3 injectors
13 producers 8 injectors
P-51 / MarlimSul 180 88
5 producers6 injectors
10 producers9 injectors
FPSO-Cidadede Niterói / Marlim Leste
100 38 2 producers (oil)9 producers (oil) 1 producer (gas)
Total 460 216 - -
FPSO Cidade de Niterói
P-53
FPSO Cidade de Niterói
NEW PRODUCTION UNITS WILL CONTINUE RAMP-UP TO INCREASE PRODUCTION
5
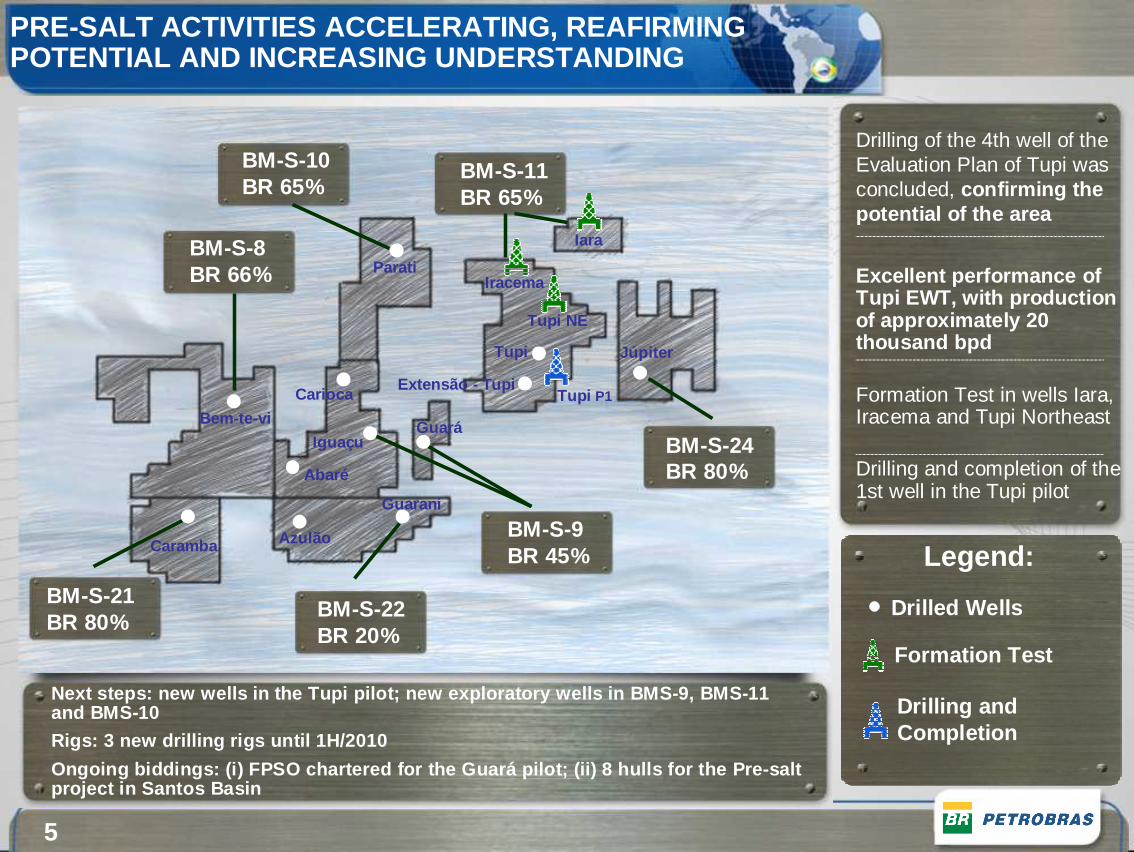
Drilling of the 4th well of the Evaluation Plan of Tupi was concluded, confirming the potential of the area
Excellent performance of Tupi EWT, with production of approximately 20 thousand bpd
Formation Test in wells Iara, Iracema and Tupi Northeast
Drilling and completion of the 1st well in the Tupi pilot
BM-S-10BR 65%
BM-S-11BR 65%
BM-S-24BR 80%
BM-S-9BR 45%
BM-S-22BR 20%
BM-S-21BR 80%
BM-S-8BR 66%
Legend:
Drilled Wells
Formation Test
Drilling and Completion
Parati
Iara
Iracema
Tupi NE
Tupi
Tupi P1Extensão - Tupi
Júpiter
Guará
Carioca
Iguaçu
Abaré
Azulão
Guarani
Caramba
Bem-te-vi
PRE-SALT ACTIVITIES ACCELERATING, REAFIRMING POTENTIAL AND INCREASING UNDERSTANDING
Next steps: new wells in the Tupi pilot; new explora tory wells in BMS-9, BMS-11 and BMS-10
Rigs: 3 new drilling rigs until 1H/2010
Ongoing biddings: (i) FPSO chartered for the Guará p ilot; (ii) 8 hulls for the Pre-salt project in Santos Basin
6
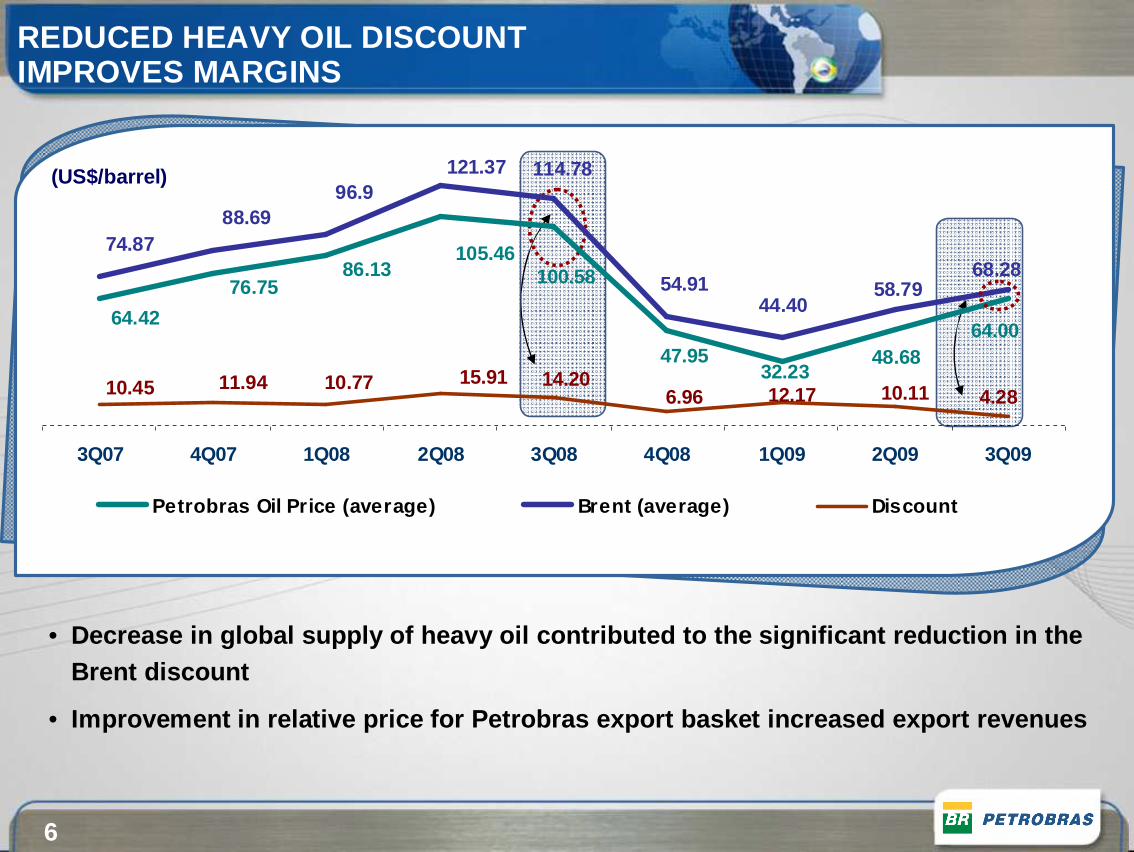
(US$/barrel)
REDUCED HEAVY OIL DISCOUNT IMPROVES MARGINS
32.23
64.42
76.7586.13
105.46100.58
47.95 48.6864.00
44.40
74.8788.69
96.9121.37 114.78
54.91 58.7968.28
4.2810.1112.176.9614.2015.9110.7711.9410.45
3Q07 4Q07 1Q08 2Q08 3Q08 4Q08 1Q09 2Q09 3Q09
Petrobras Oil Price (average) Brent (average) Discount
• Decrease in global supply of heavy oil contributed to the significant reduction in the Brent discount
• Improvement in relative price for Petrobras export basket increased export revenues
7
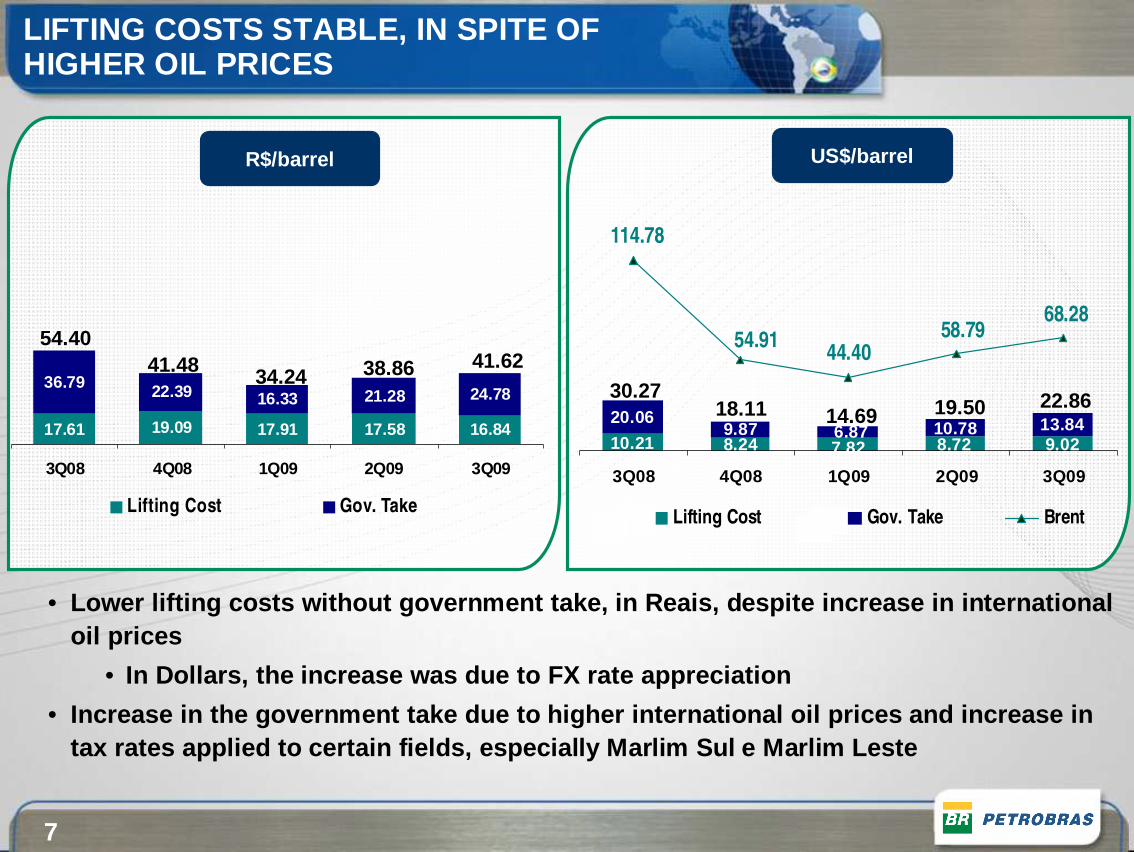
LIFTING COSTS STABLE, IN SPITE OF HIGHER OIL PRICES
17.61 19.09 17.91 17.58 16.84
36.79 22.39 16.33 21.28 24.78
3Q08 4Q08 1Q09 2Q09 3Q09
Lifting Cost Gov. Take
54.4041.48 34.24 38.86 41.62
R$/barrel
• Lower lifting costs without government take, in Rea is, despite increase in international oil prices
• In Dollars, the increase was due to FX rate appreci ation
• Increase in the government take due to higher inter national oil prices and increase in tax rates applied to certain fields, especially Mar lim Sul e Marlim Leste
US$/barrel
10.21 8.24 9.02
20.069.87 13.84
7.82 8.726.87 10.78
58.7968.28
44.4054.91
114.78
3Q08 4Q08 1Q09 2Q09 3Q09
Lifting Cost Gov. Take Brent
30.2718.11 14.69 19.50 22.86
8
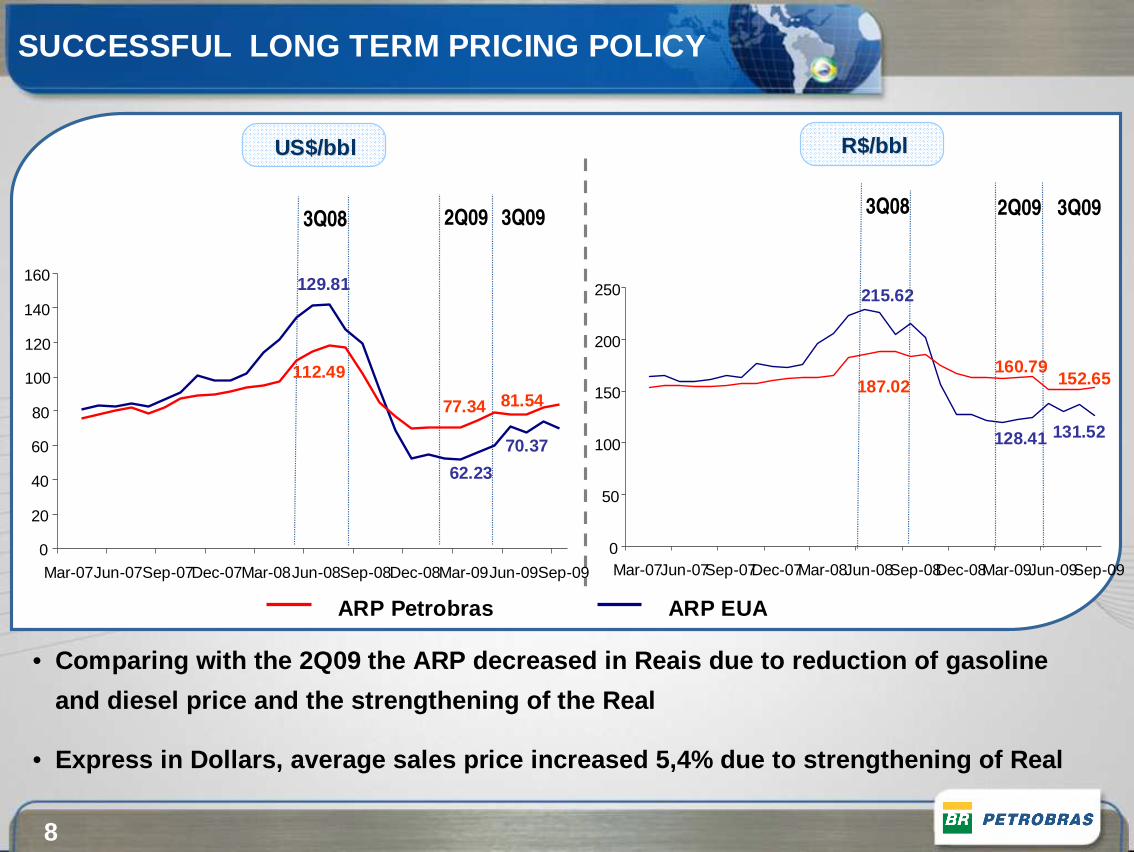
US$/US$/bblbbl R$/R$/bblbbl
ARP Petrobras ARP EUA
• Comparing with the 2Q09 the ARP decreased in Reais d ue to reduction of gasoline
and diesel price and the strengthening of the Real
• Express in Dollars, average sales price increased 5 ,4% due to strengthening of Real
SUCCESSFUL LONG TERM PRICING POLICY
US$/bbl2Q09 3Q093Q08
70.37
81.54
62.23
77.34
129.81
112.49
0
20
40
60
80
100
120
140
160
Mar-07Jun-07Sep-07Dec-07Mar-08Jun-08Sep-08Dec-08Mar-09Jun-09Sep-09
R$/bbl
128.41
160.79152.65
131.52
215.62
187.02
2Q09 3Q093Q08
0
50
100
150
200
250
Mar-07Jun-07Sep-07Dec-07Mar-08Jun-08Sep-08Dec-08Mar-09Jun-09Sep-09
9
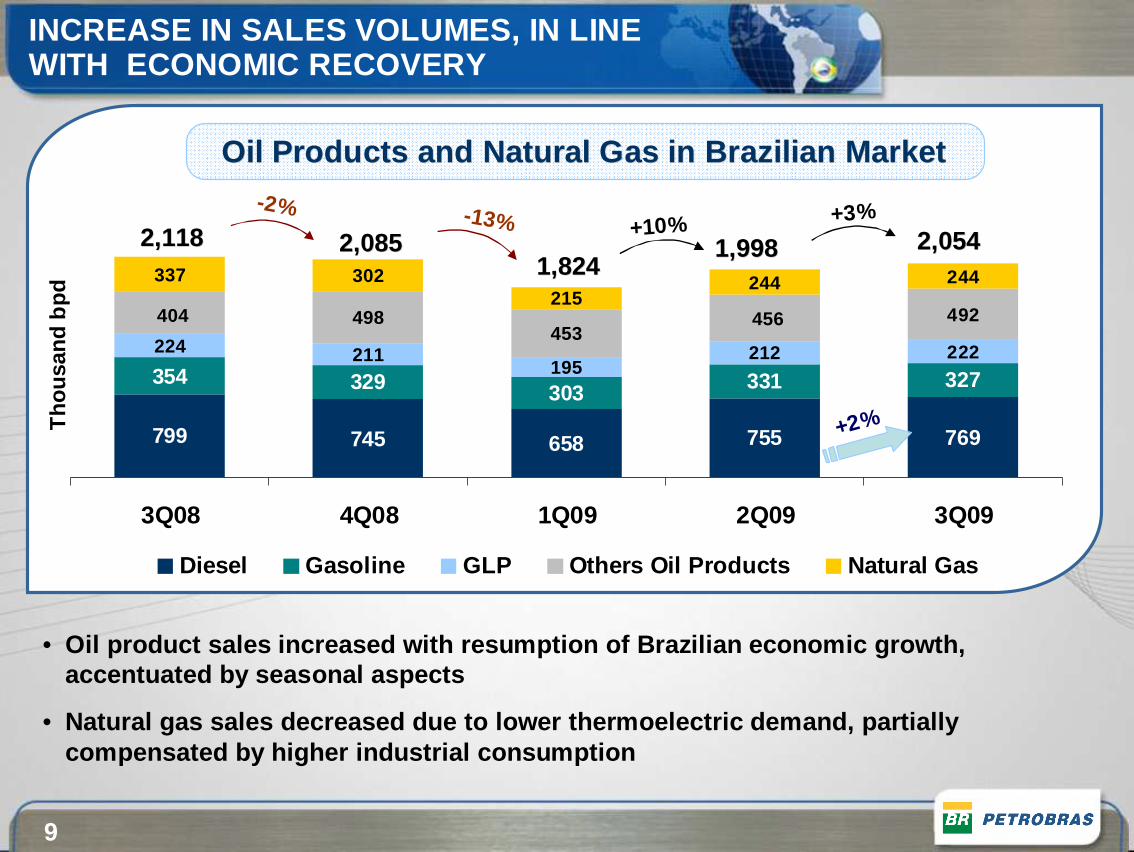
799 745 658 755 769
354 329 303 331 327
224 211195
212 222
337 302215
244 244
492498453
404 456
3Q08 4Q08 1Q09 2Q09 3Q09
Diesel Gasoline GLP Others Oil Products Natural Gas
1,9981,9981,8241,824
2,0542,054
Oil Products and Natural Gas in Brazilian MarketOil Products and Natural Gas in Brazilian Market
Tho
usan
d bp
d
+3%
INCREASE IN SALES VOLUMES, IN LINE WITH ECONOMIC RECOVERY
2,0852,0852,1182,118 +10%
+2%
-2% -13%
• Oil product sales increased with resumption of Braz ilian economic growth, accentuated by seasonal aspects
• Natural gas sales decreased due to lower thermoelec tric demand, partially compensated by higher industrial consumption
10
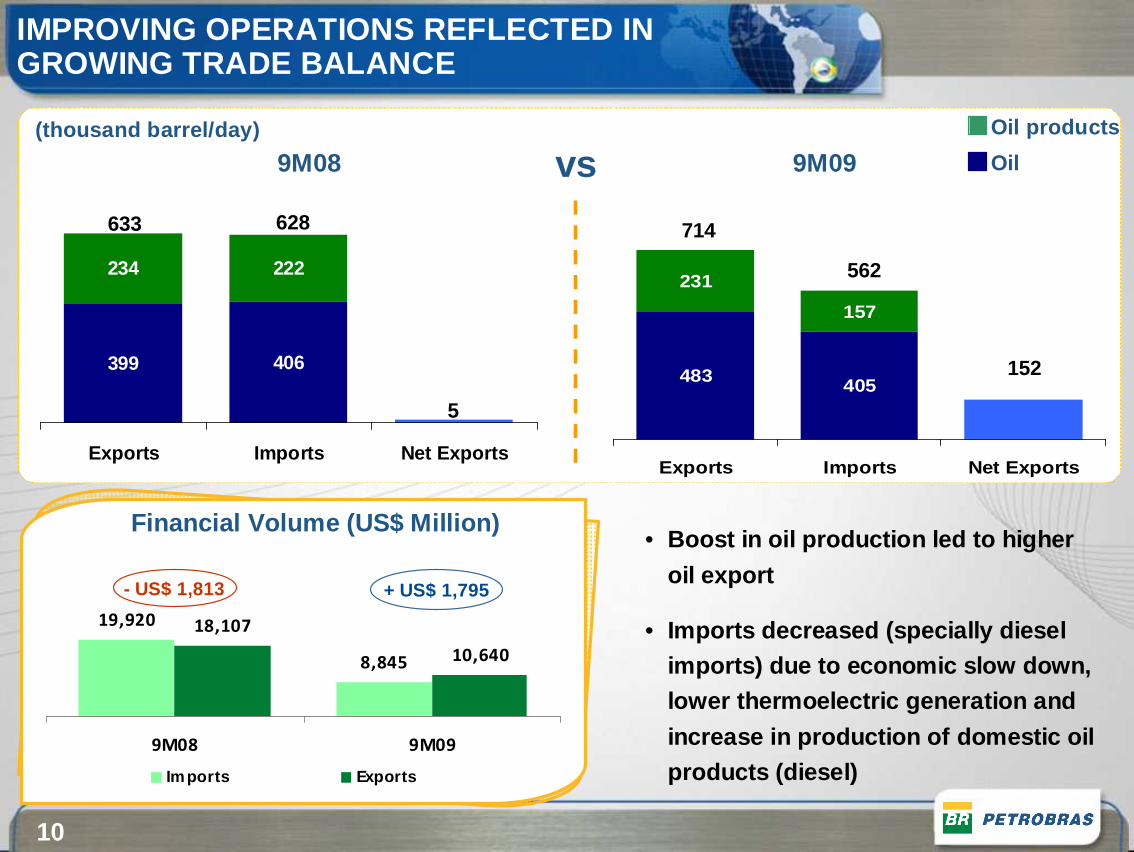
9M09
483 405
231
157
Exports Imports Net Exports
9M08
399 406
234 222
Exports Imports Net Exports
628633
5
152
562
714
vs
19,920
8,845
18,107
10,640
9M08 9M09
Imports Exports
+ US$ 1,795- US$ 1,813
IMPROVING OPERATIONS REFLECTED IN GROWING TRADE BALANCE
Oil
Oil products(thousand barrel/day)
Financial Volume (US$ Million)• Boost in oil production led to higher
oil export
• Imports decreased (specially diesel imports) due to economic slow down, lower thermoelectric generation and
increase in production of domestic oil products (diesel)
11
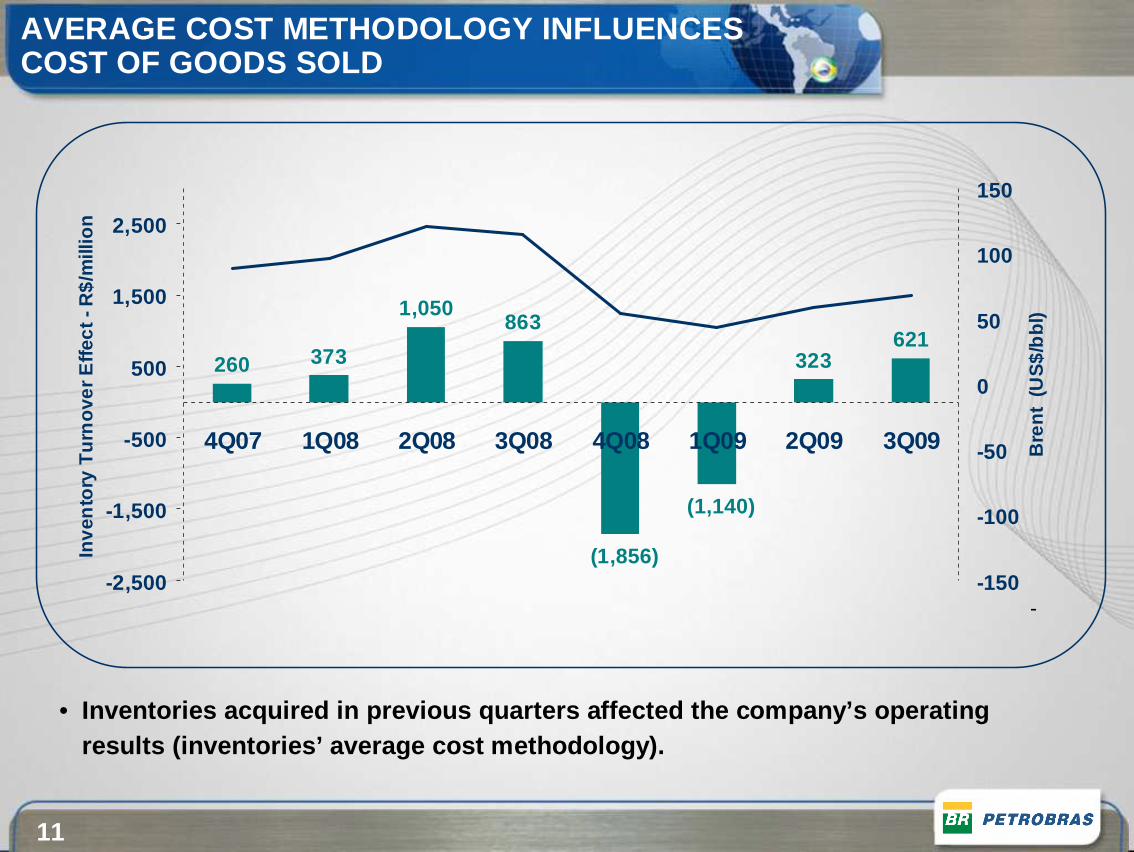
AVERAGE COST METHODOLOGY INFLUENCES COST OF GOODS SOLD
• Inventories acquired in previous quarters affected the company’s operating results (inventories’ average cost methodology).
-
260 373
1,050863
(1,856)
(1,140)
323621
-2,500
-1,500
-500
500
1,500
2,500
4Q07 1Q08 2Q08 3Q08 4Q08 1Q09 2Q09 3Q09
Inve
nto
ry T
urn
over
Effe
ct -
R$/
mill
ion
-150
-100
-50
0
50
100
150
Bre
nt (
US
$/b
bl)

12
NET REVENUE NET REVENUE (IN MILLION R$ - 2Q09 VS 3Q09)
2Q09Operating Income
Net Operating Revenue
COGSOperating Expenses
3Q09Operating Income
13,896
3,272 (4,401)
(2,520)
10,247
12,295P.E. MARLIM = 2,048
OPERATING INCOME IMPACTED BY SPECIAL PARTICIPATION PROVISIONING
• Higher oil prices, lower spread between light and h eavy oil and increase in oil products sale generated higher net operating revenu e
• Higher sales volumes and higher import prices led t o increase in COGS
• Decline in operating income is explained by a provi sioning for special participation tax related to Marlim field (R$ 2.05 b illion)

13
NET INCOME NET INCOME (R$ MILLION – 2Q09 VS 3Q09)
7,734 (3,649) 3,168 7,303(836)(63) 949
1,677 Net Monetary Variation
• Better financial result due to lower FX rate apprec iation and net monetary variation from the BNDES loan (R$ 1.7 Billion)
• Counterpart of hedge gains was higher COGS• Taxes Increased due to the higher fiscal benefit fr om interest on equity along with
higher recovery of fiscal credits in exploratory ac tivities abroad in 2Q09
• Reduction in minority interest due to lower FX gain s on SPCs debts
533 Hedge
NET INCOME FLAT, AFTER ADJUSTING FOR FX VARIATIONS
Financial Result
TaxesEquityIncome
OperatingIncome
MinorityInterest
2Q09Net Income
3Q09Net Income

14
2,806(425)
(820)418 (2,419)
7,8068,246
• Reduced spread between light and heavy oil contribu ted to the increase in revenues
• Increase in inventories caused slight reduction in sales volumes
• Increase in COGS due to higher production taxes due to higher oil prices
• Increase in operating expenses due to the extraordi nary provision for Marlim field Government take
EXPLORATION AND PRODUCTION –SOLID OPERATING PERFORMANCE
EXPLORATION & PRODUCTION EXPLORATION & PRODUCTION –– OPERATING INCOMEOPERATING INCOME(R$ MILLION – 2Q09 VS 3Q09)
2Q09 Oper. Income
Price Effect on Revenues
Volume Effecton Revenues
OperationalExpenses
3Q09 Oper. Income
Volume Effecton COGS
Cost Effecton average
COGS

15
DOWNSTREAM DOWNSTREAM –– OPERATING INCOMEOPERATING INCOME(R$ MILLION – 2Q09 VS 3Q09)
(636)
(5,278)2,911
(2,316)
205 2,800
7,914
• Despite reduction in ARP in Reais (2Q09: R$ 160.79; 3Q09: R$ 152.75), increase in the volumes sold, led by economic growth, increa sed revenues
• Higher oil and oil products import costs and reduce d heavy/ light oils spread led to increase in COGS
DOWNSTREAM – INCOME NORMALIZING WITH INCREASES IN INTERNATIONAL PRICES
2Q09 Oper. Income
Price Effect on Revenues
Volume Effecton Revenues
Cost Effecton average
COGS
OperationalExpenses
3Q09 Oper. Income
Volume Effecton COGS

16
INCREASING CONTRIBUTIONS FROM GAS & ENERGY, INTERNATIONAL AND DISTRIBUTION (2Q09 VS 3Q09)
Gas & EnergyGas & Energy
InternationalInternational
Operating Result:2Q09
R$ 576 millionVS.
Operating Result : 2Q09R$ 224 million
VS.
Operating result:2Q09
R$ 466 millionVS.
• 7% increase in sales margins and 9% in volumes supported continued strength for our distribution segment
3Q09R$ 651 million
3Q09R$ 363 million
3Q09R$ 620 million
DistributionDistribution
• Higher volumes sold in non-thermo electric markets
• Decrease in natural gas imports/transfer costs, fol lowing the levels of international reference prices
• Reduction in the energy generation income partially offset by better results from power sales
• Higher realization prices and increase in productio n contributed to higher operating income
• Akpo start-up in Nigeria was main contributor to the trend of increasing production

17
vs
1,5
2,8d
0,10,4
0,4
7,1
1,0
1,1
21%
2%3%
1%
9%
11%
7%
46%
23.2
10.6
4.5
5.5
0.41.5
3.8 1.2
19%
3%
2%
1%
6%
12%
11%
46%
3.7
4.1 15.8
0,5
6.4
2.2
0.30.7
Capex 9M09 - R$ 50.7 billions Capex 9M08 - R$ 34.1 billions
E&P International
0.9
Capex in line with the Company´s opportunities
CONTINUED GROWTH IN CAPEX, CONSISTENT WITH BUSINESS PLAN
G&E Distribution CorporateDoestream SPE Projects under Negociation

18
SUCCESSFUL EFFORTS TO RAISE CAPITAL FROM LONG TERM SOURCES
1.25
0
1.5
2.5
1.5
Brigde Loan Bond issue
Oct-30 (Maturity 2040)Yield: 7.00%
Oct-30 (Maturity 2020) Yield: 5.875%
Jul-09 (Maturity 2019)Yield: 6.875%
Feb-11 (Maturity 2019)Yield: 8.125%
6.5 6.756.75
(US
$ bi
lion)
MarketMarket Capital Bond Capital Bond issuanceissuance
10
13.3
2
2.75
China DevelopmentBank
BNDES
U S Eximbank
Others
(*)
(*) R$ 25 billions converted by FX tax in 07.30.09
OthersOthers LoansLoans++US$ 28.05 US$ 28.05 billionsbillions
In 2009, In 2009, US$ 34.8 US$ 34.8 billionbillion werewere raisedraisedwithwith anan averageaverage lifelife ofof 10.6 10.6 yearsyears

19
LIQUIDITY STRENGTHENED, LEVERAGE WITHIN TARGETS
28%26%
19%
21%18% 19%
21%
28%26%
12%
19%22%21%
25%
21%
18%
23%27%
30/09/2007 31/03/2008 30/09/2008 31/03/2009 30/09/2009
Net Debt/Net Capt.
Short Term Debt/Total Debt
R$ million 09/30/2009 06/30/2009
Short Term Debt 10,639 13,086Long Term Debt 79,588 55,782
Total Debt 90,227 68,868
Cash and Cash Equivalents
30,088 10,072
Short Term Debt 60,139 58,796
Capital Structure 49% 49%
US$ million 09/30/2009 06/30/2009
Total Debt 50,743 35,288
• Increase in liquidity due to the increase in cash a nd decrease in short term debt.
• Net Debt/Net Capitalization stable and within the t arget range (25%-35%)

20
STABLE CASH FLOWS SUPPORT INVESTMENT PLAN
6.386.384.21Average Life of Debt (years)*
1.11**1,000.85Net Debt/ EBITDA
30,08830,08810,776Cash at the end of period
36,987
(9,835)
(12,442)
(50,622)
38,180
15,889
Jan-Sep 2009
25,4413,581Financing
(3,426)(6,187)Dividends
(1,765)(198)Free Cash Flow
(18,446)(34,534)Investment
16,68134,337Operating Cash Flow
10,07213,071Cash at the beginning of period
3Q09Jan-Sep2008
2.08
118.87
1.871.69Average Exchange Rate (R$/US$)
127.68187.62Average Brent (R$/bbl)
R$ million
* End of period** last 12 months
� Higher operating cash flow, despite lower oil price s
� Increasing CAPEX supported by higher borrowings dur ing the year
� New loans improved average life of debt stock

21
For more information:Investor Relations
www.petrobras.com.br/ri+55 21 3224-1510


