

Week 2

Announcements
I sent an email this morning, if you did not get it, you are not on my email list.
WD quiz on Oct 15th See your syllabus to get URL for check
figures for WD
Documentation
Why Understand system Communicate system Evaluate system
What Narratives Data-flow diagrams (DFD) Flow-chart (FC)
• Document/manual
• System/computer
• Program/software
Use by accountants
Documentation techniques are necessary tools for accountants: Auditors must understand the automated and manual
procedures an entity uses.
• This understanding can be gleaned through documenting the internal control system—a process that effectively exposes strengths and weaknesses of the system.
SOX requires that publicly-traded corporations and their auditors document and test the company’s internal controls.
Auditing Standard No. 5 promulgated by the PCAOB requires that the external auditor express an opinion on the client’s system of internal controls.
What methods are important?
DFDs and flowcharts are used extensively for systems development and for internal control documentation
62.5% of information professionals use DFDs. 97.6% use flowcharts. Both are tested on professional exams. You need to know them both.
Data flow diagram
Generally for planning, sometimes for describing “Sufficient” detail Simple, uncluttered
Logical Understand data flows Processing operations—what is done
Physical Processing entities—who, where, how
Begin with context diagram—setting boundaries

DATA FLOW DIAGRAMS
Subdividing the DFD: Few systems can be fully diagrammed
on one sheet of paper, and users have needs for differing levels of detail.
Consequently, DFDs are subdivided into successively lower levels to provide increasing amounts of detail.

DATA FLOW DIAGRAMS
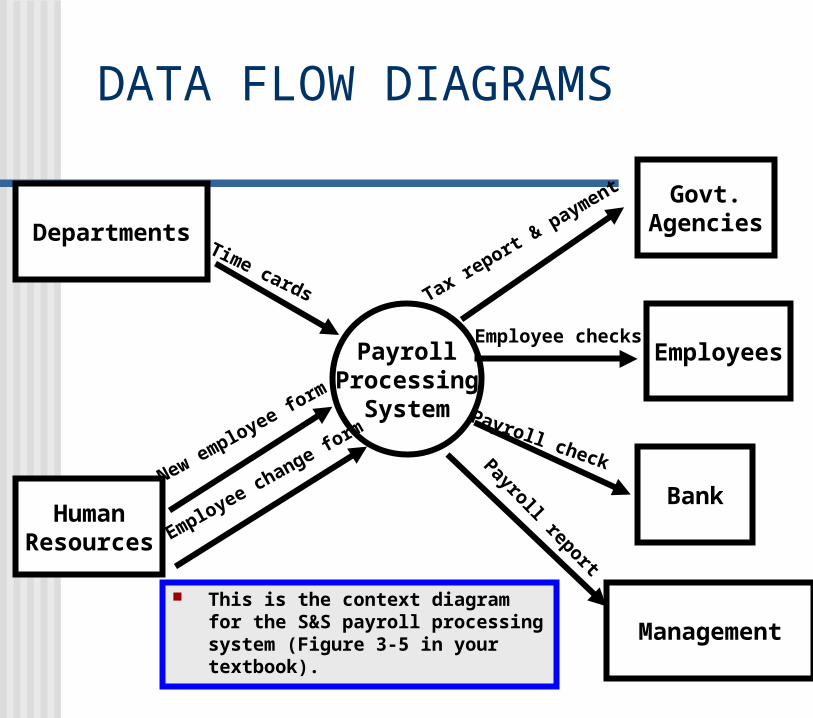
The highest level of DFD is called a context diagram. It provides a summary-level view of the
system. It depicts a data processing system
and the external entities that are:• Sources of its input• Destinations of its output
DATA FLOW DIAGRAMS
PayrollProcessing
System
Departments
HumanResources
Govt.Agencies
Employees
Bank
Management
Time cards
New employee form
Employee change form
Tax report &
payment
Employee checks
Payroll check
Payroll report
This is the context diagram for the S&S payroll processing system (Figure 3-5 in your textbook).
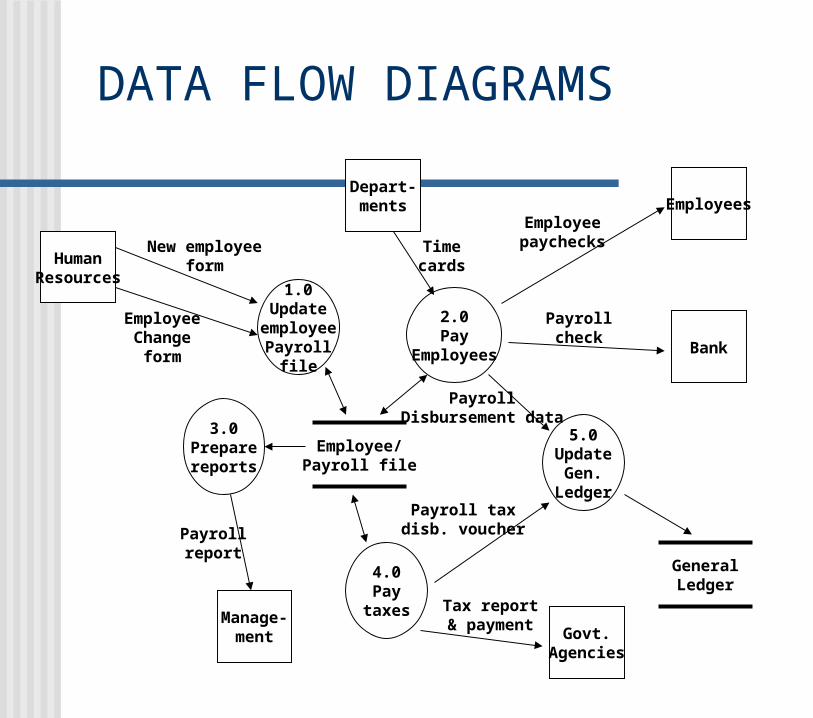
DATA FLOW DIAGRAMS
1.0Update
employeePayroll
file
2.0Pay
Employees
5.0Update
Gen.Ledger
4.0Pay
taxes
3.0Preparereports
Employee/Payroll file
GeneralLedger
HumanResources
Depart-ments Employees
Bank
Govt.Agencies
Manage-ment
EmployeeChange
form
New employeeform
Timecards
Employeepaychecks
Payrollcheck
PayrollDisbursement data
Payroll taxdisb. voucher
Tax report& payment
Payrollreport

Flowcharts
Describe portion of a system Clear, unambiguous Concise Precise
Standard, broad set of symbols Descriptive rather than prescriptive, generally Important for internal control

FLOW AND MISCELLANEOUS SYMBOLS
Document or Processing Flow Represents the direction of processing
or document flow. Normal flow is top to bottom and left to
right.

FLOW AND MISCELLANEOUS SYMBOLS
Data/Information Flow Represents the direction of
data/information flow. Often used to show data being copied
from one document to another.
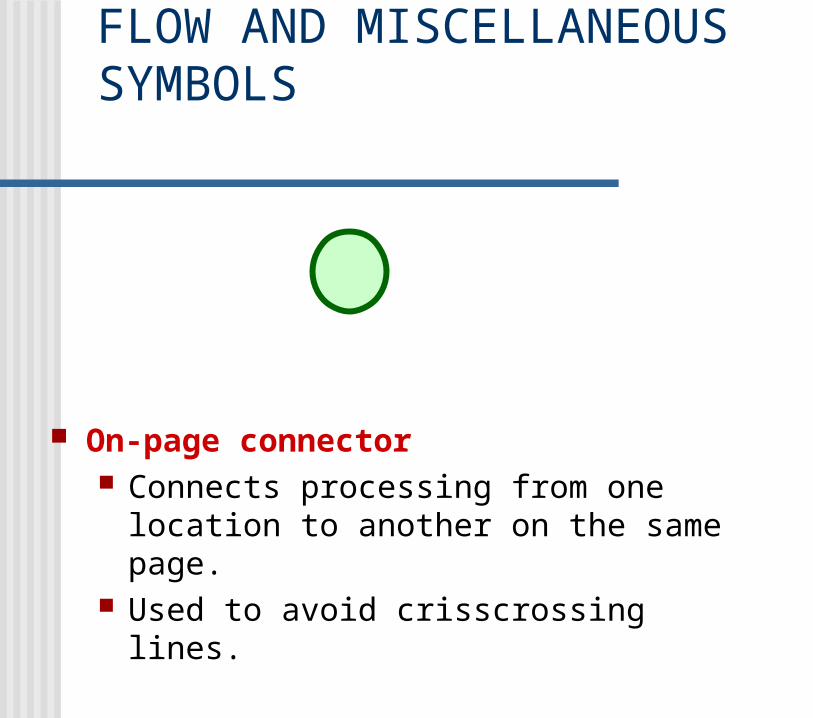
FLOW AND MISCELLANEOUS SYMBOLS
On-page connector Connects processing from one location
to another on the same page. Used to avoid crisscrossing lines.

FLOW AND MISCELLANEOUS SYMBOLS
Off-page connector Connects the processing flow between
two different pages. Signals the exit from one page and the
corresponding entrance on another page.
FLOW AND MISCELLANEOUS SYMBOLS
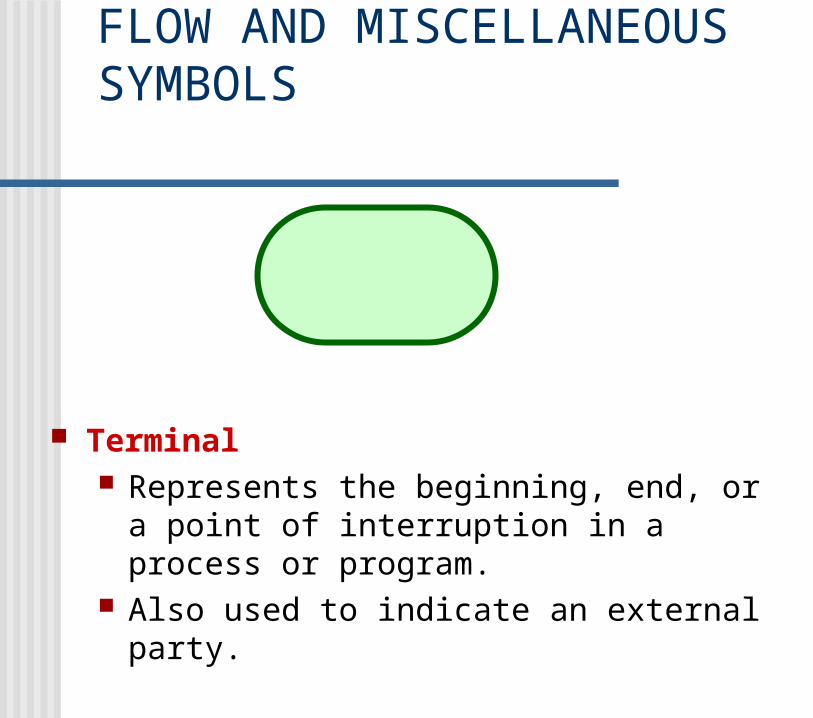
Terminal Represents the beginning, end, or a
point of interruption in a process or program.
Also used to indicate an external party.

FLOW AND MISCELLANEOUS SYMBOLS
Annotation Provides for the addition of descriptive
comments or explanatory notes as clarification.


