

Western Region’s
SNAP-Ed Evaluation Framework:
Nutrition, Physical Activity, and
Obesity Prevention Outcomes
Supplemental Nutrition Assistance Program Education
Western Region
Food and Nutrition Service
April 2014

2 Revised April 2014
Western Region
Supplemental Nutrition Assistance
Program Education (SNAP‐Ed)
Evaluation Framework: Nutrition,
Physical Activity, and Obesity Prevention
Outcomes
Author
Andrew Riesenberg, MSPH
Food Security and Obesity Prevention Team Leader
Supplemental Nutritional Assistance Program
Western Regional Office
Food and Nutrition Service
Evaluation Committee Members/Contributors
Joan Agostinelli, MA
Research and Development Manager
Bureau of Nutrition and Physical Activity
Arizona Department of Health Services
Vicki Baxter
Program Manager
Washington Department of Social and Health
Services
Andrea Bricker, MS, RD
Public Health Nutrition Consultant III
California Department of Aging
Vanessa Buchthal, DrPH
Assistant Professor, Social and Behavioral Sciences
Office of Public Health Studies
University of Hawaii at Manoa
Kathleen Carlson, MScA, RD
Research and Development Evaluator
Bureau of Nutrition and Physical Activity
Arizona Department of Health Services
Virginia Chaidez, PhD, RD
Evaluation Analyst
University of California CalFresh Nutrition
Education Program State Office
Darlene Dougherty, MS, RD
SNAP-Ed Nutrition Specialist
Division of Welfare and Supportive Services
Helen Idzorek, MA
Coordinator, Family Nutrition Program
SNAP-Ed & EFNEP
University of Alaska – Fairbanks
Cooperative Extension Service
Clifford Ko
Program Specialist
Supplemental Nutritional Assistance Program
Western Regional Office
Food and Nutrition Service
Katie Lewis
Program Analyst
California Department of Social Services
CalFresh Branch, Nutrition Education Unit
Anne R. Lindsay, MS
Associate Professor, Extension Specialist
Exercise Physiology & Health
University of Nevada, Extension
Kathleen Manenica, MS CN
State Coordinator, Food $ense
Washington State Univ. Extension
Kristin Matthews
Food Stamp Program Manager
Idaho Department of Health & Welfare
Paul McCawley, PhD
Associate Dean and Associate Director Cooperative
Extension System
University of Idaho
Megan Mikkelsen, MPH
SNAP-Ed Program Evaluator and Research
Investigator
Office of Nutrition Services
Washington Department of Health
Heather Miles, MA
SNAP Operations & Policy Analyst 3
Oregon Department of Human Services
Barbara MkNelly, MS
Research Scientist I
Public Health Institute
Research and Evaluation Section
California Department of Public Health Nutrition
Education and Obesity Prevention Branch – SNAP-
Ed
Fred Molitor, PhD
Chief, Research and Evaluation Section
California Department of Public Health Nutrition
Education and Obesity Prevention Branch – SNAP-
Ed

3 Revised April 2014
Jill Armstrong Shultz, PhD
PI for Washington State University (WSU) Extension
SNAP-Ed
WSU Extension Specialist in Nutrition and Public
Health
Sharon B. Sugerman, MS, RD, FADA
Program Director II
Public Health Institute
Research and Evaluation Section
California Department of Public Health Nutrition
Education and Obesity Prevention Branch – SNAP-
Ed
Tina Tamai, MPH, JD
Nutrition Education Network Coordinator
CDPHPD: Chronic Disease Prevention and Health
Promotion Division
Hawaii Department of Health
Lauren Tobey, MS, RD
Nutrition Education Program Coordinator
Extension Family and Community Health
Oregon State University
Lauren MacKenzie Whetstone, PhD
Research Scientist II
Public Health Institute
Research and Evaluation Section
California Department of Public Health Nutrition
Education and Obesity Prevention Branch – SNAP-
Ed
Reviewers
Alice S. Ammerman DrPH, RD
Director, Center for Health Promotion and Disease
Prevention (a CDC Prevention Research Center)
Professor, Department of Nutrition, Gillings School
of Global Public Health and School of Medicine
University of North Carolina at Chapel Hill
Lauren Badger, MS, RD, LD
SNAP-Ed/SNAP Outreach Program Specialist
Georgia Department of Family and Child Services
Food & Nutrition Unit
Marc Braverman, PhD
Extension Specialist, Family & Community Health
Professor, School of Social and Behavioral Health
Sciences
Oregon State University
Susan B. Foerster, Chief, Policy, Planning and
Partnerships (Retired)
Network for a Healthy California
California Dept of Public Health
Christi Kay, EdM
President
HealthMPowers, Inc.
Usha Kalro, MS, RD, LD
Nutritionist
SNAP - Program Accountability & Administration
Division
Food and Nutrition Service
Laura Kettel Khan, PhD
Senior Scientist
Office of the Director
Division of Nutrition, Physical Activity and Obesity
Centers for Disease Control and Prevention
Jerold R. Mande, MPH
Senior Advisor to the Under Secretary,
Food, Nutrition, and Consumer Services
U.S. Department of Agriculture
Melinda M. Manore, PhD, RD, CSSD, FACSM
Professor, Nutrition
Oregon State University
Mary Story, PhD, RD
Professor of Global Health and Community and
Family Medicine, and Associate Director of
Education and Training,
Duke Global Health Institute at Duke University
4 Revised April 2014
Introduction
The Western Region SNAP‐Ed Evaluation Framework: Nutrition, Physical Activity, and Obesity
Prevention Outcomes is a menu of indicators for measuring the effectiveness of SNAP‐Ed
activities. Since February, 2013, the Western Regional Office Food Security and Obesity
Prevention Team Leader (SNAP-Ed Regional Coordinator) has worked collaboratively with
Western Region SNAP-Ed State Agencies and Implementing Agencies in an evaluation
committee to develop and refine the Framework. Evaluation committee members represent a mix
of institutions that receive SNAP-Ed funding, including SNAP agencies, land-grant colleges or
universities, and public health departments. The indicators offer a consistent and systematic
approach to developing state- and local-level SNAP‐Ed objectives and reporting program
evaluation results to the Food and Nutrition Service (FNS) Western Regional Office in Annual
Reports. The indicators do not replace, but instead can supplement, current FNS reporting
requirements in the Education and Administration Reporting System (EARS).
The Framework is being piloted in the Western Region to determine the feasibility of having a
consistent set of indicators for SNAP‐Ed outcomes and impacts. Accordingly, it is a “working”
document, and feedback from State and local SNAP‐Ed collaborators will refine the Framework
over time. This April 2014 version marks the first annual update. The current version includes a
new high-level visual depiction of the framework and more detailed indicators based upon expert
and practitioner review and feedback. The indicators appear in a checklist format to make the
Framework user-friendly.
The Framework includes a focused menu of 51 outcome indicators that align with the SNAP‐Ed
guiding principles and lend support to documenting changes resulting from multiple approaches
required in the SNAP Nutrition Education and Obesity Prevention grant (SNAP-Ed). These
approaches include individual, family, and group‐based nutrition education, physical activity and
health promotion, and related intervention strategies; comprehensive, multi‐level interventions;
and community and public health approaches. Western Region SNAP-Ed agencies that work to
deliver comprehensive programs that include direct education, social marketing, and policy,
systems, and environmental (PSE) changes do not have a mechanism to identify, track, or report
their myriad accomplishments. The Framework attempts to fill this gap. Practitioners can also
use the Framework to identify indicators of success when implementing the multi-component
programs with a focus on social marketing or PSE interventions included in the SNAP-Ed
Strategies and Interventions: An Obesity Prevention Toolkit for States.
No agency is expected to measure all indicators; the chosen indicators must be appropriate for
the program delivery model and respond to state, territorial, tribal or local needs for nutrition
education and obesity prevention services. A set of 14 priority indicators for Federal Fiscal Year
(FFY) 2015 are identified on page 10. These indicators are achievable and aspirational. SNAP‐
Ed agencies are encouraged to focus on the priority indicators, which measure changes in
5 Revised April 2014
individual behaviors, food and physical activity environments, and policies and systems changes
designed to make healthy choices easier and preferred. Additional indicators can be selected,
when appropriate, to measure other program outcomes of interest to the State.
Evaluating Multiple Approaches
The Framework is multi‐level; there are indicators of change that align with the four levels in the
Socio‐Ecological Model (SEM) referenced in the SNAP‐Ed Plan Guidance. This model
recognizes that SNAP-Ed efforts are intended to address the constellation of factors contributing
to poor diet, inactivity, and weight gain. Efforts to improve individual knowledge and skills can
be maximized when the food and activity environments reinforce individuals’ healthy choices.
Multiple sectors, including health care, media, agriculture, and community design, have a stake
in addressing inequities in nutrition and health that disproportionately impact low-income
residents, compared to the general population.
It is incumbent on SNAP-Ed agencies that deliver multi-level programming in multiple settings
to document and measure their success and challenges at each level, and create a cycle of
continuous program improvement. To guide agencies’ evaluation goals and activities, each level
of the Framework intends to measure a specific evaluation question, as follows:
1. Individual: To what extent does SNAP‐Ed programming improve participants’ diet, physical
activity, and health?
2. Environmental: To what extent does SNAP-Ed programming facilitate access and create
appeal for improved dietary and physical activity choices in the settings where nutrition
education is provided?
3. Sectors of Influence: To what extent is SNAP-Ed programming integrated into
comprehensive strategies that collectively impact lifelong healthy eating and active living in low‐
income communities?
4. Social and Cultural Norms and Values: To what extent do community-level obesity
prevention strategies impact the public’s priorities, lifestyle choices, and values for healthy
living?
Individual. The base level of the framework represents the foundation of SNAP-Ed: individual,
group, and family nutrition education and physical activity promotion and related interventions.
These activities are designed to change knowledge, goals, intentions, and skills that create
pathways to behavioral changes among low-income SNAP-Ed participants. The outcomes in this
level are measured through validated and reliable survey instruments, such as the Food Behavior
Checklist or the School Physical Activity and Nutrition Survey (SPAN), designed for low-
income and low-literacy populations to self-report their behaviors. Given low-income
6 Revised April 2014
households’ budgetary constraints, the indicators in this level focus on improving nutrition,
stretching food dollars, and physically activity through free or low-cost exercise or leisure-time
sports. In this level, the number of participants refers to individuals who report the desired
knowledge, goal, or behavioral outcome out of the total number of survey respondents.
Environmental. In this level, the focus of evaluation is not on measuring changes in individuals,
but rather changes in the settings or venues in low-income areas where nutrition education is
provided. These changes may include the adoption and implementation of a new or enhanced
organizational practice, rule, or procedure that makes healthy choices easier and more desirable.
Ideally, changes at the environmental level would contribute to long-term outcomes at the
individual level of the framework. Yet, measuring cause-and-effect between a policy or
environmental change and individual-level outcomes is difficult. Thus, at the environmental
level, SNAP-Ed agencies can measure if the settings have policies or systems in place that
research shows will improve individuals’ nutrition and physical activity.
To be effective, organizational policy changes or environmental supports should be combined
with education or marketing, parent or community involvement, and/or staff training to sustain
the new changes or standards. The primary role of SNAP-Ed Implementing Agencies (IAs) is to
provide consultation and technical assistance in creating appropriate organizational or
environmental changes that benefit low-income households and communities. It is ultimately the
responsibility of the organization that receives technical assistance to adopt, maintain, and
enforce the PSE change. SNAP-Ed evaluators can measure progress along the way and resulting
effectiveness.
Indicators in the environmental level of the Framework reflect a modified version of the RE-
AIM (Reach, Effectiveness, Adoption, Implementation, and Maintenance) model, a program
planning and evaluation tool. For SNAP-Ed purposes, agencies would measure reach and
adoption of their program and practice changes, then implementation and effectiveness, and
lastly maintenance using the following definitions:
Reach: Number of SNAP-Ed eligibles that benefitted from the change(s) during the period
assessed (e.g., number of persons < 185% of Federal Poverty Level reached by the change in
SNAP-Ed eligible settings).
Adoption: Aggregate number of SNAP-Ed settings where at least one organizational or
environmental change is made in writing or practice to improve or strengthen access or appeal
for healthy eating or physical activity during the period assessed
Implementation: Aggregate number of SNAP-Ed settings that report a multi-component
initiative with one or more organizational or environmental changes adopted AND at least one of
the following: 1) evidence-based education, 2) marketing, 3) parent/community involvement, 4)
staff training on continuous program and policy implementation,

7 Revised April 2014
Effectiveness: Number of settings with improved food or physical activity environment
assessment scores using a reliable and consistent environmental assessment tool [e.g., Nutrition
and Physical Activity Self-Assessment for Child care (NAP SACC), Communities of Excellence
in Nutrition, Physical Activity, and Obesity Prevention (CX3), School Health Index, Nutrition
Environment Measures Survey (NEMS)]. (report actual scores).
Maintenance: Average percentage increase, or number of institutional or community resources
invested in nutrition and physical activity supports or standards at SNAP-Ed settings in terms of
staff (number of full time equivalents), cash, or in-kind supports.
To maintain consistency across states in reporting environmental changes in the vast number of
low-income venues where SNAP-Ed services are provided, settings are categorized into six
options in this level.
Restaurants, mobile vending/food trucks, congregate meal sites (or, other places where
people primarily go to “eat”)
Public housing, shelters, places of worship, community organizations, residential treatment
centers, adult or senior services (or, other community or neighborhood settings where people
“live” or live nearby)
Child care, head start, early care and education, adult education, schools, after-school,
Cooperative Extension offices (or, other places where people go to “learn”)
Worksites with low-wage workers, job training programs, TANF worksites (or, other places
where people go to “work”)
Parks and recreation, YMCA, county fairs, Boys and Girls clubs, bicycle and walking paths
(or, other places where people go to “play”)
Farmers markets, grocery stores, food retailers, food pantries, stores (or, other places where
people “shop” for food)
Sectors of Influence. Obesity is a complex problem that requires a multi-pronged solution. The
Dietary Guidelines for Americans (DGA) recognize that all sectors of society, including
individuals and families, educators and health professionals, communities, organizations,
businesses, and policymakers, contribute to the food and physical activity environments in which
people eat, live, learn, work, play, and shop for food. SNAP-Ed providers have a role to play in
reshaping these sectors so that healthy choices are easy and accessible for disparate populations.
The evaluation indicators reflect broader societal goals of reforming food systems, increasing
access to healthy foods in low-income areas, and promoting safe and livable communities. At
this level of the SEM, it will be difficult, if not impossible, to tease out the relative contributions
of SNAP‐Ed. For these indicators, we might consider the collective impact of partnerships
among multiple agencies that receive FNS funding, as well as funding from complementary
nutrition and public health initiatives.

8 Revised April 2014
Social and Cultural Norms and Values. These indicators represent the public’s priorities,
lifestyle choices, and values for healthy living. Many of these indicators may take a lifetime to
change. Even so, they represent a meaningful target for SNAP-Ed agencies working toward a
society where all people, regardless of socioeconomic position, have the potential for healthy and
productive lives. Changes observed in these indicators may reflect the cumulative effects of
interventions at all of the previous levels of the SEM.
Evaluation Logic Model
The evaluation outcomes are presented in a logic model format, which is a visual depiction of the
short‐term; medium‐term; long‐term; and impacts that research shows may result from SNAP-Ed
activities. Each indicator reflects a specific outcome of interest and identifies what change(s) can
be measured. The logic model does not specify how the change will be measured. The preferred
survey questions and data collection methodologies will be included in a forthcoming
Interpretive Guide to the Western Region SNAP-Ed Evaluation Framework.
In the logic model, short-term outcomes are early markers of program success. While there is no
set time‐parameter for short‐term activities, generally these are the immediate results that can be
measured during or after program delivery. Medium‐term and long‐term outcomes build upon
previous accomplishments.
At the individual level, the distinction between medium-term and long-term is that medium-term
represents intermediate markers of progression toward meeting the DGA and Physical Activity
Guidelines for American (PAGA) recommendations. Medium-term outcomes represent changes
in actions or behaviors as measured by pre- and post-surveys before and after individual and
group based education and health promotion activities. The medium-term indicators are
actionable for on-going program evaluation.
Long-Term indicators at the individual level are more in alignment with the DGA and PAGA.
The long-term indicators are designed for use by States that either conduct surveys among
SNAP-Ed participants, or States that conduct annual or biennial population-level surveillance of
low-income audiences using state-run surveillance systems, such as the Behavioral Risk Factor
Surveillance System (BRFSS). The reference points for cups or servings of foods and beverages
in long-term indicators align with population benchmarks used in surveillance surveys. This
approach facilitates comparisons between the SNAP-Ed population and the general population
when measuring State or national trends in nutrition and physical activity.
At the environmental and sectors of influence levels, the time period for medium-term and long-
term outcomes may vary by State, population of interest, and type of activity provided. However,
generally speaking, the short-term indicators represent 1 year, medium-term represents 2 – 3
years, long term represents 3 – 5 years, and impacts represent 5+ years. However, at present, we
have not defined a set standard for these time intervals given that the specific PSE strategy

9 Revised April 2014
selected may determine implementation periods. For instance, within environmental level of the
Framework, the adoption of an environmental change that includes posting signage and “shelf
talkers” at the point of purchase in a food retail setting may occur at a faster rate than the
negotiation of changes in a food procurement agreement. Both changes would be considered
medium-term in the logic model.
Generally, at all levels of the Framework, impacts include the health and societal benefits, and
reflect the degree to which program activities and resulting changes can be sustained over time.
Contact Information
Comments, questions, constructive criticisms regarding the Framework can be shared with
Andrew Riesenberg, FNS Western Regional Office, at [email protected] or
(415)-645-1927. Please share examples of your evaluation tools and ways you are using the
Framework.
Western Region’s SNAP‐Ed Evaluation Overview
Individual Level Environmental Sectors of Influence Social/Cultural Norms and Values
Scope of Interventions:
Individual, family, or group-based nutrition education, physical activity promotion, and intervention strategies
Organizational changes, policies, rules, marketing, and access to make healthy choices easier
Community and public health approaches
The cumulative effects of all intervention categories combined
Overarching Evaluation Question:
To what extent does SNAP-Ed programming improve participants’ diet, physical activity, and health?
To what extent does SNAP-Ed programming facilitate access and create appeal for improved dietary and physical activity choices in the settings where nutrition education is provided?
To what extent is the SNAP-Ed grant program integrated into comprehensive strategies that collectively impact lifelong healthy eating and active living in low-income communities?
To what extent do community-level obesity prevention strategies impact the public’s priorities, lifestyle choices, and values for healthy living?

10 Revised April 2014
Western Region’s SNAP-Ed Evaluation Framework: Nutrition, Physical Activity, and Obesity Prevention Outcomes
Outcome Indicators (* denotes priority or preferred indicators for FFY 2015)
Individual Level Environmental Sectors of Influence Social/Cultural Norms and Values
Short Term
[Focus: Knowledge, Intentions, and Goals] ST1: MyPlate Knowledge ST2: Shopping Knowledge and Intentions ST3: Physical Activity Goals
[Focus: Organizational or Individual Support] ST4: Opportunity Identification
*
ST5: Local Champions ST6: Partnerships
*
[Focus: Community Capacity] ST8: Community Partnerships ST9: Community Obesity Prevention Plan
[Focus: Norms and Values] NV20 Family Meals NV21: Obesity Prevention Beliefs NV22: Breastfeeding Norms NV23: Physical Activity Norms NV24: Active Commuting
Medium Term
[Focus: Behavioral Changes] MT1: MyPlate Behaviors
*
MT2: Shopping Behaviors
*
MT3: Physical Activity Behaviors
*
[Focus: Adoption and Reach] MT4: Nutrition Supports Adopted
*
MT5: Physical Activity Supports Adopted
*
MT6:Marketing/ Messaging
*
Focus: Community Changes] MT7: Food Industry MT8: Local Government
*
MT9: Agriculture*
MT10: Education MT11: Community Design and Safety MT12: Health Care
*
MT13: Media
Long Term
[Focus: Dietary and Physical Activity Recommendations] LT2: Fruits & Vegetables
*
LT3: Whole Grains LT4: Dairy
*
LT5: Non-Dairy Beverages LT6: Food Security
*
LT7: Physical Activity Recommended Levels LT8: Entertainment screen time
[Focus: Implementation and Effectiveness] LT9: Nutrition Supports Implementation LT10: Physical Activity Program Implementation LT11: Program Recognition LT12: Media Coverage
[Focus: Community Benefits] LT13: Food Industry Healthy Outlets LT14: Local Government Healthy Food Sales LT15: Agriculture Sales LT16: Educational Attainment LT17: Shared Use Streets, and Crime Reduction LT18: Health Care Cost Savings LT19: Healthy Advertising
Impacts
[Focus: Health] I1: Healthy Weight and Blood Pressure I2: Quality of Life
[Focus: Maintenance] I3: Resources I4: Sustainability Plan I5: Barriers Mitigated
[Focus: Sustainability] I6: Let’s Move Recognition I7: Regional Food Hubs I8: Nutrition in Community General Plan

INDIVIDUAL LEVEL
11 Revised April 2014
INDIVIDUAL LEVEL Individual, family, or group-based nutrition education, physical activity promotion, and intervention strategies
OVER-ARCHING EVALUATION QUESTION:
To what extent does SNAP-Ed programming improve
participants’ diet, physical activity, and health?
Short-Term Outcomes (Knowledge, Intentions, and Goals)
Nutrition Physical Activity
ST1 MyPlate Knowledge: Number, or
%, 1of participants who know MyPlate, as
demonstrated by:
Food Groups. Recall of at least one benefit of
consuming:
a. Fruits and Vegetables
b. Lean proteins
c. Whole grains
d. Low-fat or fat-free dairy
Messaging. Recall of at least one of the
following Dietary Guidelines messages:
e. Make half your plate fruits and
vegetables
f. Make half your grains whole
g. Switch to low-fat or fat-free milk and
milk products
h. Drink water instead of sugary
beverages
ST2 Shopping Practices (Adults/Head
of Household): Number, or %, of participants
who know the nutritional or financial benefits
of the following targeted shopping practices,
and/or intend to perform the behavior:
a. Shop with a list
b. Read nutrition facts and nutrition
ingredients lists
c. Identify 100% whole grain products
d. Identify low-fat dairy products
e. Reduce purchases of foods with added:
1. Solid fats (saturated and/or
trans)
2. Sugar
3. Salt
f. Compare prices before buying foods
ST3 Physical Activity Goals:
Number, or %, of participants who set a goal
with intentions to perform the following
behavior(s):
Increased Activity. Increase their time spent
in physical activity
a. number of minutes per day in
exercise, physical activity or
leisure-sport
b. number of walking steps per
day
Reduced Sedentary Behaviors. Reduce their
time spent in sedentary behavior (e.g., sitting,
television watching)
1 Number of participants refers to individuals who report the desired knowledge, goal, or behavioral outcome out of the total number of survey respondents.

INDIVIDUAL LEVEL
12 Revised April 2014
Medium-Term Outcomes (Behavioral Changes)
Nutrition Physical Activity
MT1 MyPlate Behaviors:
Meal Preparation. Number, or %, of
participants who increased their use of
MyPlate when planning their meals during the
period assessed.
Dietary Behaviors. Number, or %, of
participants who report an increase in the
following dietary behaviors during the period
assessed:
During main meals:
a. Protein foods prepared without
solid fats (e.g., saturated and/or
trans fats )
b. Ate a serving size of protein less
than the palm of a hand or a deck
of cards
Throughout the day:
c. Ate more than one kind of fruit
d. Ate more than one kind of
vegetable
e. Drank more plain water
f. Drank fewer sugary beverages
g. Drank low-fat or fat-free milk
(including with cereal) and milk
products (e.g., yogurt or cheese)
h. Ate more nuts or nut butters
i. Ate less refined grains (e.g.,
spaghetti, white rice, cookies)
MT2 Shopping Behaviors
(Adults/Head of Household): Number, or %,
of participants who report increases in one or
more of these targeted shopping behaviors
during the period assessed:
Improve Nutrition.
a. Read nutrition facts or nutrition
ingredients lists
b. Buy 100% whole grain products
c. Buy low-fat dairy products
d. Buy foods with lower added:
1. Solid fats (saturated and/or
trans)
2. Sugar
3. Salt
Stretch Food Dollars
e. Compare prices before buying foods
f. Identify foods on sale or use coupons
g. Shop with a list
h. Use safe food preparation skills
i. Batch cook (cook once; eat many
times)
j. Refrigerate or freeze leftovers
MT3 Physical Activity Behaviors:
Number, or %, of participants who report
increases in exercise, physical activities or
leisure-sport appropriate for the population of
interest, and types of activities.
Increased Activity. a. Average number of minutes per
session
b. Average number of days with physical
activities during period assessed
c. Average number walking steps during
period assessed (e.g. increasing daily
goal by ≥ 2000 steps)
Reduced Sedentary Behaviors. Number, or
%, of participants who report decreases in
number of minutes of sedentary behavior
(computers, desk sitting, television watching)
during the period assessed
INDIVIDUAL LEVEL
13 Revised April 2014
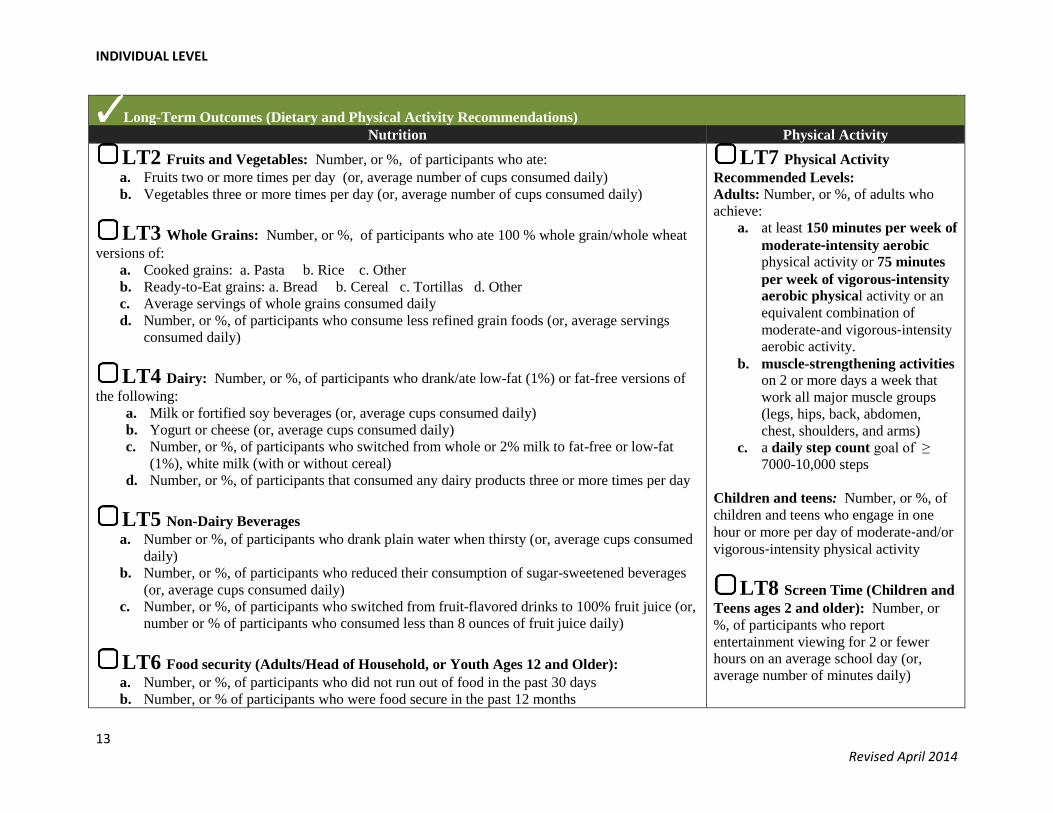
Long-Term Outcomes (Dietary and Physical Activity Recommendations)
Nutrition Physical Activity
LT2 Fruits and Vegetables: Number, or %, of participants who ate:
a. Fruits two or more times per day (or, average number of cups consumed daily)
b. Vegetables three or more times per day (or, average number of cups consumed daily)
LT3 Whole Grains: Number, or %, of participants who ate 100 % whole grain/whole wheat
versions of:
a. Cooked grains: a. Pasta b. Rice c. Other
b. Ready-to-Eat grains: a. Bread b. Cereal c. Tortillas d. Other
c. Average servings of whole grains consumed daily
d. Number, or %, of participants who consume less refined grain foods (or, average servings
consumed daily)
LT4 Dairy: Number, or %, of participants who drank/ate low-fat (1%) or fat-free versions of
the following:
a. Milk or fortified soy beverages (or, average cups consumed daily)
b. Yogurt or cheese (or, average cups consumed daily)
c. Number, or %, of participants who switched from whole or 2% milk to fat-free or low-fat
(1%), white milk (with or without cereal)
d. Number, or %, of participants that consumed any dairy products three or more times per day
LT5 Non-Dairy Beverages
a. Number or %, of participants who drank plain water when thirsty (or, average cups consumed
daily)
b. Number, or %, of participants who reduced their consumption of sugar-sweetened beverages
(or, average cups consumed daily)
c. Number, or %, of participants who switched from fruit-flavored drinks to 100% fruit juice (or,
number or % of participants who consumed less than 8 ounces of fruit juice daily)
LT6 Food security (Adults/Head of Household, or Youth Ages 12 and Older):
a. Number, or %, of participants who did not run out of food in the past 30 days
b. Number, or % of participants who were food secure in the past 12 months
LT7 Physical Activity
Recommended Levels:
Adults: Number, or %, of adults who
achieve:
a. at least 150 minutes per week of
moderate‐intensity aerobic physical activity or 75 minutes
per week of vigorous‐intensity
aerobic physical activity or an
equivalent combination of
moderate‐and vigorous‐intensity
aerobic activity.
b. muscle-strengthening activities
on 2 or more days a week that
work all major muscle groups
(legs, hips, back, abdomen,
chest, shoulders, and arms)
c. a daily step count goal of ≥
7000-10,000 steps
Children and teens: Number, or %, of
children and teens who engage in one
hour or more per day of moderate‐and/or
vigorous‐intensity physical activity
LT8 Screen Time (Children and
Teens ages 2 and older): Number, or
%, of participants who report
entertainment viewing for 2 or fewer
hours on an average school day (or,
average number of minutes daily)

INDIVIDUAL LEVEL
14 Revised April 2014
Impacts (Health2)
I1 Healthy Weight and Blood Pressure:
Healthy Weight. Number, or %, of participants at healthy weight
a. Adults 18 and older: BMI = 18.5 – 24.9
b. Children and teens (ages 2 and older): 5th percentile to less than the 85th percentile (weight-for-age)
Blood Pressure (Adults Only3)
Number, or %, of adults, who report normal blood pressure levels (systolic < 120 and diastolic < 80)
I1: Qualify of Life (Adults only):
Total average number of healthy days reported by adults (CDC-HRQOL4)
2 Health-related impacts (Healthy Weight and Blood Pressure) are measured in appropriate interventions with at least a 1-year follow-up period and reflect
Federal, state, and local rules for human subjects protections, if applicable. 3 For adults ages 18 and older who are not on medicine for high blood pressure.
4 Health-Related Quality of Life: http://www.cdc.gov/hrqol/

ENVIRONMENTAL LEVEL
15 Revised April 2014
ENVIRONMENTAL LEVEL Organizational changes, policies, rules, marketing, and access to make healthy choices easier
OVER-ARCHING EVALUATION QUESTION:
To what extent does SNAP-Ed programming facilitate access
and create appeal for improved dietary and physical activity
choices in the settings where nutrition education is provided?
Short-Term Outcomes (Organizational or Individual Support)
ST4 Identification of Opportunities: Number, or %, of settings with an identified need for improving access or creating appeal for
nutrition and physical activity supports within the following categories of venues:
a. Restaurants, mobile vending/food trucks, congregate meal sites (or, other places where people primarily go to “eat”)
b. Public housing, shelters, places of worship, community organizations, residential treatment centers, adult or senior services (or, other
community or neighborhood settings where people “live” or live nearby)
c. Child care, head start, early care and education, adult education, schools, after-school, Cooperative Extension offices (or, other places
where people go to “learn”)
d. Worksites with low-wage workers5, job training programs, TANF worksites (or, other places where people go to “work”)
e. Parks and recreation, YMCA, county fairs, Boys and Girls clubs, bicycling and walking paths (or, other places where people go to
“play”)
f. Farmers markets, grocery stores, food retailers, food pantries (or other places where people “shop” for food)
ST5 Local Champions: Number and type of local champions willing to create access to healthier foods and physical activity in SNAP-Ed
sites where nutrition education is provided
a. Youth
b. Parents/Caregivers
c. Community Members
d. Staff/service providers
e. Leadership/Decision-makers
f. Local celebrities
ST6 Partnerships: Number of organizational task forces with SNAP-Ed representatives that agree to develop a plan for improving
nutrition or physical activity practices or standards in settings where nutrition education is provided
5 Low-wage SNAP-Ed worksites are defined as industries generally classified by the Bureau of Labor Statistics as low-wage, with at least 25 employees, and
whose human resources department or management confirms that more than half of workers earn annual wages comparable to 185% of the FPL for the state.

ENVIRONMENTAL LEVEL
16 Revised April 2014
Medium-Term Outcomes: (Reach and Adoption)
MT4 Nutrition Supports Adopted: Aggregate number of SNAP-Ed settings, per “eat, live, learn, work, play, or shop” category in ST4,
where at least one change is made in writing or practice to improve or strengthen access or appeal for healthy eating during the period assessed
Description. Written progress summary or photographic documentation(s) of change(s).
Reach. Number of SNAP-Ed eligibles that benefitted from the change(s) during the period assessed (e.g., number of persons < 185% of Federal
Poverty Level reached by the change in SNAP-Ed eligible settings).
Identify types of environmental changes
a. Improvements in hours of operations/time
allotted for meals or food service
b. Improvements in layout or display of food
c. Change in menus (variety, quality, offering
lighter fares)
d. Point-of-purchase/distribution prompts
e. Menu labeling/calorie counts
f. Edible gardens
g. Lactation supports, or policies for working
mothers
h. Improvements in free water taste, quality,
smell, or temperature
i. Rules on use of food as rewards, or foods
served in meetings or classrooms
Identify types of procurement changes
a. Change in food purchasing specification(s)
b. Change in vendor agreement(s)
c. Farm-to-table
d. Increase in fruits and vegetables
e. Increase in 100% whole grains
f. Increase in low-fat dairy
g. Increase in lean proteins
h. Lower sodium levels
i. Lower sugar levels
j. Lower solid fats (e.g., saturated or trans fats)
Identify types of food
preparation changes
a. Enhanced training on
menu design and
healthy cooking
techniques
b. Reduced portion sizes
c. Use of standardized
recipes

ENVIRONMENTAL LEVEL
17 Revised April 2014
Medium-Term Outcomes (continued): (Reach and Adoption)
MT5 Physical Activity Supports Adopted: Aggregate number of SNAP-Ed settings, per “eat, live, learn, work, play, or shop” category,
in ST4 where at least one change is formally adopted in writing or practice to improve or strengthen access or appeal for physical activity during
the period assessed
Description. Written progress summary or photographic documentation(s) of change(s).
Reach. Estimated number of SNAP-Ed eligibles that potentially benefit from the change(s) during the period assessed (e.g., number of persons <
185% of Federal Poverty Limit exposed to the change).
Identify types of environmental changes
a. Improvements in hours of operations of recreation facilities
b. Improvements in access to safe walking or bicycling paths, or
Safe Routes to School or work
c. Signage and prompts for use of walking and bicycling paths
d. New or improved stairwell prompts
e. Improvements in access to stairwells
Identify types of program or practice changes a. New or increased use of school facilities during non-school hours
for recreation, or joint use policies
b. New or stronger limits on entertainment screen time
c. Increase in school days spent in physical education
d. Improvements in time spent in daily recess
e. New or improved access to structured physical activity programs
MT6 Marketing and Messaging:
Number, or %, of SNAP-Ed eligibles who, when aided, can recall SNAP-Ed nutrition, physical activity, and obesity prevention messaging.
a. Social marketing
b. Indirect education
ENVIRONMENTAL LEVEL
18 Revised April 2014
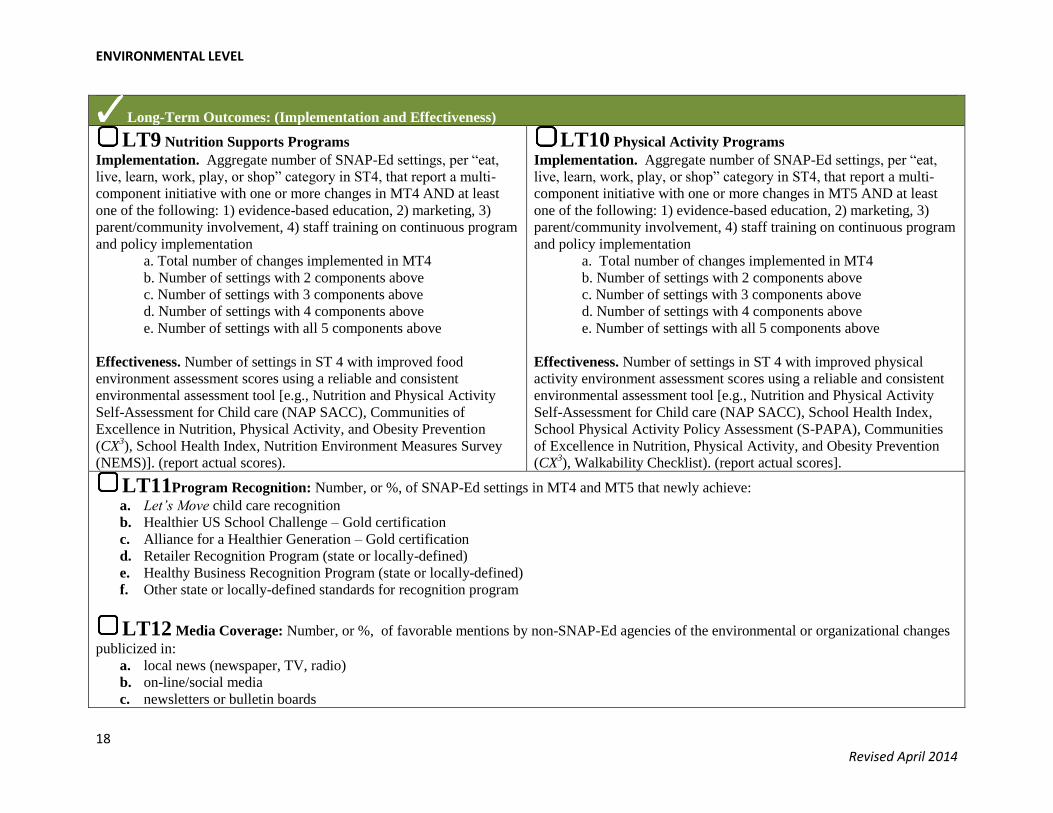
Long-Term Outcomes: (Implementation and Effectiveness)
LT9 Nutrition Supports Programs
Implementation. Aggregate number of SNAP-Ed settings, per “eat,
live, learn, work, play, or shop” category in ST4, that report a multi-
component initiative with one or more changes in MT4 AND at least
one of the following: 1) evidence-based education, 2) marketing, 3)
parent/community involvement, 4) staff training on continuous program
and policy implementation
a. Total number of changes implemented in MT4
b. Number of settings with 2 components above
c. Number of settings with 3 components above
d. Number of settings with 4 components above
e. Number of settings with all 5 components above
Effectiveness. Number of settings in ST 4 with improved food
environment assessment scores using a reliable and consistent
environmental assessment tool [e.g., Nutrition and Physical Activity
Self-Assessment for Child care (NAP SACC), Communities of
Excellence in Nutrition, Physical Activity, and Obesity Prevention
(CX3), School Health Index, Nutrition Environment Measures Survey
(NEMS)]. (report actual scores).
LT10 Physical Activity Programs
Implementation. Aggregate number of SNAP-Ed settings, per “eat,
live, learn, work, play, or shop” category in ST4, that report a multi-
component initiative with one or more changes in MT5 AND at least
one of the following: 1) evidence-based education, 2) marketing, 3)
parent/community involvement, 4) staff training on continuous program
and policy implementation
a. Total number of changes implemented in MT4
b. Number of settings with 2 components above
c. Number of settings with 3 components above
d. Number of settings with 4 components above
e. Number of settings with all 5 components above
Effectiveness. Number of settings in ST 4 with improved physical
activity environment assessment scores using a reliable and consistent
environmental assessment tool [e.g., Nutrition and Physical Activity
Self-Assessment for Child care (NAP SACC), School Health Index,
School Physical Activity Policy Assessment (S-PAPA), Communities
of Excellence in Nutrition, Physical Activity, and Obesity Prevention
(CX3), Walkability Checklist). (report actual scores].
LT11Program Recognition: Number, or %, of SNAP-Ed settings in MT4 and MT5 that newly achieve:
a. Let’s Move child care recognition
b. Healthier US School Challenge – Gold certification
c. Alliance for a Healthier Generation – Gold certification
d. Retailer Recognition Program (state or locally-defined)
e. Healthy Business Recognition Program (state or locally-defined)
f. Other state or locally-defined standards for recognition program
LT12 Media Coverage: Number, or %, of favorable mentions by non-SNAP-Ed agencies of the environmental or organizational changes
publicized in:
a. local news (newspaper, TV, radio)
b. on-line/social media
c. newsletters or bulletin boards

ENVIRONMENTAL LEVEL
19 Revised April 2014
Impacts : (Maintenance)
I3 Resources: Average percentage increase, or number of institutional or community resources invested in nutrition and physical activity
supports or standards at settings in MT4 and MT5
a. Staff [Number of Full Time Equivalents (# FTE)]
b. Cash (Total dollars expended)
c. In-kind support (e.g., volunteers, spacer, equipment)
I4 Sustainability Plan
Number, or % of SNAP-Ed settings in MT4 and MT5 settings with a plan for sustaining, evaluating, and improving the nutrition or physical
activity standards or environmental changes.
I5 Barriers
Number and type of barriers/challenges prevented or mitigated through program implementation (provide examples)
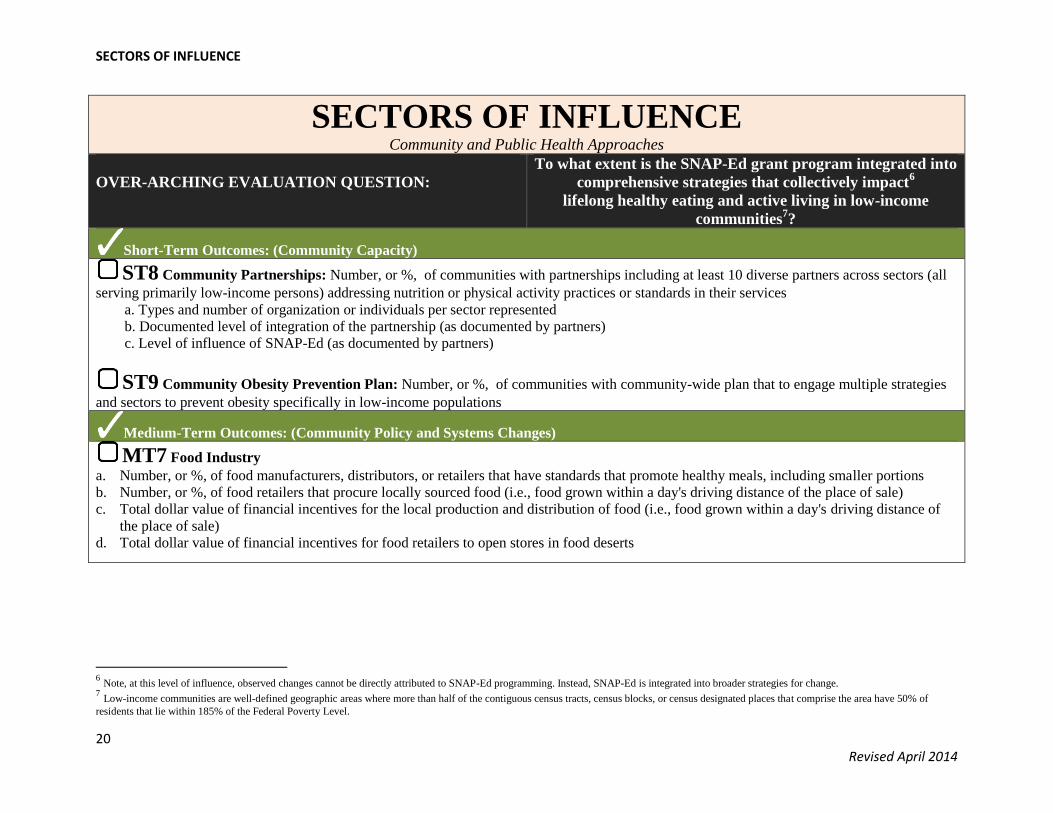
SECTORS OF INFLUENCE
20 Revised April 2014
SECTORS OF INFLUENCE Community and Public Health Approaches
OVER-ARCHING EVALUATION QUESTION:
To what extent is the SNAP-Ed grant program integrated into
comprehensive strategies that collectively impact6
lifelong healthy eating and active living in low-income
communities7?
Short-Term Outcomes: (Community Capacity)
ST8 Community Partnerships: Number, or %, of communities with partnerships including at least 10 diverse partners across sectors (all
serving primarily low-income persons) addressing nutrition or physical activity practices or standards in their services
a. Types and number of organization or individuals per sector represented
b. Documented level of integration of the partnership (as documented by partners)
c. Level of influence of SNAP-Ed (as documented by partners)
ST9 Community Obesity Prevention Plan: Number, or %, of communities with community-wide plan that to engage multiple strategies
and sectors to prevent obesity specifically in low-income populations
Medium-Term Outcomes: (Community Policy and Systems Changes)
MT7 Food Industry
a. Number, or %, of food manufacturers, distributors, or retailers that have standards that promote healthy meals, including smaller portions
b. Number, or %, of food retailers that procure locally sourced food (i.e., food grown within a day's driving distance of the place of sale)
c. Total dollar value of financial incentives for the local production and distribution of food (i.e., food grown within a day's driving distance of
the place of sale)
d. Total dollar value of financial incentives for food retailers to open stores in food deserts
6 Note, at this level of influence, observed changes cannot be directly attributed to SNAP-Ed programming. Instead, SNAP-Ed is integrated into broader strategies for change.
7 Low-income communities are well-defined geographic areas where more than half of the contiguous census tracts, census blocks, or census designated places that comprise the area have 50% of
residents that lie within 185% of the Federal Poverty Level.

SECTORS OF INFLUENCE
21 Revised April 2014
Medium-Term Outcomes: (Community Policy and Systems Changes) (Continued)
MT8 Local Government
a. Number, or %, of local governmental facilities (including SNAP Offices) that interface with the public where there are healthy food
procurement vending standards
b. Number, or %, of local governmental facilities (including SNAP Offices) that provide nutrition education/nutrition resources at the point of
enrollment for public assistance (e.g., office, on-line, telephone)
c. Number, or %, of local governments that create public-private partnerships to provide incentives for the local production and distribution of
food (i.e., food grown within a day's driving distance of the place of sale)
MT9 Agriculture
a. Number of certified farmers markets or direct marketing farmers for every 10,000 residents in low-income communitie
b. Number, or %, of farmers markets or direct marketing farmers that accept SNAP Electronic Benefit Transfer (EBT) in low-income
communities
c. Number, or %, of farmers markets or direct marketing farmers with public-private partnerships that provide bonus incentives programs for
SNAP EBT ($ value of the bonus per individual/household per month)
d. Number, or %, of farm stands or mobile produce carts per 10,000 residents that sell or serve produce in low-income communities
MT10 Education
a. Number, or %, of low-income schools that require K-12 students to be physically active for at least 50% of time spent in PE classes
b. Number, or %, of low-income schools that integrate nutrition education into K-12 academic standards
MT11 Community Design and Safety
a. Number, or %, of parks or open space with improved access, signage, lighting, or operating hours in low-income communities
b. Number, or %, of trails, greenways, or sidewalks with improved access, signage, lighting, or operating hours in low-income communities
c. Number, or %, of low-income areas with community policing initiatives
MT12 Health Care
a. Number, or %, of low-income health care facilities that routinely measure and track patients’ BMI
b. Number, or %, of low-income health care facilities that provide “prescriptions” for physical activity or healthy eating
MT13 Media
a. Number, or %, of media outlets that have practices that promote advertising of healthy food and physical activity
b. $ value of all earned media (annually) in the community for promotion of healthy food and physical activity

SECTORS OF INFLUENCE
22 Revised April 2014
8 Retailer information is protected under the Food and Nutrition Act at 7 U.S.C. 2018 (9) (c) and Title 7 Part 278 of the federal regulations at 278.1 (q). For program evaluation purposes, only
aggregated EBT transactions data for all markets can be reported.
Long-Term Outcomes: (Community Benefits)
LT13 Food Industry Healthy Retail OutletsNumber, or %, of low-income census tracts with a healthy food outlet, defined as a grocery
store or produce stand/farmers’ market that meets WIC nutrition standards
a. Total dollar value (annual) of food sales from locally sourced food in retail settings
LT14 Local Government Healthy Food Sales
a. Percent increase in sales of healthy foods or beverages in local vending facilities
b. Number, or %, of local communities with an active food policy council
LT15 Agriculture Sales: Number, or %, of farmers markets/direct marketing farmers that accept EBT per SNAP beneficiary
a. Annual EBT redemptions8 for all farmers markets/direct marketing farmers that accept SNAP
b. Percent increase in local sales of fruit and vegetables reported by growers
LT16 Educational Attainment: Within low-income schools
a. average third grade reading levels
b. attendance rates
c. dropout rates
LT17 Shared Use Streets and Crime Reduction
a. Total miles of shared-use path, sidewalks and bike lanes, relative to the total street miles in the low-income community
b. Total annual crimes per 10,000 residents
LT18 Health Care Cost Savings: obesity- related medical expenditures ($) per capita
a. Projected reduction in expenses ($)using economic model
b. Actual reduction in expenses ($) using claims data
LT19 Healthy Advertising Number, or %, of media outlets that place restrictions on youth exposure to advertising of unhealthy foods
a. By time of day
b. By program type

SECTORS OF INFLUENCE
23 Revised April 2014
Impact: (Sustainability)
I6 Let’s Move Recognition: # of cities, towns, and counties that achieve the five Let’s Move goals
I7 Regional Food Hubs: Number of food hubs per 10,000 residents, defined as a centrally located facility that aggregates, stores, processes,
distributes and/or markets locally/regionally produced food products
I8 Nutrition in Community General Plan: Number of communities (where residents are primarily low-income) that have achieved a
nutrition or health element in their General Plan

SOCIAL AND CULTURAL NORMS AND VALUES
24 Revised April 2014
SOCIAL AND CULTURAL NORMS AND VALUES OVER-ARCHING EVALUATION QUESTION
To what extent do community-level obesity prevention strategies
impact the public’s priorities, lifestyle choices, and values for
healthy living?
Norms and Values (NV)
NV20 Family Meals (Adults/Head of Household only)
Number, or %, of low-income parents or caregivers that set rules for:
a. Eating meals together
b. Eating meals without television
NV21 Obesity Prevention Beliefs.
Number, or %, of low-income residents who believe their food and activity environments shape and support healthy eating, active living, and
obesity prevention
NV22 Breastfeeding Norms (Adults/Head of Household only)
Number, or %, of low-income community members with positive attitudes toward breastfeeding in public
NV23 Physical Activity
Number, or %, of low-income community members who do not view physical activity or exercise as punishment
NV24 Active Commuting
Number, or %, of low-income residents that use public transportation, walking, or bicycling to travel to and from work on a regular basis

SOCIAL AND CULTURAL NORMS AND VALUES
25 Revised April 2014
References
Blackburn ML, Kaiser LL, Martin AC, West EA, Turner B, Joy AB. Food behavior checklist
effectively evaluates nutrition education. California Agriculture 2006; 60(1):20‐24. Available at:
http://ucce.ucdavis.edu/files/repositoryfiles/ca6001p20‐69226.pdf.
Calhoun A, Mainor A, Moreland-Russell S, Maier RC, Brossart L, Luke DA. Using the program
sustainability assessment tool to assess and plan for sustainability. Prev Chronic Dis.
2014;11:E11
California Department of Public Health. Compendium of surveys for nutrition education and
obesity prevention, Updated 2012. Sacramento, CA: Network for a Healthy California. Available
at: http://www.cdph.ca.gov/programs/cpns/Documents/Compendium%20of%20Surveys.pdf.
Centers for Disease Control and Prevention. Community health assessment and group
evaluation (change) action guide: Building a foundation of knowledge to prioritize community
needs. Atlanta: U.S. Department of Health and Human Services, 2010.
Centers for Disease Control and Prevention. Evaluation Guide: Fundamentals of Evaluating Partnerships.
Atlanta: U.S. Department of Health and Human Services; 2008.
Centers for Disease Control and Prevention. State indicator report on fruits and vegetables,
2013. Atlanta, GA: Centers for Disease Control and Prevention, U.S. Department of Health and
Human Services; 2013. Available at: http://www.cdc.gov/nutrition/downloads/State‐Indicator‐ Report‐Fruits‐Vegetables‐2013.pdf.
Hoelscher DM, Day RS, Kelder SH, Ward JL. Reproducibility and validity of the
secondary level School-Based Nutrition Monitoring student questionnaire. J Am Diet
Assoc. 2003;103:186-194.
Khan LK, Sobush K, Keener D, Goodman K, Lowry A, Kakietek J,et al. Recommended community
strategies and measurements to prevent obesity in the United States. MMWR Recomm Rep.
2009 Jul 24;58(RR‐7):1‐26. Available at:
http://www.cdc.gov/mmwr/preview/mmwrhtml/rr5807a1.htm.
Leeman J, Sommers J, Vu M, Jernigan J, Payne G, Thompson D, et al. An evaluation framework
for obesity prevention policy interventions. Prev Chronic Dis 2012;9:110322. Available at:
http://dx.doi.org/10.5888/pcd9.110322.
Mattesich PW. Evaluation of state nutrition, physical activity, and obesity plans. Atlanta, GA:
Centers for Disease Control and Prevention, U.S. Department of Health and Human Services;
n.d. Available at: http://www.cdc.gov/obesity/downloads/EvaluationofStateNPAOPlans.pdf.
Pronk NP, Hernandez LM, Lawrence RS. An integrated framework for assessing the value of
community‐based prevention: a report of the institute of medicine. Prev Chronic Dis
2013;10:120323. Available at: http://www.cdc.gov/pcd/issues/2013/12_0323.htm.
Sexton, JS. Supplemental nutrition assistance program‐education (SNAP‐Ed) through the land‐grant
university system for FY 2010: A retrospective review. 2013. Starkville, MS.
Story M, Kaphingst KM, Robinson‐O’Brien R, et al. Creating healthy food and eating
environments: Policy and environmental approaches. Annual Review Public Health.
2008;29:253‐72.
Townsend MS, Kaiser LL, Allen LH, Joy AB, Murphy SP. Selecting items for a food behavior checklist
for a limited resource audience. J Nutr Educ Behav 2003;35:69-82.
Townsend M, Sylva K, Martin A, Metz D, Wooten-Swanson P. Improving readability of an evaluation
tool for low-literate clients using visual information processing theories.
J Nutr Educ and Beh. 2008;40:181-186.University of North Carolina Center for Health Promotion and
Disease Prevention. Center for Training and Research Translation Web site. Available at:
http://www.centertrt.org
U.S. Department of Agriculture and U.S. Department of Health and Human Services. Dietary
Guidelines for Americans, 2010. 7th Edition, Washington, DC: U.S. Government Printing Office,
December 2010.

SOCIAL AND CULTURAL NORMS AND VALUES
26 Revised April 2014
U.S. Department of Health and Human Services. Office of Disease Prevention and Health
Promotion. Health People 2020. Washington DC. Available at:
http://www.healthypeople.gov/2020.
U.S. Department of Health and Human Services. 2008 Physical Activity Guidelines for Americans.
October 2008.


