
WETTABILITY OF LOW SN SOLDERS ON
INTEGRATED CIRCUIT PACKAGE METALLIZATIONS
by
Michelle Wendy Gabriel
B.S., Massachusetts Institute of Technology(1982)
Submitted to the Department ofMaterials Science and Engineering
in Partial Fulfillment of theRequirements of the
Degree of
MASTER OF SCIENCE
at the
MASSACHUSETTS INSTITUTE OF TECHNOLOGY
June 1983
OMichelle W. Gabriel 1983
The author hereby grants to M.I.T. permission to reproduceand to distribute copies of this thesis document in whole orin part.
Signature of Author:Department of Materials Science and Engineerin4, 6 May 1983
Certified by
Accepted by:
Nicholas J. GrantThesis Supervisor
/I
Robdrt W. BalluffiChairman, Departmental Committee
ArchivesMASSACHUSETTS INSTITUIt
OF TECHNOLOGY
JUN 23 1963
I RRFARIES
WETTABILITY OF LOW SN SOLDERS
ON INTEGRATED CIRCUIT PACKAGE METALLIZATIONS
by
MICHELLE WENDY GABRIEL
Submitted to the Department of
Materials Science and Engineering
May 6, 1983 in partial fulfillment of the requirements
for the Degree of Master of Science
ABSTRACT
Sessile drop experiments were performed on six types ofsubstrates (bulk Cu, bulk Ni, bulk Au, evaporated layers ofCrCu and CrCuAu on silicon wafers, and plated layers of NiAuon screened Mo frit) with 9 Pb-Sn solder compositions rangingfrom 0 to 5%Sn. Samples were held in nitrogen for 2 minutes30 seconds above 315*C, with a peak temperature of 345*50 C. Area of spread and contact angle measurements weremade to determine wettability. Statistical analysis of thedata confirmed the observations that wettability is affectedby Sn content, substrate material, and an interaction effectof the two. A general trend of increasing wettability withincreasing Sn content was seen on all substrates. Cu, CrCu,and CrCuAu were relatively insensitive to changes in Sncontent as compared to the other substrates. The MoNiAustructure wet to a greater extent and showed a greatersensitivity to changes in Sn content than any of the othersubstrates tested. The effects of surface preparation and Ausurface concentration were studied as possible causes of thishigh wettability.
Thesis Supervisor: Nicholas J. Grant
Title: Professor of Materials Science and Engineering
TABLE OF CONTENTS
Page No.
ABSTRACT ---------------------------------------
LIST OF ILLUSTRATIONS --------------------------
LIST OF TABLES ---------------------------------
ACKNOWLEDGEMENTS -------------------------------
INTRODUCTION -----------------------------------
BACKGROUND -------------------------------------
System DefinitionSurface Cleanliness and FluxesSurface InhomogeneitiesPrevious Studies
EXPERIMENTAL PROCEDURE -------------------------
MaterialsSample PreparationCleaning ProceduresApparatusTest ProcedureMeasurement MethodsMeasurement Procedure
RESULTS AND ANALYSIS ---------------------------
ResultsStatistical AnalysisSources of Error
DISCUSSION AND CONCLUSIONS ---------------------
FUTURE WORK ------------------------------------
REFERENCES -------------------------------------
2
4
5
6
7
9
9151820
26
26303132373942
44
445761
64
69
71

LIST OF ILLUSTRATIONS
Page No.
Figure 1
Figure
Figure
Figure 4
Figure
Figure
Figure
Figure
Figure
Figure
Controlled Atmosphere Hot Stage
Function Diagram for Closed LoopHot-Stage Heating Apparatus
Area of Spread Testing Apparatus
Experimental Temperature Profile
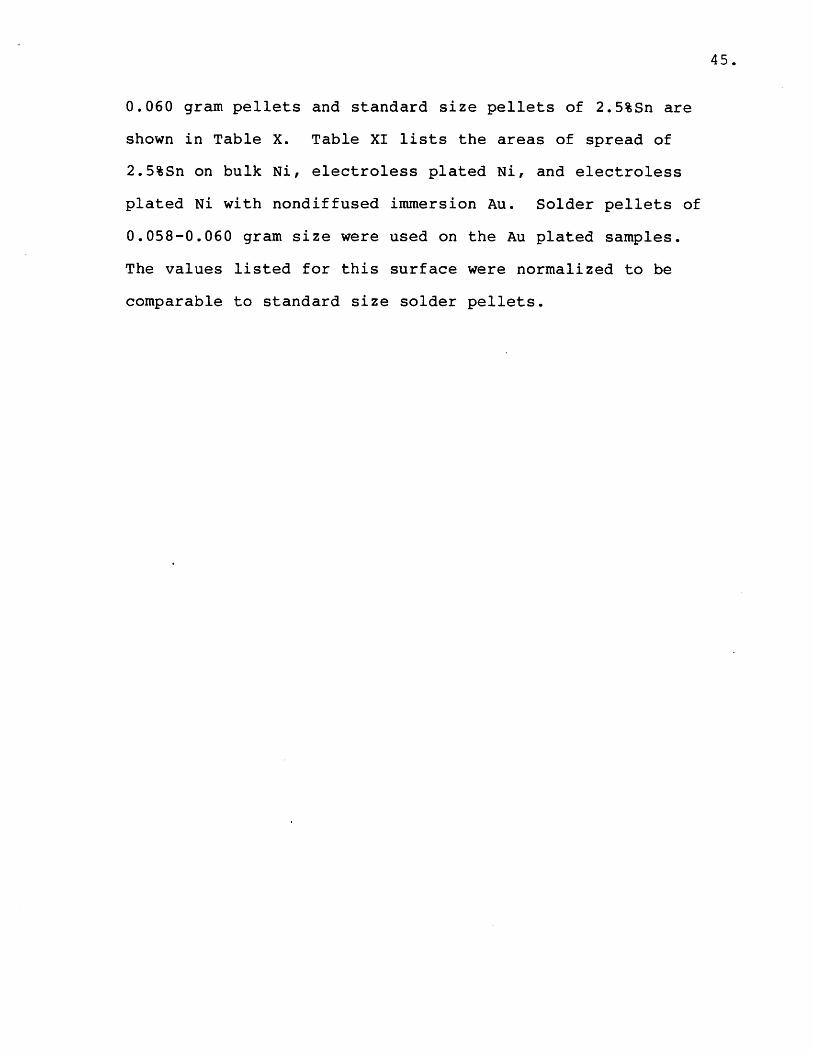
Wettability as a Function of PercentTin: Bulk Cu
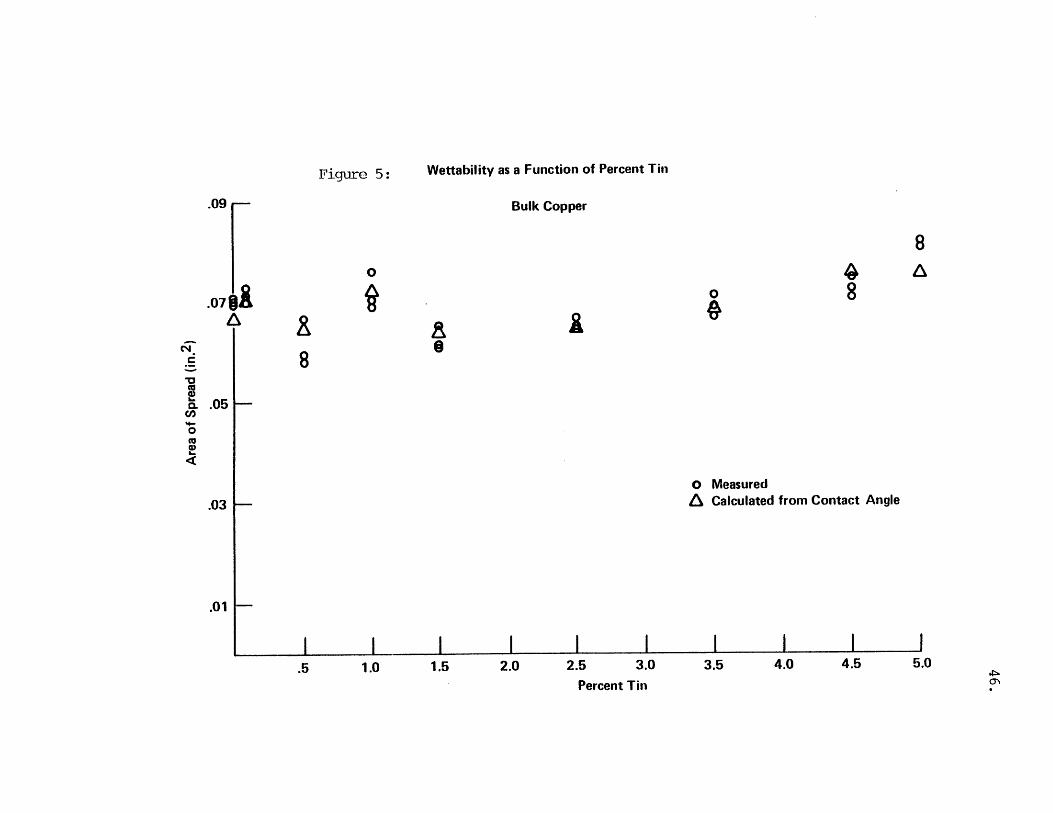
Wettability as a Function of PercentTin: Bulk Ni
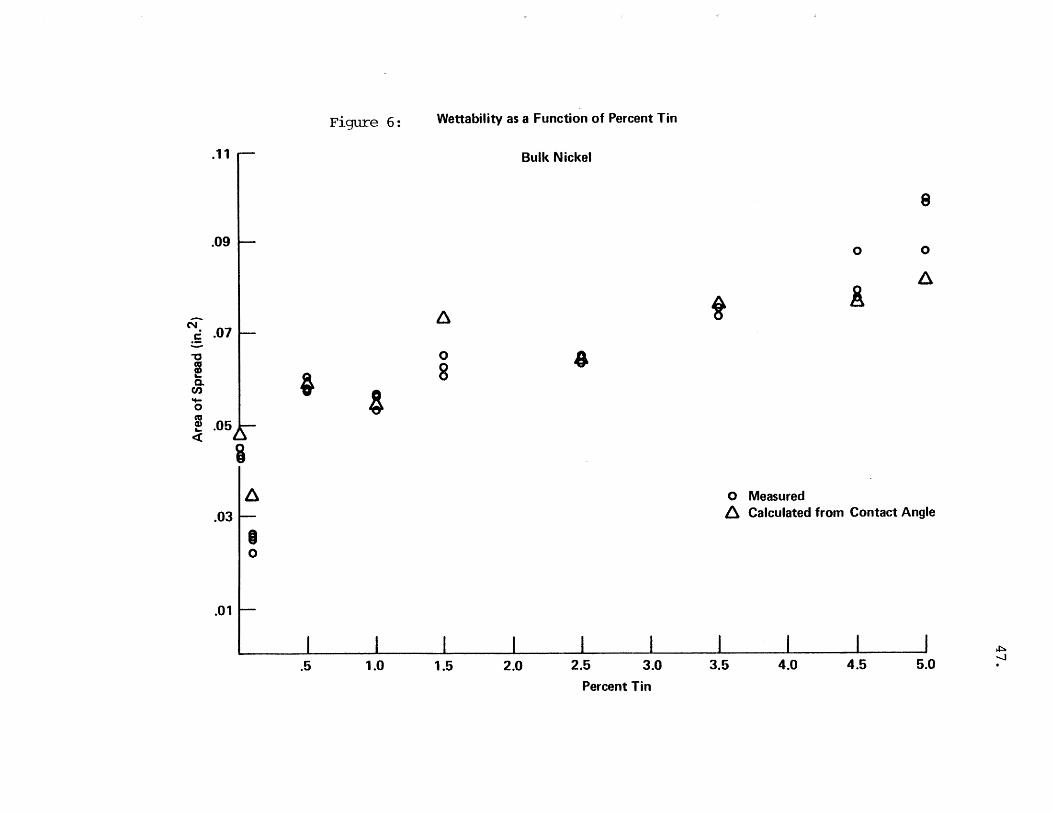
Wettability as a Function of PercentTin: CrCu on Silicon Wafer
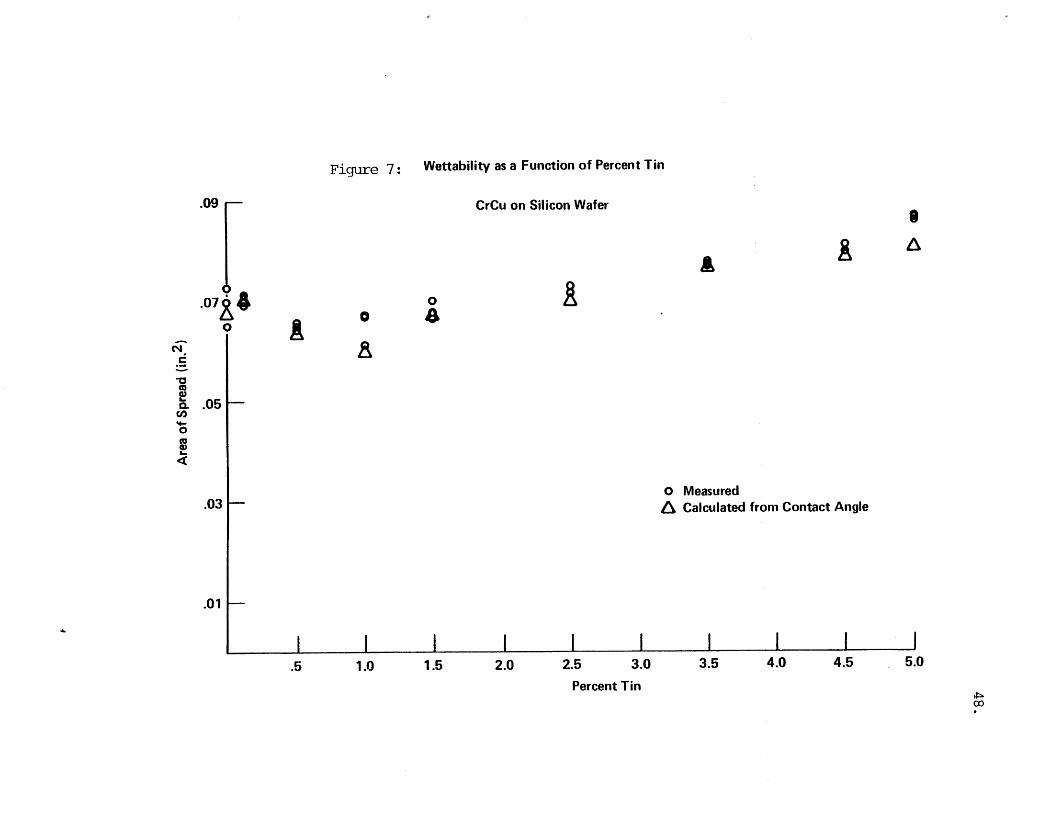
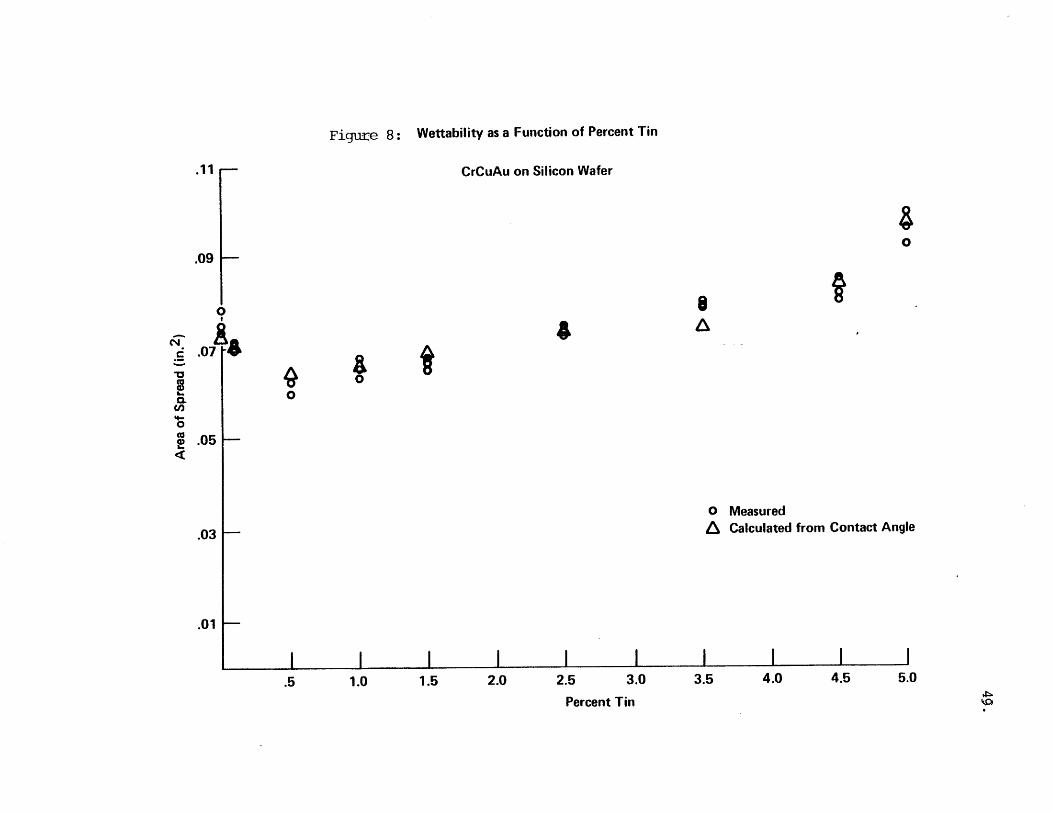
Wettabiliy as a Function of PercentTin: CrCuAu on Silicon Wafer
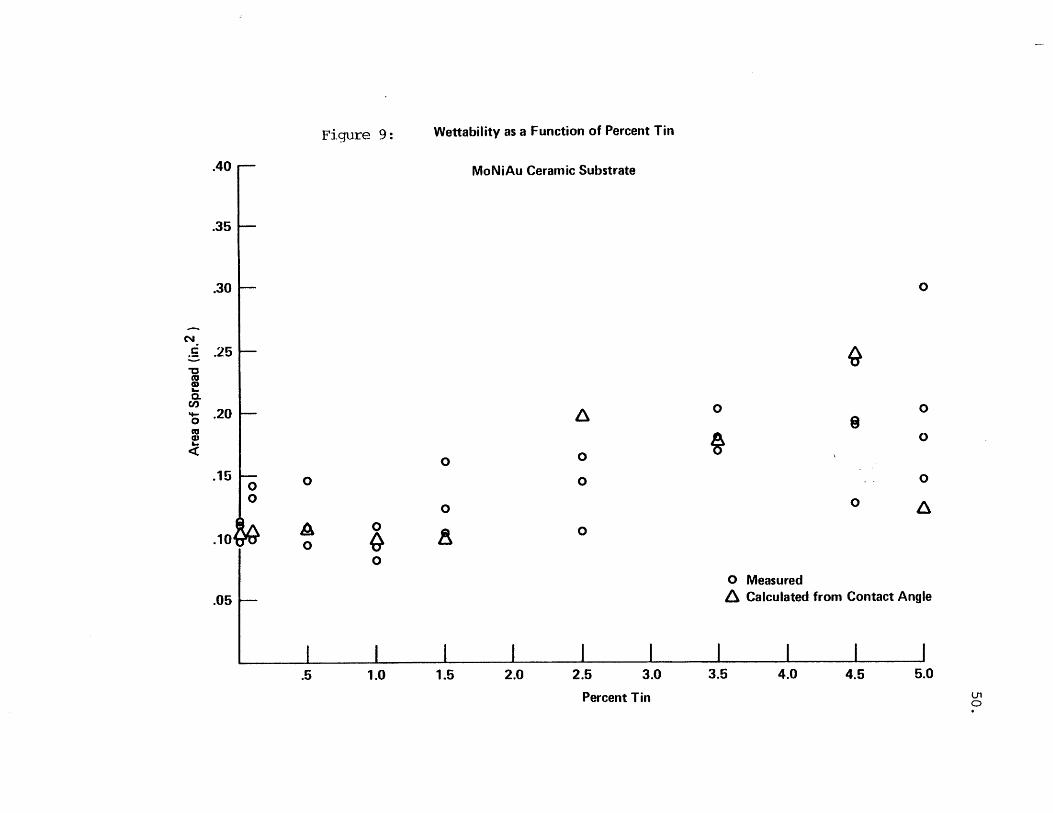
Wettability as a Function of PercentTin: MoNiAu on Ceramic Substrate
9
10 Diagramatic Representation of SolderPool on Fluxed Metal Surface
36
46
47
48
49
50
65
LIST OF TABLES
Table No. Page No.
I Pellet Composition 28
II Layered Substrate Composition 29
III Area of Spread on Copper 51
IV Area of Spread on Nickel 51
V Area of Spread on CrCu 52
VI Area of Spread on CrCuAu 52
VII Area of Spread on MoNiAu 53
VIII Measured Contact Angle and 54Calculated Area of Spread
IX Area of Spread on Copper 55Cleaned with HC1 and HNO 3
X Area of Spread of 2.5%Sn Small 55Pellets and 2.5%Sn StandardSize Pellets on CrCuAu
XI Area of Spread of 2.5%Sn on Bulk 56Ni, Plated Ni, and Plated Niwith Non-Diffused Immersion Au
XII Analysis of Variance Results 59
XIII Significant Regress ls
ACKNOWLEDGEMENTS
Technical Advice:
Apparatus:
Metallography:
Measurements:
Pellet Analysis:
Auger Analysis:
Chemicals:
Statistics:
Plating:
Wafers:
Moral Support:
Jose OrdonezKeith BeckhamPete BrofmanVince MarcotteKarl PuttlitzVlasta BrusicNorm Ainsley
Herb WenskusAndy Downing
Pete TubiolaCharlie HerringBill King
Howard FrootMarty Ricker
Andy SzuleClaude WilsonKaren PopekDoug Falcon
Bob Lewis
Nunzio DiPaoloJanet Duffy
Todd Thomas
Mike PowersChuck HauerwasArnold SchmeckenbeckerTony ArnoldSheila LevyDick Green
Sid Boyar
Dick WelshFritz Van HelsinkDieter RennhackDick CoulardTerri MillerMark LaKritzEdith HalsteadLina Janavicius
INTRODUCTION
In industry there are numerous methods for attaching an
integrated circuit chip to a ceramic substrate. One such
method is through the use of a solder connection between
terminal metals on the chip and substrate.
The substrate materials evaluated in this study were
chosen for their similarity to actual metallizations which
are soldered at IBM. Six types were used: bulk Cu, bulk
Ni, bulk Au, blanket evaporated layers of CrCu and CrCuAu on
silicon wafers, and blanket plated layers of NiAu on alumina
screened with molybdenum frit. The solder pellet
compositions were chosen as follows: O%Sn, 0.1%Sn, 0.5%Sn,
1.0%Sn, 1.5%Sn, 2.5%Sn, 3.5%Sn, 4.5%Sn, 5.0%Sn, and balance
Pb. This range of compositions was chosen based on current
product use of 5.0%Sn.
In an effort to explain some of the results, four
follow-up experiments were performed. First, large scatter
in the MoNiAu results and the normalization factor used to
make those results comparable were studied. Wettability
tests were made with small size pellets of 2.5%Sn on CrCuAu
substrates since these substrates showed the least scatter.
Experiments concentrating on surface conditions were
also run. Alumina substrates with screened molybdenum frit
were both Ni plated and Ni plated followed by immersion Au
plating with no Ni/Au diffusion. Tests using 2.5% Sn were
run on these parts so that bulk and plated Ni results could

8.
be compared along with the effect of Au on wettability.
Finally, the effect of cleaning Cu with 10% HC1, as opposed
to 10% HNO3, was observed using 2.5%Sn and 5.0%Sn.
BACKGROUND
SYSTEM DEFINITION
Wettability is a phenomenon that has been extensively
studied since the early 1800's. Unfortunately, work on the
subject is clouded in confusion due to a lack of universally
agreed upon definitions and terms applied to wetting and its
conditions. Also, much of the initial work performed on
actual systems is invalid since the purity and cleanliness
of the metals, surfaces, and atmospheres were not carefully
controlled.(1)
The conditions of wetting can be described
mechanistically by Young's equation:
YLV cos8 = ySV - YSL (1)
where e is the contact angle between the solid surface and
the tangent to the liquid surface at the contact point.(2)
Wetting is usually defined in terms of this anglee :
"wetting" or "partial wetting" at 0 <900, "nonwetting" at
(3)8>90*, and "complete wetting" or "spreading" for 0.(3)
There is much dispute in the literature as to a
definition of the "y" terms in Young's equation that is both
mechanistically and thermodynamically consistent. Johnson
reviewed the literature and concluded that y is a surface
tension, not a surface free energy, although the two can be
(4)related. Therefore, in equation i, YLV YLS. and YSV
10.
are defined as surface tensions of the liquid/vapor,
liquid/solid and solid/vapor interfaces.
Gibbs derived Young's equation for the case of a drop
of liquid small enough to neglect gravitational
effects. (5 ) In the 1950's Johnson defined Young's
equation, the effect of the gravitational field, and the
effect of curvature on pressure as necessary conditions to
be considered for total mechanical equilibrium. (4 ) The
action of the pressure can be seen in the curved liquid
surface at the line of contact with the solid.(6)
It should be noted that for chemical equilibrium the
total free energy, not merely the free surface energy, of
the system must be at a minimum.(4 ) Since the liquid is
mobile, it will always contract to form a spherical drop
which has a minimum of surface free energy. The surface
layers, however, will also rearrange themselves to minimize
internal bond energy. (6 ) Milner writes that the
constituent which has the lowest surface free energy in the
pure state will segregate to the surface of the mixture.
Thus, the addition of a lower surface energy liquid to a
higher one should markedly lower the latter's energy. This
effect can be seen in many systems including Pb-Sn, Zn-Al,
Mg-Al and Mg-Zn.
The major use of equation 1 is to help predict wetting
behavior between a solid and a liquid. Another term
commonly used for this purpose is the spreading coefficient
11.
S , where S is the difference between the work of
adhesion,WA, and the work of cohesion, WC:
C = 2YL (2)
A = YS + YL -YLS (3)
SV S = YS + YL- IS (4)
The WA term must be negative for wetting to take place
spontaneously and SVS must be positive for spreading to
occur. (8,9)
The aforementioned treatments of wetting assume that
the solid and liquid are nonreactive and there is no mass
transport across the smooth, planar interface. In this case
the free energy changes driving the wetting are only
associated with changes in interfacial area.(1 0 ) If
reactions do occur, such as formation of solid solutions or
intermetallic compounds, then chemical reactivity, and the
changing nature of the bonding surface, including the loss
of planarity, must also be taken into account.(11 )
Although there is a reaction between the solid and the
liquid, at the first instant of formation of an interface,
it behaves like the nonreactive systems. That is, the
decrease in the free energy of the system is attributed to
the decrease in the free energy of the interfacial
areas.(10) When the solid is undersaturated with some
component of the liquid, as in the formation of a compound
at the interface, the change in free energy depends on the
rate of reaction. (12 ) If the driving force for wetting
exceeds the surface energy of the liquid, spreading will
12.
occur. (12 ) When the liquid is undersaturated relative to
a component in the solid, spreading does not occur and 8
will change as YLV changes.( 12 )
Bailey and Watkins write that alloying is essential for
wetting to occur, although alloying energy is not the
driving force of the wetting reaction.(11) The alloying
can take place on a very small scale, such as a few atom
layers adjacent to the base metals. (6 ) Thus, even a very
low solubility between the liquid and solid should allow for
some wetting.
The importance of the various interfacial tensions on
wetting can be seen from equations 1 and 4 and much effort
has been spent on their accurate determinations. Both
experimental and theoretical approaches have been used, with
the theoretical methods attempting to relate known physical
or thermodynamic properties to surface tension and energies.
Although there are no universal techniques for finding YLV
of all materials, the sessile and pendant drop methods are
accurate over a wide range of temperatures for liquid metals(13)and alloys. Weyl found for pure metals in general YLV
decreases as the atomic radius increases within a given
group of the Periodic Table, and within corresponding groups
of metal derivatives. Data by Hoar and Medford were
consistent with a modified form of the classical regular
solution model which relates the surface tension of a binary
mixture to the surface tension of the pure components and
(14)the heat of mixing.
13.
Both YSV and YLS are difficult to determine by either
experiment or calculation. Many methods have been devised
to measure YSV ; however, they have been plagued by faulty
logic, mathematical errors, and narrow conditions of
(13)applicability. Calculations of YSV based on atomic
bonding energies are only approximate, such as Wassink's
derivations of the relation:
YSV = AH / 4 (molar surface area) (5)
where AHV is the heat of vaporization. (1 5 ) Jones reviewed
experimental and theoretical methods for finding YSL between a
crystal and its melt. (16 ) Measuring of the dihedral
angles at grain boundaries can only be used if the values of
YSV and YLV are known. An approximate value of YSL can be
calculated from values of the heat of alloying.(1 5 )
The three interfacial energies are not independent of
each other and thus their effects on wettability cannot be
studied singly. For example, as discussed previously,
additions of Pb to Sn will decrease YLV " Equations 1 and 4
show that as YLV increases, wettability should decrease;
instead it increases. Harvey describes his work with Pb-Sn
alloys on iron and found that in alloys up to 62.5% Sn, the
decrease in YSL is controlling as opposed to high Sn alloys
where the effect of lower TSL is overshadowed by higher
YLV (8) The magnitude of YSL is dependent on the
degree of chemical bonding. (1 0 ) As the amount of the
reactive component of the alloy increases, TSL decreases and
approaches either YSV or YLV , whichever is lower.( 1 0 )

14.
Thus, mixing of second components into a liquid can effect
its wetting ability by changing surface tension, interfacial
free energy, or both. (1)
15.
SURFACE CLEANLINESS AND FLUXES
Surface cleanliness is a critical determinant of
wetting behavior. Hawkins and Feldman concluded that all
liquids should spread spontaneously on completely clean
metal and other solids with high surface free
energies. (1 7 ) The behavior of Pb on Fe illustrates this
point: Pb will not wet on iron in air but will wet iron
that has been scratched in vacuo, even though Pb and Fe are
immiscible.(9)
Surface oxides and adsorbed gas layers on the solid
will prevent or hinder wetting by lowering the solid surface
tension and increasing the liquid/solid interface
tension.(1' 9 ) This effect is often not complete and
permanent, however, due to diffusion of the liquid into or
though the metal-oxide interface.(1) The presence of an
adsorbed surface layer will not prevent wetting completely
if there is any interaction between the two unlike
metals.
Three methods are used to remove oxide films and
adsorbed gases: heating in a reducing atmosphere, heating
in a vacuum, or fluxing the system.(6) The maximum
cleaning effect is often found with fluxes, whose primary
purpose is to promote contact between the molten metal and
solid surface by removing the metal oxide film and
preventing reoxidation.(18)
Fluxes are classified by the nature of their residues:
corrosive, intermediate, and noncorrosive.(19) Corrosive
16.
or acid fluxes are composed of inorganic acids and salts,
such as zinc chloride. Intermediate fluxes consist of mild
organic acids and bases and certain of their derivatives.
Noncorrosive fluxes are generally white water resin
dissolved in an organic solvent. They contain abietic acid
and become activated resin fluxes on the addition of small
amounts of organic halides. Due to their fluxing power and
low risk of corrosion, activated resin fluxes are used in
electronic work.(19)
In addition to using acids to dissolve oxides, fluxes
influence wetting behavior by altering surface tensions.
Studies on Pb-Sn alloys show that both corrosive and
noncorrosive fluxes reduce the surface tension of liquid
solder to below that in its own vapor or in the presence of
hydrogen. (14 ) This effect may be due to the absorption of
a component of the flux at the liquid-liquid
interface.(14)
Lowering the liquid surface tension should reduce the
contact angle if the other two surface tensions remain
unaltered. On the addition of a flux, however, the
solid/vapor interface no longer exists since the flux layer
covers the metal. Also, resin based fluxes oxidize at
soldering temperatures, which would affect all metal-flux
interfacial tensions during heating.( 20 )
Besides direct contact, the fluxing agent can modify
surface tension by "pretinning". The solder-flux-metal
system can form a galvanic cell when fused fluxes containing
17.
molten salts are used, as was first demonstrated by Latin on
a solder-chloride flux-copper system. (9 ,21 ) Local cell
formation has also been found with tin-flux-iron
systems. (9 ) Tin may be deposited by electrolytic action
in front of the advancing solder, which will ensure a high
substrate/flux interfacial tension and improve
wetting. (11)
The use of flux for removal of oxides and absorbed
layers, and for lowering the surface tensions through direct
contact, and pretinning: all increase wetting. Clearly,
the appearance and strength of these phenomena are dependent
on the fluxing agent chosen (corrosive, intermediate, or
noncorrosive) and the degree of contamination or oxidation.
18.
SURFACE INHOMOGENEITIES
Surface inhomogeneities due to energetic and physical
causes have a distinct effect on wettability. (22 ) In
general, these are not independent properties of real
surfaces. If any reaction occurs between the liquid and
solid, not only is the chemical nature altered but also the
physical orientation of the surface is changed.
The first'treatment of the effects of surface
roughness, commonly called Wenzel's equation, was made in
1936. Wenzel stated that:
r(S - SSL) = SLCos (6)
where SS , SSL, and SL are surface tension values and r
is the ratio of the area of the actual surface to that of a
smooth surface having the same geometric size and
shape.(23)
This equation implies that behavior on a rough surface
is increased over that on a smooth one. (6 ) It is
important to note, though, that the slopes and angles of the
surface asperities determine "r", not the heights of
corrugations. Wenzel sites experimental work showing no
change in wetting with a 100x change in asperity
height. (24 ) Thus, r cannot be measured by surface
profiles.
Wenzel's equation does not account for contact angle.
hysteresis, i.e. the angle of the liquid, as it spreads
19.
outwards, exceeds the angle of the liquid as it retracts.
In 1948, Cassie extended Wenzel's equation to :
cos = a cosa1 + a2cos82 (7)
where + is the contact angle of a heterogeneous surface and
a1 and "2 are fractions of the surface having the
intrinsic contact angles 81 and 8 2 respectively. (25) In
this case, hysteresis is explained by changes in a1 and a2 as
the liquid advances and recedes.
Shuttleworth and Bailey showed that Wenzel's equation
is only applicable to cases of general roughness and not to
a surface consisting of parallel grooves.(26) Grooved
systems have been the emphasis of recent work since
equilibrium can be obtained at a number of positions and may
be a reason for contact angle hysteresis. 17 ) Thus, the
effect of surface heterogeneities can only be measured by
studying very specific geometries and not on samples
representing typical industrial surfaces.
20.
PREVIOUS STUDIES
Much previous work has been performed on the specific
solder-base metal systems discussed in this thesis. The
following is a review of the results of other research. The
topics covered include results of area of spread tests,
immersion or flooding tests, capillary penetration tests,
and surface tension measurements.
All of these tests offer some measure of wettability.
The area of spread and contact angle measurements are
described in detail in the Measurement Methods section of
this thesis. Immersion or flooding tests consist of
immersing a specimen in solder for a given time using a
tilting furnace. (11) Capillary penetration tests measure
a penetration coefficient of solder which flows between
prefluxed and preheated flat horizontal plates. The general
trends found using these methods, however, often contradict
each other since different surface tension properties are
being measured. For example, area of spread tests measure 8
while capillary flow tests measure YLVCOS e .(27)
In addition to studying composition variables, work has
also been done on other experimental variables; accordingly,
results of some studies of the effects of time and
temperature on wettability will be covered.
It should be noted that reports of nonwetting in the
older data should not always be accepted. This behavior may
be due to experimental artifacts such as surface films and
contaminants.
21.
Nickel and Gold Plated Nickel
Bailey and Watkins performed immersion tests of Ni into
pure Pb. Pure Pb showed no wetting (i.e. 8 >00) or initial
spreading on Ni in hydrogen at temperatures lower than
3580C.(ll) From 358 0C-7000 C, Pb forms a solid solution
with Ni and will wet it. The effects of time (0-25 minutes)
and temperature (300 0 C-5000 C) of immersion on the wetting
of Ni by Pb are plotted to show what ranges of time and
temperature are needed to produce a stable Pb coating on Ni.
An extreme case of contact angle hysteresis was found at
500 0 C, where on immersion of Ni into Pb, the contact angle
exceeded 900 but was 00 upon withdrawal. Also at this
temperature, tin-lead alloys showed contact angles of 300
Experiments have also been reported on the wettability
of pure Sn on Ni. Bailey and Watkins found good wetting at
temperatures above 400 0C in hydrogen.(11 ) Tammann and
Ruhenbeck also performed tests in hydrogen and found no
wetting at temperatures lower than 340 0C and good wetting
above 358*C.(1)
In a more recent study, Feldstein and Thomas in 1979
reported contact angle measurements of 60/40 solder onto
electroless Ni-B and Ni-P deposits with and without
flux. (2 8 ) Contact angles of 32-560 were found on fluxed
Ni deposits. In addition, tests on nickel sheet showed
angles of 450
22.
Harding and Pressly reviewed some work on soldering to
Au plating over Ni and its alloys. (29 ) He theorized the
cause to be due to the poor solderability of the base
metal. (29 ) Many other researchers, however, found that if
Ni and its alloys were properly cleaned before plating, they
were readily soldered.( 29 )
Copper
There is an extreme amount of variability of results
found in the literature on copper soldering. For example,
four independent measurements of a 60/40 alloy on clean
copper with pure resin flux reported the contact angle to be
110-13j, 150, 240, and 56. (20) Therefore, it is
more productive to examine trends and ranges of wetting
behavior rather than absolute numbers.
In 1948 using capillary penetrations tests, Latin
measured penetration coefficients of tin-lead alloys on
copper. (21 ) His results show the lowest coefficients with
low Sn contents and the highest coefficients with pure Sn.
He also found that the penetration coefficients were little
affected by changes in flux but increased linearly with
increasing amounts of superheat. From these results, it
could be predicted that of the Pb-Sn alloys, pure Sn should
wet the most on copper, and this wetting should increase as
the superheat increases. Contradictory results are found,
however, in area of spread tests.
23.
Bailey and Watkins measured the effect of Sn
concentration on the spreading of Sn-Pb alloys on copper in
hydrogen at 250 0 C, 300 0 C, 350 0C, and 400C (11) In
general, the wettability is seen to increase to some maximum
value at intermediate values of Sn, and then steadily
decrease. These peaks in area of spread occur at higher tin
contents as the temperature increases. The 400 0 C curve
shows only a slight change in area changing Sn content,
while the 250 0 C curve shows dramatic changes.
Unfortunately, testing all alloys at the same
temperature may present misleading trends. Since the
liquidus temperatures of the alloys vary with Sn content,
the superheat and therefore the fluidity also vary. Since
the variable of fluidity is uncontrolled, no conclusions
about the effect of any variable can be made.
Bailey and Watkins also present work done on the
spreading of Sn-Pb alloys on copper in a zinc ammonium
chloride flux for superheats of 600 C, 100 0 C, and
1500C.(ll) Similar behavior is seen here: the area of
spread increases to a maximum at the intermediate range of
Sn contents and then decreases. The maximum spreading in
this case is found at around 50% Sn, as opposed to maxima in
the range of 35%-65% Sn in the previous case. A general
trend of decreasing wettability with increasing superheat
can be readily seen in this example.
Besides the effects of temperature and superheat,
Bailey and Watkins also studied the variable of time in the
24.
(11)solder-copper-hydrogen system. Drops of solder alloys
of less than 30% or greater than 70%Sn showed little or no
change of shape after 30 minutes at temperature. From 30-
70%Sn, however, an increase of drop diameter was observed.
The strength of the effect was very dependent on the
composition of the solder alloy 40-50 %Sn alloys at a 600 C
superheat and observed no significant change in area over a
1/2 to 4 minute time period. 18 )
In all of the above studies a contact angle greater
than 0O and less than 900 was found. This is interesting
in light of surface tension and solubility data. By
measurements of grain boundary grooving, Bailey and Watkins
reported the surface tension of solid Cu to be 1800 dynes/cm
at 800-900 0 C. In the presence of Pb vapor, the solid Cu
surface tension drops to 780 dynes/cm. (30 ) Fisher and
Dunn also reported a value of 760 dynes/cm for Cu in the
presence of Pb vapor. (31 ) A value of 420 dynes/cm can be
calculated for Cu in the presences of Pb vapor at
3500C. (31 ) This value is nearly identical to the surface
tension of liquid Pb under the same conditions. (31 ) These
low results suggest that under the selected test conditions,
a complete monolayer of Pb atoms was deposited on the
Cu.(31)
Bailey and Watkins also measured a solid metal/liquid
metal surface tension of 340 dynes/cm for a Cu-Pb-hydrogen
system at 800-9000C.( 30 ) Given the surface tension
25.
values of solid Cu in vacuum and the solid/liquid
interfacial tension, the Pb should spread completely. (I )
Thirty to forty degree contact angles of Pb on Cu have
been measured though, and may be accounted for by an
absorbed layer of Pb. In this case, however, poor adhesion
might be expected. Bailey and Watkins observed that
although pure Pb failed to wet Cu or Fe in a smooth
continuous layer, the adhesion was strong when it was
allowed to solidify in contact with either. (11) Although
the solubility of Pb in Cu is very low, Howes and Saperstein
did measure a reduction in the thickness of a piece of Cu
immersed in pure Pb at 360°C for 300 seconds. (32 ) A
balance of surface tensions and solubility may account for
the reported contact angle of pure Pb on Cu.
26.EXPERIMENTAL PROCEDURE
MATERIALS
Pellets
Solder pellets were obtained from Indium Corporation of
America, Utica, NY. The vendor processing consisted of
making a chill cast ingot of the solder alloy, rolling the
ingot into a sheet, and punching pellets from the sheet.
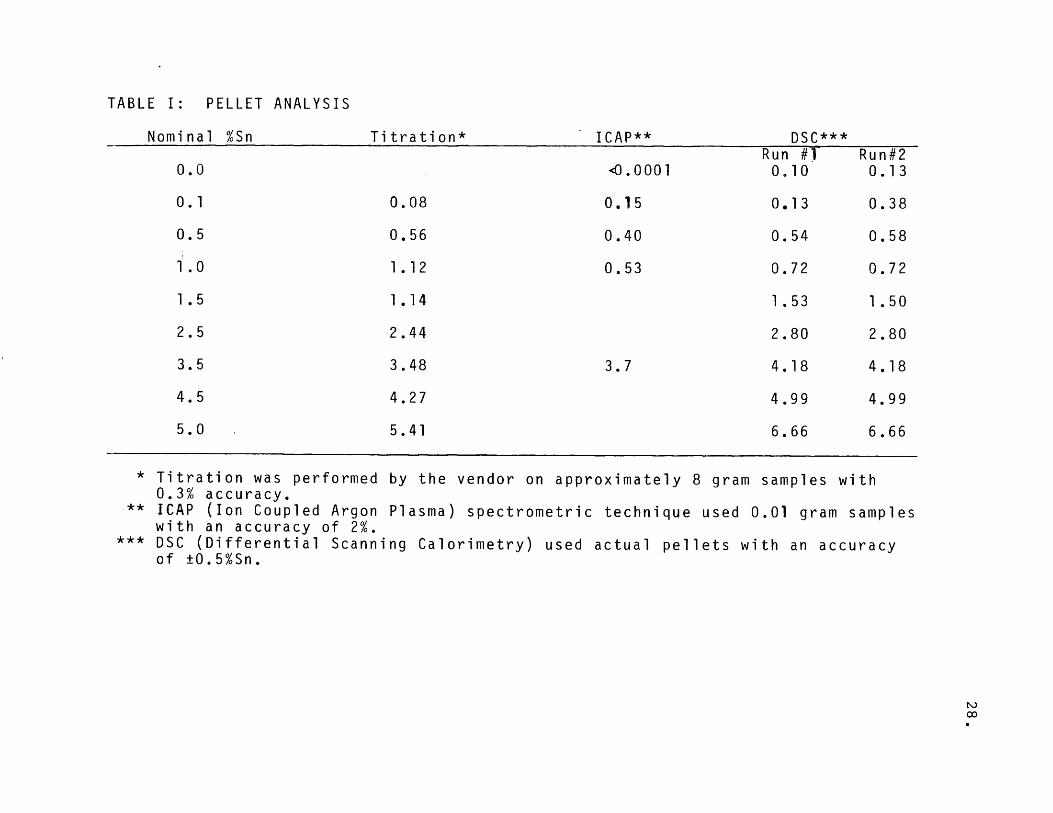
Table I lists the compositions requested and some measured
compositions.
Based on a 90 sample lot, 10 pellets of each
composition, the average weight per pellets was found to be
0.3105 gram (0.011 ounce) with a standard deviation of
0.0034 gram (0.00012 ounce). This uniformity of weight was
then assumed for all pellets used.
Substrates
Ten mil (0.0254 cm) thick strips of 99.999% pure Cu,
Ni, and Au were obtained from Research Organic/Inorganic of
Belleville, NJ. Layered substrates of CrCu, CrCuAu, and
MoNiAu were manufactured by IBM/East Fishkill. Table II
lists the methods of metal deposition for these
substrates.
The CrCu and CrCuAu substrates see no further
processing after metal deposition. The MoNiAu substrates,
however, go through one Mo/Ni diffusion and one Ni/Au

27.
diffusion step. The thickness of the plated metals is often
uneven and will cause the alloy composition and depth to
vary from sample to sample and within one sample.
I: PELLET ANALYSIS
minal %Sn Titration*
0.08
0.56
1.12
1.14
2.44
3.48
4.27
5.41
TABLE
No ICAP**
<0.0001
0.15
0.40
0.53
3.7
* Titration was performed0.3% accuracy.
** ICAP (Ion Coupled Argonwith an accuracy of 2%.
*** DSC (Differential Scanniof ±0.5%Sn.
by the vendor on approximately 8 gram samples with
Plasma) spectrometric technique used 0.01 gram samples
ng Calorimetry) used actual pellets with an accuracy
DSC***Run #10.10
0.13
0.54
0.72
1.53
2.80
4.18
4.99
6.66
Run#20.13
0.38
0.58
0.72
1.50
2.80
4.18
4.99
6.66
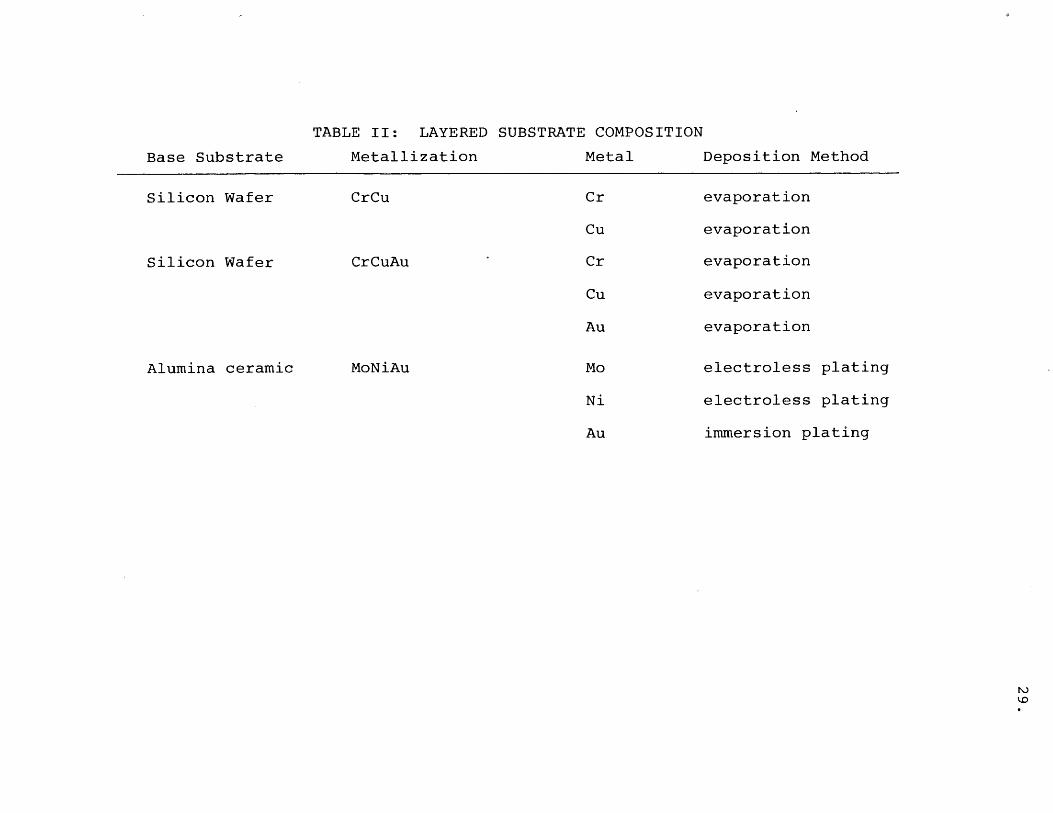
TABLE II: LAYERED SUBSTRATE COMPOSITION
Base Substrate Metallization Metal Deposition Method
Silicon Wafer
Silicon Wafer
Alumina ceramic
CrCu Cr
Cu
CrCuAu
MoNiAu
Cu
Au
Mo
Ni
Au
evaporation
evaporation
evaporation
evaporation
evaporation
electroless
electroless
immersion plating
plating
plating
30.
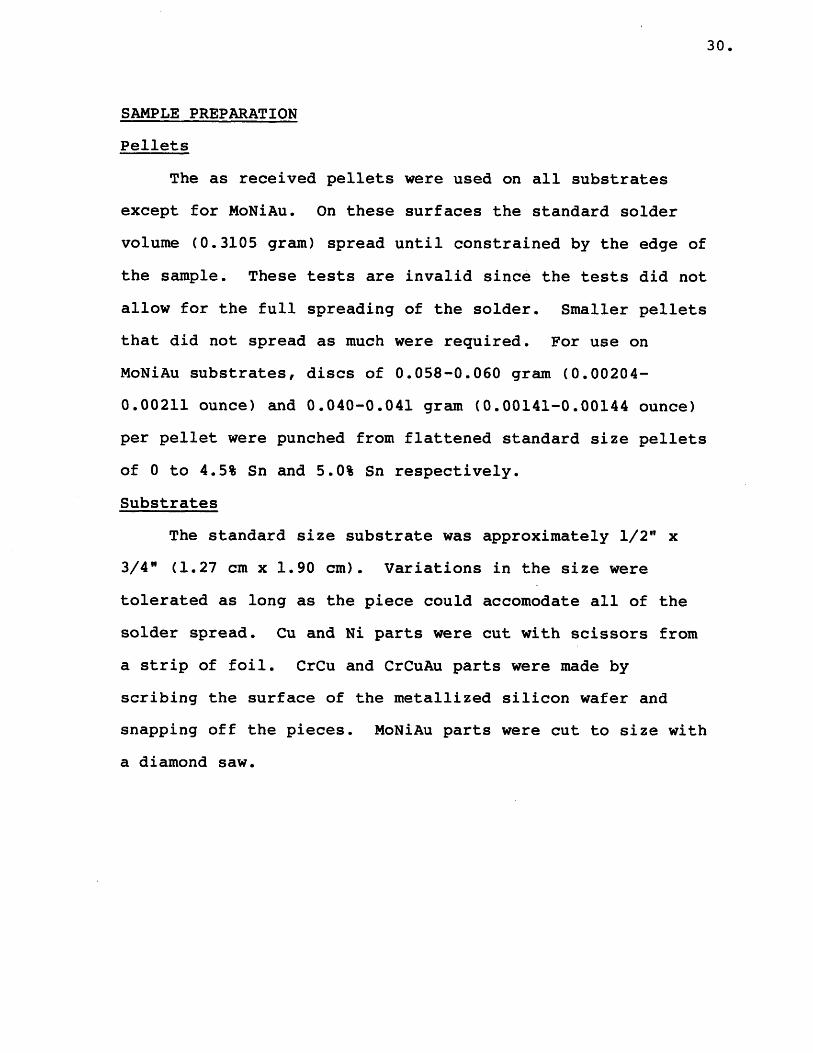
SAMPLE PREPARATION
Pellets
The as received pellets were used on all substrates
except for MoNiAu. On these surfaces the standard solder
volume (0.3105 gram) spread until constrained by the edge of
the sample. These tests are invalid since the tests did not
allow for the full spreading of the solder. Smaller pellets
that did not spread as much were required. For use on
MoNiAu substrates, discs of 0.058-0.060 gram (0.00204-
0.00211 ounce) and 0.040-0.041 gram (0.00141-0.00144 ounce)
per pellet were punched from flattened standard size pellets
of 0 to 4.5% Sn and 5.0% Sn respectively.
Substrates
The standard size substrate was approximately 1/2" x
3/4" (1.27 cm x 1.90 cm). Variations in the size were
tolerated as long as the piece could accomodate all of the
solder spread. Cu and Ni parts were cut with scissors from
a strip of foil. CrCu and CrCuAu parts were made by
scribing the surface of the metallized silicon wafer and
snapping off the pieces. MoNiAu parts were cut to size with
a diamond saw.
31.
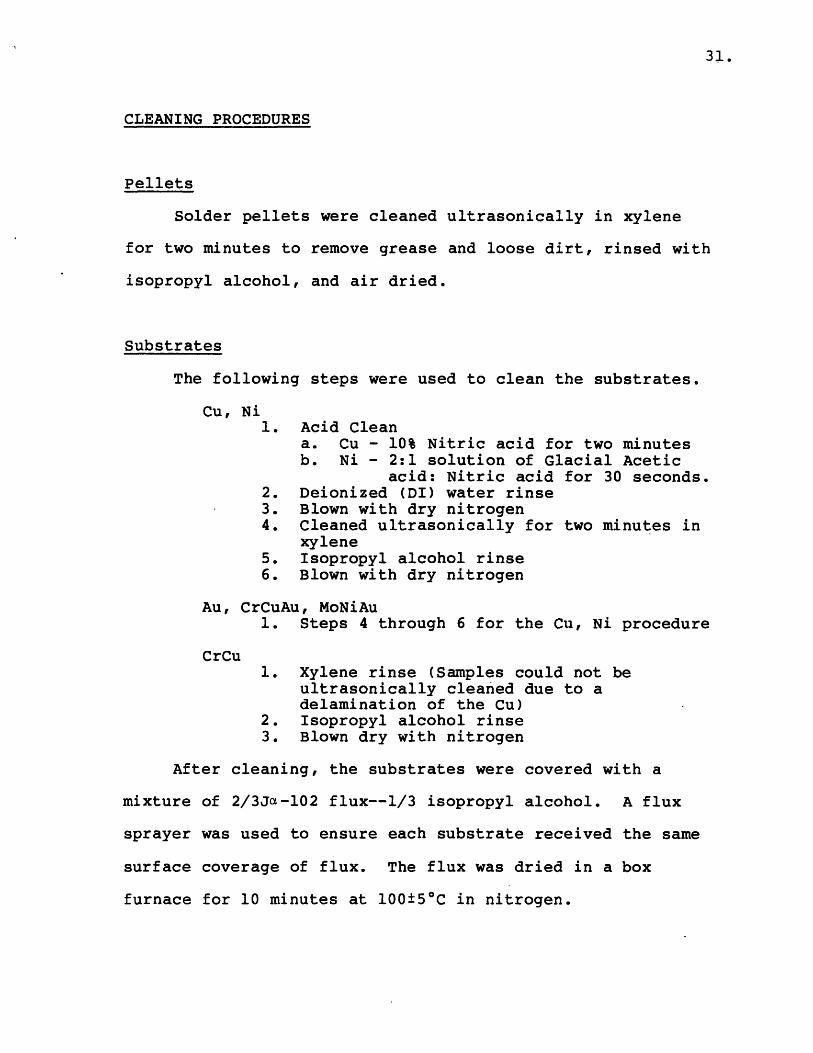
CLEANING PROCEDURES
Pellets
Solder pellets were cleaned ultrasonically in xylene
for two minutes to remove grease and loose dirt, rinsed with
isopropyl alcohol, and air dried.
Substrates
The following steps were used to clean the substrates.
Cu, Ni1. Acid Clean
a. Cu - 10% Nitric acid for two minutesb. Ni - 2:1 solution of Glacial Acetic
acid: Nitric acid for 30 seconds.2. Deionized (DI) water rinse3. Blown with dry nitrogen4. Cleaned ultrasonically for two minutes in
xylene5. Isopropyl alcohol rinse6. Blown with dry nitrogen
Au, CrCuAu, MoNiAu1. Steps 4 through 6 for the Cu, Ni procedure
CrCu1. Xylene rinse (Samples could not be
ultrasonically cleaned due to adelamination of the Cu)
2. Isopropyl alcohol rinse3. Blown dry with nitrogen
After cleaning, the substrates were covered with a
mixture of 2/3Jc-102 flux--1/3 isopropyl alcohol. A flux
sprayer was used to ensure each substrate received the same
surface coverage of flux. The flux was dried in a box
furnace for 10 minutes at 100±5*C in nitrogen.
32.
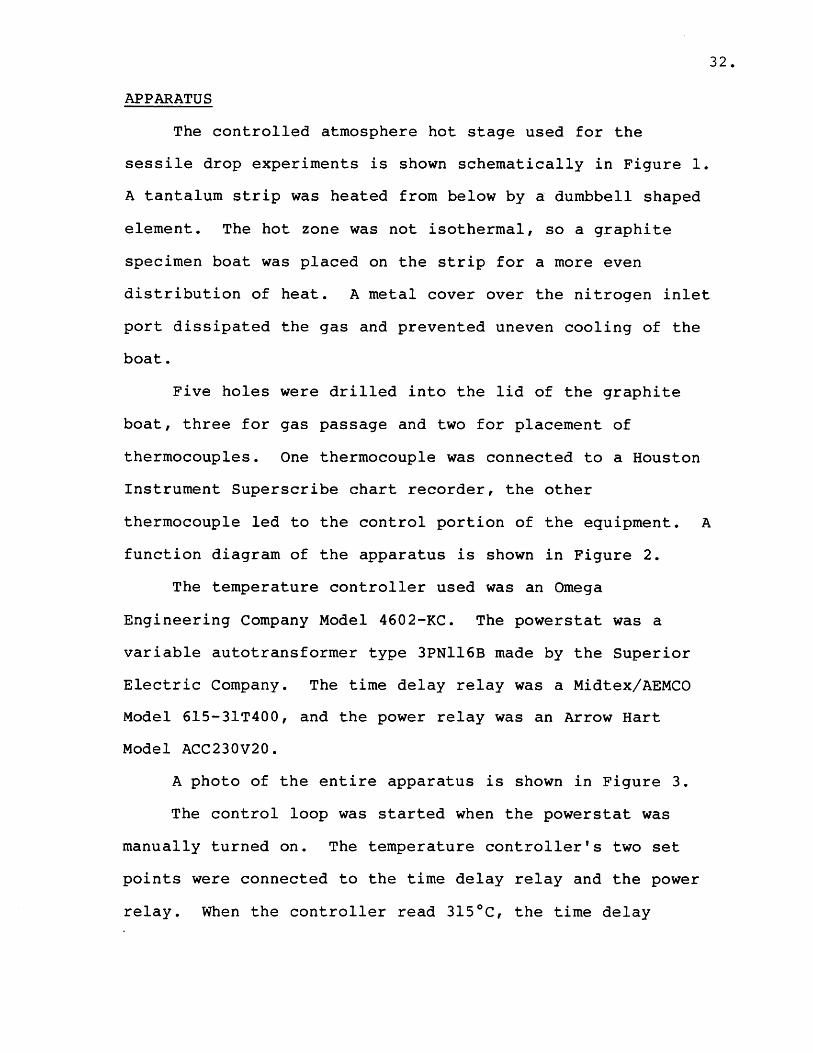
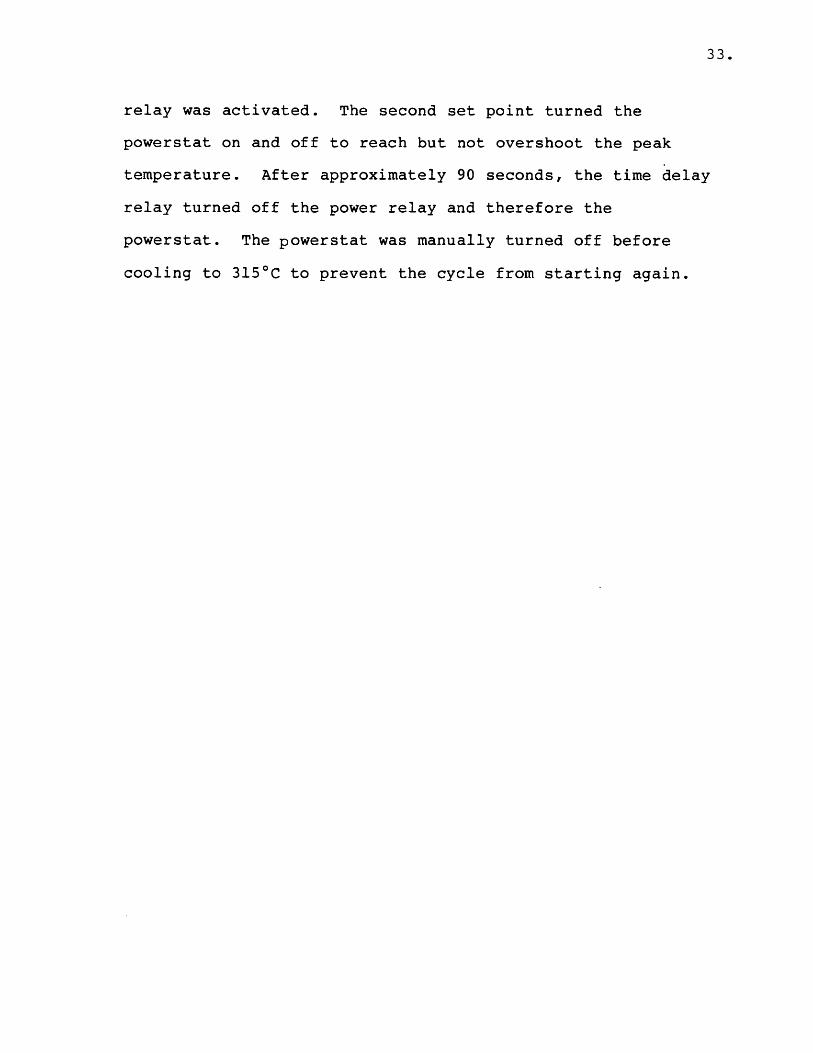
APPARATUS
The controlled atmosphere hot stage used for the
sessile drop experiments is shown schematically in Figure 1.
A tantalum strip was heated from below by a dumbbell shaped
element. The hot zone was not isothermal, so a graphite
specimen boat was placed on the strip for a more even
distribution of heat. A metal cover over the nitrogen inlet
port dissipated the gas and prevented uneven cooling of the
boat.
Five holes were drilled into the lid of the graphite
boat, three for gas passage and two for placement of
thermocouples. One thermocouple was connected to a Houston
Instrument Superscribe chart recorder, the other
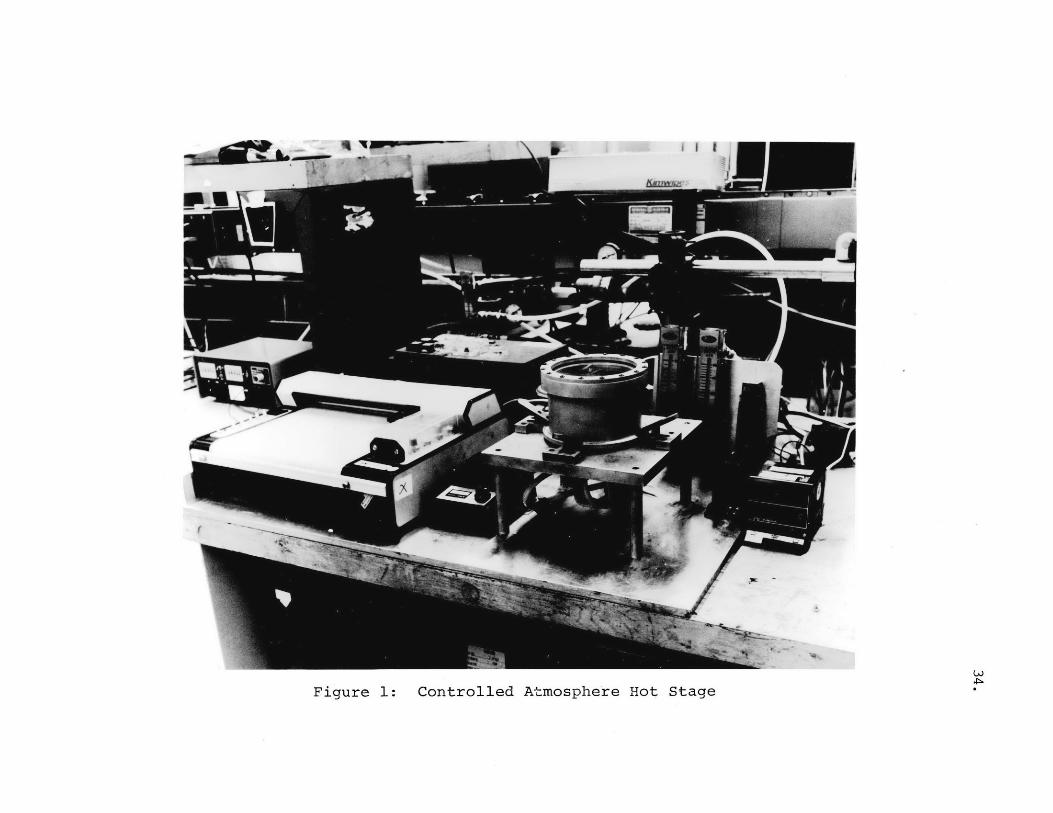
thermocouple led to the control portion of the equipment. A
function diagram of the apparatus is shown in Figure 2.
The temperature controller used was an Omega
Engineering Company Model 4602-KC. The powerstat was a
variable autotransformer type 3PN116B made by the Superior
Electric Company. The time delay relay was a Midtex/AEMCO
Model 615-31T400, and the power relay was an Arrow Hart
Model ACC230V20.
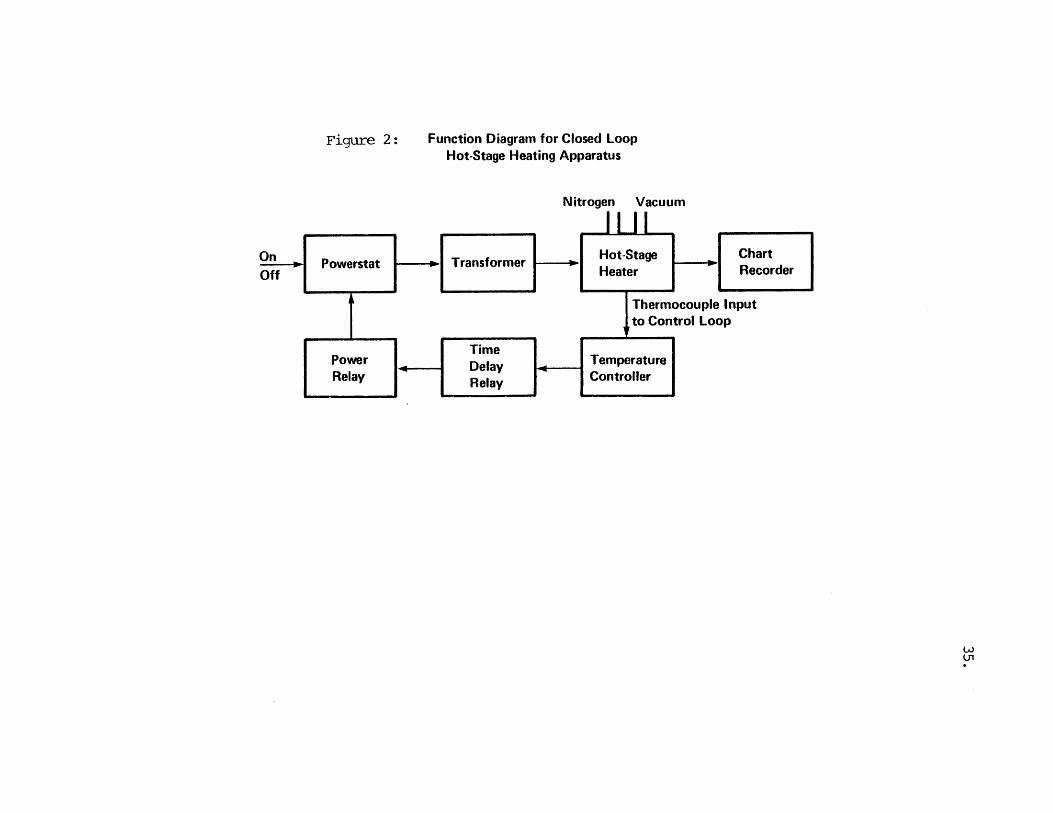
A photo of the entire apparatus is shown in Figure 3.
The control loop was started when the powerstat was
manually turned on. The temperature controller's two set
points were connected to the time delay relay and the power
relay. When the controller read 3150C, the time delay
33.
relay was activated. The second set point turned the
powerstat on and off to reach but not overshoot the peak
temperature. After approximately 90 seconds, the time delay
relay turned off the power relay and therefore the
powerstat. The powerstat was manually turned off before
cooling to 315 0 C to prevent the cycle from starting again.
4 6 4
Controlled Atmosphere Hot Stage
* O
Figure 1:
Function Diagram for Closed LoopHot-Stage Heating Apparatus
Nitrogen Vacuum
Figure 2:
Is,
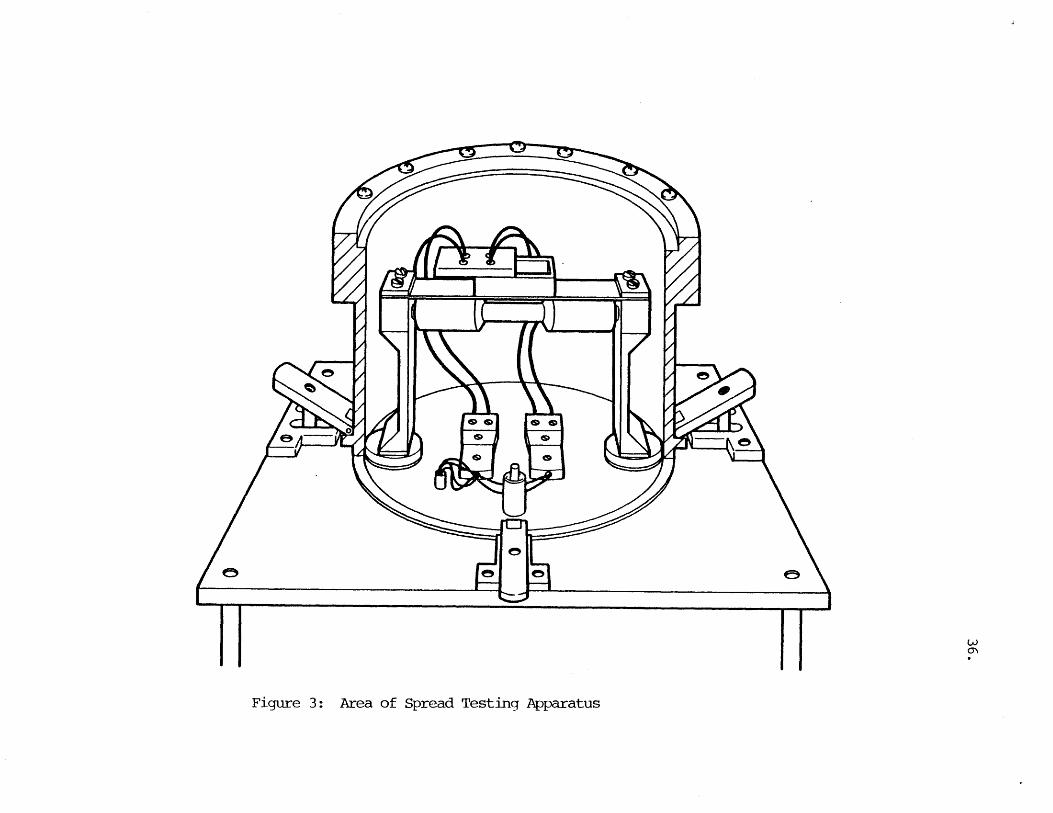
Figure 3: Area of Spread Testing Apparatus
37.
TEST PROCEDURE
The following procedure was used for the wetting
experiments after the substrates and solder pellets were
prepared as described previously.
1. Temperature controller and chart recorderturned on
2. Chart recorder calibrated daily with EurothermModel 239 millivolt source.
3. Graphite boat centered on strip.4. Substrate placed in boat.5. Solder pellet placed on substrate.6. Lid placed on graphite boat.7. Lid placed over strip heater.8. Gas regulators set to: vacuum - 20 to 21 SCFH,
nitrogen - 19 to 20 SCFH. These settings wereheld throughout the experiment.
9. System swept with nitrogen for 10 minutes.10. Powerstat manually turned on.11. Powerstat turned off between peak temperature
and 315°C.12. Strip heater cover removed when boat temperature
is 100 0C.13. Chart recorder stopped and dwell time checked.14. Nitrogen and vacuum turned off.15. Sample removed.16. Graphite boat cooled to 350 C before next
experiment.17. Sample flux cleaned ultrasonically in xylene.
The temperature profile generated by the heating and
controlling apparatus is shown in Figure 4.
This procedure was used for three samples in each cell
of the 9 (solder compositions) x 5(substrate types) matrix
of experiments and for follow-up experiments.
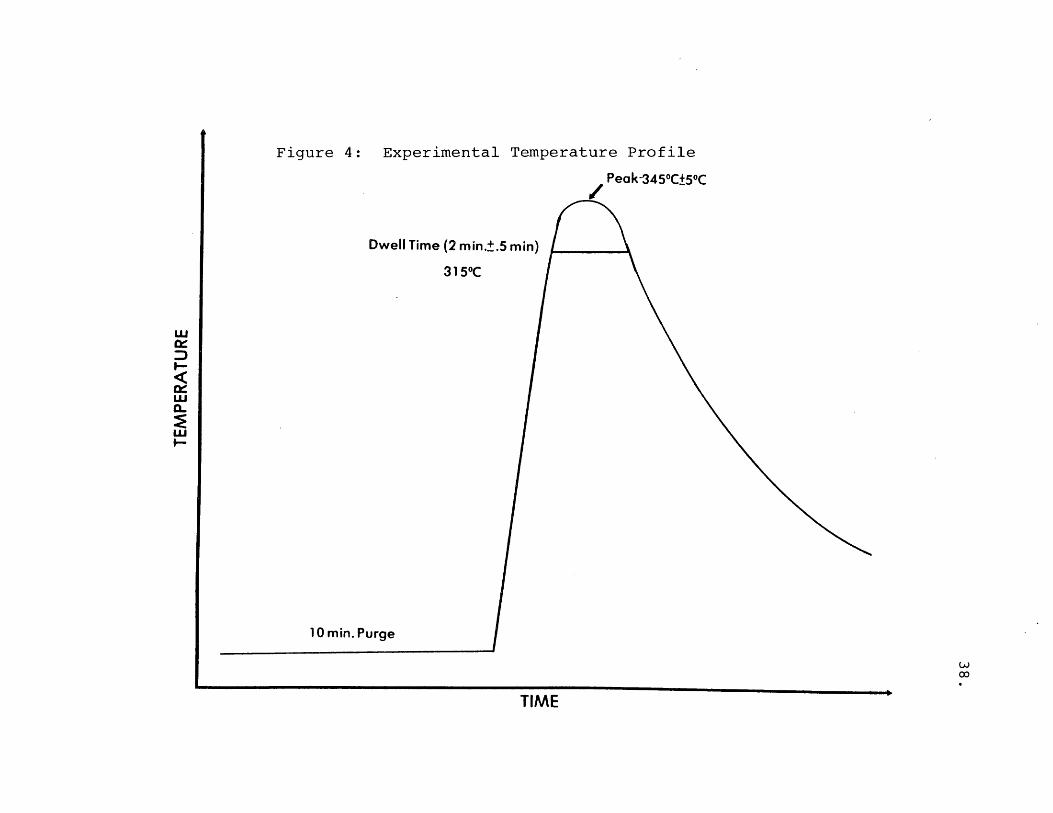
Figure 4: Experimental Temperature Profile
Peak-3450C+50C
Dwell Time (2 min.±.5 min)
315 0C
10 min. Purge
TIME
39.
MEASUREMENT METHODS
Contact angle
A drop of liquid will assume a shape with a minimum
surface free energy, i.e. a sphere. Liquid solder on a
solid substrate will also try to minimize its surface free
energy, but its shape will be a spherical cap. The contact
angle between the liquid and the solid is one measure of
wettability. The lower the contact angle, the greater the
wettability. A 00 angle indicates complete spreading,
while an angle greater than 900 indicates no wetting or
dewetting.
There are many sources of error in using this
measurement on sessile drop experiments. Spherical geometry
of the solder spread is assumed, but this assumption may not
be valid for many reasons. First, the solder volume must be
small enough that gravitational effects can be ignored.
Second, the substrate must have no directional roughness.
For example, any grooves in a surface, due to scratches or a
rolling direction, would cause the solder shape to be
ellipsoid, rather than spherical.
Another source of error is the assumption of
equilibrium. Whether or not the liquid solder has reached a
final equilibrium shape and spread, the measurement is made
after the solid has solidified. The growth of dendrites
during the crystallization of the solder leaves the
interface edge rough. Determination of the angle exactly at
40.
the point of contact is extremely difficult due to this
cooling effect.
Besides the errors inherent in the sample itself, there
are numerous sources of error in the actual act of making
the measurement. Samples must be cross sectioned and finely
polished, which is not feasible for large numbers of
samples. The angle should be measured from the plane
intersecting the highest point on the spherical section.
Determining the center of a sample is not a clear-cut
problem, and cross sectioning to that plane is not easily
done. Once a picture of the sample is taken, determination
of where the angle should be measured from is very
subjective.
Therefore, although the contact angle is volume
independent and representative of the balance of solder and
substrate forces, it is not a precise measure of
wettability.
Area of Spread
The area of spread test of wettability involves placing
a fixed volume of solder on the surface of a substrate and
heating the sample for a fixed time and temperature. The
test is usually run at some level of superheat to ensure the
fluidity of the solder. The greater the spread of the
solder, the higher the wettability. The objective of this
test is to measure an extent of wetting only; rates of
wetting are not taken into account.
41.
A commonly used test of wettability (ASTM), the area of
spread measurement is often chosen for both technical and
practical reasons. Since the sample is viewed from above,
there is no need for an assumption of sphericity. The
sample as a whole, not just a section is measured.
Variables affecting the spread can be straight forwardly
manipulated in the laboratory. Running the tests and taking
the measurements can be easily done on large numbers of
samples.
Much of the subjectiveness and difficulty in execution
inherent in the contact angle measurement is by-passed by
the area of spread test. Assuming a spherical geometry,
there is a simple relationship between contact angle and
area of spread:( 33 )
Area = 3.7 (Volume) 2 (8)( 6 (r-ads))
42.
MEASUREMENT PROCEDURE
Due to the ease and precision possible in the
technique, area of spread was chosen as the major
measurement of wettability for this study. Area of spread
mesurements were made using a Zeiss Omicron T.A.S. (Texture
Analysis System). Each sample was scanned by a television
camera and displayed on a CRT screen. The instrument
electronically counted the number of picture dots in the
designated area and, given a magnification constant,
converted these values into square inches. With no change
in lighting parameters, the instrument would read the areas
with 100% precision.
Due to their high reflectivity, the samples themselves
could not be used to directly measure the areas. Therefore,
measurements were made from photographs, viewing the samples
from overhead. The lighting was adjusted to show as sharp a
contrast as possible between the solder and the substrate.
On all MoNiAu substrates, and some samples of the other
substrate types, the picture contrast was very poor. In
these cases, a contour of the solder was drawn with a light
pencil, and the area within the contour measured. The
contouring was repeated three times for each ambiguous
specimen. An average of these readings was taken as
representative for the sample.
Since contact angle is the classic measure of
wettability, this method was used to a limited extent. One
43.
sample from each cell of the original test matirx was cross
sectioned. Pictures of both sides of the solder/substrate
edge were taken at x380 magnification. A base and a slope
line were drawn on the photo. The angle was read from these
constructions with a protractor.
It was often unclear where to place the base and slope
lines. In these cases, another set of lines was drawn and
additional measurements were made. If, on one side of a
sample, the angles varied by more than 100, the measurement
differing the most from the opposite side was discarded.
The angular values from both sides of the specimen were
averaged and converted into areas of spread using
equation 8.
44.
RESULTS AND ANALYSIS
RESULTS
Preliminary tests performed on pure Au substrates
showed that solder dissolved through the foil rather than
spreading. No measurements were taken and experiments on
the Au were discontinued.
Figures 5 through 9 show both the measured and
calculated areas of spread of 0-5%Sn solders on Cu, Ni,
CrCu, CrCuAu and MoNiAu substrate types, respectively.
Tables III through VII list the measured areas of spread
that are plotted in Figures 5 through 9 for the five
substrate types. The measured contact angles and the
calculated areas of spread based on these angles are listed
in Table VIII.
Since smaller pellets were used on the MoNiAu
substrates, a normalization factor was needed in order for
these areas to be comparable to results using standard size
pellets. The following relation, which assumes a spherical
geometry, was used to calculate this factor:
(V/V2)2/3 = (A1/A2 ) (7)
Table VII lists both the measured and normalized areas for
wetting on MoNiAu.
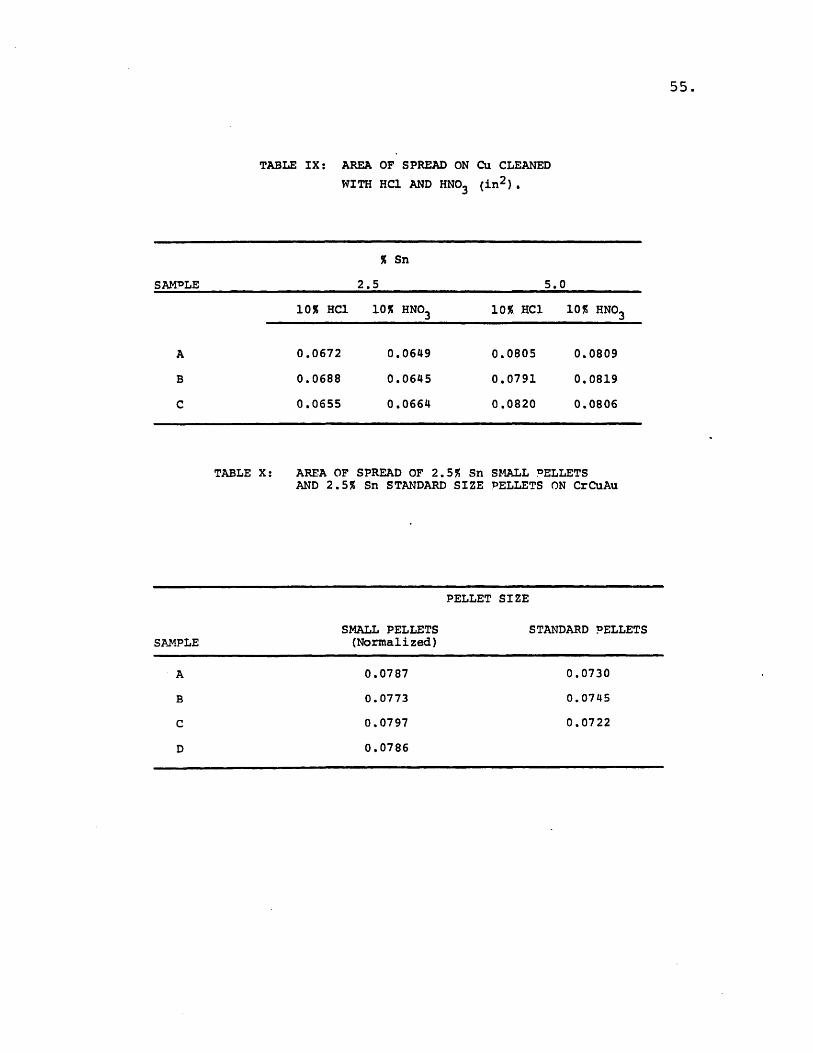
Tables IX through XI show the results of the follow-up
experiments. Listed in Table IX are the areas of spread
measured for 2.5% and 5.0%Sn alloys on Cu cleaned with two
different acid solutions, i.e. 10% hydrochloric acid and 10%
nitric acid. The areas of spread on CrCuAu for 0.0580-
45.
0.060 gram pellets and standard size pellets of 2.5%Sn are
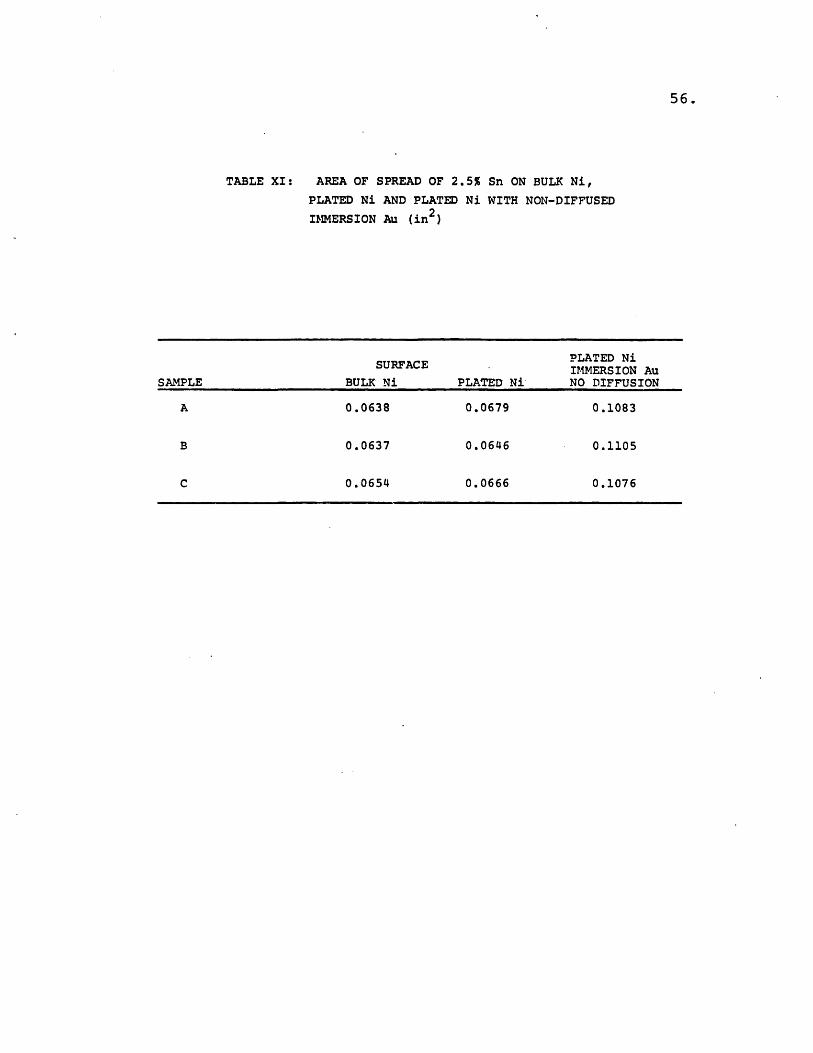
shown in Table X. Table XI lists the areas of spread of
2.5%Sn on bulk Ni, electroless plated Ni, and electroless
plated Ni with nondiffused immersion Au. Solder pellets of
0.058-0.060 gram size were used on the Au plated samples.
The values listed for this surface were normalized to be
comparable to standard size solder pellets.
Wettability as a Function of Percent Tin
Bulk Copper
O MeasuredA Calculated from Contact Angle
1.5 2.0 2.5 3.0 3.5Percent Tin
4.0 4.5
.U0
.071
NC4
oU
0wP(3
a,Oo
(d
.05
.03
.01
5.0I IIL iI nw
Figure 5:,. ,%
laI\J •
m
w
Wettability as a Function of Percent Tin
Bulk Nickel
O MeasuredA Calculated from Contact Angle
1.5 2.0 2.5 3.0Percent Tin
.11
.09
iCEJ
0.CO
0(c
CDooL_
.07
.05
.03
1.0 3.5 4.0 4.5 5.0m ~~~ I
Figure 6:
E--
Wettability as a Function of Percent Tin
CrCu on Silicon Wafer
o MeasuredA Calculated from Contact Angle
1.0 1.5 2.0 2.5 3.0Percent Tin
3.5 4.0
.09
.07A&0
N
C-
a,a,0.=
L-0o,
.05
.03
.01
4.5 5.0I m m ! I wI
Figure 7:
.05
i--
E-
Wettability as a Function of Percent Tin
CrCuAu on Silicon Wafer
O Measured6 Calculated from Contact Angle
1.5 2.0 2.5 3.0 3.5 4.0 4.5 5.0
Percent Tin
r44.I1
.09
.07
.05
a,
.03
.01
1.0
·
Figure 8:
-
-
E-
I--
Wettability as a Function of Percent Tin
MoNiAu Ceramic Substrate
O MeasuredA Calculated from Contact Angle
1.0 1.5 2.0 2.5 3.0
Percent Tin
3.5 4.0
.40
.35
.30
.25
.20
.15
.05
4.5 5.0m m m m m W m m W
Figure 9:
-
--
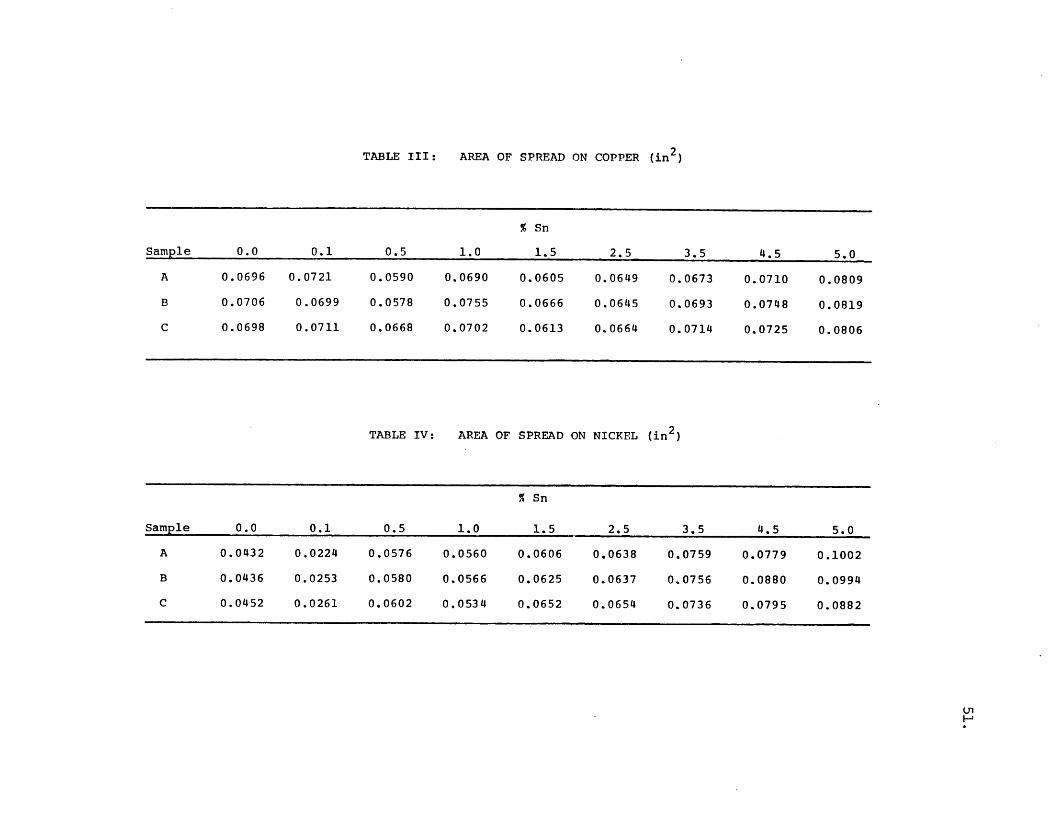
TABLE III: AREA OF SPREAD ON COPPER (in2 )
% Sn
Sample 0.0 0.1 0.5 1.0 1.5 2.5 3.5 4.5 5.0
A 0.0696 0.0721 0.0590 0.0690 0.0605 0.0649 0.0673 0.0710 0.0809
B 0.0706 0.0699 0.0578 0.0755 0.0666 0.0645 0.0693 0.0748 0.0819
C 0.0698 0.0711 0.0668 0.0702 0.0613 0.0664 0.0714 0.0725 0.0806
TABLE IV: AREA OF SPREAD ON NICKEL (in2
% Sn
Sample 0.0 0.1 0.5 1.0 1.5 2.5 3.5 4.5 5.0
A 0.0432 0.0224 0.0576 0.0560 0.0606 0.0638 0.0759 0.0779 0.1002
B 0.0436 0.0253 0.0580 0.0566 0.0625 0.0637 0.0756 0.0880 0.0994
C 0.0452 0.0261 0.0602 0.0534 0.0652 0.0654 0.0736 0.0795 0.0882
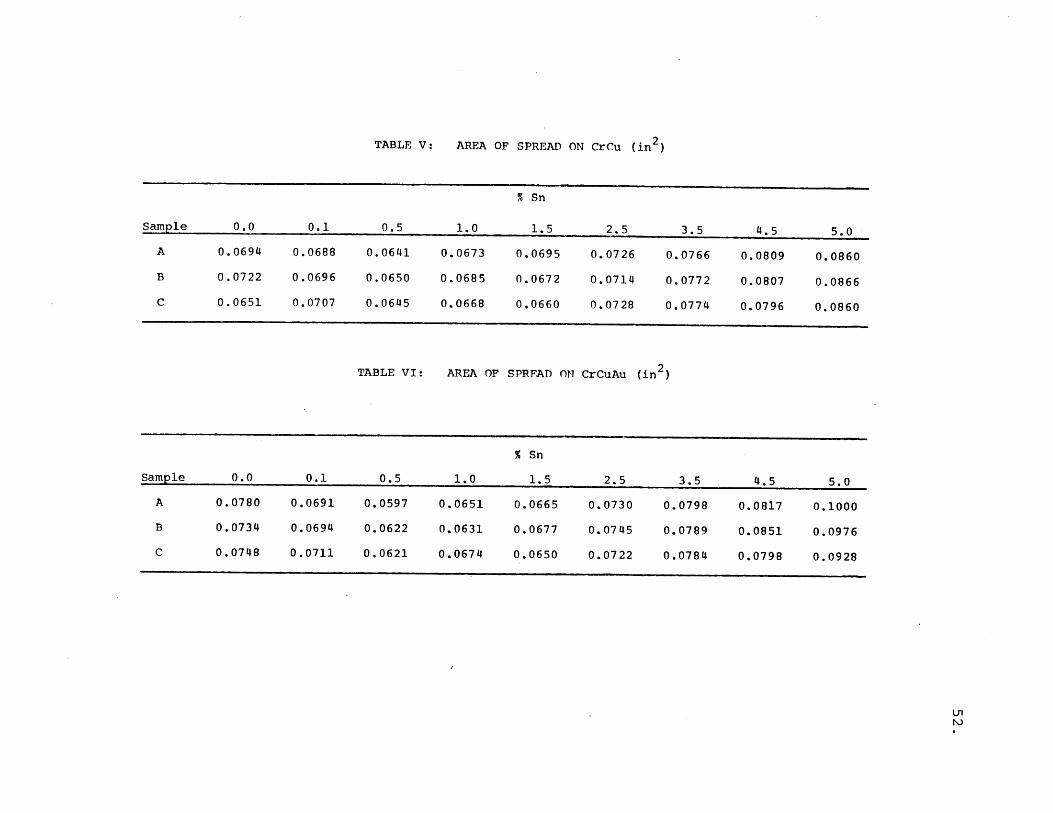
TABLE V: AREA OF SPREAD ON CrCu (in2 )
% Sn
Sample 0.0 0.1 0.5 1.0 1.5 2.5 3.5 4.5 5.0
A 0.0694 0.0688 0.0641 0.0673 0.0695 0.0726 0.0766 0.0809 0.0860
B 0.0722 0.0696 0.0650 0.0685 0.0672 0.0714 0.0772 0.0807 0.0866
C 0.0651 0.0707 0.0645 0.0668 0.0660 0.0728 0.0774 0.0796 0.0860
TABLE VI: AREA OF SPREAD ON CrCuAu (in2)
% Sn
Sample 0.0 0.1 0.5 1.0 1.5 2.5 3.5 4.5 5.0
A 0.0780 0.0691 0.0597 0.0651 0.0665 0.0730 0.0798 0.0817 0.1000
B 0.0734 0.0694 0.0622 0.0631 0.0677 0.0745 0.0789 0.0851 0.0976
C 0.0748 0.0711 0.0621 0.0674 0.0650 0.0722 0.0784 0.0798 0.0928
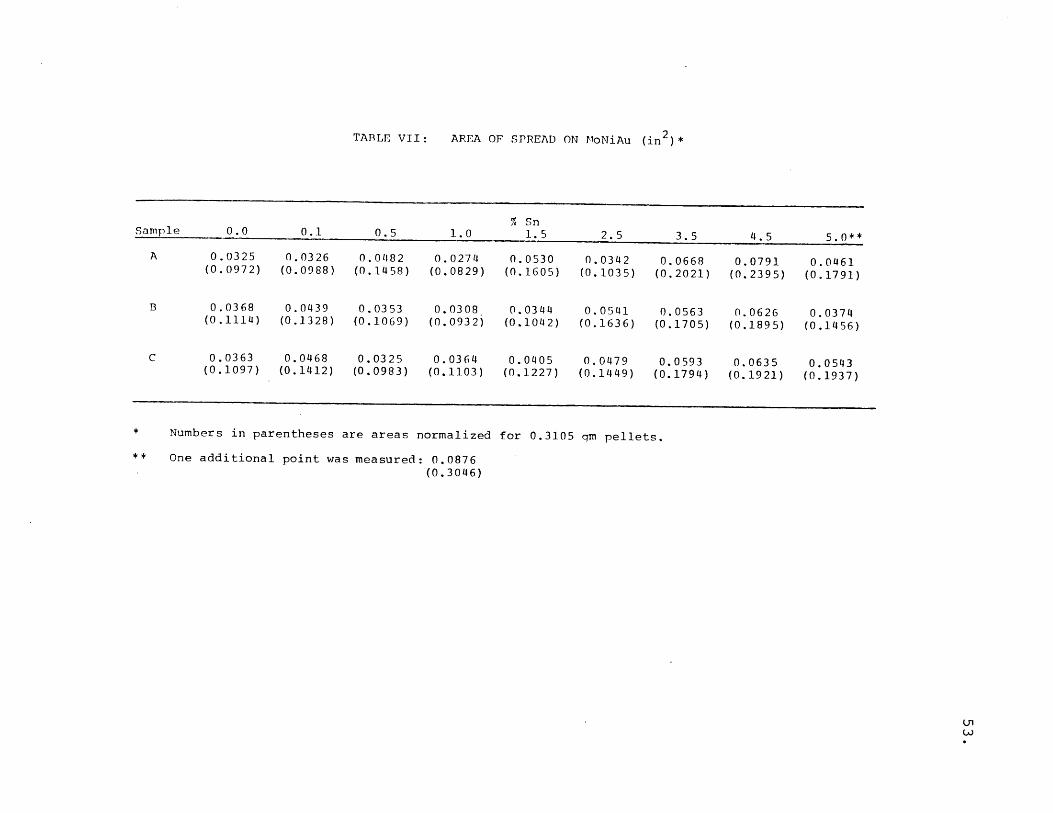
TABLE VII: AREA OF SPREAD ON M1oNiAu (in2)*
% SnSample 0.0 0.1 0.5 1.0 1.5 2.5 3.5 4.5 5.0**
A 0.0325 0.0326 0.01182 0.0274 0.0530 0.0342 0.0668 0.0791 0.0461(0.0972) (0.0988) (0.1458) (0.0829) (0.1605) (0.1035) (0.2021) (0.2395) (0.1791)
B 0.0368 0.0439 0.0353 0.0308 0.0344 0.0541 0.0563 0.0626 0.0374(0.1114) (0.1328) (0.1069) (0.0932i (0.1042) (0.1636) (0.1705) (0.1895) (0.1456)
C 0.0363 0.0468 0.0325 0.0364 0.0405 0.0479 0.0593 0.0635 0.0543(0.1097) (0.1412) (0.0983) (0.1103) (0.1227) (0.1449) (0.1794) (0.1921) (0.1937)
* Numbers in parentheses are areas normalized for 0.3105 qm pellets.
** One additional point was measured: 0.0876(0.3046)
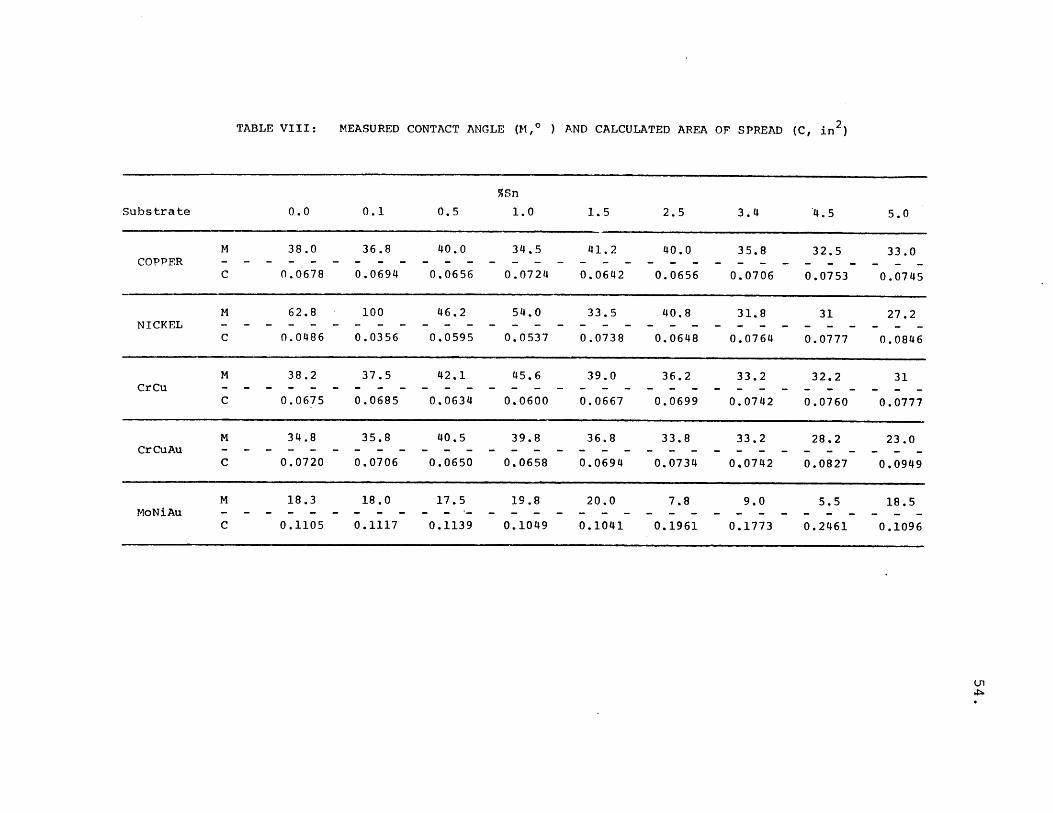
TABLE VIII: MEASURED CONTACT ANGLE (M,0 ) AND CALCULATED AREA OF SPREAD (C, in 2 )
%Sn
Substrate 0.0 0.1 0.5 1.0 1.5 2.5 3.4 4.5 5.0
M 38.0 36.8 40.0 34.5 41.2 40.0 35.8 32.5 33.0COPPER - - - - - - - - - - - - - - - - - - - - - - - - - - - - - -
C 0.0678 0.0694 0.0656 0.0724 0.0642 0.0656 0.0706 0.0753 0.0745
M 62.8 100 46.2 54.0 33.5 40.8 31.8 31 27.2NICKEL - - - - - - - - - - - - - - - - - - - - - - - - - - - - - - - -
C 0.0486 0.0356 0.0595 0.0537 0.0738 0.0648 0.0764 0.0777 0.0846
M 38.2 37.5 42.1 45.6 39.0 36.2 33.2 32.2 31CrCu - - - - - - - - - - - - - - - - - - - - - - - - - - - - - - - -
C 0.0675 0.0685 0.0634 0.0600 0.0667 0.0699 0.0742 0.0760 0.0777
M 34.8 35.8 40.5 39.8 36.8 33.8 33.2 28.2 23.0CrCuAu - - - - - - - - - - - - - - - - - - - - - - - - - - - - - - - -
C 0.0720 0.0706 0.0650 0.0658 0.0694 0.0734 0.0742 0.0827 0.0949
M 18.3 18.0 17.5 19.8 20.0 7.8 9.0 5.5 18.5MoNiAu - - - - - - - - - - - - - - - - - - - - - - - - - - - - - - - -
C 0.1105 0.1117 0.1139 0.1049 0.1041 0.1961 0.1773 0.2461 0.1096
55.
TABLE IX: AREA OF SPREAD ON Cu CLEANED
WITH HCI AND HNO 3 (in 2 ).
% Sn
SAMPLE 2.5 5.0
10% HC1 10% HNO3 10%.HCl 10% HNO3
A 0.0672 0.0649 0.0805 0.0809
B 0.0688 0.0645 0.0791 0.0819
C 0.0655 0.0664 0.0820 0.0806
TABLE X: AREA OF SPREAD OF 2.5% Sn SMALL PELLETSAND 2.5% Sn STANDARD SIZE PELLETS ON CrCuAu
PELLET SIZE
SMALL PELLETS STANDARD PELLETSSAMPLE (Normalized)
A 0.0787 0.0730
B 0.0773 0.0745
C 0.0797 0.0722
D 0.0786
56.
TABLE XI: AREA OF SPREAD OF 2.5% Sn ON BULK Ni,
PLATED Ni AND PLATED Ni WITH NON-DIFFUSED
IMMERSION Au (in 2 )
SURFACE PLATED NiIMMERSION Au
SAMPLE BULK Ni PLATED Ni NO DIFFUSION
A 0.0638 0.0679 0.1083
B 0.0637 0.0646 0.1105
C 0.0654 0.0666 0.1076
57.
STATISTICAL ANALYSIS
All area measurements of the main test matrix were
submitted for statistical analysis. Using substrate type
and %Sn as the variables, a two way analysis of variance was
performed. The following combinations of surface types were
tested: all five substrate types, all substrate types
except for MoNiAu, and all copper containing substrates.
The results of this analysis (see Tables XII and XIII)
indicated that variations in the data are due to surface
type, %Sn, and an interaction effect between these two
factors. Thus, although the area values for all substrate
types except MoNiAu are with in the same range, 0.06-0.80
in , there is a statistically significant change of
wettability with substrate type.
In addition to analysis of variance, regression
analysis was used on the data to determine wettability as a
function of Sn content. Data on bulk Ni, CrCuAu, and CrCu
were fairly consistent and mathematical models with high
correlation to the actual data were calculated. Due to the
high degree of scatter of area values on bulk Cu and MoNiAu
substrate types, satisfactory models to fit all the data
were not obtained.
Some of the significant regression models are listed in
Table XIII. The insensitivity of the Cu substrates to
changes in Sn content can be seen by the regression model
based on means. In this case the model calling for area of

58.spread to equal a constant has a fairly high multiple
correlation coefficient. The extremely low scatter in the
CrCuAu substrate data can be seen by the calculation of
exactly the same fourth order model with very similar
multiple correlation coefficients, regardless whether the
model is based on all area values or on their means. The
opposite property is seen for the MoNiAu substrates.
Although almost the same first order model is found based on
all values or on means, the multiple correlation coefficient
improves almost 50% when the means are used.
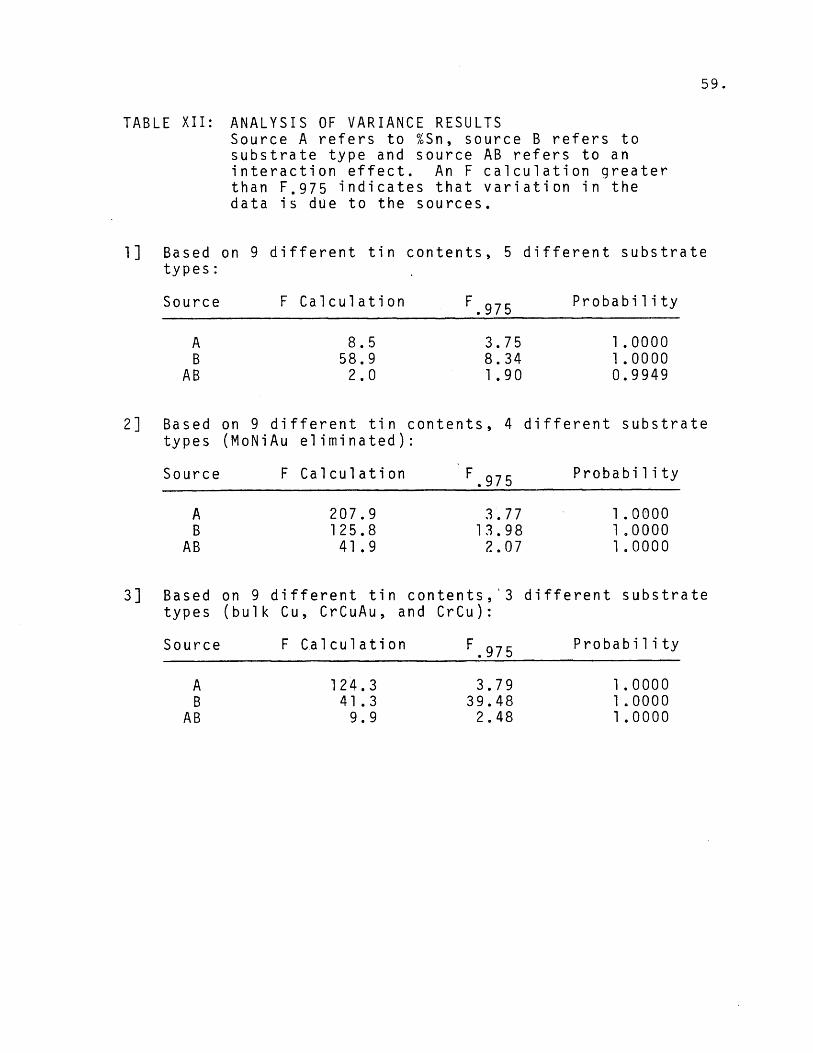
TABLE XII: ANALYSISSource Asubstinterthandata
OF VARIANCE RESULTSrefers to %Sn, sourc
rate type and sourceaction effect. An FF 975 indicates thatis due to the sources.
e B refers torefers to anulation greateration in the
1] Based ontypes:
9 different tin contents, 5 different substrate
F Calculation .975
8.558.92.0
Probability
1.00001.00000.9949
2] Basedtypes
on 9 different tin conten(MoNiAu eliminated):
ts, 4 different substrate
F Calculation
207.9125.8
41.9
F.975
3.7713.982.07
Probability
1 .00001.00001.0000
3] Basedtypes
on 9 different tin con(bulk Cu, CrCuAu, and
tents, '3CrCu):
different substrate
F Calculation
124.341.39.9
F .975
3.7939.48
2.48
Probability
1.00001.00001.0000
59.
Source
Source
Source
_ __
_ I ______I
_
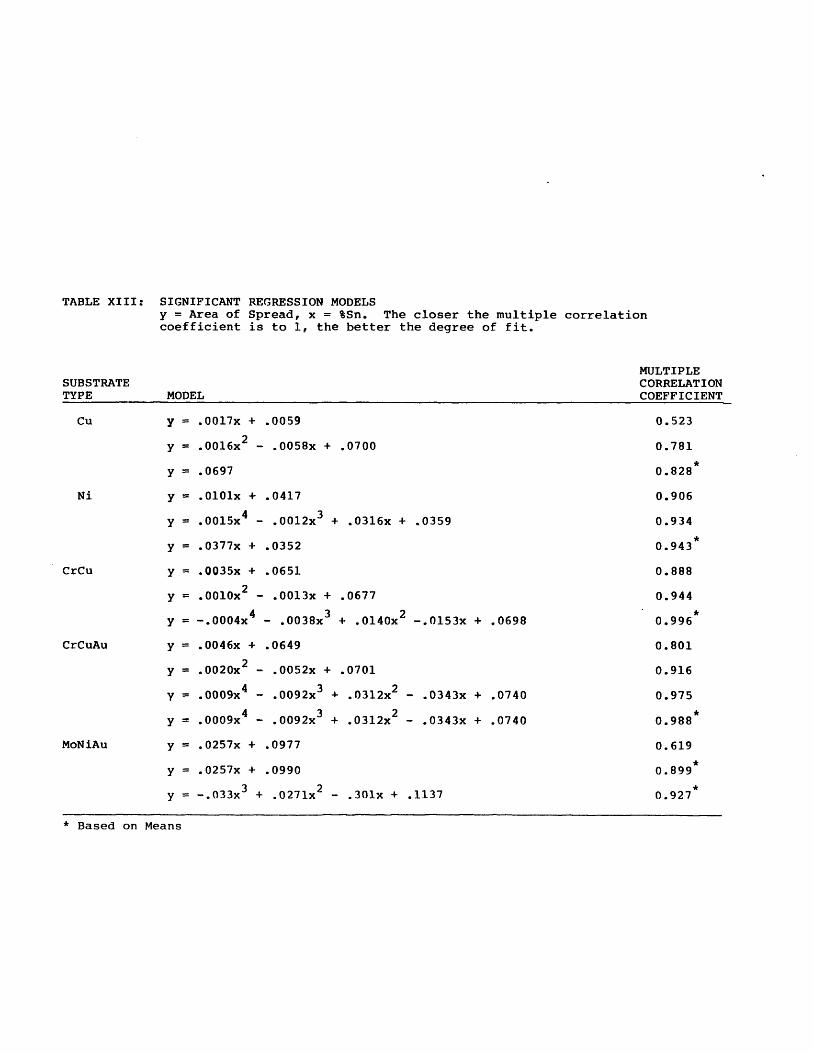
TABLE XIII: SIGNIFICANT REGRESSION MODELSy = Area of Spread, x = %Sn. The closer the multiple correlationcoefficient is to 1, the better the degree of fit.
MODE
y =
y =
y =
y =
y =
y =
y =
y =
y =
y =
y =
y =
y=
y=
y=
y=
.0017x + .0059
.0016x2 - .0058x + .0700
.0697
.0101x + .0417
4 3.0015x - .0012x 3 + .0316x + .0359
.0377x + .0352
.0035x + .0651
.0010x2 - .0013x + .0677
-.0004x 4 - .0038x 3 + .0140x2 -.0153x + .0698
.0046x + .0649
.0020x2 - .0052x + .0701
4 3 2.0009x 4 - .0092x3 * .0312x2 - .0343x + .0740.0009x4 - .0092x 3 + .0312x2 - .0343x + .0740
.0257x + .0977
.0257x + .0990
3 2-.033x + .0271x - .301x + .1137
MULTIPLECORRELATIONCOEFFICIENT
0.523
0.781*
0.828
0.906
0.934
0.943
0.888
0.944
0.996
0.801
0.916
0.975
0.988
0.619
0.899
0.927 o0o
* Based on Means
SUBSTRATETYPE
Cu
Ni
CrCu
CrCuAu
MoNiAu
L
61.
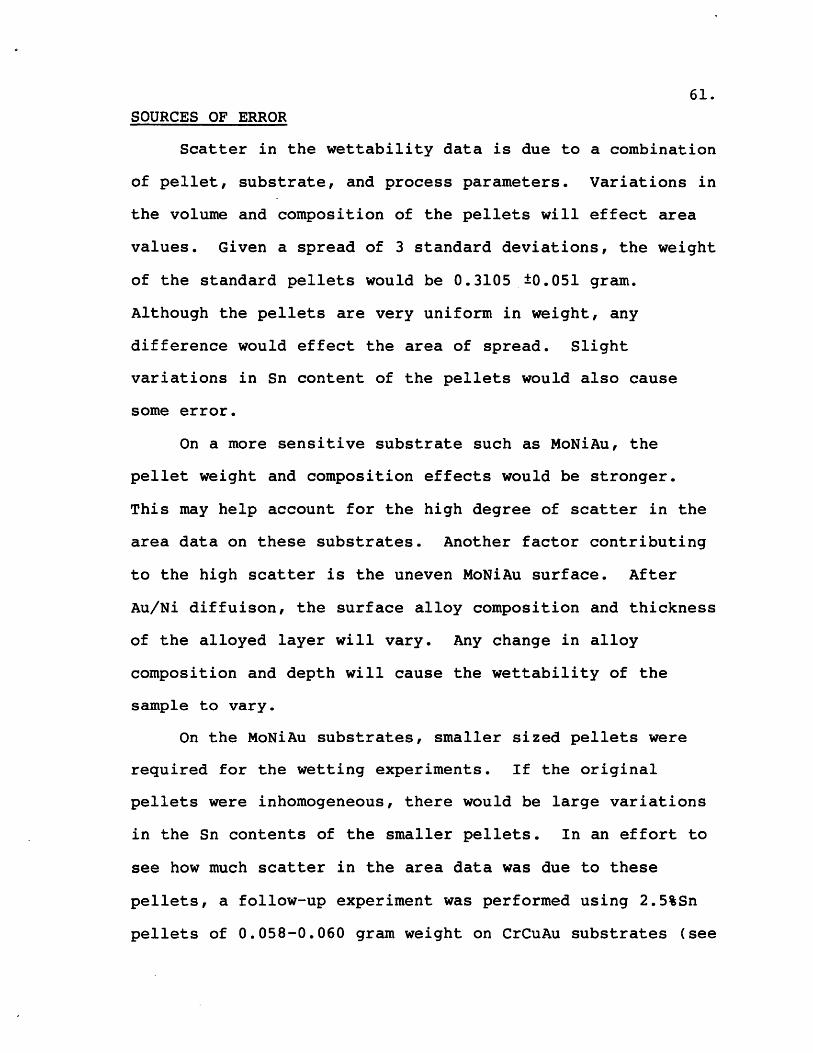
SOURCES OF ERROR
Scatter in the wettability data is due to a combination
of pellet, substrate, and process parameters. Variations in
the volume and composition of the pellets will effect area
values. Given a spread of 3 standard deviations, the weight
of the standard pellets would be 0.3105 ±0.051 gram.
Although the pellets are very uniform in weight, any
difference would effect the area of spread. Slight
variations in Sn content of the pellets would also cause
some error.
On a more sensitive substrate such as MoNiAu, the
pellet weight and composition effects would be stronger.
This may help account for the high degree of scatter in the
area data on these substrates. Another factor contributing
to the high scatter is the uneven MoNiAu surface. After
Au/Ni diffuison, the surface alloy composition and thickness
of the alloyed layer will vary. Any change in alloy
composition and depth will cause the wettability of the
sample to vary.
On the MoNiAu substrates, smaller sized pellets were
required for the wetting experiments. If the original
pellets were inhomogeneous, there would be large variations
in the Sn contents of the smaller pellets. In an effort to
see how much scatter in the area data was due to these
pellets, a follow-up experiment was performed using 2.5%Sn
pellets of 0.058-0.060 gram weight on CrCuAu substrates (see
62.
Table X). The CrCuAu substrate type was chosen since it
showed the least amount of scatter in the data.
The results showed little scatter in the area values of
the small pellets on CrCuAu substrates. Therefore, the
pellet compositions must be relatively uniform and the high
scatter must be due mainly to the unevenness and sensitivity
of the MoNiAu surface.
The area values of the small pellets on CrCuAu also
gave some idea of the error introduced by the MoNiAu
normalization factor used to make MoNiAu substrate results
comparable to the other substrate type results (see Table
X). The results showed that the normalization factor biased
the results to be slightly higher than actual. Although
this effect may be small at 2.5%Sn, it is unclear whether
the magnitude of this error is constant at all Sn contents.
In the thermal profile of the area of spread test, the
peak temperature varies ± 50C and the dwell time varies ± 15
seconds. These changes will effect the kinetics of the
wetting reactions and therefore the wettability. Slight
variations in the quantity of flux on the samples may also
have an effect on the results. No work was done to quantify
the changes in wettability due to these factors.
Another procedural variable that may cause some error
is the use of the same temperature profile in all of the
tests for all compositions. Since the liquidus temperature
changes from 327 0 C at O%Sn to 315 0 C at 5%Sn, the superheat
and therefore the fluidity of the molten solder will vary
63.
for each composition. Although the difference is only
120C, the magnitude of this variation could be measured.
In addition to errors inherent in the test materials
and processes, errors are always introduced when taking
neasurements. These sources of error are discussed in the
Measurements Methods section of this paper. It should be
noted that a 10% error in 0 will cause a 6-7% error in the
calculated area of spread, based on equation 1.
64.
DISCUSSION and CONCLUSION
From Figures 5 to 9 it can be seen that there is a
general trend of increasing wettability with increasing Sn
content. All substrates also showed some anomalous wetting
behavior, i.e. unexpected dips and rises in the area of
spread, at Sn contents lower than 1%. Especially meaningful
was the use of 0.1% Sn on Ni substrates whereby the solder
balled up rather than spreading. The wettability of solder
on all Cu containing substrates was very similar. The
wetting of MoNiAu surfaces was better and also had a higher
increase of area of spread with increasing Sn content than
any of the other substrates types tested. In comparision to
the Ni and MoNiAu substrate types, the Cu containing
substrates were relatively insensitive to changes in Sn
content. All substrates showed wetting at 0% Sn (pure Pb).
The increase of wetting with increasing Sn content is
an expected result. In terms of surface tensions, the
wetting phenomenon can be mechanistically described by a
modified form of equation 1 with flux in the system (see
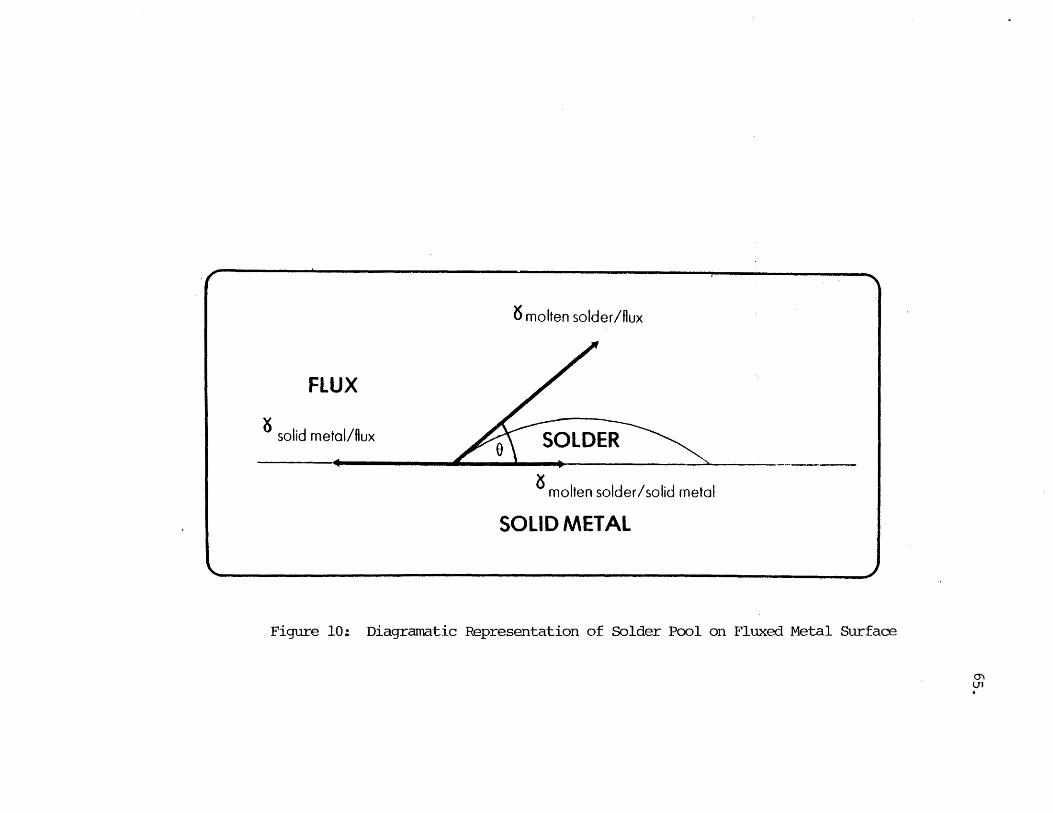
Figure 10):(34)YSF = YSL + YLFcosa (10)
where: YSF = surface tension of solid/flux interface
LF = surface tension of liquid/flux interface, and
YSL = surface tension of solid/liquid interface.The changes in surface tensions with increasing Sn content
should increase the wettability, as was discussed in the
background section of this paper.
6 molten solder/flux
FLUX
solid metal/flux
molten solder/solid metal
SOLID METAL
Diagramatic Representation of Solder Pool on Fluxed Metal Surface
,
I
Figure 10:
66.
In the alloys containing Sn, intermetallics are formed
at the interface. Some of the intermetallics likely to be
formed during the experimental heating cycle include :
Cu5Sn6, Cu3Sn, Ni3Sn4, AuSn, AuSn 4, and
(35)AuSn4(35) No compound identification was performed
during the course of the study.
Once the Sn has started to react with the surface
metallizations, both the roughness and composition of the
solid surface change. Young's equation applies only to an
unreacted solid and may therefore be used only as a guide
and not a complete mechanistic description of, the wetting
processes being viewed in these experiments.
That Au is extremely soluble in Pb and Sn was seen by
the attempted wettability experiments where molten solder
went through pure Au foil. The effect on wettability of Au
on Cu and Ni appears to differ dramatically. The wettability
of Cr and CrCuAu substrate types is very similar.
Bulk Ni and MoNiAu have extremely different wetting
patterns. MoNiAu not only has a higher degree of spreading
(0.10-0.30 in), it also has a higher rate of increase of
spreading with Sn content. One possible explanation is the
presence of different relative Au conentrations on the
surface, however, there is another factor involved. The Ni
on the MoNiAu substrates is electrolessly plated while the
bulk Ni comes from a rolled sheet. (During diffusion of the
67.molybdenum and nickel, the codeposited agent necessary for
Ni plating is totally removed.)
In an effort to separate the effects of surface
condition and Au, follow-up experiments were performed with
2.5%Sn on Ni plated and Ni plated with nondiffused immersion
Au substrates (see Table XI). The plated Ni surface shows
only a slight, possibly insignificant, increase of
wettability over the bulk Ni surface. Therefore the much
higher wettability of the MoNiAu substrate must be due to
the presence of Au and not the differences in plated and
rolled Ni.
The nondiffused Au surface shows much better
wettability than either of the pure Ni surfaces. The Au/Ni
diffused substrates, however, have an even higher
wettability. This effect may be understood in light of the
pure Au results, where the solder did not spread but
dissolved straight through the foil. If area of spread
measurements were to be made on these samples, the results
would how a non-wetting behavior since the spread area was
not greater than the original area. Au, however, is wet by
Pb-Sn solders. (36 ) In the case of the non-diffused
surface, the thin Au layer did enhance the wettability of
the Ni, but was eaten through before the solder could spread
more. By alloying the Ni and Au, the Au is not free to be
dissolved as quickly by the solder. Thus, the Au enhances
the wetting without being totally dissolved into the solder.
68.
From the preceeding discussion it is obvious that the
surface condition is extremely important in wetting
phenomena. The cleaning procedures described in the
experimental procedure were used consistently throughout the
testing. On Cu surfaces, nitric acid may not only dissolve
copper oxide but also copper itself. HCI should not
dissolve the Cu, only the Cu oxides. Therefore, another
cleaning procedures for Cu, namely 10% HC1 solution for two
minutes, was tried using 2.5% and 5.0%Sn (see Table IX).
There is no apparent change in wettability caused by these
different cleaning procedures.
69.
FUTURE WORK
This paper describes the functional wettability of low
Sn solders on some integrated circuit package
metallizations. The results raise some questions that would
be extremely useful to answer.
Some of the sources of error may be quantifiable with
more testing to find the effects of process parameters, such
as the ± 5C peak temperatutre and the ±15 second dwell
time. Tests should be run with carefully controlled
temperature profiles. The change of wettability at the
extreme superheat limits could be measured. This work would
yield information that could also be useful in planning
future experiments of time and temperature on wetting.
The accuracy of 'the normalization factor was studied to
a slight extent. Tests using small size pellets of a range
of Sn contents and substrates should be performed to
determine whether the error inherent in the factor is
systematic or not.
The fluxes and atmospheres chosen for this study are
two more factors whose effects should be studied. They can
have not only an oxide cleaning action, but can also alter
the surface tensions of the solder and substrate. Both
different types and quantities of fluxes, ambients
(N2 ,N2H2 , and H2) and combinations of these
variables should be tested for their effects on the
wettability of solders and surfaces.
70.
Finally, the wetting of the low Sn solders directly
onto intermetallics rather than pure metals should be
studied. The results of tests on these substrate types
would show the fundamental wettability of the
intermetallics. In addition, if these results were then
compared to the substrate types used in this study, the
effect of the actual intermetallic formation during the
wetting process could be seen.
With only minor changes, the apparatus and procedure
described in this paper could be used to perform all of the
above mentioned studies.
71.
REFERENCES
1. Bondi, A., "The Spreading of Liquid Metals on SolidSurfaces", Chem. Rev., 52, (1953), p. 417.
2. Young, T., "An Essay on the Cohesion of Fluids", Phil.Trans. Roy. Soc. London, 95, (1805), p. 65.
3. Kingery, W. D. , Bowen, H.K., and Uhlmann, D.R.,Introduction to Ceramics, 2nd ed., New York,John Wiley and Sons, (1976), p. 210.
4. Johnson, R.E. Jr., "Conflicts Between GibbsianThermodynamics and Recent Treatments ofInterfacial Energies in Solid-Liquid-VaporSystems", J. Phys. Chem., 63, (1959), p. 1655.
5. Gibbs, J.W., Scientific Papers of J.W. Gibbs, Vol. 1,(1961), p. 314.
6. Milner, D.R., "A Survey of the Scientific PrinciplesRelated to Wetting and Spreading", British WeldingJournal, 5, (1958), p. 90.
7. Dupre, A., Theorie Mechanique de la Chaleur,Gauthier-Villars, Paris, (1869), p. 369.
8. Harvey, D.J., "The Wetting of Metals by Lead Alloys",in Adhesion and Cohesion, ed. Philip Weiss, NewYork, Elsevier Publishing Company, (1962), pp.146-158.
9. Turkdogan, E.T., and Zador, S., "The Spread of MoltenTin on Mild Steel Reduced in Hydrogen or Treatedwith Molten Fluxes", Journal of the Iron andSteel Institute, 197, (1961), p. 233.
10. Aksay, I.A., Hoge, C.E., and Pask, J.A., "Wetting UnderChemical Equilibrium and NonequilibriumConditions", J. Phys. Chem, 78, No. 12, (1974),p. 1178.
11. Bailey, G.L.J. and Watkins, H.C., "The Flow of LiquidMetals on Solid Metal Surfaces and its Relationto Soldering, Brazing, and Hot-Dip Coating",Journal of the Institute of Metals, 80,(1951-52), p. 57.
12. Sharps, P.R., Tomsia, A.P., and Pask, J.A., "Wettingand Spreading in the Cu-Ag system," ActaMetallurgica, 29, (1981), p. 855.
72.
13. Murr, L.E., Interfacial Phenomenon in Metals andAlloys, London, Addison-Wesley Publishing
Company, (1975), pp. 87 - 113.
14. Howie, F.H., and Hondros, E.D., "The Surface Tension ofTin-Lead Alloys in Contact with Fluxes", Journalof Materials Science, 17, (1982), p. 1434.
15. Wassink, R. J. Klein, "Wetting of Solid-Metal Surfacesby Molten Metals", Journal of the Institute ofMetals, 95, (1967), p. 2390.
16. Jones, D.R.H., "Review: The Free Energies ofSolid-Liquid Interfaces", 9, (1974), p.l.
17. Oliver, J.F. and Mason, S.G., "Liquid Spreading onRough Metal Surfaces", Journal of MaterialsScience, 15, (1980), p. 431.
18. Miller, V.R., Schwaneke, A.E., Jensen, J.W., Testsfor Tin-Lead Solders and Solder Joints,Report ofInvestigations 6963, United States Department ofthe Interior.
19. Thwaites, C.J., "Soft-Solders and Soldering in theElectrical Industry", Tin Research InstitutePublication 387, (1968).
20. Thwaites, C. J., "Testing for Solderability", BritishWelding Journal, (1965), p. 43.
21. Latin, A., "Capillary Flow in the Soldering Process andSome Measurements of the Penetration Coefficientsof Soft Solders", Journal of the Institute ofMetals, 72, (1946), p. 265.
22. Eicks, J.D., Good, R. J., and Neumann, A.N.,"Thermodynamics of Contact Angles: II. RoughSolid Surfaces", Journal of Colloid and InterfaceScience, 53, No. 2, (1975), p. 235.
23. Wenzel, R. N., "Surface Roughness and Contact Angle",Ind. Eng. Chem., 28, (1936), p. 988.
24. Wenzel, R. N., J. Phys. Colloid Chem.,53, (1949),p. 1466.
25. Cassie, A.B.D. and Baxter, S., Trans Faraday Soc.,40, (1944), p. 546.
73.
26. Shuttleworth, R. and Bailey, G.L.J., "The Spreading ofa Liquid Over a Rough Surface", DiscussionsFaraday Society, 3, (1948), p. 16.
27. Takahashi, E. and Nagasawa, H., "A Study on Wetting bySolders by Surface Tension Methods", Transactionsof the Japan Welding Society, 10, No. 1,(1979), p. 1.
28. Feldstein, N. and Thomann, T.G., "Contact AngleMeasurements of Solder Onto Nickel Deposits",Plating and Surface Finishing, 1, (1979), p.50.
29. Harding, W.B. and Pressley, H.B., "Soldering to GoldPlating",Technical Proceedings of the FiftiethAnnual Convention of the American Electro-platers' Society, New Jersey, (1963), p. 90.
30. Bailey, G.L.J. and Watkins, H.C., "Surface Tensions inthe System Solid Copper-Molten Lead", Proc. Phys.Soc., 63, (1950), p. 350.
31. Flint, O. "Surface Tension of Liquid Metals", Journalof Nuclear Materials, 16, (1965), p. 233.
32. Howes, M.A.H., and Saperstein, Z.P., "The Reaction ofLead-Tin Solders with Copper Alloys", WeldingResearch Supplement, 2, (1969), p. 80-S.
33. Thwaites, C. J., "The Solderability of Some Tin, TinAlloy and Other Metallic Coatings", Transactionsof the Institute of Metal Finishing, 36,(1959), p. 203.
34. Ainsworth, P.A., "The Formation and Properties of SoftSoldered Joints", International Tin ResearchInstitute, 11, (1971), p. 374.
35. Brothers, E.W., "Intermetallic Compound Formation inSoft Solders", The Western Electric Engineer,Spring/Summer, (1981), p. 49.
36. Thwaites, C.J., "Some Aspects of Soldering GoldSurfaces", Electroplating and Metal Finishing,8, (1973), p.10.


